

Abstract

Coupled electromechanical waves define a heart’s function in health and diseases. Optical mapping of electrical waves using fluorescent labels offers mechanistic insights into cardiac conduction abnormalities. Dye-free/label-free mapping of mechanical waves presents an attractive non-invasive alternative. In this study, we developed a simultaneous widefield voltage and interferometric dye-free optical imaging methodology that was used as follows: (1) to validate dye-free optical mapping for quantification of cardiac wave properties in human iPSC-cardiomyocytes (CMs); (2) to demonstrate low-cost optical mapping of electromechanical waves in hiPSC-CMs using recent near-infrared (NIR) voltage sensors and orders of magnitude cheaper miniature industrial CMOS cameras; (3) to uncover previously underexplored frequency- and space-varying parameters of cardiac electromechanical waves in hiPSC-CMs. We find similarity in the frequency-dependent responses of electrical (NIR fluorescence-imaged) and mechanical (dye-free-imaged) waves, with the latter being more sensitive to faster rates and showing steeper restitution and earlier appearance of wavefront tortuosity. During regular pacing, the dye-free-imaged conduction velocity and electrical wave velocity are correlated; both modalities are sensitive to pharmacological uncoupling and dependent on gap-junctional protein (connexins) determinants of wave propagation. We uncover the strong frequency dependence of the electromechanical delay (EMD) locally and globally in hiPSC-CMs on a rigid substrate. The presented framework and results offer new means to track the functional responses of hiPSC-CMs inexpensively and non-invasively for counteracting heart disease and aiding cardiotoxicity testing and drug development.
Keywords: hiPSC-CMs, optical mapping, dye-free imaging, label-free imaging, electromechanical delay, near-infrared voltage sensors
Introduction
Electromechanical synchrony is critical for cardiac function, and mapping both electrical and mechanical waves is of clinical significance for countering life-threatening arrhythmias. Under normal conditions, cardiomyocytes exhibit tight coupling between the electrical trigger (voltage), the calcium-induced calcium release, and the mechanical contraction, known as excitation–contraction coupling (ECC).1 In multicellular cardiac networks, electrical signals travel as fast synchronized waves. Due to the tight ECC, these voltage waves are closely followed by calcium waves; in fact, calcium waves are often used as a surrogate for the cardiac excitation due to better optical sensors for calcium. At the level of each cell, a mechanical contraction ensues following the electrical trigger and the beginning of the calcium transient. Therefore, mechanical waves, driven by the local EC coupling, spread over space similarly to the excitation waves. Macroscopically, the dynamics of this tri-wave system (voltage, calcium, and contraction) is dictated by the fast-diffusing voltage waves. However, locally, the much slower diffusing calcium can exhibit uncoupled behavior with no correspondence to the global activation, e.g., microscopic local calcium waves can be confined to individual cells and can coexist with the global activation.2 The calcium–voltage dynamics on a global (wave) scale can be quite complex due to inherent feedback loops between calcium and voltage.3 Similarly, the spread of mechanical activity as a wave of contraction can show significant deviations from the excitation wave—it can precede it (mechano-electrical event), or it can deviate in speed and in morphology from the excitation event due to mechanical loading conditions and the level of mechanical coupling between the cells, which involve nonlocal elastic interactions.4,5 Because of feedback mechanisms (e.g., mechanosensitive ion channels), significant deviations in the patterns of mechanical contraction waves can, in turn, further influence the stability of the excitation waves.
Cardiac cell culture systems represent a reductionist approach to dissecting wave dynamics properties. Early macroscopic optical mapping using calcium- and voltage-sensitive fluorescent dyes in such two-dimensional systems confirmed the existence of reentrant waves in culture, with fundamental properties resembling those seen in the whole heart.6−9 With the emergence of human stem cell-derived cardiomyocytes, especially induced pluripotent stem cell-derived cardiomyocytes (iPSC-CMs), such models became of interest10−12 as preclinical tools in drug development and as means toward personalized medicine.
In addition to optical mapping of excitation, optical contraction measurements by variants of frame differencing have been used under different names, reflecting conceptually similar approaches: video tracking, digital cross-correlation, digital image correlation, or “optical flow” on the surface of a whole heart13−15 or in monolayers of cardiomyocytes,16−18 including applications to human iPSC-CMs.19−22 These methods, applied at the microscale (typically smaller than 1 mm2 field of view), have been used to track uniaxial strains16,18 or biaxial strain fields.13,17 In some variants, spectral domain methods have been applied to track periodic endogenous structures, such as sarcomeres, or to track the deformation of imposed light interference patterns (Moire fringes).23,24 Such systems, developed to analyze the functional responses of human iPSC-CMs in drug testing, have the ability for sequential or simultaneous triple measurements (voltage, calcium, and contraction), sometimes also combined with optogenetic pacing.25−27
However, dye-free/label-free macroscopic optical mapping of contraction waves (large field of view) has been demonstrated only in a few studies in cultured cells. For example, Hwang et al.28 used on-axis white light transillumination with a pinhole to demonstrate the first dye-free tracking of complex cardiac contraction waves in cultured cardiomyocytes. In a similar setup, termed as “propagation-induced phase contrast imaging”, Rother et al.29 quantified contraction waves in cardiomyocyte–fibroblast co-cultures. Burton et al. used oblique transillumination with a semicoherent light source for dye-free imaging of cardiac waves while applying optogenetic control patterns30 and for studying neurocardiac effects on wave dynamics.31
A versatile yet simple methodology for simultaneous tracking of electrical and mechanical waves in cardiac cells and tissues is of great interest. Developing such a system for human iPSC-cardiomyocytes is the objective of the current study. In a simplified setting, it can provide fundamental understanding about the interaction of these coexisting dynamical systems and the conditions under which their interaction may be destabilizing and pro-arrhythmic. Obtaining comprehensive multiparametric assessment in human iPSC-CMs can lead to better experimental preclinical models for drug development and personalized medicine.10 Such knowledge can also improve in silico electromechanical models, which have been developed over the years32−35 but not extensively validated. Dissecting such wave interactions can inform translational imaging of electromechanical waves in the heart for non-invasive arrhythmia mapping in the clinic.36−38
Results
In this study, we set out to develop means for the simultaneous tracking of electrical and mechanical waves in a simplified system of heart tissue—an isotropic syncytium of human iPSC-cardiomyocytes attached to a hard substrate. A reduced experimental cardiac model offers a well-controlled starting point to quantify the properties of these coexisting waves before adding aspects of the complexities of mechanical loading in the real heart.
Simultaneous Dual Macroscopic Imaging System for Electromechanical Waves
The simultaneous dual macroscopic imaging system presented here (Figure 1) uses oblique transillumination to simultaneously map voltage (by fluorescence) and mechanical waves (by dye-free signal) in human iPSC-CMs at the macroscale (large field of view, FOV). The oblique-light dye-free tracking of waves without dyes is based on an interferometric technique described in our previous work;30 it is believed that the captured signal is related to local changes in the optical path length as the cells contract. Because of the attachment to fibronectin-coated glass, the cell movements are localized microcontractions. In this study, two low-cost (<$500) miniature machine-vision CMOS cameras were used to simultaneously track the electrical and mechanical waves in cardiac monolayers (see Supplemental Video 1 in the Supporting Information) by fast optical mapping at high spatial resolution. Here, we show that they are sensitive enough to yield comparable performance to state-of-the-art scientific sCMOS, e.g., Photometrics 95B, in optical recordings of voltage and calcium (by fluorescence) and of contraction (dye-free) in human iPSC-CMs at the microscale (Figures S1 and S2) and at the macroscale. Synchronized acquisition of the two cameras was controlled from the same trigger sequence by a function generator. Light sources with relatively long temporal coherence length (∼20 μm; comparable to cell size) were used. In our implementation, this was either a laser diode or a 660 nm LED. Oblique transillumination helped capture the scattering interference patterns (by the dye-free camera) with a minimal incident beam background (similar to dark-field imaging), which has little effect on the fluorescence-based voltage mapping.
Figure 1.
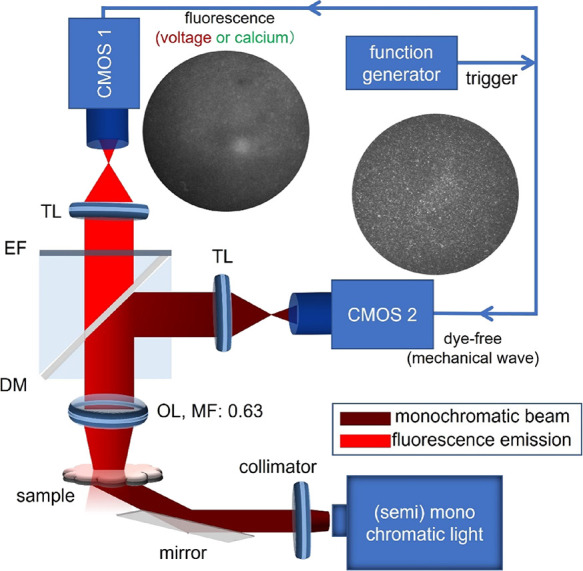
Schematic diagram of the simultaneous voltage and dye-free macroscopic imaging system using oblique transillumination with two low-cost Basler CMOS cameras synchronized by a trigger. A laser or a 660 nm LED was used for oblique illumination at 30°. At 0.315× magnification, the FOV was about 16 × 12 mm2 (confined to a circular region by an iris or cropping). CMOS: CMOS camera; DM: dichroic mirror; TL: tube lens; EF: emission filter; MF: magnification factor; OL: objective lens. Example fluorescence and dye-free images are shown.
The electrical waves were mapped with a high-performance NIR voltage-sensitive dye Berst1,39 which we have used before for optical mapping in iPSC-CMs.27 The emitted fluorescence and the dye-free signal were imaged by a low-NA objective (NA: 0.15) and split to the corresponding cameras by a dichroic mirror. With an additional demagnification, the voltage and dye-free cameras shared the FOV with a slight difference(Figure S3A,B). Co-registration of the two cameras was done by feature-extracted match of a pattern (see Figure S3A,B and Supplemental Methods) to guarantee precise comparison of the two imaging modalities. The spatial resolution of the two imaging modalities was quantified as 30.1 μm by measuring the full width at half maximum of the line spread function of high-resolution printed letters (Figure S3C), which is comparable to the size of a single iPSC-cardiomyocyte (20–70 μm in each dimension). The two imaging modalities hold the same imaging resolution due to shared optical path.
Initiation of Electromechanical Waves in Human iPSC-CMs, Data Processing, Validation of the Dye-Free Mapping, and Extensibility
Cardiac arrhythmias manifest as electromechanical waves that are self-driven and follow complex paths and dynamics. To reduce complexity and to uncover general guiding principles for cardiac conduction, experimental models of the heart, including human iPSC-CMs, often resort to studies that explore the restitution properties of the system, i.e., responses to different pacing rates in controlled conditions. Similarly, here, we analyzed spontaneous and controlled paced activity to begin to understand the basics of electromechanical wave dynamics. Pacing was done electrically using a bipolar point electrode; the response to a range of pacing frequencies was quantified for each sample in addition to spontaneous waves. In our microscopic scale validation experiments (see Figures S1 and S2) as well as in a companion paper,40 we used optogenetic pacing, coupled with optical mapping of voltage, calcium, and/or contraction, for all-optical interrogation of cardiac electromechanics, inspired by previous studies.27,30,41
The mapping data for the electrical and mechanical waves, captured by the two cameras, were processed using empirically optimized methods to extract a multitude of parameters and metrics (Figure S4). The signal-to-noise ratio (SNR) was improved by taking advantage of the periodic nature of mapped activity in this study and using a period-shift enhancement (PSE) as described in Methods. Because of the slower upstroke rate of cardiac motion (in contrast to the sharper depolarization in the action potential), the automatic detection of the motion start point presents a challenge. Our solution to overcome the noise in the dye-free signal and to boost event detection was to use a time-difference (TD) filter (Figures S4 and S5), as done previously.30 The signal enhancement of the dye-free traces by the TD filter can be appreciated in the microscopic records in Figure S2. For quantification of local parameters and relative characteristics of the electromechanical waves, instead of the TD boost, we used the original dye-free signal and an alternative SNR improvement—activation-based spatial segmentation (see a branch in the signal processing pipeline in Figure S4). This helped obtain reliable action potential duration (APD), dye-free signal duration (DFD), relaxation–contraction ratio, and importantly, apparent electromechanical delay (aEMD). After spatial and temporal filtering and event detection (determination of local activation time), conduction could be visualized by activation maps and quantified by conduction velocity (CV) measurements and wavefront tortuosity (WT) index measurements (Figure S4).
To validate the dye-free mapping of cardiac waves in our system, we first used label-free samples of hiPSC-CMs to record the optical signal under different pacing conditions, as shown in Figure 2A. The expected wave origin at the pacing site and slowing of conduction velocity with increased pacing frequency are illustrated using activation maps derived from the dye-free signal. Furthermore, even though the rest of this study was conducted using dual voltage–dye-free mapping in controlled paced conditions, in Figure 2B, we demonstrated that the dye-free imaging is extendable to calcium–contraction dual optical mapping. This was done using a model of anatomical reentry—a nonpaced self-sustained activation around a non-excitable obstacle/annulus (in this case, removed portion of the cell layer). See Methods and the companion paper40 for details on the changes needed to accommodate calcium imaging.
Figure 2.
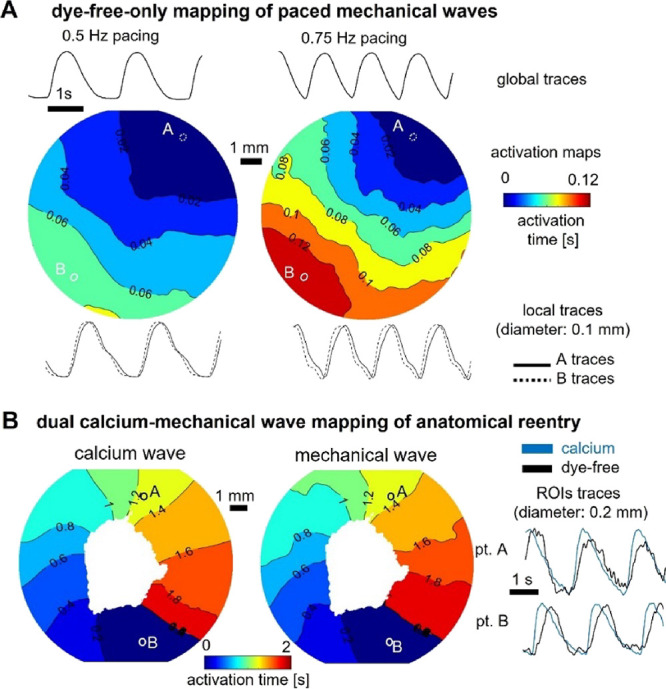
Dye-free only optical mapping and simultaneous calcium–dye-free widefield imaging of reentrant waves. (A) Optical mapping of paced mechanical waves in unlabeled hiPSC-CMs using oblique illumination and dye-free imaging: activation maps and global and local traces shown. (B) Simultaneous optical mapping of calcium waves and mechanical waves using the system in Figure 1 with appropriate light sources and filters; samples labeled with Rhod-4 calcium-sensitive dye. The anatomical reentrant wave was induced by removing cells from the center of the dish to create an obstacle and applying rapid pacing until a sustained self-propagating reentrant wave was observed.
Similarities and Differences of Electrical and Mechanical Waves in Human iPSC-CMs
Key parameters were quantified for the electrical and mechanical waves globally and locally under different pacing conditions. The global traces, over a large FOV (Figure 3A), are akin to clinical ECG or global ultrasound-detectable contraction waves and help confirm the 1:1 response to pacing. Local traces help map activation patterns in detail and visualize the waves. Figure 3B illustrates that both electrical and mechanical waves exhibit CV restitution, i.e., wave slowing with the increase in frequency. The mechanical waves in human iPSC-CMs are substantially more sensitive to progressively increasing pacing rates, with abnormalities in conduction and slower regions appearing earlier than in the voltage-based maps. Furthermore, the spatial patterns of wavebreaks appearing first in the mechanical maps may be predictive of the location of electrical wavebreaks at a higher frequency point, as seen in Figure 3B. These are important observations for early detection of arrhythmias clinically because three-dimensional high-resolution mechanical mapping is easier to obtain non-invasively compared to obtaining unambiguous high-resolution electrical mapping.38,42 Dye-free imaging may also be a suitable highly sensitive tool for arrhythmia detection in human iPSC-CMs in scalable cardiotoxicity testing platforms.30,43
Figure 3.

Comparison of activation maps from simultaneous widefield-imaged voltage and dye-free signals in hiPSC-CMs under different stimulation frequencies. (A) Normalized global (averaged over the FOV) action potentials imaged by the NIR voltage-sensitive dye BeRST1 (red) and dye-free (DF) signals—original and TD-boosted (black) under 0.5, 0.75, and 1 Hz pacing. Shown at the bottom are the respective detected activation times (marked) by a TD filter. (B) Macroscopic NIR fluorescence (top) and dye-free (bottom) images of the hiPSC-CM samples in the same FOV (left). Small triangles indicate the centers of the matched regions of interest (ROIs, 70 μm × 70 μm each) for the local trace plots. Shown on the right are voltage (top) and dye-free (bottom) activation maps along with the extracted local traces at the indicated triangle points under 0.5, 0.75, and 1 Hz pacing from a point in the upper right corner. Isochrones are 0.05 s apart. All measurements were done at room temperature.
A detailed quantitative analysis of electromechanical wave properties (Figure 4) offers further insights related to wave dynamics and emergence of instabilities. The mechanical DFD exhibits a much wider range of durations and steeper restitution compared to the APD (Figure 4A).
Figure 4.

Quantification of basic parameters of electromechanical waves in hiPSC-CMs by simultaneous widefield voltage and dye-free optical mapping. (A) Restitution (frequency response) of action potential and dye-free signal duration (APD and DFD) for all samples; voltage in red (slope: −0.26; R2: 0.45) and dye-free in black (slope: −1.48; R2: 0.7). The inset shows that for voltage, the measurement was at 80% level, i.e., APD80, and for the original dye-free signals, the transient duration measurement was between the start of contraction and the end of the relaxation. (B) Frequency response of the relaxation–contraction (R–C) ratio (see the inset) for all samples based on dye-free signals (slope: −1.24; R2: 0.33). (C) Electromechanical signal duration ratio, i.e., APD-DFD ratio, as a function of pacing frequency (slope: 0.44; R2: 0.52). (D) Conduction velocity (CV) restitution (voltage and dye-free slopes: −5.24 and −4.78 and R2: 0.25 and 0.28, respectively). (E) Wavefront morphology: voltage and dye-free wavefront segmentation from an activation map (obtained at 0.5 Hz pacing) using frames that are 0.15 s apart. Close-up insets showing the local dye-free velocity vectors; green arrows indicate the wavefront. (F) Wavefront tortuosity (WT) index (for details, see Methods) quantified for voltage and dye-free waves for all samples as a function of the pacing frequency (dye-free slope: 22.77; R2: 0.25). All measurements were at room temperature. Data are presented as scatter plots (mean values per sample) with overlaid mean ± S.E. (n = 6 samples). Regression was statistically significant (two-way ANOVA test, p < 0.05). The WT index for voltage did not have a significant dependence on frequency.
This rate adaptation in the mechanical signal comes primarily from the change in the relaxation phase, not the contraction phase (Figure 4B and Figure S6). Overall, APD/DFD ratios steadily increase with frequency, approaching a ratio of 1 (Figure 4C). From our results, it appears that DFD changes, obtainable via dye-free optical mapping, may be useful as a metric to capture restitution responses locally. As suggested in Figure 3 and quantified in Figure 4D–F, both electrical and mechanical waves exhibit CV restitution, yet they dramatically differ in the effects of rate on wavefront morphology and stability. We introduce a wavefront tortuosity index (WT index) to quantify the significantly higher proneness of mechanical waves to wavebreaks and local instabilities (Figure 4E,F) compared to voltage-based conduction. The higher tortuosity of the mechanical wavefront reflects variation in cellular excitation–contraction coupling or variation in the mechanical resistances of adjacent cells after contraction is initiated (mechanical coupling) or both. The effect of any coupling heterogeneity will naturally slow down the mechanical wave and will disturb the wavefront. To some degree, the difference in the WT index reveals the difference in the local electrical coupling efficiency for voltage wave propagation vs the local mechanical coupling efficiency (associated with cellular excitation–contraction coupling and mechanical resistance) for mechanical wave propagation. A larger WT index for the mechanical waves represents lower coupling efficiency, further exacerbated by stressors like faster pacing rates. The wavefront stability and the local CV can be vastly different between the two mapping modalities (Figure 4F and Figure S7). Overall, despite similarities in the global wave properties between electrical and mechanical waves, the mechanical wave dynamics exhibits higher local complexity and level of instabilities compared to electrical waves over space and time.
Correlation of Electrical and Mechanical Wave Properties to the Gap Junctional Protein Cx43 and Response to Pharmacological Uncoupling
Because of strong excitation–contraction coupling in cardiomyocytes, the global CV for the electrical waves is closely correlated with the global CV for the mechanical waves (see Figure 5A, summarizing the data from Figure 4D). Thus, global CV obtained from dye-free wave mapping under regular periodic activity can likely be used as a surrogate of the global CV of the electrical wave. This does not hold true for the local CV—mechanical waves exhibit much higher local heterogeneity in conduction compared to electrical waves (Figure 4E,F). The transient durations—DFD and APD—exhibit a lower degree of correlation to each other compared to the electromechanical wave CVs (Figure 5B). DFD is much more sensitive to restitution, and the strongest frequency-dependent adaptation happens via shortening of the mechanical relaxation phase and the DFD. The least correlated parameter between the two waves is the WT index in response to pacing frequency—while the mechanical wavefront is acutely influenced by the pacing stressor, the electrical wavefront remains stable (Figure 5C). The key determinant of the global electrical wave conduction velocity is the electrical coupling through dedicated gap junctional channels. In ventricular cardiomyocytes, including human iPSC-CMs, the dominant gap junctional protein is Connexin 43 (Cx43). We sought to pharmacologically inhibit gap junctional coupling with heptanol (0.5 mM for 30 min) and quantify its effect on both waves. In the example in Figure 5D,E (n = 3), the gap junctional inhibition resulted in average reduction in CV for the voltage waves of 28.3 and 30.3% reduction in CV for the dye-free waves, with a slight nonspecific shortening in APD (<5% in the local traces) and large spread in DFD. The most dramatic effects of heptanol were on the aEMD. The average local aEMD was increased by about 11%, and the increase in the global aEMD was approximately 35.2%. Therefore, gap junctional defects or exogenous uncouplers may lead to arrhythmias not only through pro-arrhythmic slowing of electrical wave CV but also through uncoupling of the electrical and mechanical waves.
Figure 5.

Correlation of electrical and mechanical conduction properties, detection of pharmacologically inhibited conduction by voltage and dye-free imaging, and correlation of electromechanical conduction to gap junctional (Cx43) protein levels. (A–C) Correlation of electromechanical properties for individual samples (n = 6): (A) Voltage–dye-free correlation of CV across pacing frequencies. Linear regression was applied for data fitting (slope: 0.83; R2: 0.94). (B) Voltage–dye-free correlation of transient duration DFD vs APD across pacing frequencies; linear regression line (slope: 3.09; R2: 0.46). (C) Voltage–dye-free correlation of the WT index across pacing frequencies. (D, E) Pharmacological inhibition of conduction by cell uncoupler heptanol and the response seen by voltage and dye-free optical mapping (n = 3). (D) Voltage and dye-free activation maps predrug and after 30 min of 0.5 mM heptanol application; pacing frequency was 0.75 Hz; left: global voltage and dye-free signals. (E) Parameter comparison from the dual imaging predrug and after heptanol application. Both modalities sense cell uncoupling in a similar way; electromechanical delay is increased by cell uncoupling, most pronounced as a prolongation of the global aEMD. (F–H) Correlation of electromechanical conduction to Cx43 protein levels (n = 5) (two of the samples are from the same set as in Figure 4, and three of them are additional samples). Panel (F) presents a pipeline for correlating functional properties to Cx43 protein by western blot. After functional optical measurements, protein was extracted, and western blot was done by the automated capillary electrophoresis Wes system, keeping track of the sample identity. Panel (G) shows the Wes-generated digital lanes (obtained from electropherograms) for Cx43 and a housekeeping protein GAPDH, along with the quantified ratios for the samples from several runs/technical replicates. Negative and positive controls for Cx43 were lysates from WT HeLa cells and from human female heart ventricular tissue. Shown underneath are voltage and dye-free activation maps for samples 3 and 5. Panel (H) shows individual sample correlation of voltage (red) and dye-free (black) CV to the Cx43/GAPDH ratios. Linear regression lines for voltage had a slope of 24.52 and R2 = 0.97, and those for the dye-free signal had a slope of 18.82 and R2 = 0.97. Biorender was used for parts of the figure.
We developed a pipeline to link functional wave properties and gap junctional protein quantity in the same samples, as shown in Figure 5F. Five samples were imaged optically using the simultaneous dual macroscopic imaging system, then cells were lysed, and the protein was extracted and quantified using capillary-based electrophoresis (Wes by ProteinSimple). The normalized Cx43/GAPDH protein values in the human iPSC-CM samples were lower than those extracted from the adult human female ventricle but substantially higher than those in negative control HeLa cells (Figure 5G). With natural variation of Cx43 in the samples, we saw a high degree of linear correlation to both electrical and mechanical wave CVs (Figure 5H), confirming its critical role in conduction. The strong dependence of CV on Cx43 protein was surprising and exceeding the theoretically expected effect from pure Cx43 perturbation—the 26% drop in Cx43 protein led to over 50% drop in CV for the electrical and mechanical waves. Variability in the small number of samples used and likely other parameters in the culture may have contributed to these findings, which need to be confirmed in a larger study. Nevertheless, the approach illustrates how the developed platform can be used for correlative studies to reveal molecular underpinnings of functional properties.
Spatial Patterns of the Electromechanical Delay in Human iPSC-CMs
Quantifying local aEMD distribution over space can help further understand the interplay of the electrical and mechanical waves during pacing. aEMD was defined by the time lag between the onset of electrical activation (action potential depolarization) and the onset of mechanical activation (dye-free contraction). As indicated in Figure S4, we applied spatial segmentation based on activation patterns to boost SNR and have reliable parameter estimation, including local aEMD, along the wave path (Figure 6A). Segment-based action potential and dye-free mechanical traces were extracted to calculate the local aEMD. Global aEMD was simply obtained based on the space-integrated voltage and dye-free traces across the FOV. The local aEMD was shorter at the edges (at the stimulus site and the distal edge site) and higher in the middle of the samples across all pacing frequencies (Figure 6B). There was a strong frequency-driven increase in the aEMD both for the local (Figure 6C) and global aEMD values (Figure 6D). Paced aEMD was longer than aEMD obtained from spontaneous waves, which also had a single origin site (Figure 6C,D and Figures S8 and S9), consistent with data from global aEMD measurements in humans during sinus rhythm (shorter EMDs) vs ventricular pacing (longer EMDs).44 The mechanical loading conditions in our simplified model were specific for classic cell culture—cells were firmly attached to a rigid noncompliant substrate (through extracellular matrix coating) and the edges of the dish presenting softer, more compliant attachment points due to cell growth. The shorter aEMDs at the stimulus site can be explained with better capture and synchronization, while the shorter distal aEMDs are likely due to dish-edge constraints (lower stiffness). To illustrate this point, we quantified the contraction amplitude (based on the measured dye-free signal) at the pacing site, at the center, and at the distal end (Figure S10). Indeed, the contraction amplitude at the edges (pacing and distal site) is larger compared to the center. The heterogeneity in the local aEMD is not surprising and is also seen in the wavefront itself (Figures 3 and 4). Higher frequencies exacerbate these spatial heterogeneities. These observations are consistent with previous modeling and experimental studies in whole hearts.42,45 The consequences of the spatial variation of the aEMD and aEMD restitution are that conduction can be impacted in complex ways due to the interaction between the two waves; longer aEMDs can further disturb wavefront dynamics. The responses are dominated by the ECC (the mechanical wave tracks the electrical wave) but modulated by the local mechanical loading and mechanical coupling. A closer look at the local aEMD in spontaneous vs paced activity revealed interesting dependences (Figures S8 and S9). Samples for which the spontaneous activity site had a characteristic pacemaking-like AP, with a hyperpolarization phase (Figure S9), showed lower spatial APD variations and lower global aEMD compared to sites with more ventricular-like AP with a characteristic APD “hump” (like in early after-depolarization, EAD) at the origin site. These EAD-driven wave sequences exhibited higher APD spatial dispersion (longer APD at the origin vs distal site) and longer global aEMD (Figures S8 and S9), consistent with clinical reports on abnormal beats, such as premature ventricular contractions, in humans.46 Our human iPSC-CMs comprise a purified ventricular-like cell population. However, it is possible that persistent pacemaker sites may develop properties similar to sinus node drivers, which among other things, may work toward reducing the overall aEMD by establishing preferred paths of excitation. The two groups were otherwise similar in terms of their global conduction velocity.
Figure 6.

Apparent electromechanical delay (aEMD) distribution over space and pacing frequency. (A) Space segmentation guided by voltage wave propagation. Shown from top to bottom: voltage activation maps, segmentation images, and local voltage action potentials (red) and dye-free original traces (black) extracted from each segment under 0.5, 0.75, and 1 Hz pacing. (B) Local aEMD distribution over space (over the 11 segments from the pacing to the distal site) under each pacing frequency. The inset shows that aEMD was defined by the time lag between the onset of voltage action potential and the onset of dye-free contraction. (C) Local aEMD as a function of pacing or spontaneous frequency (slope for pacing data: 0.19; R2: 0.76); shown are averaged values for the 11 segments across all samples. (D) Global aEMD as a function of pacing or under spontaneous frequency (slope for pacing data: 0.26; R2: 0.41). Plotted data are presented with overlaid mean ± S.E.; n = 6 for pacing data and n = 5 for spontaneous data (one sample did not show spontaneous activity). The averaged spontaneous frequency is 0.17 ± 0.03 Hz. The pacing site was consistently at the coverslip edge for all samples. Regression was statistically significant for the local aEMD (linearity test, p < 0.0001) and global aEMD (linearity test, p < 0.01) dependence on frequency.
Discussion and Conclusions
Parameters linking excitation and contraction in the heart are clinically important for assessing cardiac function and risk for adverse events. This study reports on the development and validation of a system for simultaneous macroscopic optical mapping of excitation and contraction waves in human iPSC-CMs, leveraging oblique transillumination (Figure 1). This was done with a low-cost setup, taking advantage of a method for dye-free monitoring of macroscopic contraction waves,30 recent CMOS camera developments,40,47 high-performance NIR voltage-sensing probes,27,39 and some SNR-improving processing steps. After validating the dye-free wave mapping in our setup and showing its versatility (Figure 2), we characterized the properties of the observed electromechanical waves in iPSC-CM layers attached to a rigid substrate under spontaneous and pacing conditions (Figures 3–) when the correspondence between two wave dynamics is relatively high. Even in this reductionist experimental model, interesting decoupling between the excitation waves and the mechanical waves was observed as the system was “stressed” by progressively faster pacing rates. Electrical waves were more robust in their adaptation (restitution) responses, while the mechanical waves underwent major restitution-based shortening of the relaxation phase and displayed a significant increase in local wavebreaks. The resulting more “tortuous” wavefronts for the mechanical waves are hallmarks of unstable pro-arrhythmic behavior, while the intact electrical waves continued to exert smoothing stabilizing action up to a point. It appeared that the areas of pronounced wavebreaks (in the contraction waves) eventually turned into areas of wavefront distortion in the excitation waves at higher pacing frequencies (Figures 3 and 4). These interesting observations suggest the utility of monitoring contraction waves as means for early detection of potential future wavebreaks and arrhythmia loci.
In general, dye-free optical mapping of cardiac waves in vitro is appealing as a non-invasive alternative to optical mapping with fluorescent dyes or optogenetic sensors, especially for longitudinal chronic studies using human iPSC-CMs. It is scalable, as illustrated recently for imaging of multiple samples.48 A combination with optogenetic actuation is seamless because of the flexibility with wavelength of light used, avoiding potential interferences as seen in all-optical electrophysiology. For maturation studies, chronic treatment, and monitoring of the long-term effects of therapeutic agents, this technique can provide a surrogate view of responses, which are often closely related to the classic measures of electrical activity, as seen in Figure 4. Molecular correlates of cardiac wave dynamics can also be studied this way (Figure 6), as the dye-free wave mapping does not add new fluorescent emitters to the samples. There is a dearth of studies that offer direct links between molecular correlates and advanced cardiac responses within the same samples,17,49−51 and dye-free imaging followed by gene expression (using qPCR or RNAseq) or protein quantification can fill that gap. Previously, gap junctional conductance in cardiomyocyte pairs has been shown to be linearly related to immunofluorescence-quantified gap junctional areas (when these areas are not too large),49 while CV is proportional to the square root of gap junctional conductance,52,53 with stronger influences in less coupled cardiac cells/tissues. No previous studies have attempted to link electrical and mechanical wave velocity to Cx43 protein content in human cardiac tissue and/or hiPSC-CMs. The significant relationships seen in this study were surprising if purely based on gap junctional coupling. Using the described pipeline (Figure 5), future studies will expand the sample size and conditions of plating to further dissect this relationship.
In the clinic, the state-of-the-art non-invasive technique for imaging cardiac arrhythmias is the high-density body surface electrocardiographic imaging (ECGI).54 However, there have been developments toward using fast ultrasound imaging to reconstruct the spatial patterns of myocardial contraction waves as a non-invasive 3D alternative of the ECGI-generated surface excitation waves. Electromechanical wave imaging is such a quantitative echocardiography-based technique.36,37 Recent advanced electromechanical mapping using motion tracking with ultrasound imaging also provided insightful baseline comparison with optical mapping in whole hearts.15,38,55 Leveraging machine learning techniques, computational modeling, and data assimilation, efforts are underway toward the goal of reconstructing the electrical wave patterns in 3D space over time from 4D contraction wave imaging.56 Such efforts promise a non-invasive clinically relevant detailed view of cardiac arrhythmias using 4D ultrasound-based imaging. Our work on simultaneous imaging in simple systems can help validate and refine electromechanical models to be able to perform such reconstructions. Furthermore, direct testing of model-generated predictions, related to fundamental relationships between the electrical and mechanical waves, is feasible in our simplified experimental model. Because of the ability to introduce controlled alterations to the substrate, such as cell anisotropy,17 compliant growth surface, and a variety of deliberately created patterns of stimulation over space and time (especially with optogenetic actuation30), comprehensive data sets can be generated linking the tri-wave dynamics for machine learning algorithms and improved model generation.
An example of a clinically utilized parameter linking electrical and mechanical waves is the electromechanical delay (EMD). At the cellular level, EMD reflects the ECC events, i.e., the timing from the membrane depolarization to the release of calcium from the sarcoplasmic reticulum and the engagement of the myofilaments to initiate contraction; EMD is also influenced by the mechanical loading conditions and by the specific activation sequence.44 It has been suggested that shorter EMDs reflect stronger mechanical coupling5 and better synchronized contractions, and for the patient, this may mean better stroke volume and cardiac output.57
Longer EMDs distinguish abnormal beats—they are characteristic for EADs, a known mechanism for the emergence of premature ventricular contractions, compared to regular sinus rhythm beats.46 Furthermore, it has been observed that single-site ventricular pacing increases EMD heterogeneity and worsens ventricular pump performance; it may therefore present a path toward the development of heart failure.58 EMD is typically prolonged in patients with heart failure57 and is often considered as a biomarker for seeking cardiac resynchronization therapy; lead localization for cardiac resynchronization therapy can be optimized based on predicted EMDs.59
Clinically, EMD is assessed by differencing global parameters—the QRS timing from the ECG vs the timing obtained from left-ventricular pressure wave records (for example, through acoustic cardiography) or by tracking myocardial deformation (using tagged MRI). Spatial maps of EMD are nontrivial to obtain yet valuable considering the dependence of EMD on activation sequences. Earlier low-resolution dual mapping in canines has yielded some insights about the spatial heterogeneity of EMD.58 Recently, a combination of ECGI and cardiovascular magnetic resonance was applied to spatially map EMD60 in patients to quantify the performance of cardiac resynchronization therapy. For a finer look into spatial EMD patterns, computational modeling has been deployed.44,45,61,62
Our dual mapping approach provides new means to dissect such key parameters in a simplified, well-controlled setting. For example, our culture system seems capable of distinguishing “regular” spontaneous pacing sites from sporadic, EAD-driven ones (Figures S8 and S9) based on their different aEADs, as seen clinically.46 While we work with purified ventricular myocytes, persistent pacemaking sites may still establish preferred activation sequences, minimizing EMD when waves travel along those paths. Furthermore, faster pacing rates in our system seem to increase local and global aEMD (Figure 6), as seen in canine in vivo models, when global EMD was reported.63
Yet, another parameter linking excitation and contraction, which has been useful in predicting the cardiotoxicity of drugs, is the electromechanical window (EMW), defined as the difference between the duration of the mechanical event (contraction transient or left-ventricular pressure event) and the duration of the electrical trigger (APD or QT-interval). Drugs or events that lead to shorter EMWs, or to negative EMW, can be pro-arrhythmic. Clinically, EMW, based on the global ECG and left-ventricular pressure wave measurements, has been used to predict arrhythmia risk in long-QT patients64 and there is an ongoing clinical trial that started in 2020 (NCT04328376) based on this metric. Furthermore, experimental work in canines65 has demonstrated that drugs that shorten the EMW may have higher risk for arrhythmia induction, specifically risk for Torsade de Pointes. Computational work (using calcium as a surrogate for mechanical contraction) has corroborated that shortening of EMW can be useful in cardiotoxicity prediction in drug testing. In our study, the increase in APD/DFD ratio (Figure 4C) reflects a decrease in EMW in a more direct way. Therefore, simultaneous mapping of electromechanical waves, as demonstrated here, may inform cardiac safety studies with human iPSC-CMs, beyond the typically used APD prolongation as a biomarker.
In conclusion, dual mapping of electromechanical waves in human iPSC-CMs can be a useful non-invasive tool for chronic studies, can offer valuable insights about the complex dynamics between these two systems, can generate comprehensive data sets for validation and improvement of cardiac electromechanical models, and can offer guidance for clinical imaging, interpretation, and interventions in the treatment of cardiac arrhythmias.
Methods
Cardiomyocyte Cell Culture
In these experiments, we used human iPSC-CMs, iCell2 (iCell Cardiomyocytes2 (cat. C1016, donor 01434) from Fujifilm/Cellular Dynamics International, Madison, WI). The cells were cultured on fibronectin-coated (50 μg/mL) 35 mm dishes with a 14 mm glass-bottom insert (Cellvis) at 270,000 cells per dish. Samples were grown in a humidified incubator at 37 °C and 5% CO2 as per the manufacturer’s instructions. In some samples, the optogenetic actuator, Channelrhodopsin2 (ChR2), was expressed using adenoviral transduction with Ad-CMV-hChR2(H134R)-eYFP (Vector Biolabs) at multiplicity of infection (MOI 50) for 2 days prior to experiments.
Experimental Sample Preparation and Protein Quantification
The iPSC-CM samples were studied on day 7 after plating in Tyrode’s solution (NaCl, 135 mM; MgCl2, 1 mM; KCl, 5.4 mM; CaCl2, 1.8 mM; NaH2PO4, 0.33 mM; glucose, 5.1 mM; HEPES, 5 mM; adjusted to pH 7.4 with NaOH) at room temperature. For macroscopic mapping, samples were labeled with the near-infrared Vm dye BeRST1,39 courtesy of Evan W. Miller (UC Berkeley), at 1 μM concentration for 20 min. For some microscopic experiments, dual-labeled samples were used with spectrally compatible fluorescent indicators for membrane voltage Vm and intracellular calcium [Ca2+]i in Tyrode’s solution, as described previously.27 The [Ca2+]i indicator Rhod-4AM (AAT Bioquest) was used at 10 μM concentration for 20 min, followed by a wash and the application of the near-infrared Vm dye BeRST1 at 1 μM for 20 min. After a final wash, samples were imaged. Electrical stimulation was done by a bipolar platinum electrode, with 2 ms pulses at 5 V, connected to a MyoPacer stimulator (IonOptix). Each of the presented here samples was subjected to at least three stimulation frequencies, i.e., 0.5, 0.75, and 1 Hz.
In some experiments, the uncoupling agent 1-heptanol (Sigma-Aldrich) was applied in Tyrode’s solution at 0.5 mM for 30 min prior to recordings; this concentration was chosen to be <EC50 for cardiomyocytes66 to avoid nonspecific effects.
Protein Quantification by Automated Western Blot (Wes)
After completion of the optical mapping experiments, some samples were lysed for total protein extraction using the Qproteome Mammalian Protein Prep Kit (Qiagen). Western blot was done using the capillary electrophoresis-based system Wes (ProteinSimple) according to the manufacturer’s instructions. The ab11370 (Abcam) primary antibody was used in 1:25 dilution for Connexin 43 quantification, and the ab181602 (Abcam) antibody was used in 1:2000 dilution for GAPDH quantification. Detailed methods have been published.67 Correlative analysis was possible as the functional measures (conduction velocity), and the normalized protein (Cx43/GAPDH) was obtained in the same samples.
For the western blot quantification, we used Cx43 cell lysates as a positive control, extracted from flash-frozen adult human left ventricular tissue (Amsbio), processed as described previously. As a negative control, we used HeLa cell lysates (ProteinSimple).
Design of a Dual Optical Mapping System for Electromechanical Waves in iPSC-CMs
The customized simultaneous dual macroscopic imaging system (Figure 1) was built using two independent CMOS cameras (Basler_acA720-520um, Basler) with 540 × 720 sensor size. The imaging magnification factor of the two cameras is equivalently obtained as 0.315× by a 0.15 NA objective lens (MV PLAPO 1X, Olympus) and a tube lens (LA1951, Thorlabs), resulting in a 16 × 12 mm2 field of view (FOV) and a 63 mm working distance. The collimated incident beam (for fluorescent excitation and scattering interference) was from a continuous monochromatic light source implemented by a 660 nm diode laser (Cobolt 06-MLD, Cobolt AB). An aluminum-coated mirror was clockwise-rotated 30° to the horizontal axis for obliquely directing the light beam to hiPSC-CM samples cultured in a dish with glass bottom. The oblique transillumination by the laser diode had a maximum irradiance of 31 mW/cm2 on the sample (four samples were imaged by a laser diode). An alternative light source used here was a 660 nm LED (M660L4, Thorlabs) to get a higher irradiance of up to 100 mW/cm2 (the rest of the samples were imaged by a LED). No difference in performance was registered between the two light sources. A long-pass dichroic mirror with a cut-off wavelength at 660 nm (FF660-Di02-25x36, Semrock) was used for splitting the fluorescence emission light and the scattering interference light into the two cameras, respectively. A multiband emission filter (ET595/40m+700LP, Chroma) was placed in the optical pathway of the fluorescence camera to suppress the excitation beam background. The lateral resolutions of the dual macroscope system were quantified using high-resolution printed letters. The fitting edge spread functions of the sharp edges were averaged to get the line spread function. The lateral full widths at half maximum of the line spread function were measured as ∼30.1 μm for both imaging modalities. Note that for dual calcium–dye-free experiments, as shown in Figure 3, we used calcium-sensitive dye Rhod-4 at 10 μM and different light sources and filter sets: a 530 nm LED (M530L4, Thorlabs) for excitation, with an excitation filter ET535/50m (Chroma), a long-pass dichroic mirror (FF552-Di02-25x36, Semrock), and the same multiband emission filter (ET595/40m+700LP, Chroma) in front of camera 1 as in voltage imaging.
Microscopic Imaging Setup
The microscopic imaging was done on an inverted Nikon TE 2000 microscope with a 20× objective. The cardiomyocytes were cultured in a 96-well plate with glass bottom and imaged from the bottom. The all-optical system25,27 included custom additions with a 470 nm LED (M470L4, Thorlabs), 530 nm LED (M530L4, Thorlabs), and 660 nm LED (M660L4, Thorlabs) combined into the objective for direct optogenetic pacing and calcium and voltage excitation, respectively. Another LED (M590L3, Thorlabs) with a collimated yellow beam was placed on the top of the plate with an angle (45°) for achieving dye-free imaging based on oblique transillumination, which avoided the excitation window of the voltage indicator. The imaging end of the system could be switched to the Photometrics 95B prime camera or the Basler camera via a rotation mirror. Optical records of voltage, calcium, and dye-free contractions were collected using the two cameras under the same conditions of optogenetic pacing. While recording, the optogenetic pacing frequency was set to be 0.5 Hz with a pulse width of 10 ms, the voltage and calcium excitation irradiance was 30 mW/cm2, the dye-free excitation irradiance was 25 mW/cm2, and the frame acquisition rate of each camera was 100 Hz. Each record had a time length of 30 s.
Synchronized Camera Acquisition
The acquisitions of the voltage and dye-free cameras were implemented on commercial USB3.0-based software Pylon Viewer (Basler). The imaging gains were 36 for the voltage camera and 10 for the dye-free camera, with a continuous excitation light irradiance of 31 mW/cm2 at 660 nm. The acquisition mode on the software for both cameras was set as trigger mode by detecting the external burst frame start trigger. The external synchronization TTL trigger sequences were generated by a function generator (DG1032Z, Rigol) and simultaneously delivered to the two cameras via GPIO cables. The trigger frequency was 100 Hz, resulting in 100 frames per second (fps) acquisition rate. During synchronized acquisition, the exposure time of the cameras was 9.8 ms, which left 0.2 ms to allow data transmission during each triggering cycle; the recording video format was in uncompressed 8-bit AVI, and the total acquisition time was 20 s for each pacing frequency record.
Camera Co-Registration
The FOVs of the two independent cameras were calibrated by simultaneously imaging a scale card before the iPSC-CMs sample. Slightly horizontal, vertical, and rotational shifts were applied for the voltage FOV to match the dye-free FOV. Three cross features scattered across the scale card images were extracted to determine the lateral shift parameters of the voltage FOV. The optimized shift parameters were globally searched until the same cross features in the two FOVs were approximately matched. The calculation process of the newly registered pixel index according to those optimized shift parameters is described in supplements (for details, see Figure S3 and Supplemental Methods).
Voltage and Dye-Free Data Processing
Temporal Period-Shift Enhancement (PSE)
PSE takes advantage of periodic signals, and for paced records, it was applied to each pixel across all frames to enhance the signal SNR (see Figure S4) by iterative summation of the temporally shifted trace and the original trace, i.e.,
where Traw indicates the raw voltage action potential or contraction trace, TPSEn and TPSE(n – 1) indicate the enhanced traces after n and n – 1 times shift (TPSE0 is equal to Traw when n = 1), respectively, and P is the period length determined by frame acquisition rate over pacing frequency. The maximum iterative PSE number is limited to the trace length, which is given by total frame number over period. The total iterative PSE number was set to be half of the maximum in each stimulation recording.
Locally Weighted Spatial Bartlett Filtering and Temporal Smoothing
The second SNR enhancement step was applying a same spatial-weighted average filter to all voltage and dye-free frames. We used a Bartlett filter:
where I(x, y) indicates the original individual frame, Bartlett(x, y) indicates the 2D kernel function, which is constructed by a mesh of the 1D Bartlett window function with a window size of 20 pixels, and IBartlett(x, y) indicates the spatially filtered frame. The spatially weighted feature of the Bartlett filter prevents overfiltering and is suitable for fine wavefront tracking.68 After the Bartlett filter, a temporal filter was applied by locally weighted temporal regression (“loess”), which removed the significant outliers of the traces. The span for the temporal filter was 150 ms. The purpose of temporal filtering was to clean the trace glitches for accurate detection of the event start.
Dye-Free Event Start Boost by the Time-Difference (TD) Filter
After PSE, co-registration was applied to the voltage FOV for precise FOV match with the dye-free FOV (see previous section). Then, a time-difference (TD) filter was applied to the dye-free data for event start boosting.30 The TD filter was constructed by the absolute difference value of the PSE trace and the time-shifted trace:
where γ is the difference time. The guiding principle for using the difference time is that boosting the global waveforms (peaks) should register the true event start point (troughs) of the original global waveforms (see Figure 3A). It is important to mention that a TD filter may induce a phase shift in the “boosted” trace for different γ values compared to the original trace due to the asymmetric shape of the transients (Figure S5). This is inconsequential for constructing activation maps and quantifying conduction properties since it affects all pixels equally. However, caution should be applied when trying to extract precise local time delays linking the electrical and mechanical waves. The TD filter was not used when the exact relative phase of the electrical and mechanical waves was determined, and the electromechanical delay (EMD) was calculated to avoid phase shift artifacts.
Activation Time Detection
The event start for excitation and contraction waves is marked by a rapid depolarization, i.e., a sharp increase in voltage or contraction force (after boosting). Based on this advantage, a time-delayed difference trace was constructed by subtracting the smoothed trace from the delayed trace, i.e.,
where Td is the time-delayed difference trace, Ts is the temporally smoothed trace, and δ is the delay. Typically, δ is optimized to cover the duration of depolarization, e.g., 100 ms for voltage action potential and 200 ms for contraction. The activation was obtained by recording the timing of the time-delayed difference peaks (Figure 3A). Activation maps were constructed as contour plots containing the event activation time of all pixels for a beat. A spatial Gaussian filter with a span of 20 pixels was applied to the voltage and dye-free activation maps for further smoothing.
CV, DFD, APD, and aEMD Measurements
Based on activation maps, the conduction velocity (CV) of excitation waves was calculated by the physical distance between the first ROI (near the pacing/spontaneous site; see the ROI examples in Figure 3) and the last ROI (distal site) over the wave propagation timing in between. The chosen ROIs were matched in voltage and dye-free FOVs and kept consistent in one sample for the calculations over all pacing frequencies. Mean CV values of all samples at each pacing/spontaneous frequency were calculated and presented with ± S.E.
Space segmentation was first performed according to the activation maps. Each segment was approximately perpendicular to the wave propagation direction. The activation time is roughly similar within each segment, which reduces signal distortion but helps signal enhancement for spatial average. The original (without any prior spatial filtering and temporal smoothing) voltage action potential traces and dye-free transient traces within each segment were summed up and normalized. After normalization, the local action potential duration (APD) was measured within each segment as the duration at 80% level (APD80, voltage action potential), the local dye-free signal duration (DFD) was measured within the same segment as the time duration between the onset of contraction and the offset of relaxation (dye-free transient), and the local apparent electromechanical delay (aEMD) was measured within each segment by the time lag between the onset of electrical activation (voltage action potential) and the onset of mechanical activation (dye-free contraction). We use the adjective “apparent” as the dye-free signal is assumed to be uniquely linked to mechanical contraction but may also reflect other cell properties, such as changes in the index of refraction that are electrically linked. Mean APD, DFD, and aEMD values of all samples within each segment and at each pacing/spontaneous frequency were calculated.
Wavefront Tortuosity Index Calculation
An automated wave tracking method (in Ccoffinn,69 based on Bayly’s approach70) was applied to individual activation maps to generate wavefront segmentations and propagation vectors in each segment. Each segmentation frame remained activated for 200 ms. The arrow of the vectors pointed in the direction of propagation and their magnitude indicated the relative local CV. For each arrow and its neighborhood arrows within the radius of 75 pixels, the circular standard deviation of the angular components in polar coordinates was computed. The global wavefront tortuosity index (in degrees; WT index) was then calculated by the average of the circular standard deviations of all tracking arrows across the entire FOV.
Statistical Tests
Statistical analyses were performed using MATLAB (v.2018b) and GraphPad Prism (v.8). Data are presented as dot plots, and mean ± S.E. is overlaid. When comparing individual groups, two-tailed t tests were used to determine statistical significance. Two-way ANOVA was used for APD, DFD, CV, and WT to evaluate significance among three or more groups and with appropriate post hoc tests as indicated in the text for comparisons between groups. Linear regression lines were fit, and a linearity test was applied. Slopes and R2 are specified whenever possible.
Acknowledgments
We thank Evan W. Miller (UC Berkeley) for providing the NIR voltage dye Berst1 used in these studies. We thank Yuli W. Heinson for helping with experiments for the revision of the paper.
Supporting Information Available
The Supporting Information is available free of charge at https://pubs.acs.org/doi/10.1021/acsphotonics.2c01644.
Acronym list, additional experimental details, expanded materials and methods, video, and quantifications of parameters (PDF)
Author Present Address
∥ Present address: School of Electronic and Information Engineering, Harbin Institute of Technology, Shenzhen 518055, China (W.L.)
Author Contributions
⊥ W.L. and J.L.H. contributed equally to this work as first authors.
Author Contributions
E.E. and W.L. conceived the study and oversaw the implementation. W.L. built the dual macroscope, wrote the analysis software, and analyzed most of the results. J.L.H. prepared all experimental samples and reagents and, together with W.L., performed all experiments and analyzed some of the data. G.B. advised on the dye-free imaging and camera deployment. J.T. analyzed wavefront tortuosity. W.L. and E.E. wrote the initial draft of the manuscript, and all authors contributed to the revised version.
This work was supported by NIH grants R01HL144157, R21EB026152, and NSF EFMA1830941 to E.E.
The authors declare no competing financial interest.
Supplementary Material
References
- Bers D. M. Cardiac excitation-contraction coupling. Nature 2002, 415, 198–205. 10.1038/415198a. [DOI] [PubMed] [Google Scholar]
- Aistrup G. L.; Kelly J. E.; Kapur S.; Kowalczyk M.; Sysman-Wolpin I.; Kadish A. H.; Wasserstrom J. A. Pacing-induced heterogeneities in intracellular Ca2+ signaling, cardiac alternans, and ventricular arrhythmias in intact rat heart. Circ. Res. 2006, 99, e65–e73. 10.1161/01.RES.0000244087.36230.bf. [DOI] [PubMed] [Google Scholar]
- Shiferaw Y.; Sato D.; Karma A. Coupled dynamics of voltage and calcium in paced cardiac cells. Phys. Rev. E 2005, 71, 021903 10.1103/PhysRevE.71.021903. [DOI] [PMC free article] [PubMed] [Google Scholar]
- Pfeiffer-Kaushik E. R.; Smith G. L.; Cai B.; Dempsey G. T.; Hortigon-Vinagre M. P.; Zamora V.; Feng S.; Ingermanson R.; Zhu R.; Hariharan V.; Nguyen C.; Pierson J.; Gintant G. A.; Tung L. Electrophysiological characterization of drug response in hSC-derived cardiomyocytes using voltage-sensitive optical platforms. J. Pharmacol. Toxicol. Methods 2019, 99, 106612 10.1016/j.vascn.2019.106612. [DOI] [PubMed] [Google Scholar]
- Nitsan I.; Drori S.; Lewis Y. E.; Cohen S.; Tzlil S. Mechanical communication in cardiac cell synchronized beating. Nat. Phys. 2016, 12, 472–477. 10.1038/nphys3619. [DOI] [Google Scholar]
- Bub G.; Glass L.; Publicover N. G.; Shrier A. Bursting calcium rotors in cultured cardiac myocyte monolayers. Proc. Natl. Acad. Sci. U. S. A. 1998, 95, 10283–10287. 10.1073/pnas.95.17.10283. [DOI] [PMC free article] [PubMed] [Google Scholar]
- Entcheva E.; Lu S. N.; Troppman R. H.; Sharma V.; Tung L. Contact fluorescence imaging of reentry in monolayers of cultured neonatal rat ventricular myocytes. J. Cardiovasc. Electrophysiol. 2000, 11, 665–676. 10.1111/j.1540-8167.2000.tb00029.x. [DOI] [PubMed] [Google Scholar]
- Arutunyan A.; Webster D. R.; Swift L. M.; Sarvazyan N. Localized injury in cardiomyocyte network: a new experimental model of ischemia-reperfusion arrhythmias. Am. J. Physiol. 2001, 280, 1905–1915. 10.1152/ajpheart.2001.280.4.H1905. [DOI] [PMC free article] [PubMed] [Google Scholar]
- Iravanian S.; Nabutovsky Y.; Kong C. R.; Saha S.; Bursac N.; Tung L. Functional reentry in cultured monolayers of neonatal rat cardiac cells. Am. J. Physiol. 2003, 285, H449–H456. 10.1152/ajpheart.00896.2002. [DOI] [PubMed] [Google Scholar]
- Gintant G.; Burridge P.; Gepstein L.; Harding S.; Herron T.; Hong C.; Jalife J.; Wu J. C. Use of Human Induced Pluripotent Stem Cell-Derived Cardiomyocytes in Preclinical Cancer Drug Cardiotoxicity Testing: A Scientific Statement From the American Heart Association. Circ. Res. 2019, 125, e75–e92. 10.1161/RES.0000000000000291. [DOI] [PMC free article] [PubMed] [Google Scholar]
- Herron T. J.; Lee P.; Jalife J. Optical imaging of voltage and calcium in cardiac cells & tissues. Circ. Res. 2012, 110, 609–623. 10.1161/CIRCRESAHA.111.247494. [DOI] [PMC free article] [PubMed] [Google Scholar]
- Weinberg S.; Lipke E. A.; Tung L. In vitro electrophysiological mapping of stem cells. Methods Mol. Biol. 2010, 660, 215–237. 10.1007/978-1-60761-705-1_14. [DOI] [PubMed] [Google Scholar]
- Gaudette G. R.; Todaro J.; Krukenkamp I. B.; Chiang F. P. Computer aided speckle interferometry: a technique for measuring deformation of the surface of the heart. Ann. Biomed. Eng. 2001, 29, 775–780. 10.1114/1.1397785. [DOI] [PubMed] [Google Scholar]
- Zhang H.; Iijima K.; Huang J.; Walcott G. P.; Rogers J. M. Optical Mapping of Membrane Potential and Epicardial Deformation in Beating Hearts. Biophys. J. 2016, 111, 438–451. 10.1016/j.bpj.2016.03.043. [DOI] [PMC free article] [PubMed] [Google Scholar]
- Christoph J.; Luther S. Marker-Free Tracking for Motion Artifact Compensation and Deformation Measurements in Optical Mapping Videos of Contracting Hearts. Front. Physiol. 2018, 9, 1483. 10.3389/fphys.2018.01483. [DOI] [PMC free article] [PubMed] [Google Scholar]
- Bien H.; Yin L.; Entcheva E. Cardiac cell networks on elastic microgrooved scaffolds. IEEE Eng. Med. Biol. Mag. 2003, 22, 108–112. 10.1109/MEMB.2003.1256279. [DOI] [PubMed] [Google Scholar]
- Chung C. Y.; Bien H.; Sobie E. A.; Dasari V.; McKinnon D.; Rosati B.; Entcheva E. Hypertrophic phenotype in cardiac cell assemblies solely by structural cues and ensuing self-organization. Faseb J 2011, 25, 851–862. 10.1096/fj.10-168625. [DOI] [PMC free article] [PubMed] [Google Scholar]
- Peeters G. A.; Hlady V.; Bridge J. H.; Barry W. H. Simultaneous measurement of calcium transients and motion in cultured heart cells. Am. J. Physiol. 1987, 253, H1400–H1408. 10.1152/ajpheart.1987.253.6.H1400. [DOI] [PubMed] [Google Scholar]
- Ahola A.; Kiviaho A. L.; Larsson K.; Honkanen M.; Aalto-Setala K.; Hyttinen J. Video image-based analysis of single human induced pluripotent stem cell derived cardiomyocyte beating dynamics using digital image correlation. J. Geophys. Res. Planets 2014, 13, 39. 10.1186/1475-925X-13-39. [DOI] [PMC free article] [PubMed] [Google Scholar]
- Sala L.; Meer B. J. v.; Tertoolen L. G. J.; Bakkers J.; Bellin M.; Davis R. P.; Denning C.; Dieben M. A. E.; Eschenhagen T.; Giacomelli E.; Grandela C.; Hansen A.; Holman E. R.; Jongbloed M. R. M.; Kamel S. M.; Koopman C. D.; Lachaud Q.; Mannhardt I.; Mol M. P. H.; Mosqueira D.; Orlova V. V.; Passier R.; Ribeiro M. C.; Saleem U.; Smith G. L.; Burton F. L.; Mummery C. L. MUSCLEMOTION. Circ. Res. 2018, 122, e5–e16. 10.1161/CIRCRESAHA.117.312067. [DOI] [PMC free article] [PubMed] [Google Scholar]
- Hansen K. J.; Favreau J. T.; Gershlak J. R.; Laflamme M. A.; Albrecht D. R.; Gaudette G. R. Optical Method to Quantify Mechanical Contraction and Calcium Transients of Human Pluripotent Stem Cell-Derived Cardiomyocytes. Tissue Eng., Part C 2017, 23, 445–454. 10.1089/ten.tec.2017.0190. [DOI] [PMC free article] [PubMed] [Google Scholar]
- Huebsch N.; Loskill P.; Mandegar M. A.; Marks N. C.; Sheehan A. S.; Ma Z.; Mathur A.; Nguyen T. N.; Yoo J. C.; Judge L. M.; Spencer C. I.; Chukka A. C.; Russell C. R.; So P.-L.; Conklin B. R.; Healy K. E. Automated Video-Based Analysis of Contractility and Calcium Flux in Human-Induced Pluripotent Stem Cell-Derived Cardiomyocytes Cultured over Different Spatial Scales. Tissue Eng., Part C 2015, 21, 467–479. 10.1089/ten.tec.2014.0283. [DOI] [PMC free article] [PubMed] [Google Scholar]
- Andonian A. T. Detection of stimulated back muscle contractions by moiré topography. J. Biomech. 1984, 17, 653–661. 10.1016/0021-9290(84)90119-2. [DOI] [PubMed] [Google Scholar]
- Zheng X.; Zhang X. An optical Moiré technique for cell traction force mapping. J. Micromech. Microeng. 2008, 18, 125006 10.1088/0960-1317/18/12/125006. [DOI] [Google Scholar]
- Klimas A.; Ambrosi C. M.; Yu J.; Williams J. C.; Bien H.; Entcheva E. OptoDyCE as an automated system for high-throughput all-optical dynamic cardiac electrophysiology. Nat. Commun. 2016, 7, 11542. 10.1038/ncomms11542. [DOI] [PMC free article] [PubMed] [Google Scholar]
- van Meer B. J.; Krotenberg A.; Sala L.; Davis R. P.; Eschenhagen T.; Denning C.; Tertoolen L. G. J.; Mummery C. L. Simultaneous measurement of excitation-contraction coupling parameters identifies mechanisms underlying contractile responses of hiPSC-derived cardiomyocytes. Nat. Commun. 2019, 10, 4325. 10.1038/s41467-019-12354-8. [DOI] [PMC free article] [PubMed] [Google Scholar]
- Klimas A.; Ortiz G.; Boggess S. C.; Miller E. W.; Entcheva E. Multimodal on-axis platform for all-optical electrophysiology with near-infrared probes in human stem-cell-derived cardiomyocytes. Prog. Biophys. Mol. Biol. 2020, 154, 62–70. 10.1016/j.pbiomolbio.2019.02.004. [DOI] [PMC free article] [PubMed] [Google Scholar]
- Hwang S. M.; Yea K. H.; Lee K. J. Regular and alternant spiral waves of contractile motion on rat ventricle cell cultures. Phys. Rev. Lett. 2004, 92, 198103 10.1103/PhysRevLett.92.198103. [DOI] [PubMed] [Google Scholar]
- Rother J.; Richter C.; Turco L.; Knoch F.; Mey I.; Luther S.; Janshoff A.; Bodenschatz E.; Tarantola M.. Crosstalk of cardiomyocytes and fibroblasts in co-cultures. Open Biol. 2015, 5 (), 10.1098/rsob.150038. [DOI] [PMC free article] [PubMed] [Google Scholar]
- Burton R. A. B.; Klimas A.; Ambrosi C. M.; Tomek J.; Corbett A.; Entcheva E.; Bub G. Optical control of excitation waves in cardiac tissue. Nat. Photonics 2015, 9, 813–816. 10.1038/nphoton.2015.196. [DOI] [PMC free article] [PubMed] [Google Scholar]
- Burton R. B.; Tomek J.; Ambrosi C. M.; Larsen H. E.; Sharkey A. R.; Capel R. A.; Corbett A. D.; Bilton S.; Klimas A.; Stephens G.; Cremer M.; Bose S. J.; Li D.; Gallone G.; Herring N.; Mann E. O.; Kumar A.; Kramer H.; Entcheva E.; Paterson D. J.; Bub G. Optical Interrogation of Sympathetic Neuronal Effects on Macroscopic Cardiomyocyte Network Dynamics. iScience 2020, 23, 101334. 10.1016/j.isci.2020.101334. [DOI] [PMC free article] [PubMed] [Google Scholar]
- Nash M. P.; Panfilov A. V. Electromechanical model of excitable tissue to study reentrant cardiac arrhythmias. Prog. Biophys. Mol. Biol. 2004, 85, 501–522. 10.1016/j.pbiomolbio.2004.01.016. [DOI] [PubMed] [Google Scholar]
- Trayanova N. A.; Rice J. J. Cardiac electromechanical models: from cell to organ. Front. Physiol. 2011, 2, 43. 10.3389/fphys.2011.00043. [DOI] [PMC free article] [PubMed] [Google Scholar]
- Trayanova N. A.; Constantino J.; Gurev V. Electromechanical models of the ventricles. Am. J. Physiol. 2011, 301, H279–H286. 10.1152/ajpheart.00324.2011. [DOI] [PMC free article] [PubMed] [Google Scholar]
- Wang Z. J.; Santiago A.; Zhou X.; Wang L.; Margara F.; Levrero-Florencio F.; Das A.; Kelly C.; Dall’Armellina E.; Vazquez M.; Rodriguez B. Human biventricular electromechanical simulations on the progression of electrocardiographic and mechanical abnormalities in post-myocardial infarction. Europace : European pacing, arrhythmias, and cardiac electrophysiology : journal of the working groups on cardiac pacing, arrhythmias, and cardiac cellular electrophysiology of the European Society of Cardiology 2021, 23, i143–i152. 10.1093/europace/euaa405. [DOI] [PMC free article] [PubMed] [Google Scholar]
- Grubb C. S.; Melki L.; Wang D. Y.; Peacock J.; Dizon J.; Iyer V.; Sorbera C.; Biviano A.; Rubin D. A.; Morrow J. P.; Saluja D.; Tieu A.; Nauleau P.; Weber R.; Chaudhary S.; Khurram I.; Waase M.; Garan H.; Konofagou E. E.; Wan E. Y.. Noninvasive localization of cardiac arrhythmias using electromechanical wave imaging. Sci. Transl. Med. 2020, 12 (), 10.1126/scitranslmed.aax6111. [DOI] [PMC free article] [PubMed] [Google Scholar]
- Provost J.; Lee W. N.; Fujikura K.; Konofagou E. E. Imaging the electromechanical activity of the heart in vivo. Proc. Natl. Acad. Sci. U. S. A. 2011, 108, 8565–8570. 10.1073/pnas.1011688108. [DOI] [PMC free article] [PubMed] [Google Scholar]
- Christoph J.; Chebbok M.; Richter C.; Schroder-Schetelig J.; Bittihn P.; Stein S.; Uzelac I.; Fenton F. H.; Hasenfuss G.; Gilmour R. F. Jr.; Luther S. Electromechanical vortex filaments during cardiac fibrillation. Nature 2018, 555, 667–672. 10.1038/nature26001. [DOI] [PubMed] [Google Scholar]
- Huang Y.-L.; Walker A. S.; Miller E. W. A Photostable Silicon Rhodamine Platform for Optical Voltage Sensing. J. Am. Chem. Soc. 2015, 137, 10767–10776. 10.1021/jacs.5b06644. [DOI] [PMC free article] [PubMed] [Google Scholar]
- Heinson Y. W.; Han J. L.; Entcheva E. Portable low-cost macroscopic mapping system for all-optical cardiac electrophysiology. J. Biomed. Opt. 2023, 28, 016001 10.1117/1.JBO.28.1.016001. [DOI] [PMC free article] [PubMed] [Google Scholar]
- Arrenberg A. B.; Stainier D. Y.; Baier H.; Huisken J. Optogenetic control of cardiac function. Science 2010, 330, 971–974. 10.1126/science.1195929. [DOI] [PubMed] [Google Scholar]
- Grondin J.; Costet A.; Bunting E.; Gambhir A.; Garan H.; Wan E.; Konofagou E. E. Validation of electromechanical wave imaging in a canine model during pacing and sinus rhythm. Heart Rhythm 2016, 13, 2221–2227. 10.1016/j.hrthm.2016.08.010. [DOI] [PMC free article] [PubMed] [Google Scholar]
- Entcheva E.; Kay M. W. Cardiac optogenetics: a decade of enlightenment. Nat. Rev. Cardiol. 2021, 18, 349–367. 10.1038/s41569-020-00478-0. [DOI] [PMC free article] [PubMed] [Google Scholar]
- Pfeiffer E. R.; Tangney J. R.; Omens J. H.; McCulloch A. D. Biomechanics of cardiac electromechanical coupling and mechanoelectric feedback. J. Biomech. Eng. 2014, 136, 021007 10.1115/1.4026221. [DOI] [PMC free article] [PubMed] [Google Scholar]
- Gurev V.; Constantino J.; Rice J. J.; Trayanova N. A. Distribution of electromechanical delay in the heart: insights from a three-dimensional electromechanical model. Biophys. J. 2010, 99, 745–754. 10.1016/j.bpj.2010.05.028. [DOI] [PMC free article] [PubMed] [Google Scholar]
- Walia R.; Chang S. L.; Lin Y. J.; Lo L. W.; Hu Y. F.; Chao T. F.; Chung F. P.; Liao J. N.; Lin C. Y.; Chang Y. T.; Lin C. H.; Te A. L. D.; Yamada S.; Chen S. A.; Tsao H. M. Early detection of electromechanical dysfunction in patients with idiopathic premature ventricular contractions. Pacing Clin. Electrophysiol. 2019, 42, 637–645. 10.1111/pace.13650. [DOI] [PubMed] [Google Scholar]
- Lee P.; Calvo C. J.; Alfonso-Almazán J. M.; Quintanilla J. G.; Chorro F. J.; Yan P.; Loew L. M.; Filgueiras-Rama D.; Millet J. Low-Cost Optical Mapping Systems for Panoramic Imaging of Complex Arrhythmias and Drug-Action in Translational Heart Models. Sci. Rep. 2017, 7, 43217–43217. 10.1038/srep43217. [DOI] [PMC free article] [PubMed] [Google Scholar]
- Ashraf M.; Mohanan S.; Sim B. R.; Tam A.; Rahemipour K.; Brousseau D.; Thibault S.; Corbett A. D.; Bub G. Random access parallel microscopy. eLife 2021, 10. 10.7554/eLife.56426. [DOI] [PMC free article] [PubMed] [Google Scholar]
- McCain M. L.; Desplantez T.; Geisse N. A.; Rothen-Rutishauser B.; Oberer H.; Parker K. K.; Kleber A. G. Cell-to-cell coupling in engineered pairs of rat ventricular cardiomyocytes: relation between Cx43 immunofluorescence and intercellular electrical conductance. Am. J. Physiol. 2012, 302, H443–H450. 10.1152/ajpheart.01218.2010. [DOI] [PMC free article] [PubMed] [Google Scholar]
- Dhillon P. S.; Gray R.; Kojodjojo P.; Jabr R.; Chowdhury R.; Fry C. H.; Peters N. S. Relationship between gap-junctional conductance and conduction velocity in mammalian myocardium. Circ.: Arrhythmia Electrophysiol. 2013, 6, 1208–1214. 10.1161/CIRCEP.113.000848. [DOI] [PubMed] [Google Scholar]
- Melby J. A.; de Lange W. J.; Zhang J.; Roberts D. S.; Mitchell S. D.; Tucholski T.; Kim G.; Kyrvasilis A.; McIlwain S. J.; Kamp T. J.; Ralphe J. C.; Ge Y. Functionally Integrated Top-Down Proteomics for Standardized Assessment of Human Induced Pluripotent Stem Cell-Derived Engineered Cardiac Tissues. J. Proteome Res. 2021, 20, 1424–1433. 10.1021/acs.jproteome.0c00830. [DOI] [PMC free article] [PubMed] [Google Scholar]
- Jongsma H. J.; Wilders R. Gap junctions in cardiovascular disease. Circ. Res. 2000, 86, 1193–1197. 10.1161/01.RES.86.12.1193. [DOI] [PubMed] [Google Scholar]
- Shaw R.; Rudy Y. Ionic mechanisms of propagation in cardiac tissue. Roles of the sodium and L-type calcium currents during reduced excitability and decreased gap junction coupling. Circ. Res. 1997, 81, 727–741. 10.1161/01.RES.81.5.727. [DOI] [PubMed] [Google Scholar]
- Rudy Y. Noninvasive imaging of cardiac electrophysiology and arrhythmia. Ann. N. Y. Acad. Sci. 2010, 1188, 214–221. 10.1111/j.1749-6632.2009.05103.x. [DOI] [PubMed] [Google Scholar]
- Christoph J.; Schroder-Schetelig J.; Luther S. Electromechanical optical mapping. Prog. Biophys. Mol. Biol. 2017, 130, 150–169. 10.1016/j.pbiomolbio.2017.09.015. [DOI] [PubMed] [Google Scholar]
- Lebert J.; Christoph J. Synchronization-based reconstruction of electromechanical wave dynamics in elastic excitable media. Chaos 2019, 29, 093117 10.1063/1.5101041. [DOI] [PubMed] [Google Scholar]
- Weissler A. M.; Harris W. S.; Schoenfeld C. D. Systolic Time Intervals in Heart Failure in Man. Circulation 1968, 37, 149–159. 10.1161/01.CIR.37.2.149. [DOI] [PubMed] [Google Scholar]
- Kerckhoffs R. C.; Faris O. P.; Bovendeerd P. H.; Prinzen F. W.; Smits K.; McVeigh E. R.; Arts T. Electromechanics of paced left ventricle simulated by straightforward mathematical model: comparison with experiments. Am. J. Physiol. 2005, 289, H1889–H1897. 10.1152/ajpheart.00340.2005. [DOI] [PMC free article] [PubMed] [Google Scholar]
- Constantino J.; Hu Y.; Lardo A. C.; Trayanova N. A. Mechanistic insight into prolonged electromechanical delay in dyssynchronous heart failure: a computational study. Am. J. Physiol. 2013, 305, H1265–H1273. 10.1152/ajpheart.00426.2013. [DOI] [PMC free article] [PubMed] [Google Scholar]
- Dawoud F.; Spragg D. D.; Berger R. D.; Cheng A.; Horáček B. M.; Halperin H. R.; Lardo A. C. Non-invasive electromechanical activation imaging as a tool to study left ventricular dyssynchronous patients: Implication for CRT therapy. J. Electrocardiol. 2016, 49, 375–382. 10.1016/j.jelectrocard.2016.02.011. [DOI] [PubMed] [Google Scholar]
- Provost J.; Gurev V.; Trayanova N.; Konofagou E. E. Mapping of cardiac electrical activation with electromechanical wave imaging: an in silico-in vivo reciprocity study. Heart Rhythm 2011, 8, 752–759. 10.1016/j.hrthm.2010.12.034. [DOI] [PMC free article] [PubMed] [Google Scholar]
- Usyk T. P.; McCulloch A. D. Relationship between regional shortening and asynchronous electrical activation in a three-dimensional model of ventricular electromechanics. J. Cardiovasc. Electrophysiol. 2003, 14, S196–S202. 10.1046/j.1540.8167.90311.x. [DOI] [PubMed] [Google Scholar]
- Kettunen R.; Timisjarvi J.; Kouvalainen E.; Anttila P.; Hirvonen L. Electromechanical delay in the intact dog heart. Int. J. Cardiol. 1985, 9, 161–171. 10.1016/0167-5273(85)90195-0. [DOI] [PubMed] [Google Scholar]
- ter Bekke R. M. A.; Haugaa K. H.; van den Wijngaard A.; Bos J. M.; Ackerman M. J.; Edvardsen T.; Volders P. G. A. Electromechanical window negativity in genotyped long-QT syndrome patients: relation to arrhythmia risk. Eur. Heart J. 2015, 36, 179–186. 10.1093/eurheartj/ehu370. [DOI] [PubMed] [Google Scholar]
- van der Linde H. J.; Van Deuren B.; Somers Y.; Loenders B.; Towart R.; Gallacher D. J. The Electro-Mechanical window: a risk marker for Torsade de Pointes in a canine model of drug induced arrhythmias. Br. J. Pharmacol. 2010, 161, 1444–1454. 10.1111/j.1476-5381.2010.00934.x. [DOI] [PMC free article] [PubMed] [Google Scholar]
- Jia Z.; Bien H.; Shiferaw Y.; Entcheva E. Cardiac cellular coupling and the spread of early instabilities in intracellular Ca2+. Biophys. J. 2012, 102, 1294–1302. 10.1016/j.bpj.2012.02.034. [DOI] [PMC free article] [PubMed] [Google Scholar]
- Li W.; Han J. L.; Entcheva E. Protein and mRNA Quantification in Small Samples of Human-Induced Pluripotent Stem Cell-Derived Cardiomyocytes in 96-Well Microplates. Methods Mol. Biol. 2022, 2485, 15–37. 10.1007/978-1-0716-2261-2_2. [DOI] [PMC free article] [PubMed] [Google Scholar]
- Mironov S. F.; Vetter F. J.; Pertsov A. M. Fluorescence imaging of cardiac propagation: spectral properties and filtering of optical action potentials. Am. J. Physiol. 2006, 291, H327–H335. 10.1152/ajpheart.01003.2005. [DOI] [PubMed] [Google Scholar]
- Tomek J.; Burton R. A. B.; Bub G. Ccoffinn: Automated Wave Tracking in Cultured Cardiac Monolayers. Biophys. J. 2016, 111, 1595–1599. 10.1016/j.bpj.2016.08.049. [DOI] [PMC free article] [PubMed] [Google Scholar]
- Bayly P. V.; KenKnight B. H.; Rogers J. M.; Hillsley R. E.; Ideker R. E.; Smith W. M. Estimation of conduction velocity vector fields from epicardial mapping data. IEEE Trans. Biomed. Eng. 1998, 45, 563–571. 10.1109/10.668746. [DOI] [PubMed] [Google Scholar]
Associated Data
This section collects any data citations, data availability statements, or supplementary materials included in this article.