


Abstract
Interactions between proteins, drugs, water and B-DNA minor groove have been analyzed in crystal structures of 60 protein–DNA and 14 drug–DNA complexes. It was found that only purine N3, pyrimidine O2, guanine N2 and deoxyribose O4′ are involved in the interactions, and that contacts to N3 and O2 are most frequent and more polar than contacts to O4′. Many protein contacts are mediated by water, possibly to increase the DNA effective surface. Fewer water-mediated contacts are observed in drug complexes. The distributions of ligands around N3 are significantly more compact than around O2, and distributions of water molecules are the most compact. Distributions around O4′ are more diffuse than for the base atoms but most distributions still have just one binding site. Ligands bind to N3 and O2 atoms in analogous positions, and simultaneous binding to N3 and N2 in guanines is extremely rare. Contacts with two consecutive nucleotides are much more frequent than base–sugar contacts within one nucleotide. The probable reason for this is the large energy of deformation of hydrogen bonds for the one nucleotide motif. Contacts of Arg, the most frequent amino acid ligand, are stereochemically indistinguishable from the binding of the remaining amino acids except asparagine (Asn) and phenylalanine (Phe). Asn and Phe bind in distinct ways, mostly to a deformed DNA, as in the complexes of TATA-box binding proteins. DNA deformation concentrates on dinucleotide regions with a distinct deformation of the δ and ɛ backbone torsion angles for the Asn and δ, ɛ, ζ and χ for the Phe-contacted regions.
INTRODUCTION
Molecular recognition of DNA by small molecules and proteins is a fundamental problem in structural biology and drug design. Understanding of recognition in both sequence-selective and sequence-neutral ways at the level of successful prediction of binding modes and site selectivity will be instrumental for improvements in the prediction and realization of new molecules as potent and selective gene-regulatory drugs. This study concentrates on interactions of ligands with an important architectural feature of DNA, its minor groove. This is the site of action for a large number of non-covalent binding agents (1–3) and, in particular, for designed polyamide-based sequence-specific molecules (4). The former tend to interact with specific, mostly A / T sequences by means of a combination of directed hydrogen bonding to base pair edges, van der Waals interactions with the walls of the minor groove (5,6) and generalized electrostatic interactions. These factors are also responsible for protein–DNA recognition (7–9), and a number of unifying rules governing the interactions have now been elucidated (10–12) although it is now realized that the earlier goal of a simple recognition code between amino acids and bases is not attainable (13).
Relatively little is understood at present about the mode of action at the molecular level of the majority of minor groove-interacting drugs, although there is increasing evidence that many act by directly blocking or inhibiting protein–DNA recognition. It is commonly, though erroneously, assumed that regulatory protein contacts with DNA are invariably through the major groove, apart from a few notable exceptions such as the minor groove TATA-box recognition by means of β-sheets. The reality is rather different, and this study shows that at least some minor groove contacts are common even for those proteins whose principal recognition motif is via the major groove.
MATERIALS AND METHODS
Structure selection
The Nucleic Acid Database, NDB (14), was used to search and retrieve crystal structures of protein–DNA and drug–DNA complexes. The initial sample set used contains more than 250 protein–DNA structures and 60 drug complexes.
Structures were selected on the basis of their crystallographic and biological features. Complexes of DNA were selected which (i) do not have sugar or phosphate modifications, or base mismatches and (ii) have diffraction data to a resolution ≥2.5 Å for protein and 2.0 Å for drug complexes. Duplicate structures of complexes of identical molecules with the same packing (identical space group and similar cell dimensions) were excluded. Finally, only complexes with protein or drug bound in the DNA minor groove were analyzed and those with intercalating drugs were excluded. Sixty protein–DNA complexes and 14 drug–DNA complexes satisfied these criteria and are listed in Table 1.
Table 1. Listing of the structures analyzed in this study.

The NDB codes for protein–DNA complexes start with the two letters PD. Codes for drug–DNA complexes start with the two letters GD and GH.
Ligand interactions
The interactions between DNA atoms and ligands, i.e. atoms of bound proteins, drugs or water oxygens, were identified by applying a distance limit of 3.4 Å using the program DIST (15). The interacting ligand plus the nucleotide were placed in a common Cartesian coordinate system, by overlapping the nucleotide base atoms over the bases of an averaged nucleotide (16). The calculated contacts were classified as either polar or hydrophobic on the basis of the atom types involved. All overlapped ligand atoms were defined as forming a building block.
Fourier averaging
The resulting 3D distributions of ligand atoms from a building block interacting with nucleotides were statistically evaluated using the Fourier averaging method. ‘Distribution densities’ were calculated for each building block using the standard crystallographic procedure for computing electron densities. The density maps were visually inspected with the program O (17). The fitted peak positions represent the averaged positions of the interacting ligand atoms and are referred to as binding sites. Detailed descriptions of the Fourier averaging method can be found in Schneider and co-workers (18,19).
Patterns of binding
Ligands can interact with different minor groove atoms, forming distinct binding motifs. Each pattern has been labeled with the name of the DNA atom and the nucleotide type (Pu for the purines adenine, A, guanine, G, and inosine, I, and Py for the pyrimidines cytosine, C, and thymine, T). For example, the motif N3(Pu) comprises contacts made to a N3 atom of a purine. Not all types of motifs make enough contacts to be analyzed; for example, there are few guanine ones in drug–DNA minor groove complexes.
If a motif involves two nucleotides, we use the following abbreviations. Atoms in the first nucleotide are labeled by subscript i. The atoms of the previous nucleotide, i.e. in the 5′ direction, have the index i – 1, and those in the subsequent nucleotide in the 3′ direction have the index i + 1. A similar nomenclature is used for nucleotides in the complementary DNA chain, with the subscript j being used instead of i.
A ligand contacting two subsequent bases via one atom bridge can contribute to two Fourier-averaged peaks. Independence of peaks in two nucleotide motifs was therefore checked by applying a transformation T to one of them, corresponding to the relation between two consecutive nucleotides in the standard BI conformation. The peaks were resolved as independent when they did not overlap within 0.5 Å. As the transformation is only approximate for nucleotides in deformed double helices the peak independence cannot be tested in severely deformed nucleotides with a highly variable backbone conformation as in complexes with TATA-box binding complexes.
RESULTS AND DISCUSSION
The statistics of contacts between the DNA minor groove atoms and ligands are shown in Table 2. It is apparent that only the atoms O2(Py), N3(Pu), N2/C2(Pu) and O4′ of deoxyribose make a significant number of contacts. Most are formed by the base atoms N3(Pu)/O2(Py). N2(G) forms many water-mediated contacts in protein complexes. Atom O4′ is involved in a significant number of hydrophobic interactions.
Table 2. The numbers of ligand interactions with atoms in the DNA minor groove.

The numbers (columns 2–5) are shown as percentage fractions of the ‘Total Number of Contacts’ (column 6). The number of nucleotides studied is listed in the last column. The numbers of base–water–drug interactions and all G–drug ones are negligible and are not listed. A, adenine; G, guanine; I, inosine; T, thymine; C, cytosine.
We first analyzed basic binding motifs, formed between a single minor groove atom and one or two ligand atoms. Distributions of these contacts are shown in Figures 1 and 2, and their geometrical parameters are listed in Table 3. The composite motifs involving two DNA atoms from either one or two nucleotides are discussed in a subsequent section.
Figure 1.

The distribution densities of protein, drug and water contacts found within a radius of 3.40 Å from purine N3 and pyrimidine O2 base atoms. (A–D) Densities around adenine N3 and (E–H) densities around the thymine O2 atom. (A and E) Polar protein atoms; (B and F) hydrophobic protein atoms; (C and G) water-mediated proteins contacts; (D and H) polar drug atoms. All maps are in stereo.
Figure 2.

The distribution densities of protein, drug and water contacts found within a radius of 3.40 Å from deoxyribose O4′ atoms in purine and pyrimidine nucleotides. (A–D) Densities around O4′ in adenine, and (E–H) densities around O4′ in thymine. (A and E) Polar protein atoms; (B and F) hydrophobic protein atoms; (C and G) water-mediated proteins contacts; (D and H) polar drug atoms. All maps are in stereo.
Table 3. Geometries of binding sites of proteins, drugs and water to adenine and guanine N3 [A(N3), G(N3)], guanine N2 [G(N2)] and thymine and cytosine O2 [T(O2), C(O2)].

A distance ‘d’ is measured between a base atom (N3, N2 or O2) and a ligand atom X, an angle ‘α’is defined as C4–N3–X for N3 purine motifs, C2–N2–X for N2 guanine motifs and C2–O2–X for pyrimidine motifs. The dihedral angle θ is defined as N9–C4–N3–X for the N3 purine motif, N3–C2–N2–X for the guanine N2 motif and N1–C1–O2–X for the pyrimidine motifs. The geometries of the binding sites A(N3)–water and T(O2)–water in the uncomplexed DNA are shown for comparison (19).
Base atom patterns
Interactions with N3/O2 base atoms account for the majority of the polar contacts to the B-DNA minor groove. The fundamental difference between protein and drug contacts lies in the proportion of mediating (i.e. bridging) water molecules: they mediate a significant portion of protein interactions but only a few in the case of drugs. The portion of water-mediated interactions is larger for C•G than for T•A base pairs. The latter form almost as many hydrophobic as polar contacts whereas C•G form many fewer. All these observations are in agreement with the more polar character of C•G compared with T•A base pairs.
The Fourier-averaged 3D distributions of ligand atoms interacting with the N3(Pu)/O2(Py) minor groove atoms are shown in Figure 1A–D. Densities of the distributions show that most contacts are concentrated into well-defined and relatively tight regions. The purine contact distribution maps (Fig. 1A–D) are significantly more compact than pyrimidine ones (Fig. 1E–H). The contact distributions involving water molecules are the most compact, for both purines and pyrimidines. Of the direct ligand–DNA interactions, the most compact and well-defined distributions are those involving polar contacts. The hydrophobic interactions result in distributions with similar dimensions and only slightly larger volumes. A significant feature of both polar and hydrophobic protein contacts is the presence of secondary peaks, which are visible in Figure 1. The nature of these secondary peaks is analyzed in a subsequent section.
The density maps allow one to determine sites of preferred binding by fitting the map to peak positions. The binding sites are characterized by their positions relative to the DNA (Table 3). The similarity of the positions of the N3 and O2 binding sites is apparent both from Table 3 and Figure 1. All binding sites are shifted above the base planes in the 5′ direction. The amplitude of this shift is similar for all binding sites, ∼1 Å for Pu and 1.5 Å for Py, and may be a consequence of steric constraints by the adjacent DNA atoms. The hydrophobic sites lie closer to the base plane.
All motifs, apart from the water distributions, are elongated along the helical axis, more so for Py than Pu and more for hydrophobic than polar contacts. Polar interactions generally make only one binding site. Analysis of the geometric parameters (Table 2) shows that the geometries of the polar binding sites are similar for all types of ligands, with differences in distance <0.2 Å and in angles <20°. The purine dihedral angles are smaller than the pyrimidine ones by ∼30°, reflecting the greater distance of the pyrimidine binding sites from the base plane.
Hydrophobic binding sites differ from the polar ones by a larger spread of their distributions, greater distances from the O2/N3 atom (∼3.2 Å) and by greater variations in the dihedral angle θ. Hydrophobic contact distributions for pyrimidines tend to cluster in multiple peaks. All these characteristics agree with the non-directional nature of hydrophobic interactions. These fall into two classes. In the first, hydrophobic interactions are the only interactions involving the ligand, whereas in the second category, hydrophobic interactions accompany energetically more favorable hydrogen bonding. In protein complexes, each of these classes of hydrophobic interaction produces a distinct binding site, whereas in drug complexes, both classes of contacts contribute to both binding sites.
In order to estimate the dispersion of binding sites around the N3 and O2 atoms, we have calculated the radii of spheres enclosing all binding sites of these motifs. The radii report the distance of the most distant binding site from the center of mass of all binding sites. The radius calculated for all primary binding sites of the N3(Pu) motifs is 0.52 Å, and 1.3 Å for the O2(Py) motifs. The O2 distributions are therefore more scattered than the N3 ones. The larger scatter around pyrimidines can be attributed to their ability to interact with ligands directed from both above (the majority) and below the base plane; purines strongly prefer ligands directed from above the plane (i.e. the 5′-end).
The N2(G) motif forms many contacts in protein complexes, with a particularly large number of water-mediated contacts. This is in contrast to the extremely low occurrence of N2(G)–water interactions in uncomplexed B-DNA structures (19). The motif has a well-defined distribution with a clear binding site near the guanine plane. Binding-site geometries are given in Table 3.
Guanine could simultaneously form two hydrogen bonds with two ligands by its minor groove atoms N2 and N3. Ligands L2 and L3 could then form an additional hydrogen bond in a system N2–L2–L3–N3 but such a system was observed extremely rarely. Only a few protein atoms were found binding at the same time to N3 and N2 in a simpler system N2–L3–N3. The low occurrence of the system N2–L2–L3–N3 is in part a consequence of the relative positions of N2, N3 and their binding sites. In protein–DNA motifs, the distance between the sites L2 and L3 is 2.2 Å, and in the protein–water–DNA motif is 2.5 Å. These distances are shorter than the optimal hydrogen bonding distance. However, a relatively small displacement from the average binding site could optimize the hydrogen binding between ligands L2 and L3. Even so, regardless of the distance between L2 and L3, the angles of the putative hydrogen bonds would be unfavorable; the angle N2–L2–L3 is 78° and N3–L3–L2 is 88° and both values are far from the optimal value of ∼120°.
Patterns of interaction around the deoxyribose oxygen atom O4′
Distributions of contacts around the O4′ atom are shown in Figure 2, and the geometries of the averaged binding sites are given in Table 3. There are more hydrophobic than polar contacts in all O4′ motifs (Table 2). Their predominance becomes apparent when the O4′ motifs are compared with the N3/O2 motifs, where polar contacts are dominant. Hydrophobic contacts dominate in the O4′ motifs as many are secondary contacts accompanying energetically more favorable hydrogen bonding to N3/O2. In a similar way to the N3/O2 motifs, water molecules mediate a substantial number of the polar contacts in protein complexes and are rare in the drug motifs involving O4′.
Maps of the O4′ distributions are in general more diffuse and occupy significantly larger volumes than distributions of the N3/O2 base motifs. The radius of the sphere that encloses all the binding sites of O4′ motifs is 2.5 Å. Most O4′ distributions still correspond to just one binding site. The binding sites of all O4′ distributions are in such positions that they may connect the deoxyribose O4′ with the N3/O2 atoms of the previous base. This effect is more pronounced for hydrophobic interactions.
Polar contacts, especially to proteins, tend to form more diffuse distributions than hydrophobic contacts. Broad polar distributions have a simple explanation. Similar to the hydrophobic contacts, most polar interactions are in such positions that they can form a bridge between atoms O4′ and N3/O2 of the previous base. In addition, a few polar contacts form a cooperative bond between O4′ and N3/O2 within an individual nucleotide. Averaging of these two types of contact results in broadening of the distributions.
Composite patterns
Table 4 lists basic statistics for composite motifs, in which one or two ligand atoms interact with two DNA minor groove atoms. It should be stressed that all such contacts had been analyzed previously as part of one of the motifs discussed above. Table 4 shows that contacts between two nucleotides are much more frequent than contacts within a nucleotide. The frequency of the dinucleotide base–base and deoxyribose–base motifs is approximately the same. Each motif produced several binding sites. The only sites to be independent were those that did not overlap on applying the transformation T as discussed in the Materials and Methods. Most single-atom motifs have one independent binding site, and most two-atom motifs have two. This indicates a strong stereochemical preference for optimal binding sites.
Table 4. Numbers of composite motifs with one interacting ligand atom and two interacting ligand atoms.

Indexes (i) and (i + 1) label studied nucleotides in one strand, x and x ± 1 label nucleotides in the opposite stand. Numbers of contacts in the ‘Protein–DNA’ columns include water-mediated contacts. The number of water-mediated drug–DNA contacts is negligible. Contacts of dimer–drug binding complexes were not analyzed for inter-strand contacts.
In general, binding sites in the two-atom motifs have geometries that are more similar to those of the basic motifs as two interacting ligand atoms in the two-atom motifs can independently optimize their positions. The binding sites of hydrophobic two-atom motifs are mostly located close to O4′ atoms, with a low propensity to form hydrogen bonds, whereas polar contacts generally prefer the surroundings of base atoms N3/O2. Polar bonds to the base atoms form primary, well-oriented hydrogen bonds, which are stabilized by hydrophobic contacts to O4′.
Dinucleotide motifs
The second nucleotide (labeled i + 1) in each interacting dinucleotide was superimposed over the averaged mononucleotide template. Superposition of the complete dinucleotide led to high root mean square deviations, of ∼0.5 Å, due to large variations in DNA backbone geometry in the set of structures studied.
(O4′)i + 1–(N3/O2)i motifs. Polar protein contacts to purine nucleotides produce two independent binding sites in one-atom motifs and three in two-atom motifs. One- and two-atom protein binding produces binding sites with similar geometry whereas drug-binding sites are different for one- and two-atom motifs. The one-atom motif has a similar position near O4′, as in the basic O4′ motif (see above), whereas the two-atom motive is shifted towards the base. A significant number of one-atom connections are formed by water molecules. Hydrophobic protein contacts in both one- and two-atom motifs are formed mostly by phenylalanine (Phe) residues, for those complexes with distorted DNA geometry. All hydrophobic drug interactions are made simultaneously by two-ligand atoms, and the geometries of their two binding sites are similar to those of the basic motifs.
Basei + 1–basei motifs. One-atom contacts are observed only in proteins, with the binding sites having similar geometry parameters to the sites in the basic motifs. Contacts in the two-atom motifs produce the same binding sites as observed for the basic motifs in both drug and protein complexes. Hydrophobic contacts are rarely observed.
O4′i + 1–O4′i motifs. In this one-atom motif, only the hydrophobic contacts of drugs produce one independent binding site, all other types of contacts producing two independent sites. This is just another manifestation of the more diffuse binding to the deoxyribose O4′ atom. Geometries of polar binding differ from those of the O4′ basic motif. In drug binding, there is an apparent shift of the binding sites towards each other to a mutual distance of 1.9 Å, whereas in protein complexes atoms are situated near the base planes ∼2.6 Å apart. Geometries of contacts of the two-atom motives are similar to the interactions of the basic motives.
Mononucleotide motifs (O4′–N3/O2)
Two-atom connections have different geometries for drugs and proteins. The geometry of protein binding does not depend on residue type and the binding sites are near the positions for the basic motifs. Drug binding resembles the binding of the basic motifs for pyrimidine residues whereas in purines there is an apparent change in positions of both base and sugar sites.
Statistics for the mononucleotide motifs are given in Table 4. It shows that the numbers of one-atom contacts are lower in the mononucleotide O4′i–basei motifs than in the O4′i + 1–basei motifs despite the similarity of the average distances between the O2/N3 and O4′ atoms. Some of these average distances in a large sample of B-DNA molecules are: O4′i–O2i, 3.6 Å; O4′i–N3i, 3.8 Å; N3i–O4′i + 1, 3.9 Å; N3i–N3i + 1, 3.9 Å; O2i–O4′i + 1, 4.0 Å; O2i–O2i + 1, 4.1 Å; O4′i–O4′i + 1, 4.8 Å.
In order to investigate whether these small differences in inter-atomic distance can explain the differences in frequencies of one-atom motifs from Table 4, energies of the averaged motifs have been compared with energies of a hydrogen bonding system in the optimal geometry. Both dinucleotide and mononucleotide motifs were modeled as one hydrogen donor, ligand D and two acceptors, DNA minor groove atoms A1 and A2 in an Acceptor . . . Donor . . . Acceptor (A1 . . . D . . . A2) system. An example of such a system is shown in Figure 3A. The influence of deformation in the A1 . . . D . . . A2 system was estimated by assuming that one hydrogen bond, A1 . . . D, was optimal. Deformation energies of the other bond, D . . . A2, were calculated around four starting geometries corresponding to the respective geometries of ligand binding to the basei–O4′i, basei–O4′i + 1, basei–basei + 1 and O4′i–O4′i + 1 motifs. The position of ligand D relative to the DNA acceptor A2 was estimated by the binding site position in each motif (Table 3) and the system D . . . A2 was modeled as a water dimer (Fig. 3B).
Figure 3.
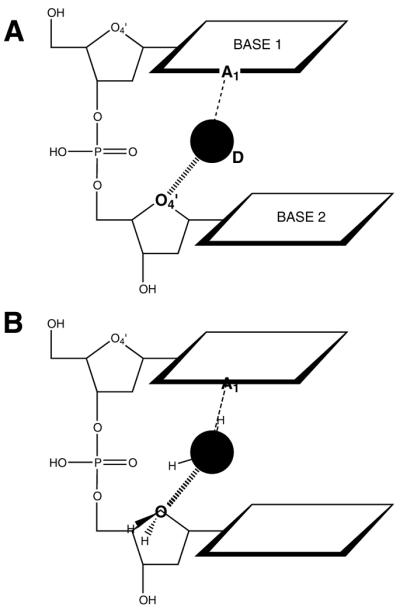
Interactions for a dinucleotide motif and their quantum chemical modeling. (A) The ligand, D, hydrogen bond donor, interacts with base atom A1 and deoxyribose O4′, both acceptors. (B) The system (A) simplified as a water dimer: the interaction between A1 and D is assumed to have ideal geometry and the D . . . O4′ hydrogen bond was modeled as a water dimer.
Deformation energies of hydrogen bonding between D and A2 were calculated using the Gaussian program (20) with the 6–31 + G bases set, together with the MP2 method for estimation of correlation energy. The deformations were modeled by systematically changing (i) the angle O1 . . . H2–O2 when the mirror plane of the water dimer is conserved, (ii) the same angle without conservation of the mirror plane, (iii) the distance O1 . . . O2 due to changes in angle O1 . . . H2–O2 and (iv) torsion H1–O1 . . . O2–H2. Each parameter was systematically varied in 40 –60 steps and their deformation energies were estimated from the constructed curves.
The results show that any deformation considered causes the largest loss of energy in the mononucleotide O4′i–basei motif. The deformation penalties were ∼10 kJ/mol for angle deformations (i) and (ii), 2 kJ/mol for the distance variations [see (iii) above], and only 0.5 kJ/mol for torsion deformations. These penalties are at least twice as high as for any of the other composite motifs for each type of deformation. Deformations following interactions of proteins and drugs with the B-DNA minor groove are more complex than the simple model used here, but it does suggest that the finding that the deformation penalties of the O4′i–basei motifs are always highest, and may contribute to their low occurrence.
Binding of different amino acids
The frequencies of interaction of different amino acids with atoms of the DNA minor groove are shown in Figure 4. Three amino acids, arginine (Arg), asparagine (Asn) and Phe, form most contacts, and geometries of their binding were studied in most detail. Arg is found in most complexes studied whereas Asn and Phe binding in the minor groove are found only in seven protein–DNA complexes in the studied sample (NDB codes pde009, pde016, pdr031, pdt009, pdt012, pdt025, pdt036; for references see Table 1). These structures, mostly complexes of TATA-box binding proteins, have sharply bent DNA in regions where Asn and Phe bind.
Figure 4.
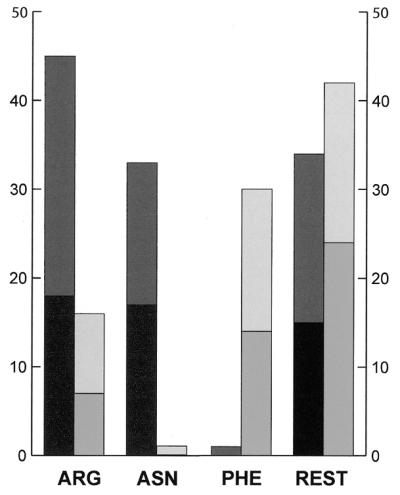
Frequencies of binding of amino acids arginine (ARG), asparagine (ASN), phenylalanine (PHE) and the remaining seventeen amino acids (REST) to purine N3 and pyrimidine O2. For each amino acid, dark gray bars on the left show numbers of contacts of polar amino acid atoms, and light gray bars on the right show numbers of contacts of hydrophobic amino acid atoms; the upper bar always shows numbers of contacts to O2, the lower bar to N3.
Binding of Arg, Asn and Phe to bases. The distributions of Arg atoms, both polar and hydrophobic, in the purine N3 and pyrimidine O2 motifs are indistinguishable from distributions of other amino acids except Asn and Phe. Thus, the Arg NH nitrogen atoms form well-defined hydrogen bonds to N3/O2 at similar positions to the polar atoms of the other amino acids. As a consequence, the adjacent Arg atom CZ can approach within 3.4 Å of the base atoms N3/O2 and these hydrophobic interactions contribute to the observed secondary hydrophobic peak in the distribution.
Most Asn and Phe contacts are cooperative contacts to two consecutive nucleotides in those regions of DNA where it is bent. Distributions of these contacts are distinct from the distributions of amino acid contacts in straight DNA. The binding sites are located above the purine base plane (2.7 Å for Asn, 3.1 Å for Phe) to enable interaction with two subsequent bases. There are a few instances of Asn and Phe residues that bind to straight DNA, where there is binding to one nucleotide only.
Binding of Arg, Asn and Phe to deoxyribose O4′. The distribution of Arg contacts is again the same as the distribution of other amino acids. Asn and Phe make mostly hydrophobic contacts in complexes with bent DNA. For Asn, these hydrophobic contacts arise as a consequence of the simultaneous binding of the Asn atom ND or OD to two N3/O2 atoms of two nucleotides. An Asn hydrophobic atom, normally CB, can form a secondary contact to O4′. A small energetic contribution from such a van der Waals interaction can be significant in the overall stabilization of protein–DNA complex. The importance of the CB–O4′ interaction is supported by the tight overlap of Asn residues interacting with O4′ in the deformed complexes. A few polar Asn contacts were found only in complexes with straight DNA.
Deformation of the DNA backbone and binding of Asn and Phe. Both Asn and Phe deform DNA from its standard BI conformation in a distinct way. DNA deformation is localized between the first and second nucleotide to which the amino acid interacts, and is concentrated on a few backbone torsion angles. Table 5 shows that the Asn binding primarily affects torsion angles δ and ɛ, whereas for Phe angles δ, ɛ, ζ and χ are altered.
Table 5. DNA backbone torsion angles deformed by interaction with TATA-box proteins.

The ‘DNA–Asn’ values show torsion angles for nucleotides in contact with Asn, and ‘DNA–Phe’ shows torsion angles for nucleotides in contact with Phe. The ‘Average BI-DNA’ lists average torsion angles for the BI conformation, as calculated in Schneider et al. (82). Numbers in parentheses are standard estimated deviations. δ = C5′–C4′–C3′–O3′, ɛ = C4′–C3′–O3′–P, ζ = C3′–O3′–P–O5′, χ = O4′–C1′–N9/N1–C4/C2.
CONCLUSIONS
This study has shown that only purine N3, pyrimidine O2, guanine N2 and deoxyribose O4′ atoms are involved in DNA minor groove interactions with protein, drug and water molecules (Table 2). Contacts to N3 and O2 are the most frequent. These atoms form more polar than hydrophobic contacts whereas O4′ makes more hydrophobic than polar contacts. Many of these hydrophobic contacts are secondary ones accompanying energetically more favorable hydrogen bonding to N3/O2.
The density distributions around the N3 atom are significantly more compact than distributions around O2 (Fig. 1). Binding sites are in similar positions for all motifs (Table 3) and the N3 and O2 sites occupy analogous positions around the bases. All binding sites are shifted above the plane of a base in the 5′ direction. The guanine N2 binding motifs have well-defined distributions with single binding sites. Simultaneous binding to guanine N3 and N2 is observed rarely, cooperative binding of two ligands to N3 and N2 is not observed.
The stability of positions of the binding sites relative to the bases reflects the fact that spacing between hydrogen bond donors is crucial for effective minor groove binding. This explains the observation of a lack of correlation between the geometric properties of the minor groove hydrogen bonds and the nature of the DNA ligand (6).
Distributions around O4′ are, in general, more diffuse than for the base atoms but most of them still have just one binding site (Fig. 2). Contacts between bases and sugars from two consecutive nucleotides are much more frequent than base–sugar contacts within one nucleotide. The probable reason for this is the large energy of deformation of hydrogen bonds for the one nucleotide motif. Connections involving both DNA strands are less frequent than those within a strand.
Many protein contacts to bases are mediated by water, especially interactions to N2(G) (Table 2). We suggest that amino acids, most of which have flexible side chains, are able to optimize their interactions by employing water molecules as mediators, possibly to increase the effective contact surface. This is in agreement with the finding that water molecules at the protein–DNA interfaces fill up the cavities between both macromolecules and enable close packing of their interfaces (9). In contrast, only a few water-mediated contacts have been observed in drug complexes. More rigid drug molecules interact with the minor groove atoms more or less as a single entity and either do not require or are unable to use water for optimizing their interactions with DNA.
Water distributions were found to be the most compact of all the distributions studied here. This apparent contradiction has a simple explanation. A water molecule has the highest degree of freedom of all ligands and consequently is more readily able to optimize its position relative to the DNA. In this context, it is not surprising that water molecules can act as effective probes of nucleic acid binding sites (21).
The present sample of protein–DNA complexes shows that three amino acids, Arg, Asn and Phe, bind to the minor groove more frequently than any others. Arg is the most frequent amino acid ligand of all, in agreement with its high propensity for protein–DNA interfaces (8). Both the polar and hydrophobic contacts of Arg are, in principle, stereochemically indistinguishable from binding of other amino acids, apart from Arg, Asn and Phe.
The stereochemistry of Asn and Phe binding differs from other amino acids and each other. They bind mostly to the minor groove of a sharply bent DNA helix, as in the complexes of TATA-box binding proteins. These Asn and Phe residues cooperatively contact two consecutive nucleotides and distributions of interacting atoms of these two amino acids are distinct from the distributions of the other amino acid contacts in straight DNA. The DNA backbone is characteristically deformed at the nucleotides to which Asn and Phe bind. The deformations are primarily at the backbone torsion angles δ and ɛ in case of Asn, and δ, ɛ, ζ and especially χ for Phe binding (Table 5).
Binding of Phe from TATA-box binding proteins is known to cause extensive DNA deformation by unstacking two consecutive bases as a result of the Phe aromatic ring wedged between them (22–25). The deformation is accompanied and perhaps stabilized by the interaction of sterically close Asn and the resulting DNA deformation is well-defined.
Acknowledgments
ACKNOWLEDGEMENTS
S.N. is grateful to the Cancer Research Campaign for support of these studies (Grant SP1384). Part of this work was performed while B.S. was a visiting Haddow Fellow at The Institute of Cancer Research. B.S. is supported by grant LN00A032 from the Ministry of Education of the Czech Republic.
REFERENCES
- 1.Wemmer D.E. and Dervan,P.B. (1997) Targeting the minor groove of DNA. Curr. Opin. Struct. Biol., 7, 355–361. [DOI] [PubMed] [Google Scholar]
- 2.Reddy B.S.P., Sondhi,S.M. and Lown,J.W. (1999) Synthetic DNA minor-groove binding drugs. Pharmacol. Ther., 84, 1–111. [DOI] [PubMed] [Google Scholar]
- 3.Neidle S. (2001) DNA minor-groove recognition by small molecules. Natural Prod. Rep., 18, 291–309. [DOI] [PubMed] [Google Scholar]
- 4.Dervan P.B. and Buerli,R.W. (1999) Sequence-specific DNA recognition by polyamides. Curr. Opin. Chem. Biol., 3, 688–693. [DOI] [PubMed] [Google Scholar]
- 5.Neidle S. (1997) Crystallographic insights into DNA minor groove recognition by drugs. Biopolymers, 44, 105–121. [Google Scholar]
- 6.Tabernero L., Bella,J. and Alemán,C. (1996) Hydrogen bond geometry in DNA-minor groove binding drug complexes. Nucleic Acids Res., 24, 3458–3466. [DOI] [PMC free article] [PubMed] [Google Scholar]
- 7.Mandel-Gutfreund Y., Schueler,O. and Margalit,H. (1995) Comprehensive analysis of hydrogen bonds in regulatory protein DNA-complexes: in search of common principles. J. Mol. Biol., 253, 370–382. [DOI] [PubMed] [Google Scholar]
- 8.Jones S., van Heyningen,P., Berman,H.M. and Thornton,J.M. (1999) Protein–DNA interactions: a structural analysis. J. Mol. Biol., 287, 877–896. [DOI] [PubMed] [Google Scholar]
- 9.Nadassy K., Wodak,S.J. and Janin,J. (1999) Structural features of protein-nucleic acid recognition sites. Biochemistry, 38, 1999–2017. [DOI] [PubMed] [Google Scholar]
- 10.Pabo C.O. and Nekludova,L. (2000) Geometric analysis and comparison of protein–DNA interfaces: why is there no simple code for recognition? J. Mol. Biol., 301, 597–624. [DOI] [PubMed] [Google Scholar]
- 11.Luscombe N.M., Laskowski,R.A. and Thornton,J.M. (2001) Amino acid-base interactions: a three-dimensional analysis of protein–DNA interactions at an atomic level. Nucleic Acids Res., 29, 2860–2874. [DOI] [PMC free article] [PubMed] [Google Scholar]
- 12.Suzuki M., Brenner,S.E., Gerstein,M. and Yagi,N. (1995) DNA recognition code of transcription factors. Protein Eng., 8, 319–328. [DOI] [PubMed] [Google Scholar]
- 13.Gray S. (2001) Rules for 3D protein–DNA interactions. Trends Genet., 17, 494–494. [Google Scholar]
- 14.Berman H.M., Olson,W.K., Beveridge,D.L., Westbrook,J., Gelbin,A., Demeny,T., Hsieh,S.-H., Srinivasan,A.R. and Schneider,B. (1992) The Nucleic Acid Database—a comprehensive relational database of three-dimensional structures of nucleic acids. Biophys. J., 63, 751–759. [DOI] [PMC free article] [PubMed] [Google Scholar]
- 15.Cohen D., Vadaparty,K. and Dickinson,B. (1995) Efficient algorithms for distance queries in macromolecular structure databases. University of Pittsburgh, Pittsburgh, PA.
- 16.Clowney L., Jain,S.C., Srinivasan,A.R., Westbrook,J., Olson,W.K. and Berman,H.M. (1996) Geometric parameters in nucleic acids: nitrogenous bases. J. Am. Chem. Soc., 118, 509–518. [Google Scholar]
- 17.Jones T.A., Zou,J.-Y., Cowan,S.W. and Kjeldgaard,M. (1991) Improved methods for building protein models in electron density maps and the location of errors in these models. Acta Crystallogr. A, 47, 110–119. [DOI] [PubMed] [Google Scholar]
- 18.Schneider B., Cohen,D.M., Schleifer,L., Srinivasan,A.R., Olson,W.K. and Berman,H.M. (1993) A systematic method for studying the spatial distribution of water molecules around nucleic acid bases. Biophys. J., 65, 2291–2303. [DOI] [PMC free article] [PubMed] [Google Scholar]
- 19.Schneider B. and Berman,H.M. (1995) Hydration of the DNA bases is local. Biophys. J., 69, 2661–2669. [DOI] [PMC free article] [PubMed] [Google Scholar]
- 20.Frisch M.J., Trucks,G.W., Schlegel,H.B., Gill,P.M.W., Johnson,B.G., Robb,M.A., Cheeseman,J.R., Keith,T., Petersson,G.A., Montgomery,J.A., Raghavachari,K., Al-Laham,M.A., Zakrzewski,V.G., Ortiz,J.V., Foresman,J.B., Cioslowski,J., Stefanov,B.B., Nanayakkara,A., Challacombe,M., Peng,C.Y., Ayala,P.Y., Chen,W., Wong,M.W., Andres,J.L., Replogle,E.S., Gomperts,R., Martin,R.L., Fox,D.J., Binkley,J.S., Defries,D.J., Baker,J., Stewart,J.P., Head-Gordon,M., Gonzalez,C. and Pople,J.A. (1995) Gaussian 94, Revision E.2. Gaussian Inc., Pittsburgh, PA.
- 21.Woda J., Schneider,B., Patel,K., Mistry,K. and Berman,H.M. (1998) An analysis of the relationship between hydration and protein–DNA interactions. Biophys. J., 75, 2170–2177. [DOI] [PMC free article] [PubMed] [Google Scholar]
- 22.Juo Z.S., Chiu,T.K., Leiberman,P.M., Baikalov,I., Berk,A.J. and Dickerson,R.E. (1996) How proteins recognize the TATA box. J. Mol. Biol., 261, 239–254. [DOI] [PubMed] [Google Scholar]
- 23.Kim J.L. and Burley,S.K. (1994) 1.9 Å Resolution refined structure of TBP recognizing the minor groove of TATAAAAG. Nature Struct. Biol., 1, 638–653. [DOI] [PubMed] [Google Scholar]
- 24.Kim Y., Geiger,J.H., Hahn,S. and Sigler,P.B. (1993) Crystal structure of a yeast TBP/TATA-box complex. Nature, 365, 512–520. [DOI] [PubMed] [Google Scholar]
- 25.Kosa P.F., Ghosh,G., Dedecker,B.S. and Sigler,P.B. (1997) The 2.1-Å crystal structure of an archaeal preinitiation complex: TATA-box-binding protein/transcription factor (II)B core/TATA-box. Proc. Natl Acad. Sci. USA, 94, 6042–6047. [DOI] [PMC free article] [PubMed] [Google Scholar]
- 26.Kim Y., Grable,J.C., Love,R., Greene,P.J. and Rosenberg,J.M. (1990) Refinement of EcoRI endonuclease crystal structure: a revised protein chain tracing. Science, 249, 1307–1309. [DOI] [PubMed] [Google Scholar]
- 27.Weston S.A., Lahm,A. and Suck,D. (1992) X-ray structure of the DNase I-d(GGTATACC)2 complex at 2.3 Å resolution. J. Mol. Biol., 226, 1237–1256. [DOI] [PubMed] [Google Scholar]
- 28.Lahm A. and Suck,D. (1991) DNase I-induced DNA conformation. 2 Å Structure of a DNase I–octamer complex. J. Mol. Biol., 221, 645–667. [DOI] [PubMed] [Google Scholar]
- 29.Feng J.A., Johnson,R.C. and Dickerson,R.E. (1994) Hin recombinase bound to DNA—the origin of specificity in major and minor groove interactions. Science, 263, 348–355. [DOI] [PubMed] [Google Scholar]
- 30.Buckle A.M. and Fersht,A.R. (1994) Subsite binding in an RNase: structure of a barnase-tetranucleotide complex at 1.76 Å resolution. Biochemistry, 33, 1644–1653. [DOI] [PubMed] [Google Scholar]
- 31.Birdsall D.L. and McPherson,A. (1992) Crystal structure disposition of thymidylic acid tetramer in complex with ribonuclease A. J. Biol. Chem., 267, 22230–22236. [PubMed] [Google Scholar]
- 32.Fontecilla-Camps J.C., de Llorens,R., le Du,M.H. and Cuchillo,C.M. (1994) Crystal structure of the ribonuclease A–d(ApTpApApG) complex. Direct evidence for extended substrate recognition. J. Biol. Chem., 269, 21526–21531. [DOI] [PubMed] [Google Scholar]
- 33.Sawaya M.R., Prasad,R., Wilson,S.H., Kraut,J. and Pelletier,H. (1997) Crystal structures of human DNA polymerase beta complexed with gapped and nicked DNA: evidence for an induced fit mechanism. Biochemistry, 36, 11205–11215. [DOI] [PubMed] [Google Scholar]
- 34.van Pouderoyen G., Ketting,R.F., Perrakis,A., Plasterk,R.H.A. and Sixma,T.K. (1997) Crystal structure of the specific DNA-binding domain of Tc3 transposase of C.elegans in complex with transposon DNA. EMBO J., 16, 6044–6054. [DOI] [PMC free article] [PubMed] [Google Scholar]
- 35.Doublié S., Tabor,S., Richardson,C. and Ellenberger,T. (1998) Crystal structure of a bacteriophage T7 DNA replication complex at 2.2 Å resolution. Nature, 391, 251–258. [DOI] [PubMed] [Google Scholar]
- 36.Brautigam C.A. and Steitz,T.A. (1998) Structural principles for the inhibition of the 3′–5′ exonuclease activity of Escherichia coli DNA polymerase I by phosphorothioates. J. Mol. Biol., 277, 363–377. [DOI] [PubMed] [Google Scholar]
- 37.Horton N.C., Newberry,K.J. and Perona,J.J. (1998) Metal ion-mediated substance-assisted catalysis in type II restriction endonucleases. Proc. Natl Acad. Sci. USA, 95, 13489–13494. [DOI] [PMC free article] [PubMed] [Google Scholar]
- 38.Kostrewa D. and Winkler,F.K. (1995) Mg2+ binding to the active site of EcoRV endonuclease: a crystallographic study of complexes with substrate and product DNA at 2 Å resolution. Biochemistry, 34, 683–696. [DOI] [PubMed] [Google Scholar]
- 39.Redinbo M.R., Stewart,L., Kuhn,P., Champoux,J.J. and Hol,W.G.J. (1998) Crystal structures of human topoisomerase I in covalent and noncovalent complexes with DNA. Science, 279, 1504–1513. [DOI] [PubMed] [Google Scholar]
- 40.Flick K.E., Jurica,M.S., Monnat,R.J. and Stoddard,B.L. (1998) DNA binding and cleavage by the nuclear intron-encoded homing endonuclease I-PpoI. Nature, 394, 96–101. [DOI] [PubMed] [Google Scholar]
- 41.Martin A.M., Sam,M.D., Reich,N.O. and Perona,J.J. (1999) Structural and energetic origins of indirect readout in site-specifc DNA cleavage by a restriction endonuclease. Nature Struct. Biol., 6, 269–277. [DOI] [PubMed] [Google Scholar]
- 42.Newman M., Strzelecka,T., Dorner,L.F., Schildkraut,I. and Aggarwal,A.K. (1995) Structure of BamHI endonuclease bound to DNA: partial folding and unfolding on DNA binding. Science, 269, 656–663. [DOI] [PubMed] [Google Scholar]
- 43.Wilson D.S., Guenther,B., Desplan,C. and Kuriyan,J. (1995) High resolution crystal structure of a paired (Pax) class cooperative homeodomain dimer on DNA. Cell, 82, 709–719. [DOI] [PubMed] [Google Scholar]
- 44.Savva R., McAuley-Hecht,K., Brown,T. and Pearl,L. (1995) The structural basis of specific base-excision repair by uracil-DNA glycosylase. Nature, 373, 487–493. [DOI] [PubMed] [Google Scholar]
- 45.Wang J., Yu,P., Lin,T.C., Konigsberg,W.H. and Steitz,T.A. (1996) Crystal structures of an NH2-terminal fragment of T4 DNA polymerase and its complexes with single-stranded DNA and with divalent metal ions. Biochemistry, 35, 8110–8119. [DOI] [PubMed] [Google Scholar]
- 46.Perona J.J. and Martin,A.M. (1997) Conformational transitions and structural deformability of EcoRV endonuclease revealed by crystallographic analysis. J. Mol. Biol., 273, 207–225. [DOI] [PubMed] [Google Scholar]
- 47.Kumar S., Horton,J.R., Jones,G.D., Walker,R.T., Roberts,R.J. and Cheng,X. (1997) DNA containing 4′-thio-2′-deozycytidine inhibits methylation by HhaI methyltransferase. Nucleic Acids Res., 25, 2773–2783. [DOI] [PMC free article] [PubMed] [Google Scholar]
- 48.Bochkarev A., Pfuetzner,R.A., Edwards,A.M. and Frappier,L. (1997) Structure of the single-stranded-DNA-binding domain of replication protein A bound to DNA. Nature, 385, 176–181. [DOI] [PubMed] [Google Scholar]
- 49.Aggarwal A.K., Rodgers,D.W., Drottar,M., Ptashne,M. and Harrison,S.C. (1988) Recognition of a DNA operator by the repressor of phage 434: a view at high resolution. Science, 242, 899–907. [DOI] [PubMed] [Google Scholar]
- 50.Otwinowski Z., Schevitz,R.W., Zhang,R.-G., Lawson,C.L., Joachimiak,A., Marmorstein,R.Q., Luisi,B.F. and Sigler,P.B. (1988) Crystal structure of trp repressor/operator complex at atomic resolution. Nature, 335, 321–329. [DOI] [PubMed] [Google Scholar]
- 51.Shimon L.J.W. and Harrison,S.C. (1993) The phage 434 OR2/R1-69 complex at 2.5 Å resolution. J. Mol. Biol., 232, 826–838. [DOI] [PubMed] [Google Scholar]
- 52.Lawson C.L. and Carey,J. (1993) Tandem binding in crystals of a trp repressor/operator half-site complex. Nature, 366, 178–182. [DOI] [PubMed] [Google Scholar]
- 53.Rodgers D.W. and Harrison,S.C. (1993) The complex between phage 434 repression DNA-binding domain and operator site Or3: structural differences between consensus and non-consensus half-sites. Structure, 1, 227–240. [DOI] [PubMed] [Google Scholar]
- 54.Xu W.G., Rould,M.A., Jun,S., Desplan,C. and Pabo,C.O. (1995) Crystal structure of a paired domain-DNA complex at 2.5 Å resolution reveals structural basis for Pax developmental mutations. Cell, 80, 639–650. [DOI] [PubMed] [Google Scholar]
- 55.Rastinejad F., Perlmann,T., Evans,R.M. and Sigler,P.B. (1995) Structural determinants of nuclear receptor assembly on DNA direct repeats. Nature, 375, 203–211. [DOI] [PubMed] [Google Scholar]
- 56.Cho Y., Gorina,S., Jeffrey,P.D. and Pavletich,N.P. (1994) Crystal structure of a p53 tumor suppressor-DNA complex: understanding tumorigenic mutations. Science, 265, 346–355. [DOI] [PubMed] [Google Scholar]
- 57.Jacobson E.M., Li,P., Leon-del-Rio,A., Rosenfeld,M.G. and Aggarwal,A.K. (1997) Structure of Pit-1 POU domain bound to DNA as a dimer: unexpected arrangement and flexibility. Genes Dev., 11, 198–212. [DOI] [PubMed] [Google Scholar]
- 58.Tan S. and Richmond,T.J. (1998) Crystal structure of the yeast MAT alpha 2/MCM1/DNA ternary complex. Nature, 391, 660–666. [DOI] [PubMed] [Google Scholar]
- 59.Li T., Jin,Y., Vershon,A.K. and Wolberger,C. (1998) Crystal structure of the MATa1/MATα2 homeodomain heterodimer in complex with DNA containing an A-tract. Nucleic Acids Res., 26, 5707–5718. [DOI] [PMC free article] [PubMed] [Google Scholar]
- 60.Kim J.L., Nikolov,D.B. and Burley,S.K. (1993) Co-crystal structure of TBP recognizing the minor groove of a TATA element. Nature, 365, 520–527. [DOI] [PubMed] [Google Scholar]
- 61.Clark K.L., Halay,E.D., Lai,E. and Burley,S.K. (1993) Co-crystal structure of the HNF-3/Fork head DNA-recognition motif resembles histone H5. Nature, 364, 412–420. [DOI] [PubMed] [Google Scholar]
- 62.Ghosh G., Vanduyne,G., Ghosh,S. and Sigler,P.B. (1995) Structure of NF-kappa B p50 homodimer bound to a kappa B site. Nature, 373, 303–310. [DOI] [PubMed] [Google Scholar]
- 63.Li T., Stark,M.R., Johnson,A.D. and Wolberger,C. (1995) Crystal structure of the MAT 1/MAT alpha 2 homeodomain heterodimer bound to DNA. Science, 270, 262–269. [DOI] [PubMed] [Google Scholar]
- 64.Keller W., Konig,P. and Richmond,T.J. (1995) Crystal structure of a bZIP/DNA complex at 2.2 Å: determinants of DNA specific recognition. J. Mol. Biol., 254, 657–667. [DOI] [PubMed] [Google Scholar]
- 65.Gewirth D.T. and Sigler,P.B. (1995) The basis for half-site specificity explored through a non-cognate steroid receptor-DNA complex. Nature Struct. Biol., 2, 386–394. [DOI] [PubMed] [Google Scholar]
- 66.Hirsch J.A. and Aggarwal,A.K. (1995) Structure of the even-skipped homeodomain complexed to AT-rich DNA: new perspectives on homeodomain specificity. EMBO J., 14, 6280–6291. [DOI] [PMC free article] [PubMed] [Google Scholar]
- 67.Koenig P., Giraldo,R., Chapman,L. and Rhodes,D. (1996) Crystal structure of the DNA binding domain of yeast RAP1 in complex with a telomeric DNA site. Cell, 85, 125–136. [DOI] [PubMed] [Google Scholar]
- 68.Tan S., Hunziker,Y., Sargent,D.F. and Richmond,T.J. (1996) Crystal structure of a yeast TFIIA/TBP/DNA complex. Nature, 381, 127–134. [DOI] [PubMed] [Google Scholar]
- 69.Houbaviy H.B., Usheva,A., Shenk,T. and Burley,S.K. (1996) Cocrystal structure of YY1 bound to the adeno-associated virus P5 initiator. Proc. Natl Acad. Sci. USA, 93, 13577–13582. [DOI] [PMC free article] [PubMed] [Google Scholar]
- 70.Rice P.A., Yang,S.-W., Mizuuchi,K. and Nash,H.A. (1996) Crystal structure of an IHF-DNA complex: a protein-induced DNA U-turn. Cell, 87, 1295–1306. [DOI] [PubMed] [Google Scholar]
- 71.Tucker-Kellogg L., Rould,M.A., Chambers,K.A., Ades,S.E., Sauer,R.T. and Pabo,C.O. (1997) Engrailed (Gln50→Lys) homeodomain-DNA complex at 1.9 Å resolution: structural basis for enhanced affinity and altered specificity. Structure, 5, 1047–1054. [DOI] [PubMed] [Google Scholar]
- 72.Swaminathan K., Flynn,P., Reece,R.J. and Marmorstein,R. (1997) Crystal structure of a Put3-DNA complex reveals a novel mechanism for DNA recognition by a protein containing a Zn2Cys6 binuclear cluster. Nature Struct. Biol., 4, 751–759. [DOI] [PubMed] [Google Scholar]
- 73.Muller C.W. and Herrmann,B.G. (1997) Crystallographic structure of the T domain-DNA complex of the brachyury transcription factor. Nature, 389, 884–888. [DOI] [PubMed] [Google Scholar]
- 74.Chen X., Ramakrishnan,B., Rao,S.T. and Sundaralingam,M. (1994) Side by side binding of two distamycin a drugs in the minor groove of an alternating B-DNA duplex. Nature Struct. Biol., 1, 169–175. [DOI] [PubMed] [Google Scholar]
- 75.Kopka M.L., Goodsell,D.S., Han,G.W., Chiu,T.K., Lown,J.W. and Dickerson,R.E. (1997) Defining GC-specificity in the minor groove: side-by-side binding of the diimidazole. Structure, 5, 1033–1046. [DOI] [PubMed] [Google Scholar]
- 76.Quintana J.R., Lipanov,A.A. and Dickerson,R.E. (1991) Low-temperature crystallographic analysis of the binding of the hoechst-33258 to the double-helical DNA dodecamer C-G-C-G-A-A-T-T-C-G-C-G. Biochemistry, 30, 10294–10306. [DOI] [PubMed] [Google Scholar]
- 77.Brown D.G., Sanderson,M.R., Garman,E. and Neidle,S. (1992) Crystal structure of a berenil-d(CGCAAATTTGCG) complex. An example of drug-DNA recognition based on sequence-dependent structural features. J. Mol. Biol., 226, 481–490. [DOI] [PubMed] [Google Scholar]
- 78.Sriram M., van der Marel,G.A., Roelen,L.P.F., van Boom,J.H. and Wang,A.H.-J. (1992) Conformation of B-DNA containing O6-ethyl G•C base pairs stabilised by minor grove binding drugs: molecular structure of d[CGC(e6G)AATTCGCG] complexed with Hoechst 33258 or Hoechst 33342. EMBO J., 11, 225–232. [DOI] [PMC free article] [PubMed] [Google Scholar]
- 79.Wood A.A., Nunn,C.M., Czarny,A., Boykin,D.W. and Neidle,S. (1995) Variability in DNA minor groove width recognized by ligand binding: the crystal structure of a bis-benzimidazole compound bound to the DNA duplex d(CGCGAATTCGCG)(2). Nucleic Acids Res., 23, 3678–3684. [DOI] [PMC free article] [PubMed] [Google Scholar]
- 80.Chen X., Ramakrishnan,B. and Sundaralingam,M. (1997) Crystal structures of the side-by-side binding of distamycin to AT-containing DNA octamers d(ICITACIC) and d(ICATATIC). J. Mol. Biol., 267, 1157–1170. [DOI] [PubMed] [Google Scholar]
- 81.Chen X., Ramakrishnan,B. and Sundaralingam,M. (1995) Crystal structures of B-form DNA-RNA chimers complexed with distamycin. Nature Struct. Biol., 2, 733–735. [DOI] [PubMed] [Google Scholar]
- 82.Schneider B., Neidle,S. and Berman,H.M. (1997) Conformations of the sugar-phosphate backbone in helical DNA crystal structures. Biopolymers, 42, 113–124. [DOI] [PubMed] [Google Scholar]