

Abstract
Background:
Reduced kidney function is related to brain atrophy and higher risk of dementia. It is not known whether kidney impairment is associated with higher levels of circulating amyloid-β and brain amyloid-β deposition, which could contribute to elevated risk of dementia.
Objectives:
To investigate whether kidney impairment is associated with higher levels of circulating amyloid-β and brain amyloid-β deposition.
Methods:
This cross-sectional study was performed within the community–based Atherosclerosis Risk in Communities (ARIC) Study cohort. We used estimated glomerular filtration rate (eGFR) based on serum creatinine and cystatin C levels and urine albumin-to-creatinine ratio (ACR) to assess kidney function. Amyloid positivity was defined as a standardized uptake value ratios >1.2 measured with florbetapir positron emission tomography (PET) (n=340). Plasma amyloid-β1-40 and amyloid-β1-42 were measured using a fluorimetric bead-based immunoassay (n=2569).
Results:
Independent of demographic and cardiovascular risk factors, a doubling of ACR was associated with 1.10 (95%CI: 1.01,1.20) higher odds of brain amyloid positivity, but not eGFR (odds ratio per 15 ml/min/1.73m2 lower eGFR: 1.08; 95%CI: 0.95,1.23). A doubling of ACR was associated with a higher level of plasma amyloid-β1-40 (standardized difference: 0.12; 95%CI: 0.09,0.14) and higher plasma amyloid-β1-42 (0.08; 95%CI: 0.05,0.10). Lower eGFR was associated with higher plasma amyloid-β1-40 (0.36; 95%CI: 0.33,0.39) and higher amyloid-β1-42 (0.32; 95%CI: 0.29,0.35).
Conclusion:
Low clearance of amyloid-β and elevated brain amyloid positivity may link impaired kidney function with elevated risk of dementia. kidney function should be considered in interpreting amyloid biomarker results in clinical and research setting.
Keywords: Kidney, albuminuria, glomerular filtration rate, amyloid, Positron-Emission Tomography, Kidney function, plasma amyloid-β
Introduction
Patients with kidney impairment exhibit multiple features of accelerated brain aging [1]. Chronic kidney disease is strongly related to brain atrophy [2] and an elevated risk of all-cause dementia and Alzheimer’s disease [3]. Up to 50% of patients with mild to moderate chronic kidney disease have cognitive impairment, and some studies have estimated this proportion to be as high as 70% in patients with end stage kidney disease [1, 3, 4]. This association is not limited to advanced kidney impairment, as even mild to moderate degrees of kidney impairment are related to subclinical brain pathologies and decline in cognitive function [5, 6]. Despite the compelling evidence that individuals with kidney dysfunction are at a higher risk of cognitive impairment, the exact mechanisms behind this association remain unknown. A role for shared cardiovascular risk factors, such as hypertension, diabetes, and hyperlipidemia, has been implicated [1, 7]. However, multiple studies have demonstrated that kidney dysfunction is associated with cognitive impairment independent of these factors [6, 8–10], suggesting that other pathologic pathways such as neurodegenerative changes may play a role.
The kidney controls levels of many blood metabolites via its filtering and excretory functions [11, 12]. Several studies have suggested a role for the kidneys in clearance of plasma amyloid-β [11, 13–17]. Serum amyloid-β levels and brain amyloid-β deposition were found to be higher in patients with advanced kidney impairment compared to healthy controls, which might suggest that lowered kidney-mediated amyloid-β clearance can contribute to Alzheimer’s disease pathology in the brain [11, 14–16]. Liu et al., showed higher levels of serum amyloid-β levels in CKD patients compared to controls. Another study including CKD patients stages 3–5 and a control group found a stage-dependent plasma amyloid-β increase across CKD stages [18]. However, a secondary analysis of a randomized clinical trial including persons with memory complaints but free of dementia did not find an association between mild to moderate decline in the estimated glomerular filtration rate (eGFR) and cortical amyloid-β deposition [19]. There is lack of evidence to determine to what extent mild to moderate degrees of kidney impairment in a population-based setting are associated with brain amyloid deposition and levels of plasma amyloid-β, and whether the strength of this association varies between two measures of kidney function: the estimated glomerular filtration rate (eGFR) and urine albumin-to-creatinine ratio (ACR). eGFR is generally considered a measure of kidney filtration and decreased eGFR can be due to both vascular and nonvascular etiologies, whereas albuminuria, or higher ACR, is believed to be reflective of kidney damage or glomerular angiopathy secondary to microvascular endothelial inflammation, and frequently precedes a decline in eGFR [20]. We aimed to investigate the association of kidney function measures with both brain amyloid deposition, measured by florbetapir positron emission tomography (PET), and plasma amyloid-β levels in the community-based Atherosclerosis Risk in Communities (ARIC) Study cohort.
Methods
Population
The ARIC study is an ongoing prospective cohort study started in 1987 including 15,792 individuals aged between 45 and 64 years from four US communities (Washington County, MD; Forsyth County, NC; Jackson, MS; and suburban Minneapolis, MN). The ARIC–Neurocognitive Study (ARIC-NCS), a major ancillary study, included 6,471 participants who participated in the fifth ARIC visit (2011–2013). Among them, a subset of participants was invited for brain MRI and PET scanning to assess brain amyloid deposition; both scans were completed from 2011-2013. The participants who were invited for brain MRI included those with prior brain MRI as part of the cohort; those with low cognitive scores or cognitive decline by visit 5; and an age-stratified random sample of cognitively healthy participants. A subset of the participants who completed brain MRI scans were invited for PET scanning, as part of the ARIC-PET ancillary study, with additional exclusion criteria: heavy alcohol use, moderately severe kidney dysfunction (creatinine >2 mg/dL), prolonged (>450 milliseconds) QT interval, or study-diagnosed dementia. PET-scanning was performed in three of the sites (Washington County, MD; Forsyth County, NC; and Jackson, MS). After further exclusion of those who refused to participate, incomplete MRI scans, non-White or non-Black race, and no information on kidney function, data were available in 340 individuals (Further detail in Supplementary Figure 1) [21].
Plasma amyloid-β was quantified on a subset (N = 2,588) of ARIC-NCS participants enriched for cognitive impairment (low Mini-Mental State Examination (MMSE), or other cognitive domain tested at the visit 5 neuropsychological battery, or significant decline in performance on previously assessed cognitive test in ARIC). A random sample of cognitively normal participants were included as well. We excluded 7 participants with non-White or non-Black race and 12 Black participants at the Minnesota or Maryland field centers due to small numbers. This resulted in 2569 participants with eGFR data and 2304 with ACR information (Further detail in Supplementary Figure 1) [22].
The study was approved by each center’s institutional review board. All participants provided written informed consent.
Kidney function
Kidney function was assessed using eGFR and ACR, both from ARIC visit 5. We estimated eGFR from serum creatinine (eGFRcr) and cystatin C (eGFRcsy) and both (eGFRcrcys) using the CKD-EPI (CKD Epidemiology Collaboration) equation [23]. We also calculated eGFRcrcys using the recent equation without race [24]. Serum creatinine was measured using a creatinase enzymatic method on a Roche Modular P Chemistry Analyzer (Roche Diagnostics, Indianapolis, Indiana) and standardized to isotope-dilution mass spectrometry. Serum cystatin C level was measured by a turbidimetric method (Gentian AS, Moss, Norway). Measures were calibrated and standardized to International Federation of Clinical Chemistry and Laboratory Medicine (IFCC) reference [25]. All results are presented as 15 ml/min per 1.73 m2 decrement in eGFR levels.
A spot urine was collected at visit 5. Urine creatinine was measured by the modified kinetic Jaffé method and urine albumin by a nephelometric method on either the Dade Behring BN100 or the Beckman Image Nephelometer [26]. ACR (mg/g) was estimated by dividing urine albumin by urine creatinine. Because urine ACR values are not normally distributed, we used log base 2 transformed values to obtain values per 2-fold higher urine ACR.
We made categories of kidney function based on the cutoffs established by the Kidney Disease: Improving Global Outcomes (KDIGO) group: eGFRcrcys >60 ml/min per 1.73 m2 and ACR < 30 mg/g [27]. Participants were categorized to four groups: (1) “Normal” category included participants who met both criteria (n=1,092); (2) “Kidney damage-intact function” category included eGFRcrcys>60 and ACR >30 (n=203); (3) “No kidney damage-low kidney function” category included participants with eGFRcrcys<60 and ACR <30 (n=709); (4) “Kidney damage-low function” category included participants who met neither of the criteria (n=300).
Brain MRI PET and plasma amyloid-β
Brain MRI scans were obtained with a 3T MRI and read centrally at the Mayo Clinic. PET images were processed and quantified after co-registration with MRI (described in detail previously) [28, 29]. In short, an automated region of cerebellum gray was used as a reference for calculation of standardized uptake value ratios (SUVRs). Global cortical measures of florbetapir SUVRs were calculated as a weighted average of the following regions: orbitofrontal, prefrontal, and superior frontal cortices, lateral temporal, parietal, and occipital lobes, precuneus, and anterior and posterior cingulates. SUVR values followed a highly skewed distribution; therefore, we dichotomized SUVR at the sample median of 1.2 with values greater than 1.2 defined as abnormal florbetapir uptake (amyloid positivity) [28].
For measurements of plasma amyloid-β, EDTA whole blood samples after 12-hour fasting were collected. Samples were placed in an ice bath until plasma was separated out by centrifugation (10 minutes at 3000g in 4°C). Samples were then frozen and stored in −80°C freezers. The INNO-BIA assay (INNOGENETICS N.V, Ghent, Belgium) was used to measure amyloid-β1-42 and amyloid-β1-40 levels. Luminex 200 IS Total system detects fluorescence emitted from beads (xMAP microspheres; conjugate 1A) binding to amyloid-β1-40 and amyloid-β1-42. A five-parameter logistic regression model was used to relate the fluorescence intensities of six standards to their known amyloid concentrations. The resultant model predicts the concentrations of amyloid-β1-40 and amyloid-β1-42 from the measured fluorescence intensities in the samples by relating the observed fluorescence intensities to a standard curve. Intensities that were below the range of this curve could not be inferred. For these samples (Aβ1-42 n=29, Aβ1-40 n=3), the lower limits of detection threshold (12 pg/ml for Aβ1-42; 15 pg/ml for Aβ1-40) were assigned. We utilized amyloid-β1-40, amyloid-β1-42 and a ratio of them. For all analyses, the ratio term was base (2) log-transformed to account for skewness. We used standardized values of amyloid-β1-40, amyloid-β1-42 and the ratio in all analyses. Further details regarding measurement of plasma amyloid-β has been described previously [22, 30].
Assessment of other variables
All covariates were assessed at visit 5. Self-reported race was classified as Black or White. Cigarette smoking and alcohol consumption were assessed using questionnaires and were categorized as current, former, or never users. Diabetes was defined as self-reported history of physician diagnosis, antidiabetic medication use during the past 2 weeks, fasting blood glucose level ≥ 126 mg/dL, or nonfasting blood glucose level ≥ 200 mg/dL. Trained technicians measured blood pressure with participants sitting after 5-minute rest. Blood pressure was measured three times using a validated automatic sphygmomanometer (the Omron HEM-907 XL) and the average of the last two readings was recorded. Hypertension was defined as systolic blood pressure greater than 140 mm Hg or diastolic blood pressure greater than 90 mm Hg or using antihypertensive medications. History of cardiovascular disease events was defined as an adjudicated ARIC cardiovascular event after ARIC visit 1 and before visit 5 (including coronary heart disease and stroke). Plasma total cholesterol was measured using enzymatic methods.
Statistical analysis
Baseline characteristics of the study sample were examined overall and by kidney function categories and reported using means and standard deviations (SD) for continuous variables and percentages for categorical variables. ANOVA and Student’s t-test were used to test the difference for the continuous variables, and chi-squared test was used when comparing categorical variables. We used logistic regression models and linear regression models to evaluate the associations of kidney function markers with brain amyloid positivity and plasma amyloid-β levels, respectively. We examined the association in three models: a crude model, model 1 adjusted for age, sex, combination of race and field center (5-level variable) and model 2 additionally adjusted for prevalent hypertension, diabetes mellitus and history of a cardiovascular event since ARIC baseline, plasma total cholesterol, smoking and alcohol consumption. For analyses of the plasma amyloid levels, we performed the analysis of covariance, where age, sex, race and field center adjusted mean values of amyloid-β1-40, amyloid-β1-42, and the ratio were compared across four categories of kidney function. For all analyses of brain amyloid positivity, we used weights to account for the probability of selection into the ARIC-PET study at visit 5. Because we used weights, numbers of participants in the tables are not exact integers. We used a binomial assumption in the logistic models. A detailed description of PET-study inclusion criteria and allocated weights can be found elsewhere [21, 28]. Odds ratios, beta estimates, p-values and 95% confidence intervals were estimated per doubling in ACR and per 15 ml/min per 1.73 m2 decrement in eGFR levels, reflecting worse kidney function. We checked the linearity assumptions for multiple regression models by plotting and visual inspection of the residuals against the predictor variable. Based on previous literature,[5, 31] suggesting a U-shaped association between serum creatinine and brain outcomes, we further checked the nonlinear association of eGFRcr with brain amyloid positivity using splines with knot at 60 ml/min per 1.73 m2; we did not find evidence for nonlinearity. We also present scatter plots showing the correlation between kidney function measures and plasma amyloid-β (Supplementary Figure 2).
To put our findings in perspective, we compared the magnitudes of the associations of kidney dysfunction with the amyloid measures (i.e., the regression betas) with the betas associating chronological age (a major risk factor for higher amyloid load) with the amyloid measures, by taking a ratio of the beta coefficients. In addition, we repeated the analysis using eGFRcrcys calculated based on the equation without race. Since diabetic nephropathy is related to both kidney function and higher risk of dementia, we repeated the analysis adjusting additionally for HbA1c.
All analyses were done using R software, version R-3.6.0.
Results
Table 1 presents overall characteristics of the participants in both the amyloid PET study and plasma amyloid-β components. Participants with PET data had mean age of 76±5, 43% were male, 42% Black adults and had average eGFRcrcys of 66.5±17.6. Participants with plasma amyloid-β data had mean age of 77±5, 43% were male, 23% Black adults and had average eGFRcrcys of 63.0±18.4 (Table 1). Participants’ characteristics according to their kidney function status and ACR and eGFRcrcys strata are presented in Table 2 and Supplementary Table 1.
Table 1.
Participant characteristics: The ARIC Study 2011–2013
| Participants with PET data (n=340) | Participants with plasma amyloid-β data (n=2569) | |
|---|---|---|
| Age, yrs (mean (SD)) | 75.9 (5.3) | 77.2 (5.4) |
| Male (%) | 148 (43.5) | 1100 (42.8) |
| Race (%) | ||
| Black | 143 (42.1) | 582 (22.7) |
| White | 197 (57.9) | 1987 (77.3) |
| Smoking Status (%) | ||
| Current | 35 (10.5) | 248 (9.8) |
| Former | 141 (42.5) | 1097 (43.4) |
| Never | 156 (47.0) | 1174 (46.5) |
| Alcohol drinking Status (%) | ||
| Current | 128 (38.2) | 1123 (46.3) |
| Former | 117 (34.9) | 744 (30.7) |
| Never | 90 (26.9) | 556 (22.9) |
| Diabetes (%) | 120 (35.8) | 884 (35.6) |
| Hypertension (%) | 243 (72.1) | 1922 (76.1) |
| History of CVD event (%) | 36 (10.8) | 527 (20.8) |
| Total Cholesterol (SI U) (mean (SD)) | 4.7 (1.0) | 4.7 (1.10) |
| APOE e4 carriership (%) | 102 (30.0) | 734 (28.6) |
| eGFRcys, ml/min/1.73m2 (mean (SD)) | 61.9 (18.3) | 58.5 (19.4) |
| eGFRcr, ml/min/1.73m2 (mean (SD)) | 70.4 (17.2) | 67.4 (17.7) |
| eGFRcrcys, ml/min/1.73m2 (mean (SD)) | 66.5 (17.6) | 63.0 (18.4) |
| ACR, mg/g (median [IQR]) | 9.4 [5.8, 18.7] | 11.6 [6.7, 26.1] |
| Plasma Aβ1-40, pg/mL (mean (SD)) | 229.1 (75.5) | 239.4 (88.0) |
| Plasma Aβ1-42, pg/mL (mean (SD)) | 37.3 (10.2) | 37.9 (11.5) |
| Plasma Aβ1-42/1-40 ratio (median [25th, 75th percentile]) | 0.2 [0.1, 0.2] | 0.2 [0.1, 0.2] |
| Cognitive function status | ||
| Normal | 251 (73.8) | 1307 (50.9) |
| Mild cognitive impairment | 89 (26.2) | 1004 (39.1) |
| Dementia | 0 (0.0) | 256 (10.0) |
| Alzheimer’s Disease | 0 (0.0) | 168 (6.5) |
These variables had missing values in PET data: smoking (n=10), total cholesterol (n=1), hypertension (n=3), and diabetes mellitus (n=5), alcohol drinking status (n=8), CVD event (n=13).
These variables had missing values in plasma Aβ data: smoking (n=68), hypertension (n=43), and diabetes mellitus (n=84), alcohol drinking status (n= 68), CVD event (n=43).
Abbreviations: Aβ: amyloid-β; SD: standard deviation; CVD: cardiovascular disease; eGFRcr: estimated glomerular filtration rate based on creatinine; eGFRcys: estimated glomerular filtration rate based on cystatin C; eGFRcrcys: estimated glomerular filtration rate based on creatinine and cystatin C; ACR: albumin-to-creatinine ratio
Table 2.
Participant characteristics by kidney function categories in the plasma amyloid-β sample
| Normal (n=1,092) | Kidney damage-intact function(n=203) | No kidney damage-low function(n=709) | Kidney Damage-low function (n = 300) | P-value | |
|---|---|---|---|---|---|
| Age, yrs (mean (SD)) | 75.84 (5.00) | 77.19 (5.00) * | 78.58 (5.20) * | 79.35 (5.45) * | <0.001 |
| Male (%) | 509 (46.6) | 92 (45.3) | 272 (38.4) * | 158 (52.7) | <0.001 |
| Race (%) | <0.001 | ||||
| Black | 260 (23.8) | 70 (34.5) * | 118 (16.6) * | 72 (24.0) | |
| White | 832 (76.2) | 133 (65.5) | 591 (83.4) | 228 (76.0) | |
| Smoking Status (%) | 0.283 | ||||
| Current | 113 (10.6) | 27 (13.8) | 57 (8.2) | 32 (11.0) | |
| Former | 463 (43.5) | 88 (45.1) | 298 (43.1) | 138 (47.4) | |
| Never | 488 (45.8) | 80 (41.0) | 336 (48.6) | 121 (41.6) | |
| Alcohol drinking Status (%) | 0.001 | ||||
| Current | 541 (51.0) | 83 (42.8) * | 266 (40.8) * | 121 (43.1) | |
| Former | 307 (29.0) | 58 (29.9) | 220 (33.7) | 92 (32.7) | |
| Never | 212 (20.0) | 53 (27.3) | 166 (25.5) | 68 (24.2) | |
| Diabetes (%) | 335 (31.3) | 84 (42.2) * | 226 (33.0) | 158 (54.9) * | <0.001 |
| Hypertension (%) | 764 (70.7) | 164 (82.0) * | 550 (79.5) * | 269 (90.0) * | <0.001 |
| History of CVD event (%) | 181 (16.9) | 38 (19.0) | 169 (24.2) * | 98 (32.8) * | <0.001 |
| Total Cholesterol (SI U) (mean (SD)) | 4.69 (1.09) | 4.69 (1.13) | 4.59 (1.07) | 4.51 (1.19) * | 0.045 |
| APOE e4 carriership (%) | 344 (31.5) | 58 (28.7) | 176 (25.0) * | 72 (24.2) * | 0.008 |
| Cognitive function status | <0.001 | ||||
| Normal | 603 (55.2) | 92 (45.3) | 346 (48.8) * | 112 (37.3) * | |
| Mild cognitive impairment | 408 (37.4) | 92 (45.3) | 285 (40.2) | 140 (46.7) | |
| Dementia | 78 (7.1) | 18 (8.9) | 75 (10.6) | 48 (16.0) | |
| Alzheimer’s Disease | 56 (5.1) | 11 (5.4) | 48 (6.8) * | 28 (9.3) * | 0.050 |
Normal category indicates eGFR (based on creatinine and cystatin C) >60 ml/min per 1.73 m2 and albumin-to-creatinine ratio <30 mg/g (n=1,092). Kidney damage-intact function category indicates eGFR>60 ml/min per 1.73 m2 and albumin-to-creatinine ratio >30 mg/g (n=203). No kidney damage-low function
indicates P-value < 0.05 for the difference with “normal” category.
In the crude model, doubling in ACR was associated with a 1.17 (95%CI: 1.09, 1.27) higher odds of brain amyloid positivity (Table 2). Adjustment for potential confounders attenuated the estimates (1.10 (95%CI: 1.01, 1.20)). In the crude model, 15 ml/min/1.73 m2 lower eGFRcys was associated with 1.17 (95%CI: 1.07, 1.29) higher odds of brain amyloid positivity, but the association did not reach statistical significance after adjusting for potential confounders. eGFRcr and eGFRcrcys were not statistically significantly associated with brain amyloid positivity (all P-value >0.05).
After adjusting for potential confounders, doubling in ACR was associated with higher plasma amyloid-β1-40 (standardized difference: 0.12; 95%CI: 0.09, 0.14), higher amyloid-β1-42 (standardized difference: 0.08; 95%CI: 0.05, 0.10), and lower amyloid-β 1-42/1-40 ratio (standardized difference: 0.04; 95%CI: −0.06, −0.01). Lower levels of eGFRcr, eGFRcys and eGFRcrcys were associated with a higher plasma amyloid-β1-40 and amyloid-β1-42 and lower levels of amyloid-β 1-42/1-40 ratio (Table 2).
When ACR and eGFR were analyzed together using clinical cut points, there was evidence of dose-dependent relation between kidney impairment and plasma amyloid-β1-40 and amyloid-β1-42 (P for trend <0.001), indicating higher plasma amyloid-β1-40 and amyloid-β1-42 levels in persons with worse kidney function (Figure 1). For example, participants in the kidney damage-low function category (eGFR<60 ml/min per 1.73 m2 and albumin-to-creatinine ratio >30 mg/g) and those in no damage-low function category (eGFR<60 ml/min per 1.73 m2 and albumin-to-creatinine ratio <30 mg/g) had higher plasma amyloid-β1-40 and amyloid-β1-40 compared to participants in normal category (eGFR (>60 ml/min per 1.73 m2 and albumin-to-creatinine ratio <30 mg/g). In an extra analysis, we compared the effect estimates of chronological age with ACR and eGFRcrcys in relation to plasma and PET measurements of amyloid-β. Comparing the effect estimates of age with ACR in relation to amyloid positivity, we showed that a doubling in ACR may be equivalent to a 0.6 year increase in age. A doubling in ACR corresponds to higher amyloid-β1-40, amyloid-β1-42 and lower amyloid-β 1-42/1-40 ratio by amounts equal to 6.1, 6.5 and 3.6 years increase in age, respectively. Similarly, 15 ml/min/1.73 m2 lower eGFRcrcys had an estimated magnitude of association equal to 1.2, 18.5, 27.8 and 6 years increase in age for brain amyloid positivity, amyloid-β1-40, amyloid-β1-42 and decrease in amyloid-β 1-42/1-40 ratio, respectively (Supplementary Table 2). Using eGFRcrcys calculated based on the equation without race yielded in similar findings (Supplementary Table 3). Adjusting the analysis additionally for HbA1c did not change the findings (Supplementary Table 4).
Figure 1.
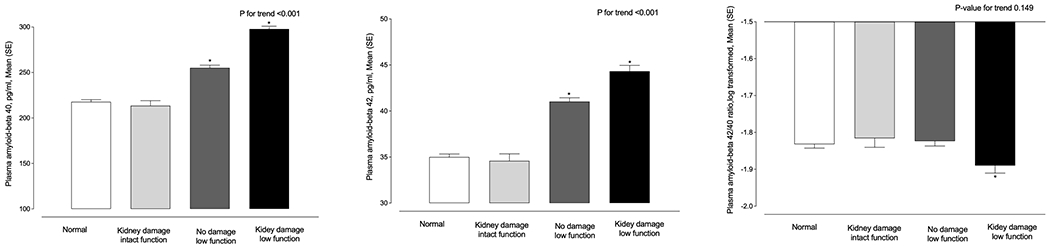
Participants with worse kidney function have higher plasma amyloid-β1-40, Aβ1-42 and lower Aβ 1-42/1-40 ratio: The ARIC Study 2011-2013
Marginal means and SEMs of plasma Aβ 1-40, Aβ 1-42, and Aβ 1-42/1-40 ratio levels in different categories of kidney function.
Normal category indicates eGFR (based on creatinine and cystatin C) >60 ml/min per 1.73 m2 and albumin-to-creatinine ratio <30 mg/g (n=1,092). Kidney damage-intact function category indicates eGFR>60 ml/min per 1.73 m2 and albumin-to-creatinine ratio >30 mg/g (n=203). No damage-low function category indicates eGFR<60 ml/min per 1.73 m2 and albumin-to-creatinine ratio <30 mg/g (n=709). Kidney damage-low function category indicates eGFR<60 ml/min per 1.73 m2 and albumin-to-creatinine ratio >30 mg/g (n=300). Means were adjusted for age, sex, race-field center.
*Indicates statistically significant different mean values compared to normal category.
Discussion
In this community–based study, higher ACR was associated with brain amyloid positivity independent of cardiovascular risk factors. However, lower eGFR was not independently statistically significantly associated with brain amyloid positivity. Higher ACR and lower eGFR were both associated independently with higher levels of plasma amyloid-β1-40 and amyloid-β1-42 and lower plasma amyloid-β1-42/1-40 ratio. When ACR and eGFR were analyzed together using clinical cut points, there was evidence of dose-dependent association between kidney function impairment and plasma amyloid levels. Our result is in agreement with multiple previous studies evaluating clearance of amyloid- β levels in kidney impairment [11, 13–16]. However, a secondary analysis of the Multidomain Alzheimer Preventive Trial (MAPT) randomized clinical trial including persons with memory complaints but free of dementia did not find an association between mild to moderate decline in the eGFR and cortical amyloid-β deposition [19]. Inclusion of relatively healthier participants with higher kidney function (eGFR: 72 compared to 66 in the current study) and less cardiovascular burden could be the reason for negative finding.
Plasma and PET measurements of amyloid-β have been increasingly used to improve the accuracy of the clinical diagnosis of Alzheimer’s disease and related dementias and to better understand the disease [17, 30, 32]. Impaired clearance of amyloid-β from the central nervous system (CNS) is posited to play a central role in the pathogenesis of Alzheimer’s disease. Peripheral amyloid-β clearance is suggested to contribute to reducing amyloid-β accumulation in the brain[13, 17] which results in lower ratio of amyloid β1-42/1-40 in both the CSF and plasma [33, 34]. Several studies have shown that kidneys may be involved in clearance of circulating amyloid-β [11, 13, 14]. Different mechanisms such as interstitial injury in CKD, decreased renal tissue integrity, tubular dysfunction, and inflammation have been suggested as factors that can result in amyloid-β accumulation [18]. As such, low clearance of plasma amyloid-β in patients with kidney impairment can potentially result in further deposition of amyloid-β in the brain and ultimately lead to cognitive decline. In a radioisotopic experiment, injected intracranial or intravenous I125-labelled amyloid-β was detected in the kidneys and urine suggesting the role of kidneys in clearance of amyloid-β [15]. In a chronic unilateral nephrectomy model in Alzheimer’s disease mice brain amyloid-β deposition and aggravated Alzheimer’s disease pathologies was observed [35]. Another study detected soluble amyloid-β in human urine [11]. Other studies investigating renal clearance of circulating amyloid-β found significantly higher circulating amyloid-β levels in CKD patients with low glomerular filtration rate compared to controls [11, 15, 16]. Here, we extend the literature and show that levels of plasma and cerebral amyloid-β are higher even in mild-moderate kidney impairment. Dialysis is suggested to decrease plasma amyloid-β levels and consequently decrease the deposition in the brain [14]. Wang et al. measured plasma amyloid-β levels before and immediately after peritoneal dialysis in patients with chronic kidney disease and in Alzheimer’s disease mice models [36]. In both cases, plasma amyloid-β1-40 and amyloid-β1-42 levels were significantly reduced after dialysis which could be considered as an understudied benefit of dialysis.
In this study, we observed that lower kidney function is associated with both higher plasma amyloid-β levels and brain amyloid positivity. The temporality of this association should be tested in future longitudinal studies with multiple measurements of amyloid-β in both plasma and brain. Although lower eGFR was associated with higher levels of plasma amyloid-β1-40 and amyloid-β1-42, but not brain amyloid positivity, our sample size was small and larger studies with a wider range of severity of kidney function and brain amyloid burden are needed. It is possible that only more severe kidney impairment, e.g. eGFR < 60 or 30 would be associated with brain amyloid positivity as this level of kidney dysfunction is also associated with more severe cognitive impairment [37]. Our analysis using splines with knot at 60 (data not shown) suggested a direct association between lower eGFRcr less than 60 and higher amyloid positivity; albeit not statistically significant. This work also underscores the necessity to account for kidney function in plasma biomarker development and interpretation in future clinical trial enrollment or clinical diagnostic models using amyloid-β measurements [38]. A limitation of our study is that urinary albumin and creatinine were based on a single spot urine sample rather than 24-hour urine sampling, which may have led to random misclassification of the exposure and potential underestimation of the true association between kidney dysfunction and amyloid-β levels.
Conclusions and clinical implications
We observed that worse kidney function as measured by eGFR is associated with higher circulating amyloid-β levels, and that kidney damage, as measured by ACR levels, is associated with both higher circulating amyloid-β levels and brain amyloid positivity, independent of demographic and vascular risk factors. Our findings extend previous literature by providing evidence for the potential role of neurodegeneration, specifically low clearance of amyloid-β, which may link impaired kidney function to amyloid-β pathology underlying cognitive impairment and dementia. In addition, our findings emphasize the need to consider kidney function in interpreting amyloid biomarker results in clinical trial enrollment, and clinical diagnostic decision making using amyloid levels.
Supplementary Material
Table 3.
Association of kidney function measures with brain amyloid positivity and plasma Aβ1-40, Aβ1-42, and Aβ1-42/1-40 ratio: The ARIC Study 2011-2013
| Crude model | Model I | Model II | |||||
|---|---|---|---|---|---|---|---|
| brain amyloid positivity* | |||||||
|
| |||||||
| Logistic regression | N/Case | Odds ratio (95%CI) | P-value | Odds ratio (95%CI) | P-value | Odds ratio (95%CI) | P-value |
| ACR, per doubling | 310/162 | 1.17 (1.09, 1.27) | <.001 | 1.12 (1.03, 1.22) | 0.007 | 1.10 (1.01, 1.20) | 0.035 |
| eGFRcr, per 15 decrements | 340/174 | 0.98 (0.88, 1.09) | 0.690 | 0.94 (0.83, 1.06) | 0.320 | 0.99 (0.87, 1.13) | 0.865 |
| eGFRcys, per 15 decrements | 340/174 | 1.17 (1.07, 1.29) | 0.001 | 1.08 (0.97, 1.21) | 0.168 | 1.13 (1.00, 1.28) | 0.053 |
| eGFRcrcys, per 15 decrements | 340/174 | 1.09 (0.98, 1.21) | 0.095 | 1.02 (0.91, 1.15) | 0.712 | 1.08 (0.95, 1.23) | 0.261 |
| Differences in plasma amyloid-β in relation to kidney function measures | |||||||
|
| |||||||
| Linear regression | N | Difference (95%CI) | P-value | Difference (95%CI) | P-value | Difference (95%CI) | P-value |
| Aβ 1-40 | |||||||
| ACR, per doubling | 2304 | 0.12 (0.10, 0.14) | <.001 | 0.12 (0.10, 0.14) | <.001 | 0.12 (0.09, 0.14) | <.001 |
| eGFRcr, per 15 decrements | 2569 | 0.35 (0.32, 0.38) | <.001 | 0.34 (0.31, 0.37) | <.001 | 0.35 (0.32, 0.38) | <.001 |
| eGFRcys, per 15 decrements | 2569 | 0.32 (0.29, 0.34) | <.001 | 0.32 (0.29, 0.35) | <.001 | 0.32 (0.29, 0.35) | <.001 |
| eGFRcrcys, per 15 decrements | 2569 | 0.36 (0.33, 0.38) | <.001 | 0.35 (0.32, 0.38) | <.001 | 0.36 (0.33, 0.39) | <.001 |
| Aβ 1-42 | |||||||
| ACR, per doubling | 2304 | 0.08 (0.06, 0.10) | <.001 | 0.08 (0.06, 0.10) | <.001 | 0.08 (0.05, 0.10) | <.001 |
| eGFRcr, per 15 decrements | 2569 | 0.33 (0.30, 0.36) | <.001 | 0.32 (0.29, 0.36) | <.001 | 0.32 (0.29, 0.36) | <.001 |
| eGFRcys, per 15 decrements | 2569 | 0.29 (0.26, 0.31) | <.001 | 0.29 (0.26, 0.32) | <.001 | 0.28 (0.25, 0.31) | <.001 |
| eGFRcrcys, per 15 decrements | 2569 | 0.33 (0.30, 0.36) | <.001 | 0.33 (0.30, 0.36) | <.001 | 0.32 (0.29, 0.35) | <.001 |
| Log Aβ 1-42/1-40 ratio | |||||||
| ACR, per doubling | 2304 | −0.04 (−0.06, −0.02) | <.001 | −0.04 (−0.06, −0.01) | 0.002 | −0.04 (−0.06, −0.01) | 0.003 |
| eGFRcr, per 15 decrements | 2569 | −0.05 (−0.08, −0.02) | 0.003 | −0.04 (−0.07, −0.01) | 0.022 | −0.05 (−0.09, −0.01) | 0.008 |
| eGFRcys, per 15 decrements | 2569 | −0.06 (−0.09, −0.03) | <.001 | −0.05 (−0.09, −0.02) | <.001 | −0.06 (−0.10, −0.03) | <.001 |
| eGFRcrcys, per 15 decrements | 2569 | −0.06 (−0.09, −0.03) | <.001 | −0.05 (−0.09, −0.02) | 0.002 | −0.06 (−0.10, −0.03) | <.001 |
Odds ratios and differences are calculated per 15 mL/min/1.73m2 decrement in eGFR and per doubling (log base 2 transformation) of ACR.
Defined as standardized uptake value ratios (SUVRs) greater than median value of 1.2
Model I was adjusted for sex, age and race-center. Model II was additionally adjusted for alcohol drinking and smoking status, history of diabetes mellitus, hypertension, cardiovascular event, and total cholesterol.
Abbreviations: eGFRcr: estimated glomerular filtration rate based on creatinine; eGFRcys: estimated glomerular filtration rate based on cystatin C; eGFRcrcys: estimated glomerular filtration rate based on creatinine and cystatin C; ACR: albumin-to-creatinine ratio; Aβ: amyloid-β; SD: standard deviation; CI: confidence interval.
Plasma amyloid-β levels are presented as standardized values (per standard deviation).
Aβ 1-40 mean (SD): 239 (88)
Aβ 1-42 mean (SD): 38 (11)
Log Aβ 1-42/1-40 ratio mean (SD): 0.2 (0.1)
Acknowledgement
The authors thank the staff and participants of the ARIC study for their important contributions.
Funding
The Atherosclerosis Risk in Communities Study is carried out as a collaborative study supported by National Heart, Lung, and Blood Institute contracts (75N92022D00001, 75N92022D00002, 75N92022D00003, 75N92022D00004, 75N92022D00005). The ARIC Neurocognitive Study is supported by U01HL096812, U01HL096814, U01HL096899, U01HL096902, U01HL096917 from the NIH (NHLBI, NINDS, NIA and NIDCD), and with previous brain MRI examinations funded by R01-HL70825 from the NHLBI. The ARIC-PET study is funded by the National Institute on Aging (grant R01AG040282). Sanaz Sedaghat is supported by a McKnight Clinical Translational Research Scholarship in Cognitive Aging and Age-Related Memory Loss. Pamela Lutsey is supported by K24 HL159246. Rebecca Gottesman is supported by the Intramural Research Program of the National Institute of Neurological Disorders and Stroke.
Footnotes
Disclosure
None
References
- [1].Bugnicourt JM, Godefroy O, Chillon JM, Choukroun G, Massy ZA (2013) Cognitive disorders and dementia in CKD: the neglected kidney-brain axis. J Am Soc Nephrol 24, 353–363. [DOI] [PubMed] [Google Scholar]
- [2].Toyoda K (2015) Cerebral small vessel disease and chronic kidney disease. J Stroke 17, 31–37. [DOI] [PMC free article] [PubMed] [Google Scholar]
- [3].Murray AM (2008) Cognitive impairment in the aging dialysis and chronic kidney disease populations: an occult burden. Adv Chronic Kidney Dis 15, 123–132. [DOI] [PMC free article] [PubMed] [Google Scholar]
- [4].Deckers K, Camerino I, van Boxtel MP, Verhey FR, Irving K, Brayne C, Kivipelto M, Starr JM, Yaffe K, de Leeuw PW, Kohler S (2017) Dementia risk in renal dysfunction: A systematic review and meta-analysis of prospective studies. Neurology 88, 198–208. [DOI] [PMC free article] [PubMed] [Google Scholar]
- [5].Sedaghat S, Cremers LG, de Groot M, Hoorn EJ, Hofman A, van der Lugt A, Franco OH, Vernooij MW, Dehghan A, Ikram MA (2015) Kidney function and microstructural integrity of brain white matter. Neurology 85, 154–161. [DOI] [PubMed] [Google Scholar]
- [6].Sedaghat S, Sorond F, Yaffe K, Sidney S, Kramer HJ, Jacobs DR Jr., Launer LJ, Carnethon MR (2020) Decline in kidney function over the course of adulthood and cognitive function in midlife. Neurology 95, e2389–e2397. [DOI] [PMC free article] [PubMed] [Google Scholar]
- [7].Lu R, Kiernan MC, Murray A, Rosner MH, Ronco C (2015) Kidney-brain crosstalk in the acute and chronic setting. Nat Rev Nephrol 11, 707–719. [DOI] [PubMed] [Google Scholar]
- [8].Koop-Nieuwelink C, Sedaghat S, Mutlu U, Licher S, Franco OH, Ikram MA, Geerlings MI, Ikram MK, Bos D (2019) Kidney Function and the Risk of Stroke and Dementia: The Rotterdam Study. J Alzheimers Dis 67, 821–826. [DOI] [PubMed] [Google Scholar]
- [9].Murray AM, Tupper DE, Knopman DS, Gilbertson DT, Pederson SL, Li S, Smith GE, Hochhalter AK, Collins AJ, Kane RL (2006) Cognitive impairment in hemodialysis patients is common. Neurology 67, 216–223. [DOI] [PubMed] [Google Scholar]
- [10].Akoudad S, Sedaghat S, Hofman A, Koudstaal PJ, van der Lugt A, Ikram MA, Vernooij MW (2015) Kidney function and cerebral small vessel disease in the general population. Int J Stroke 10, 603–608. [DOI] [PubMed] [Google Scholar]
- [11].Ghiso J, Calero M, Matsubara E, Governale S, Chuba J, Beavis R, Wisniewski T, Frangione B (1997) Alzheimer’s soluble amyloid beta is a normal component of human urine. FEBS Lett 408, 105–108. [DOI] [PubMed] [Google Scholar]
- [12].Wang J, Gu BJ, Masters CL, Wang YJ (2017) A systemic view of Alzheimer disease - insights from amyloid-beta metabolism beyond the brain. Nat Rev Neurol 13, 612–623. [DOI] [PubMed] [Google Scholar]
- [13].Cheng Y, Tian DY, Wang YJ (2020) Peripheral clearance of brain-derived Abeta in Alzheimer’s disease: pathophysiology and therapeutic perspectives. Transl Neurodegener 9, 16. [DOI] [PMC free article] [PubMed] [Google Scholar]
- [14].Sakai K, Senda T, Hata R, Kuroda M, Hasegawa M, Kato M, Abe M, Kawaguchi K, Nakai S, Hiki Y, Yuzawa Y, Kitaguchi N (2016) Patients that have Undergone Hemodialysis Exhibit Lower Amyloid Deposition in the Brain: Evidence Supporting a Therapeutic Strategy for Alzheimer’s Disease by Removal of Blood Amyloid. J Alzheimers Dis 51, 997–1002. [DOI] [PubMed] [Google Scholar]
- [15].Xiang Y, Bu XL, Liu YH, Zhu C, Shen LL, Jiao SS, Zhu XY, Giunta B, Tan J, Song WH, Zhou HD, Zhou XF, Wang YJ (2015) Physiological amyloid-beta clearance in the periphery and its therapeutic potential for Alzheimer’s disease. Acta Neuropathol 130, 487–499. [DOI] [PMC free article] [PubMed] [Google Scholar]
- [16].Liu YH, Xiang Y, Wang YR, Jiao SS, Wang QH, Bu XL, Zhu C, Yao XQ, Giunta B, Tan J, Zhou HD, Wang YJ (2015) Association Between Serum Amyloid-Beta and Renal Functions: Implications for Roles of Kidney in Amyloid-Beta Clearance. Mol Neurobiol 52, 115–119. [DOI] [PubMed] [Google Scholar]
- [17].Hansson O (2021) Biomarkers for neurodegenerative diseases. Nat Med 27, 954–963. [DOI] [PubMed] [Google Scholar]
- [18].Gronewold J, Klafki HW, Baldelli E, Kaltwasser B, Seidel UK, Todica O, Volsek M, Haussmann U, Wiltfang J, Kribben A, Bruck H, Hermann DM (2016) Factors Responsible for Plasma beta-Amyloid Accumulation in Chronic Kidney Disease. Mol Neurobiol 53, 3136–3145. [DOI] [PubMed] [Google Scholar]
- [19].Guerville F, De Souto Barreto P, Coley N, Andrieu S, Mangin JF, Chupin M, Payoux P, Ousset PJ, Rolland Y, Vellas B, group MD (2021) Kidney Function and Cognitive Decline in Older Adults: Examining the Role of Neurodegeneration. J Am Geriatr Soc 69, 651–659. [DOI] [PubMed] [Google Scholar]
- [20].Gupta J, Mitra N, Kanetsky PA, Devaney J, Wing MR, Reilly M, Shah VO, Balakrishnan VS, Guzman NJ, Girndt M, Periera BG, Feldman HI, Kusek JW, Joffe MM, Raj DS, Investigators CS (2012) Association between albuminuria, kidney function, and inflammatory biomarker profile in CKD in CRIC. Clin J Am Soc Nephrol 7, 1938–1946. [DOI] [PMC free article] [PubMed] [Google Scholar]
- [21].Gottesman RF, Schneider AL, Zhou Y, Coresh J, Green E, Gupta N, Knopman DS, Mintz A, Rahmim A, Sharrett AR, Wagenknecht LE, Wong DF, Mosley TH (2017) Association Between Midlife Vascular Risk Factors and Estimated Brain Amyloid Deposition. JAMA 317, 1443–1450. [DOI] [PMC free article] [PubMed] [Google Scholar]
- [22].Simino J, Wang Z, Bressler J, Chouraki V, Yang Q, Younkin SG, Seshadri S, Fornage M, Boerwinkle E, Mosley TH, Jr. (2017) Whole exome sequence-based association analyses of plasma amyloid-beta in African and European Americans; the Atherosclerosis Risk in Communities-Neurocognitive Study. PLoS One 12, e0180046. [DOI] [PMC free article] [PubMed] [Google Scholar]
- [23].Inker LA, Schmid CH, Tighiouart H, Eckfeldt JH, Feldman HI, Greene T, Kusek JW, Manzi J, Van Lente F, Zhang YL, Coresh J, Levey AS, Investigators C-E (2012) Estimating glomerular filtration rate from serum creatinine and cystatin C. N Engl J Med 367, 20–29. [DOI] [PMC free article] [PubMed] [Google Scholar]
- [24].Inker LA, Eneanya ND, Coresh J, Tighiouart H, Wang D, Sang Y, Crews DC, Doria A, Estrella MM, Froissart M, Grams ME, Greene T, Grubb A, Gudnason V, Gutierrez OM, Kalil R, Karger AB, Mauer M, Navis G, Nelson RG, Poggio ED, Rodby R, Rossing P, Rule AD, Selvin E, Seegmiller JC, Shlipak MG, Torres VE, Yang W, Ballew SH, Couture SJ, Powe NR, Levey AS, Chronic Kidney Disease Epidemiology C (2021) New Creatinine- and Cystatin C-Based Equations to Estimate GFR without Race. N Engl J Med 385, 1737–1749. [DOI] [PMC free article] [PubMed] [Google Scholar]
- [25].Grubb A, Blirup-Jensen S, Lindstrom V, Schmidt C, Althaus H, Zegers I, C IWGoSoC (2010) First certified reference material for cystatin C in human serum ERM-DA471/IFCC. Clin Chem Lab Med 48, 1619–1621. [DOI] [PubMed] [Google Scholar]
- [26].Ballew SH, Chen Y, Daya NR, Godino JG, Windham BG, McAdams-DeMarco M, Coresh J, Selvin E, Grams ME (2017) Frailty, Kidney Function, and Polypharmacy: The Atherosclerosis Risk in Communities (ARIC) Study. Am J Kidney Dis 69, 228–236. [DOI] [PMC free article] [PubMed] [Google Scholar]
- [27].Group. KDIGOKCW (2013) KDIGO 2012 Clinical Practice Guideline for the Evaluation and Management of Chronic Kidney Disease. . Kidney inter, Suppl 3, 1–150. [DOI] [PubMed] [Google Scholar]
- [28].Gottesman RF, Schneider AL, Zhou Y, Chen X, Green E, Gupta N, Knopman DS, Mintz A, Rahmim A, Sharrett AR, Wagenknecht LE, Wong DF, Mosley TH Jr. (2016) The ARIC-PET amyloid imaging study: Brain amyloid differences by age, race, sex, and APOE. Neurology 87, 473–480. [DOI] [PMC free article] [PubMed] [Google Scholar]
- [29].Jack CR Jr., O’Brien PC, Rettman DW, Shiung MM, Xu Y, Muthupillai R, Manduca A, Avula R, Erickson BJ (2001) FLAIR histogram segmentation for measurement of leukoaraiosis volume. J Magn Reson Imaging 14, 668–676. [DOI] [PMC free article] [PubMed] [Google Scholar]
- [30].Sullivan KJ, Blackshear C, Simino J, Tin A, Walker KA, Sharrett AR, Younkin S, Gottesman RF, Mielke MM, Knopman D, Windham BG, Griswold ME, Mosley TH (2021) Association of Midlife Plasma Amyloid-beta Levels With Cognitive Impairment in Late Life: The ARIC Neurocognitive Study. Neurology 97, e1123–e1131. [DOI] [PMC free article] [PubMed] [Google Scholar]
- [31].Seliger SL, Longstreth WT Jr., Katz R, Manolio T, Fried LF, Shlipak M, Stehman-Breen CO, Newman A, Sarnak M, Gillen DL, Bleyer A, Siscovick DS (2005) Cystatin C and subclinical brain infarction. J Am Soc Nephrol 16, 3721–3727. [DOI] [PubMed] [Google Scholar]
- [32].Blennow K, Zetterberg H, Fagan AM (2012) Fluid biomarkers in Alzheimer disease. Cold Spring Harb Perspect Med 2, a006221. [DOI] [PMC free article] [PubMed] [Google Scholar]
- [33].Doecke JD, Perez-Grijalba V, Fandos N, Fowler C, Villemagne VL, Masters CL, Pesini P, Sarasa M, Group AR (2020) Total Abeta42/Abeta40 ratio in plasma predicts amyloid-PET status, independent of clinical AD diagnosis. Neurology 94, e1580–e1591. [DOI] [PMC free article] [PubMed] [Google Scholar]
- [34].Fandos N, Perez-Grijalba V, Pesini P, Olmos S, Bossa M, Villemagne VL, Doecke J, Fowler C, Masters CL, Sarasa M, Group AR (2017) Plasma amyloid beta 42/40 ratios as biomarkers for amyloid beta cerebral deposition in cognitively normal individuals. Alzheimers Dement (Amst) 8, 179–187. [DOI] [PMC free article] [PubMed] [Google Scholar]
- [35].Tian DY, Cheng Y, Zhuang ZQ, He CY, Pan QG, Tang MZ, Hu XL, Shen YY, Wang YR, Chen SH, Sun HL, Sun PY, Yu ZY, Fan DY, Bu XL, Tan CR, Zeng GH, Wang J, Zhao HW, Wang YJ (2021) Physiological clearance of amyloid-beta by the kidney and its therapeutic potential for Alzheimer’s disease. Mol Psychiatry 26, 6074–6082. [DOI] [PubMed] [Google Scholar]
- [36].Jin WS, Shen LL, Bu XL, Zhang WW, Chen SH, Huang ZL, Xiong JX, Gao CY, Dong Z, He YN, Hu ZA, Zhou HD, Song W, Zhou XF, Wang YZ, Wang YJ (2017) Peritoneal dialysis reduces amyloid-beta plasma levels in humans and attenuates Alzheimer-associated phenotypes in an APP/PS1 mouse model. Acta Neuropathol 134, 207–220. [DOI] [PubMed] [Google Scholar]
- [37].Burns CM, Knopman DS, Tupper DE, Davey CS, Slinin YM, Lakshminarayan K, Rossom RC, Pederson SL, Gilbertson DT, Murray AM (2018) Prevalence and Risk of Severe Cognitive Impairment in Advanced Chronic Kidney Disease. J Gerontol A Biol Sci Med Sci 73, 393–399. [DOI] [PMC free article] [PubMed] [Google Scholar]
- [38].Syrjanen JA, Campbell MR, Algeciras-Schimnich A, Vemuri P, Graff-Radford J, Machulda MM, Bu G, Knopman DS, Jack CR Jr., Petersen RC, Mielke MM (2021) Associations of amyloid and neurodegeneration plasma biomarkers with comorbidities. Alzheimers Dement. [DOI] [PMC free article] [PubMed] [Google Scholar]
Associated Data
This section collects any data citations, data availability statements, or supplementary materials included in this article.