

Abstract
Delay discounting (DD), the decrease of the subjective value of a reward as the delay to its receipt increases, is a crucial aspect of decision-making processes. As evidence continues to mount, additional attention needs to be given to nonsystematic DD, a response pattern that has been reported in the literature but rarely investigated. We noticed in our recent online research an increase in the proportion of nonsystematic DD responses across samples, consistent with the so-called Amazon Mechanical Turk (MTurk) data quality crisis. The significant proportion of nonsystematic responses created an opportunity to investigate its association with data quality in the current study. In a sample of smokers recruited from MTurk (n = 210), three independent quality check indexes evaluated participants’ response quality. The degree of nonsystematic DD was quantified by the algorithms developed by Johnson and Bickel (2008). The area under the receiver operating characteristic curve (AUC) predicting response quality by nonsystematic DD was obtained. The observed AUC values were at the extreme of the null distributions (ps < .001) in a permutation test. Furthermore, the nonsystematic DD cutoffs provided in Johnson and Bickel (2008) showed good sensitivity (0.77–0.93), albeit low-moderate specificity (0.42–0.74), in detecting low-quality responses. The findings showed that nonsystematic DD was associated with low-quality responses, although other factors contributing to the nonsystematic responses remain to be identified.
Keywords: delay discounting, data quality, ROC curve, nonsystematic responses, online research
Introduction
Delay discounting (DD), a highly studied decision-making process, refers to the decrease of the subjective value of a reward as the delay to its receipt increases (Madden & Bickel, 2010). A brief search on PubMed with the keyword “delay discounting” alone yields over 2,484 papers from 1955 to 2022. Importantly, robust literature implicates DD as a mechanism undergirding many socially relevant behaviors, such as poor health behaviors and mental health disorders. As a result, DD has been proposed as a candidate behavioral marker of addiction and obesity (Bickel et al., 2014; Bickel et al., 2021) and as a transdiagnostic process among psychiatric disorders (Amlung et al., 2019). As evidence continues to mount regarding DD’s status as a key decision-making process, additional attention needs to be given to its measurement methods and analysis protocols.
The majority of individuals discount delayed rewards systematically, which lead to the development of mathematical models, such as Mazur’s (1987) hyperbolic decay function. However, as previous studies have noted, a participant may sometimes show nonsystematic DD (Rung et al., 2018; Smith et al. 2018). That is, the subjective value of a delayed reward is greater in longer delays than shorter delays. The overall frequency of nonsystematic DD across experiments was 18%, although the number may vary depending on samples and the criteria used. Investigators have proposed that these patterns reveal inattention to the task or failure to understand task instructions (Smith et al. 2018). In this context, nonsystematic data does not reflect the study’s proposed mechanism, and therefore, should be excluded from the analysis.
Johnson and Bickel (2008) developed an algorithm to identify nonsystematic DD data with two criteria using a model-free method. Criterion 1 assumes a consistent effect of sequential delays on discounted value; that is, the present value of a delayed reward determined by the behavioral task is greater than the preceding one by a magnitude greater than 20% of the amount of the delayed reward. Criterion 2 assumes an overall decrease in discounted value as an effect of delay; that is, the present value at the longest delay is not lower than the one at the shortest delay by a magnitude of 10% of the amount of the delayed reward. These standardized criteria have been used to improve research on DD, evidencing a rigorous and sensitive pre-analytic procedure (Craft et al. 2022; White et al. 2015).
While multiple studies have used the algorithm developed by Johnson and Bickel (2008) to exclude data, whether nonsystematic DD largely represents low-quality responses remains a research question to be answered. This research is difficult, considering the majority of individuals show systematic responses. However, in our recent data collected through Amazon Mechanical Turk (MTurk) we noticed an increase in the proportion of nonsystematic DD responses, consistent with the so-called MTurk data quality crisis (Chmielewski & Kucker, 2020; Kennedy et al., 2020). Recent literature has identified multiple potential threats to MTurk data quality such as the use of bots (Dreyfuss et al., 2018; Stokel-Walker, 2018), study information shared on online forums (Godinho et al., 2020), use of virtual private servers by international participants to complete surveys directed to U.S. participants (Kennedy et al., 2020), and random answers to experimental manipulations (Chmielewski & Kucker, 2020). Procedures following best practices to mitigate potential detrimental effects of poor data quality have been suggested, such as the addition of attention and validity checks (Chmielewski & Kucker, 2020; Kennedy et al., 2020; Mellis & Bickel, 2020; Strickland & Stoops, 2019).
The MTurk data quality crisis provided an opportunity to investigate the relationship between nonsystematic DD and low-quality responses. In this study, we investigated this relationship through secondary data analysis on a sample for investigating choice behaviors in daily cigarette smokers, given the attention to nonsystematic DD in this area of research (e.g., Kurti and Dallery 2014; Lawyer et al. 2011). The algorithms developed in Johnson and Bickel (2008) were used to quantify individuals’ degree of nonsystematic DD. In addition, independent quality check indexes were developed to identify low-quality responses. We hypothesized that the degree of nonsystematic DD would predict low-quality responses in an analysis of receiver operating characteristic (ROC) curves. As an additional analysis, we examined the sensitivity and specificity of the cutoffs proposed by Johnson and Bickel (2008) in detecting low-quality responses.
Method
Participants
The participants (N = 210) were recruited via MTurk. The sample size was determined by the need of piloting a behavioral choice task under development for a larger research project investigating choice behaviors in cigarette smokers. The participants were directed to complete a survey built on Qualtrics platform, where a security option was enabled to prevent multiple submissions. Inclusion criteria for this study were 1) age of 21 years or older, 2) using a computer with an IP address in the United States, 3) previous MTurk approval HIT rates of at least 90%, 4) self-reporting smoking more than 10 cigarettes per day, and 5) self-reporting drinking alcohol in the past year. This study was conducted between March and May of 2021. The demographics of the sample stratified by the number of quality check indexes failed are presented in Table S1. Note that the demographic information from the low-quality survey responses may be less reliable.
The participants were compensated with $2 and a bonus of up to $1.5 contingent on their performance on the three response quality indexes in the study ($0.5 for passing each). The study was approved by the Institutional Review Board at Virginia Polytechnic Institute and State University.
Study Measures
Delay discounting.
A binary choice task in which participants made choices between receiving a smaller, immediate and a larger, delayed amount of hypothetical money with an adjusting-amount procedure was used to establish individual DD functions (Du et al., 2002). Each participant was studied at each of seven delays in increasing order: 1 day, 1 week, 1 month, 3 months, 1 year, 5 years, 25 years. For each delay, participants made six consecutive choices where the first choice was always between an immediate $500 and a delayed $1000 (e.g., $500 now vs. $1000 in 1 month). If the participant chose the immediate reward, then its amount was reduced on the next choice trial (e.g., $250 now vs. $1000 in 1 month). If the participant chose the delayed reward, then the immediate amount was increased (e.g., $750 now vs. $1000 in 1 month). The size of the adjustment after the first choice trial was $250, and on each subsequent choice trial, the adjustment was half the amount of the prior adjustment (e.g., $62.5 on the third trial), regardless of whether the participant chose the immediate or the delayed reward. The amount that would have been used for the immediate reward on a seventh choice was taken as an estimate of the subjective value (indifference point) of the delayed reward.
Two independent measures based on the algorithms developed in Johnson and Bickel (2008) were used to quantify individuals’ degree of nonsystematic DD. Specifically, the first measure was obtained by first subtracting the indifference points for all delays except for 25 years from the following indifference points (e.g., subtracting the indifferent point for 1 month from that for 3 months) and then identifying the maximum (criterion 1). The second measure was obtained by subtracting the indifference point for 25 years from that for 1 day (criterion 2). Both measures were normalized by dividing by 1000 and ranged between 0 and 1.
Quality check indexes.
Five questions were used to form three independent indexes to check response quality. Index-one comprised two questions; the first question was placed at the front of the survey asking participants to report the number of cigarettes they smoked per day, and the second question was placed near the end asking them to select one of the number ranges in which their daily use of cigarettes fell within. Forty-nine participants (23%) provided inconsistent information across the two questions and failed this index. Index-two was built on a multiple-choice question placed after the choice task. The question asked participants to choose the option that best describes the task they just performed. Fifty-six participants (27%) answered incorrectly to the question and failed this index. Index-three comprised two questions placed adjacently in the middle of the survey; the first and the second questions asked the participants to select one of the number ranges in which their individual and household income fell within, respectively. Fourteen participants (7%) reported individual income greater than household income and failed this index. Overall, 125 out of 210 participants passed all three quality check indexes. Of the remaining, 54, 28, and 3 participants failed one, two, and all three indices, respectively.
Procedure
After providing consent to participate in the study, participants answered a series of screening questions including the history of substance use to determine their eligibility. Those who were eligible proceeded to complete two behavioral choice tasks (i.e., DD and a behavioral choice task under development) in a randomized order. After the choice tasks, the participants answered a series of questions regarding their demographics and smoking behaviors. Upon completion, they were given a passcode to submit the task. On average, participants spent 15 minutes completing the study.
Statistical Analysis
First, two separate labels of low-quality survey responses were given to the participants who failed one or more and who failed two or more quality check indexes, respectively. These labels allowed the investigation of the change in the outcome measures when different criteria were used to determine low-quality survey responses. The relationship between nonsystematic DD and low-quality survey responses, indicated by the labels, was examined using ROC curve analysis, in which the area under the curve (AUC), sensitivity, and specificity were calculated. The maximum value of the AUC is 1.0, which indicates a perfect relationship (i.e., 100% sensitive and 100% specific in predicting low-quality responses). An AUC value of 0.5 indicates the discriminative value is no better than chance (i.e., 50% sensitive and 50% specific). Second, following the ROC curve analysis, the observed AUCs were statistically tested. Specifically, a new set of data was created by randomly shuffling the labels of low-quality responses, thereby, the labels no longer indicate whether the participants failed the quality check indexes. Then a ROC curve for each nonsystematic DD measure was constructed to derive a value of AUC. The process was repeated 10,000 times to form AUC distributions that reflect the null hypothesis that the observed associations are due to chance. The probability level of significance 0.05 was used to test whether the AUC derived from the observed data is statistically different from the null distribution. Finally, the sensitivity and the specificity in detecting low-quality survey responses by the cutoffs in Johnson and Bickel (2008) for determining nonsystematic DD were examined.
Transparency and Openness
We reported how we determined our sample size, all data exclusions (no exclusions), all manipulations (no manipulations), and all measures in the study, and we followed JARS (Kazak, 2018). All data, analysis code, and research materials are available by emailing the corresponding author. Data were analyzed and graphed using R, version 4.0.3 (R Core Team, 2020), the package ggplot2, version 3.3.5 (Wickham, 2016), and the package ROCR, version 1.0 (Sing et al., 2005). This study’s design and analyses were not pre-registered.
Results
Among the participants, 85 and 31 failed one or more and two or more quality check indexes, respectively, and were labeled as providing low-quality survey responses. The results of ROC curve analysis showed nonsystematic DD was predictive of these low-quality response labels (Figure 1A). Specifically, the AUCs of nonsystematic DD measured either by Criterion 1 (0.77–0.81) or Criterion 2 (0.80–0.81) are all above 0.5. No apparent differences between the performance of criterion 1 and criterion 2 and the performance in predicting the two low-quality response labels were observed.
Figure 1. Examining the association between nonsystematic delay discounting and low-quality responses by the ROC curve analysis followed by a permutation test.
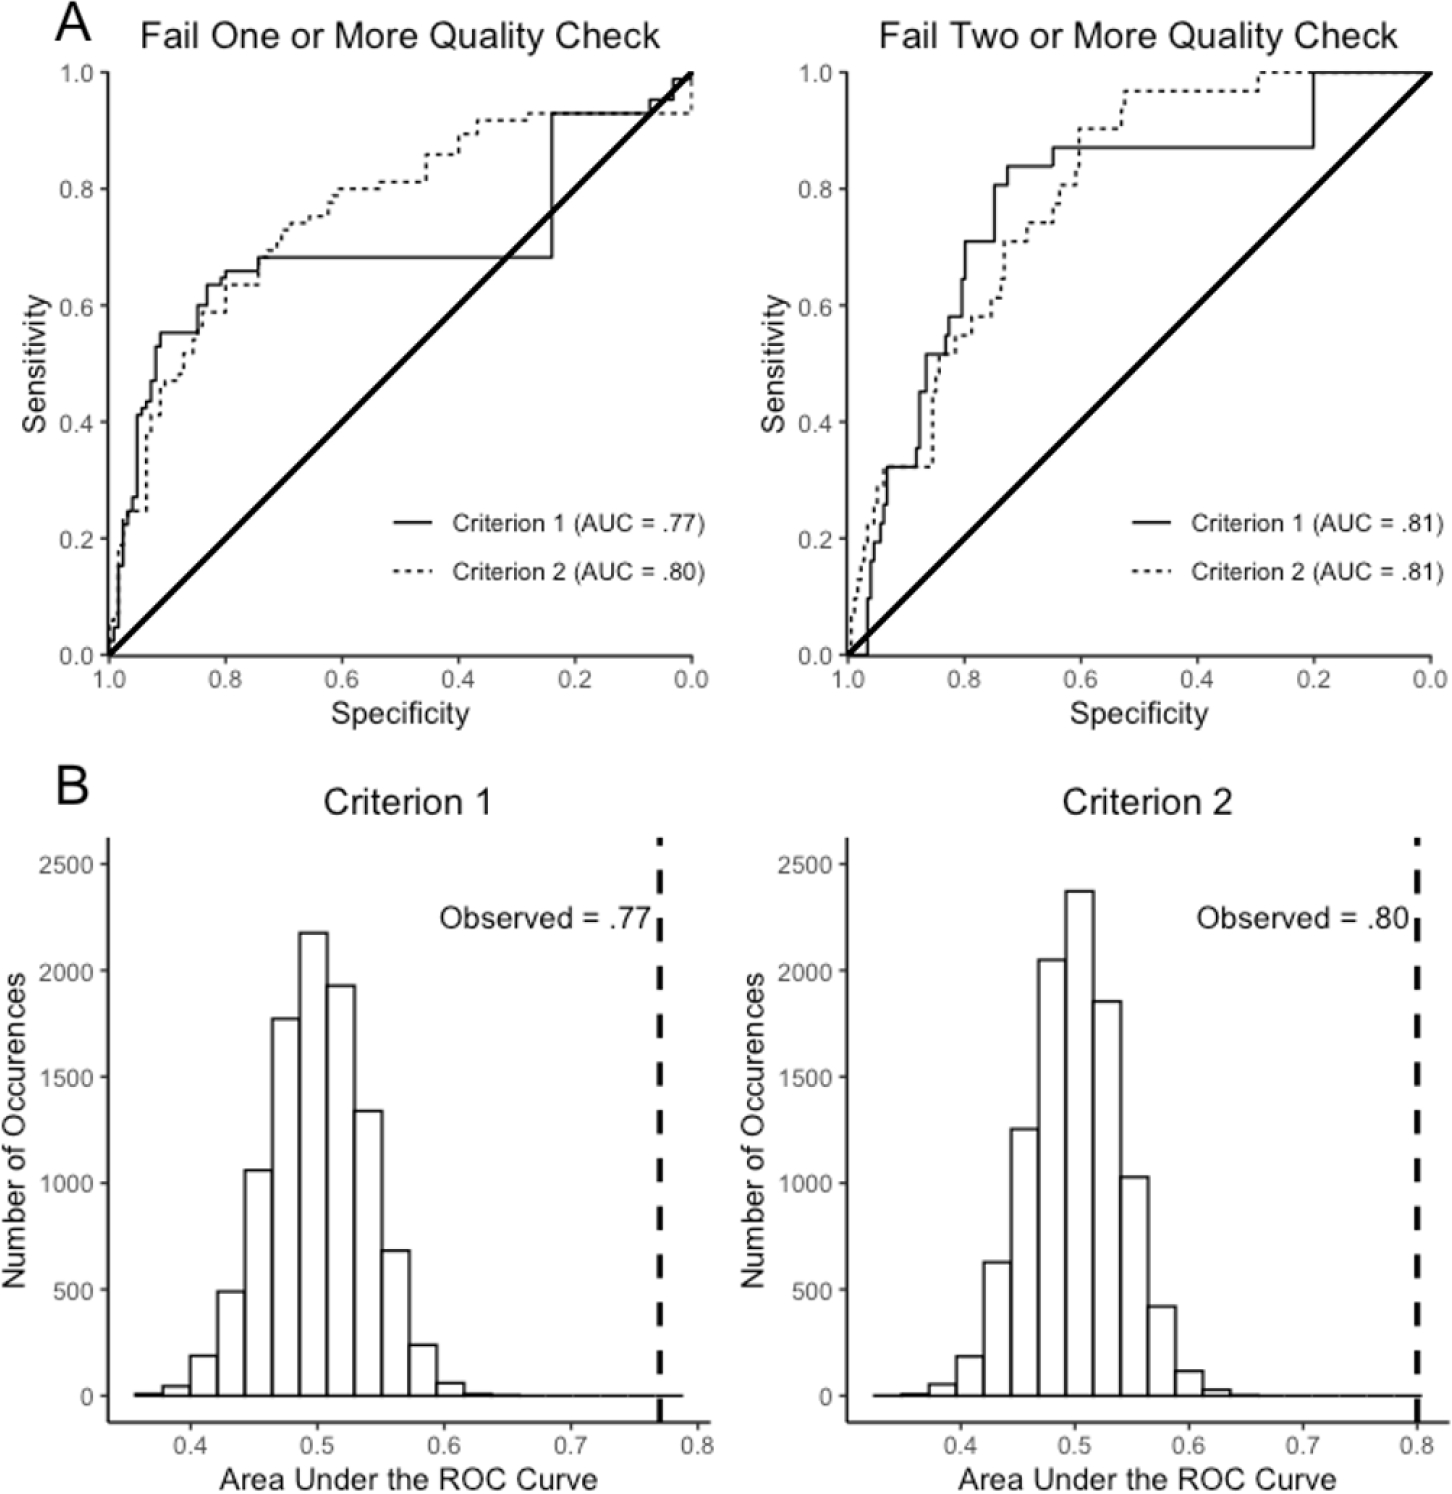
Note. A. The ROC curve analysis predicting low-quality responses by nonsystematic delay discounting. The low-quality responses are defined by failing one or more and failing two or more quality checks for the left and the right panels, respectively. The solid line indicates the AUC of nonsystematic delay discounting measured by Criterion 1; The dotted line indicates the AUC of nonsystematic delay discounting measured by Criterion 2. B. The observed AUC against a null distribution constructed by a permutation test. The dashed line indicates the observed AUC in which the labels were given to the participants who failed one or more quality checks.
Following the ROC curve analysis, permutation tests were conducted to statistically test the significance of the observed AUC. As may be seen in Figure 1B, which presents the null distributions in which the labels have no relation to the quality of responses, the AUC values are centered on 0.5. All observed AUC values are at the extreme of the distributions (ps = .0001), suggesting that the observed associations are unlikely due to chance.
The numbers of participants who failed the cutoffs in Johnson and Bickel (2008) are presented in Table S2. The sensitivity and specificity in detecting low-quality responses using these cutoffs are summarized in Table 1. Overall, the sensitivity (0.77–0.93) is greater than the specificity (0.42–0.74). That is, the cutoffs have greater accuracy in identifying participants who provide low-quality data than in discriminating participants who provide acceptable quality of data from those who do not.
Table 1.
The sensitivity and specificity in detecting low-quality responses using the cutoffs in Johnson and Bickel (2008)
| Criterion 1 (cutoff = 20%) | Criterion 2 (cutoff = 10%) | |||
|---|---|---|---|---|
|
|
|
|||
| Failed one or more | Failed two or more | Failed one more | Failed two or more | |
|
| ||||
| Sensitivity | 0.888 | 0.771 | 0.928 | 0.832 |
| Specificity | 0.588 | 0.742 | 0.424 | 0.484 |
Discussion
This study investigated the relationship between data quality and nonsystematic responding on a DD task, defined by the criteria in Johnson and Bickel (2008), in a sample of individuals who reported daily cigarette use. We found that the two nonsystematic DD criteria predicted low-quality responses better than chance, with no noticeable differences in predictive ability between criterion 1 and criterion 2. The relevance of these findings is discussed below.
In the current sample of individuals reporting daily cigarette use, a large proportion of participants (40.5%) provided low-quality data. A recent study conducted on MTurk in September 2020, which investigated DD in individuals meeting criteria for alcohol use disorder (AUD), reported a similar finding in that 23.7% of participants failed a simple attention check (i.e., “would you prefer $0 now or $1,000 now?”; Craft et al. 2022). Taken together, this work provides empirical evidence that data quality concerns on MTurk continue to persist in multiple addiction-relevant samples. In light of our present findings, researchers conducting crowdsourced investigations in substance-using samples on MTturk should feel comfortable excluding a significant proportion of their data if evidence of low-quality responding is apparent. Nevertheless, screening out participants likely to generate low-quality data prior to a study by implementing a separate screener at the front is preferable to excluding data post-hoc.
A key finding of this study is that nonsystematic responding during a DD task was a predictor of low-quality data across three independent quality check indexes (i.e., reporting daily cigarette usage with consistency; describing a choice task accurately; reporting individual and household income with consistency). A previous investigation in AUD reported that nonsystematic DD data was similar to randomly generated data on multiple metrics (Craft et al. 2022). The current finding supports the connection between nonsystematic DD and low-quality data. Furthermore, given the types of quality check indexes utilized in this study, the results suggest inattention and misrepresentation are among the factors contributing to nonsystematic performance. These findings provide justification for researchers to exclude responses with nonsystematic DD. Nonetheless, other variables that may contribute to nonsystematic DD have been noted (e.g., episodically thinking of a specific event at a particular delay; for a discussion, see Rung et al., 2018). Researchers should remain cautious about removing nonsystematic DD responses, particularly when a variable of study interest might be a contributing factor.
Finally, our analyses highlighted the high sensitivity of the cutoffs proposed in Johnson and Bickel (2008) to identify low-quality data as well as low-moderate specificity in discriminating between high and low-quality responses. While the use of Johnson and Bickel’s (2008) standardized criteria has been criticized as a method to remove data that does not conform to a particular DD model (Bailey et al., 2021), this investigation supports the hypothesis that nonsystematic DD responding may represent orthogonal behavior that is unrelated to DD and should therefore be excluded from analyses. To improve specificity, combining Johnson and Bickel’s criteria with other data quality check methods to exclude responses is recommended. To be noted, the outcome of the current finding may be influenced by the parameters of the discounting task (e.g., the longest delay for the larger reward). Further investigation with different discounting parameters across diverse samples is needed to establish the utility of using nonsystematic DD as a measure of data quality.
Limitations
We acknowledge a few potential limitations of the present study. First, this study was a secondary data analysis and only included individuals who reported daily cigarette smoking, and therefore, the generalizability of the findings to the broader population and individuals using other types of substances is unknown. However, similar findings in individuals with AUD suggest our results could be part of a broader phenomenon (Craft et al. 2022). Second, the quality check indexes used in this study were arbitrary. Whether including other quality check methods would change the results is unclear, although using different cutoffs for determining low-quality responses (i.e., failing one or more; failing two or more) did not change the results in our analysis. Notice, the current sample asked for a HIT approval rate of at least 90% instead of a commonly recommended 95%, which likely contributes to the high percentage of poor quality data (e.g., Chandler & Shapiro, 2016). Replication with a sample using different inclusion criteria (e.g., HIT approval rate ≥ 95%) and quality control methods that are commonly used is needed to establish the reliability of the current finding. Finally, as noted in the discussion, the sensitivity and specificity of the cutoffs proposed in Johnson and Bickel (2008) should be interpreted with caution. The results only applied to the DD task in which the larger, delayed reward was fixed at $1000, and the shortest and the longest delays are 1 day and 25 years, respectively.
Conclusion
Low-quality data continues to be present in addiction-relevant samples on the MTurk platform as of 2021. We demonstrated that nonsystematic DD was able to identify low-quality responses defined by failing one or more independent quality check indexes. Our results support the use of the criteria outlined in Johnson and Bickel (2008) as a scientifically rigorous method to identify and remove questionable data. The cutoffs proposed in their work showed high sensitivity in identifying low-quality responses with low-moderate specificity in discriminating high from low-quality responses. Together, the findings showed that nonsystematic DD was associated with low-quality responses, although other factors contributing to the nonsystematic responses remain to be identified.
Supplementary Material
Public Significance Statement.
Individuals typically discount future rewards as the delays of their receipt increase, which is known as delay discounting. We found participants who did not show delay discounting were more likely to provide low-quality responses. Our study supports using the standardized criteria to identify and remove unsystematic delay discounting data for research investigating maladaptive health behaviors with the delay discounting framework.
Disclosures and Acknowledgments
This research was supported by National Institutes of Health grants (R01AA027381 and R01DA044471) and the Fralin Biomedical Research Institute at Virginia Tech Carilion. The funding agency had no other role other than financial support. The content is solely the responsibility of the authors and does not necessarily represent the official views of the funding agency.
Y.-H. Yeh contributed to the study conceptualization, administration, data analysis, and the composition of the manuscript. R. Freitas-Lemos, W. H. Craft, and W. K. Bickel contributed to the study conceptualization and the composition of the manuscript. All authors have read and approved the final manuscript.
Although the following activities/relationships do not create a conflict of interest pertaining to this manuscript, in the interest of full disclosure, Dr. Bickel would like to report the following: W. K. Bickel is a principal of HealthSim, LLC; BEAM Diagnostics, Inc.; and Red 5 Group, LLC. In addition, he serves on the scientific advisory board for Sober Grid, Inc., and Ria Health, is a consultant for Alkermes, Inc., and works on a project supported by Indivior, Inc. The other authors had no conflicts of interest to report.
We appreciate Michele King’s assistance with data collection.
Reference
- Amlung M, Marsden E, Holshausen K, Morris V, Patel H, Vedelago L, Naish KR, Reed DD, & McCabe RE (2019). Delay discounting as a transdiagnostic process in psychiatric disorders: A eeta-analysis. JAMA Psychiatry, 76(11), 1176–1186. 10.1001/jamapsychiatry.2019.2102 [DOI] [PMC free article] [PubMed] [Google Scholar]
- Bailey AJ, Romeu RJ, & Finn PR (2021). The problems with delay discounting: A critical review of current practices and clinical applications. Psychological Medicine, 1–8. 10.1017/S0033291721002282 [DOI] [PMC free article] [PubMed] [Google Scholar]
- Bickel WK, Freitas-Lemos R, Tomlinson DC, Craft WH, Keith DR, Athamneh LN, Basso JC, & Epstein LH (2021). Temporal discounting as a candidate behavioral marker of obesity. Neuroscience and Biobehavioral Reviews, 129, 307–329. 10.1016/j.neubiorev.2021.07.035 [DOI] [PubMed] [Google Scholar]
- Bickel WK, Koffarnus MN, Moody L, & Wilson AG (2014). The behavioral- and neuro-economic process of temporal discounting: A candidate behavioral marker of addiction. Neuropharmacology, 76 Pt B, 518–527. 10.1016/j.neuropharm.2013.06.013 [DOI] [PMC free article] [PubMed] [Google Scholar]
- Chandler J, & Shapiro D (2016). Conducting clinical research using crowdsourced convenience samples. Annual Review of Clinical Psychology, 12, 53–81. 10.1146/annurev-clinpsy-021815-093623 [DOI] [PubMed] [Google Scholar]
- Chmielewski M, & Kucker SC (2020). An MTurk Crisis? Shifts in Data Quality and the Impact on Study Results. Social Psychological and Personality Science, 11(4), 464–473. 10.1177/1948550619875149 [DOI] [Google Scholar]
- Craft WH, Tegge AN, Freitas-Lemos R, Tomlinson DC, & Bickel WK (2022). Are poor quality data just random responses?: A crowdsourced study of delay discounting in alcohol use disorder. Experimental and Clinical Psychopharmacology. 10.1037/pha0000549 [DOI] [PMC free article] [PubMed] [Google Scholar]
- Dreyfuss E, Barrett B, & Newman LH (2018). A bot panic hits Amazon’s Mechanical Turk. WIRED. https://www.wired.com/story/amazon-mechanical-turk-bot-panic/
- Du W, Green L, & Myerson J (2002). Cross-cultural comparisons of discounting delayed and probabilistic rewards. The Psychological Record, 52(4), 479–492. 10.1007/bf03395199 [DOI] [Google Scholar]
- Godinho A, Cunningham JA, & Schell C (2020). The particular case of conducting addiction intervention research on Mechanical Turk [Review of The particular case of conducting addiction intervention research on Mechanical Turk]. Addiction, 115(10), 1971–1972. 10.1111/add.15097 [DOI] [PubMed] [Google Scholar]
- Lawyer SR, Schoepflin F, Green R, & Jenks C (2011). Discounting of hypothetical and potentially real outcomes in nicotine-dependent and nondependent samples. Experimental and Clinical Psychopharmacology, 19(4), 263. 10.1037/a0024141 [DOI] [PubMed] [Google Scholar]
- Johnson MW, & Bickel WK (2008). An algorithm for identifying nonsystematic delay-discounting data. Experimental and Clinical Psychopharmacology, 16(3), 264–274. 10.1037/1064-1297.16.3.264 [DOI] [PMC free article] [PubMed] [Google Scholar]
- Kennedy R, Clifford S, Burleigh T, Waggoner PD, Jewell R, & Winter NJG (2020). The shape of and solutions to the MTurk quality crisis. Political Science Research and Methods, 8(4), 614–629. https://www.cambridge.org/core/journals/political-science-research-and-methods/article/shape-of-and-solutions-to-the-mturk-quality-crisis/521AEEB9A9753D5C6038440BD123826C [Google Scholar]
- Kurti AN, & Dallery J (2014). A laboratory-based evaluation of exercise plus contingency management for reducing cigarette smoking. Drug and Alcohol Dependence, 144, 201–209. 10.1016/j.drugalcdep.2014.09.012 [DOI] [PubMed] [Google Scholar]
- Madden GJ, & Bickel DWK. (Eds.). (2010). Impulsivity: The behavioral and neurological science of discounting. American Psychological Association. https://www.amazon.com/Impulsivity-Behavioral-Neurological-Science-Discounting/dp/1433804778 [Google Scholar]
- Mazur JE (1987). An adjusting procedure for studying delayed reinforcement. In Commons ML, Mazur JE, Nevin JA, & Rachlin H (Eds.), The effect of delay and of intervening events on reinforcement value (pp. 55–73). Lawrence Erlbaum Associates, Inc. [Google Scholar]
- Mellis AM, & Bickel WK (2020). Mechanical Turk data collection in addiction research: Utility, concerns and best practices. Addiction, 115(10), 1960–1968. 10.1111/add.15032 [DOI] [PMC free article] [PubMed] [Google Scholar]
- R Core Team (2021). R: A language and environment for statistical computing. R Foundation for Statistical Computing, Vienna, Austria. https://www.R-project.org/ [Google Scholar]
- Rung JM, Argyle TM, Siri JL, & Madden GJ (2018). Choosing the right delay-discounting task: Completion times and rates of nonsystematic data. Behavioural Processes, 151, 119–125. 10.1016/j.beproc.2018.03.022 [DOI] [PubMed] [Google Scholar]
- Sing T, Sander O, Beerenwinkel N, & Lengauer T (2005). ROCR: visualizing classifier performance in R. Bioinformatics, 21(20), 3940–3941. 10.1093/bioinformatics/bti623 [DOI] [PubMed] [Google Scholar]
- Smith KR, Lawyer SR, & Swift JK (2018). A meta-analysis of nonsystematic responding in delay and probability reward discounting. Experimental and Clinical Psychopharmacology, 26(1), 94–107. 10.1037/pha0000167 [DOI] [PubMed] [Google Scholar]
- Stokel-Walker C (2018, August 10). Bots on Amazon’s Mechanical Turk are ruining psychology studies. New Scientist. https://www.newscientist.com/article/2176436-bots-on-amazons-mechanical-turk-are-ruining-psychology-studies/
- Strickland JC, & Stoops WW (2019). The use of crowdsourcing in addiction science research: Amazon Mechanical Turk. Experimental and Clinical Psychopharmacology, 27(1), 1–18. 10.1037/pha0000235 [DOI] [PubMed] [Google Scholar]
- Wickham H (2016). ggplot2: Elegant graphics for data analysis. Springer-Verlag New York. 10.1007/978-0-387-98141-3 [DOI] [Google Scholar]
- White TJ, Redner R, Skelly JM, & Higgins ST (2015). Examination of a recommended algorithm for eliminating nonsystematic delay discounting response sets. Drug and Alcohol Dependence, 154, 300–303. 10.1016/j.drugalcdep.2015.07.011 [DOI] [PMC free article] [PubMed] [Google Scholar]
Associated Data
This section collects any data citations, data availability statements, or supplementary materials included in this article.