Abstract
This cross-sectional study examines the variability in firearm mortality risk by county type across the full rural-urban continuum in the US.
Contrary to the widely held notion that death by firearms is a predominantly urban issue, gun violence likely impacts all US communities, in comparably negative ways, albeit via different mechanisms, across the rural-urban continuum.1 Despite the pervasive nature of gun violence, high rates of gun homicide in urban centers have been the sole focus of many policy makers and used as justification to loosen gun laws.2 Variation in firearm mortality between urban and rural settings has key legislative, judicial, treatment, and prevention implications. This cross-sectional time-series study examines the variability in firearm mortality risk by county type across the full rural-urban continuum in the US.
Methods
In this cross-sectional time-series study, we assessed multiple cause-of-death data files from the National Center for Health Statistics’ National Vital Statistics System over 2 decades, from January 1, 2001, to December 31, 2010, and from January 1, 2011, to December 31, 2020. These data files are created through the universal registration of death certificates at the county level. For our analysis, firearm deaths were separated into gun homicides and gun suicides. Each decedent was assigned to the US county to which their gun homicide or gun suicide occurred. To classify US counties along the rural-urban continuum, a 9-category ordinal variable that was assigned to each county per year of the study was obtained from the US Department of Agriculture Economic Research Service.3 This variable distinguished counties by considering both population and proximity to metropolitan areas. This study was determined to be exempt by the institutional review board at the Children’s Hospital of Philadelphia (data were deidentified). This study followed the STROBE reporting guideline. Data were analyzed in December 2022 by generalized estimating equations with a negative binomial distribution and natural log link using R, version 4.1.1 (R Project for Statistical Computing). To account for confounding, we adjusted for median age, median income, percentage of White decedents, percentage of decedents below the federal poverty level, percentage of female-led households, percent of decedents who completed high school, a measure of state-level gun laws, and fixed effects per year, with a population offset per county. (A model statement, which includes a description of the rural-urban ordinal variable, can be found in eMethods in Supplement 1.)
Results
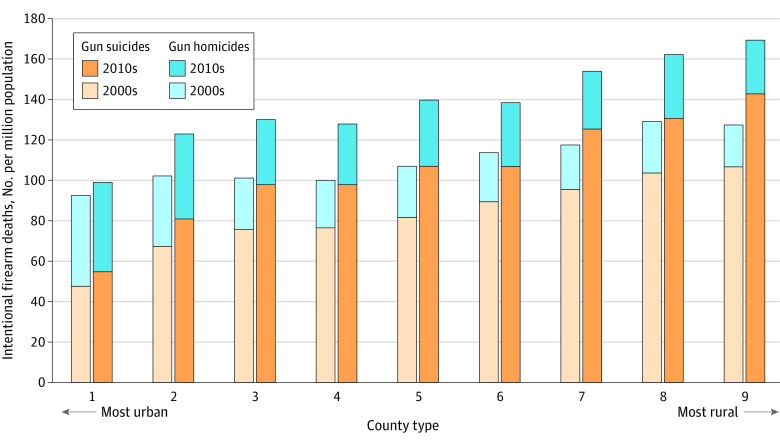
Descriptively, in all county types and both decades of the study, per capita gun suicides were more common than per capita gun homicides, and the most rural counties had higher rates of firearm death compared with the most urban counties. Firearm death rates were meaningfully higher in 2011-2020 compared with 2001-2010, primarily because of an increase in gun suicides (Figure 1).
Figure 1. Total Rate of Intentional Firearm Deaths per Million by County Type on the Rural-Urban Continuum in 2001-2010 and 2011-2020.
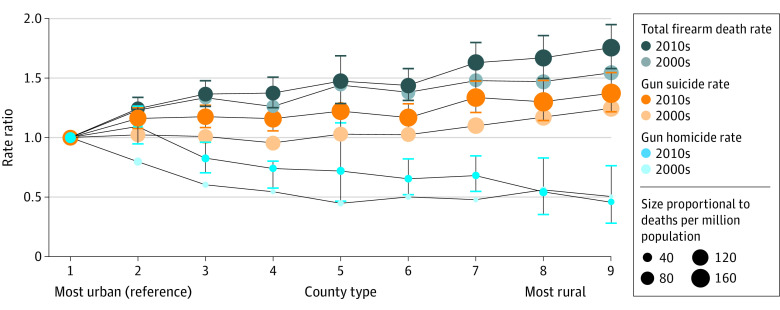
After adjustment for covariates, between 2001 and 2010, the 2 most rural counties had higher total firearm death rates than the most urban counties. For example, county type 9 had a 25% (95% CI, 9%-43%) higher overall firearm death rate compared with county type 1, the most urban. The most rural county type had a 54% (95% CI, 40%-71%) higher gun suicide death rate and a 50% (95% CI, 34%-74%) lower gun homicide death rate compared with the most urban counties (Figure 2).
Figure 2. Intentional Firearm Death Rates From 2001 to 2010 and From 2011 to 2020, by County Type.
The sizes of the dots represent the per capita death rate (in deaths per million).
Between 2011 and 2020, all county types had higher total firearm death rates than the most urban counties. For example, county type 9 had a 37% (95% CI, 22%-55%) higher overall firearm death rate compared with county type 1. The most rural counties had a 76% (95% CI, 58%-95%) higher gun suicide death rate and a 46% (95% CI, 28%-76%) lower gun homicide death rate compared to the most urban counties (Figure 2).
Discussion
This is a cross-sectional time-series design that has limitations; however, we were careful to account for year effects and variables that may have confounded the association between urban-rural status and firearm deaths. Gun suicides outnumber gun homicides each year in the US, and the risk of gun suicides in the most rural US counties exceeds the risk of gun homicides in the most urban US counties. Previous research found that there was no difference in total intentional firearm deaths between the most urban and rural counties in the 1990s.1 Our study has found that the divide in total intentional firearm deaths between urban and rural counties is increasing, with rural counties bearing more of the burden. In the 2000s, the 2 most rural county types had statistically more firearm deaths per capita than any other county type, and by the 2010s, the most urban counties—cities—were the safest in terms of intentional firearm death risk. Contrary to popular belief, firearm deaths are statistically more likely in small towns, not major cities.
eMethods. Model Statement and Description
Data Sharing Statement
References
- 1.Branas CC, Nance ML, Elliott MR, Richmond TS, Schwab CW. Urban-rural shifts in intentional firearm death: different causes, same results. Am J Public Health. 2004;94(10):1750-1755. doi: 10.2105/AJPH.94.10.1750 [DOI] [PMC free article] [PubMed] [Google Scholar]
- 2.Lacy A. Pennsylvania legislators push looser gun laws while decrying gun violence. The Intercept. July 12, 2022. Accessed March 16, 2022. https://theintercept.com/2022/07/12/gun-violence-larry-krasner-pennsylvania/
- 3.Rural-Urban Continuum Codes. Economic Research Service, U.S. Department of Agriculture (USDA). Accessed March 16, 2022. https://www.ers.usda.gov/data-products/rural-urban-continuum-codes/documentation/
Associated Data
This section collects any data citations, data availability statements, or supplementary materials included in this article.
Supplementary Materials
eMethods. Model Statement and Description
Data Sharing Statement


