

Key Points
Question
Do specific organ systems manifest poor health in individuals with common neuropsychiatric disorders?
Findings
This multicenter population-based cohort study including 85 748 adults with neuropsychiatric disorders and 87 420 healthy control individuals found that poor body health, particularly of the metabolic, hepatic, and immune systems, was a more marked manifestation of mental illness than brain changes. However, neuroimaging phenotypes enabled differentiation between distinct neuropsychiatric diagnoses.
Meaning
Management of serious neuropsychiatric disorders should acknowledge the importance of poor physical health and target restoration of both brain and body function.
This cross-sectional study evaluates organ-specific markers of brain and body health in individuals with common neuropsychiatric disorders.
Abstract
Importance
Physical health and chronic medical comorbidities are underestimated, inadequately treated, and often overlooked in psychiatry. A multiorgan, systemwide characterization of brain and body health in neuropsychiatric disorders may enable systematic evaluation of brain-body health status in patients and potentially identify new therapeutic targets.
Objective
To evaluate the health status of the brain and 7 body systems across common neuropsychiatric disorders.
Design, Setting, and Participants
Brain imaging phenotypes, physiological measures, and blood- and urine-based markers were harmonized across multiple population-based neuroimaging biobanks in the US, UK, and Australia, including UK Biobank; Australian Schizophrenia Research Bank; Australian Imaging, Biomarkers, and Lifestyle Flagship Study of Ageing; Alzheimer’s Disease Neuroimaging Initiative; Prospective Imaging Study of Ageing; Human Connectome Project–Young Adult; and Human Connectome Project–Aging. Cross-sectional data acquired between March 2006 and December 2020 were used to study organ health. Data were analyzed from October 18, 2021, to July 21, 2022. Adults aged 18 to 95 years with a lifetime diagnosis of 1 or more common neuropsychiatric disorders, including schizophrenia, bipolar disorder, depression, generalized anxiety disorder, and a healthy comparison group were included.
Main Outcomes and Measures
Deviations from normative reference ranges for composite health scores indexing the health and function of the brain and 7 body systems. Secondary outcomes included accuracy of classifying diagnoses (disease vs control) and differentiating between diagnoses (disease vs disease), measured using the area under the receiver operating characteristic curve (AUC).
Results
There were 85 748 participants with preselected neuropsychiatric disorders (36 324 male) and 87 420 healthy control individuals (40 560 male) included in this study. Body health, especially scores indexing metabolic, hepatic, and immune health, deviated from normative reference ranges for all 4 neuropsychiatric disorders studied. Poor body health was a more pronounced illness manifestation compared to brain changes in schizophrenia (AUC for body = 0.81 [95% CI, 0.79-0.82]; AUC for brain = 0.79 [95% CI, 0.79-0.79]), bipolar disorder (AUC for body = 0.67 [95% CI, 0.67-0.68]; AUC for brain = 0.58 [95% CI, 0.57-0.58]), depression (AUC for body = 0.67 [95% CI, 0.67-0.68]; AUC for brain = 0.58 [95% CI, 0.58-0.58]), and anxiety (AUC for body = 0.63 [95% CI, 0.63-0.63]; AUC for brain = 0.57 [95% CI, 0.57-0.58]). However, brain health enabled more accurate differentiation between distinct neuropsychiatric diagnoses than body health (schizophrenia-other: mean AUC for body = 0.70 [95% CI, 0.70-0.71] and mean AUC for brain = 0.79 [95% CI, 0.79-0.80]; bipolar disorder-other: mean AUC for body = 0.60 [95% CI, 0.59-0.60] and mean AUC for brain = 0.65 [95% CI, 0.65-0.65]; depression-other: mean AUC for body = 0.61 [95% CI, 0.60-0.63] and mean AUC for brain = 0.65 [95% CI, 0.65-0.66]; anxiety-other: mean AUC for body = 0.63 [95% CI, 0.62-0.63] and mean AUC for brain = 0.66 [95% CI, 0.65-0.66).
Conclusions and Relevance
In this cross-sectional study, neuropsychiatric disorders shared a substantial and largely overlapping imprint of poor body health. Routinely monitoring body health and integrated physical and mental health care may help reduce the adverse effect of physical comorbidity in people with mental illness.
Introduction
Mental illness is associated with higher rates of chronic physical illness, including coronary heart disease, obesity, and diabetes,1,2 compared to the general population. This contributes substantially to the global health and economic burden due to increased morbidity, disability, and mortality.3,4 Yet in psychiatric care and services, physical health has been neglected and inadequately managed for decades.1
Despite increased awareness of physical health in psychiatry,5,6 recognizing and treating chronic physical illness remains a challenge. Poor physical health in patients is likely underestimated due to existing disparities in health care for people with mental illness, such as lack of access to adequate primary care,7 diagnostic overshadowing,8,9 and difficulties with acknowledging10 and reporting medical problems for some patients.11,12 Further work is thus needed to understand associations between mental and physical comorbidities, which may facilitate holistic and integrated care in psychiatry.
Most meta-research has focused on cardiovascular and metabolic comorbidities in psychiatry, as summarized in a review by Firth and colleagues.5 While infectious13 and immune-related comorbidities14,15 have also been investigated, the chronic illness burden of common diseases affecting other body systems is scarcely explored.6,16 The association between brain and body health as well as the associated disease risk and physical multimorbidity across body systems hence remain poorly characterized.
We systematically investigated brain and body health in common neuropsychiatric conditions (ie, schizophrenia, bipolar disorder, depression, and generalized anxiety disorder). Using brain images, physiological measures, and blood- and urine-based markers acquired in more than 100 000 individuals, we established composite organ health scores for 2 brain and 7 body systems. We computed age- and sex-specific normative reference ranges for each organ’s health score based on healthy comparison individuals and quantified the extent to which individuals with the above conditions deviated from the established normative ranges. This enabled us to develop multiorgan health profiles for each neuropsychiatric condition and estimate the relative effect of these profiles in each individual’s body systems and physical health. We suggest that the management of serious neuropsychiatric disorders should acknowledge the importance of physical health and target restoration of both brain and body function.
Methods
Participants
This study integrated brain imaging data (structural and diffusion-weighted magnetic resonance imaging [MRI]) with physical and physiological data (where available) acquired from individuals participating in the following consortia studies from March 2006 to December 2020: UK Biobank; Australian Schizophrenia Research Bank; Australian Imaging, Biomarkers and Lifestyle Flagship Study of Ageing; the Alzheimer Disease Neuroimaging Initiative; the Prospective Imaging Study of Ageing; the Human Connectome Project–Young Adult; and the Human Connectome Project–Aging. All data are cross-sectional. T1-weighted MRI brain images were available for 22 005 individuals aged 18 to 95 years collectively sourced from the 7 consortia, and diffusion-weighted MRI brain images were available for 20 283 individuals (mean [SD]; range age, (60.6 [11.5]; 18-95 years) from all cohorts except the Australian Imaging, Biomarkers and Lifestyle Study of Ageing. Physical and physiological assessments were sourced from 175 944 individuals (mean [SD]; range age, 54.8 [8.1]; 37-74 years) participating in UK Biobank.
Ethical approval was obtained as follows: for UK Biobank, from the North West Multi-centre Research Ethics Committee; the Australian Schizophrenia Research Bank, Melbourne Health Human Research Committee (Project ID: 2010.250); the Australian Imaging, Biomarkers and Lifestyle Flagship Study of Ageing, the institutional ethics committees of Austin Health, St Vincent’s Health, Hollywood Private Hospital and Edith Cowan University; the Alzheimer’s Disease Neuroimaging Initiative, according to the ethical standards of the institutional and/or national research committee of each site and with the 1964 Helsinki declaration and its later amendments or comparable ethical standards; Prospective Imaging Study of Ageing, from the Human Research Ethics Committees of QIMR Berghofer Medical Research Institute and the University of Queensland; Human Connectome Project, the Washington University–University of Minnesota Human Connectome Project consortium. Details pertaining to each cohort are described in eMethods in Supplement 1. Written informed consent was obtained from all participants. The study followed the Strengthening the Reporting of Observational Studies in Epidemiology (STROBE) reporting guideline.
Brain and Body Phenotypes
Regionally specific brain phenotypes derived from T1-weighted MRI, including cortical thickness and cortical and subcortical gray matter (GM) volume were selected to profile brain GM health (eTable 1 in Supplement 1). Brain white matter (WM) health was profiled using tract-specific measures of WM microstructure, including fractional anisotropy and mean diffusivity (eTable 2 in Supplement 1). Data were harmonized using ComBat17,18 to control for site and scanner variation. Details of imaging processing, quality control, and phenotype extraction are described in eMethods in Supplement 1.
Physical assessments and blood and urine sample assays were available for UK Biobank participants. Assessment details and procedures for processing biological samples are described elsewhere.19 Physical and physiological measures known to inform the function and health of 7 body systems were selected and grouped into pulmonary, musculoskeletal, kidney, metabolic, hepatic, cardiovascular, and immune systems (eFigure 1A and eTable 3 in Supplement 1). Data curation and the handling of missing data are described in eMethods in Supplement 1.
Normative Modeling
Following previous work,20 generalized additive models for location, scale, and shape were used to establish sex-specific normative reference ranges (mean and centiles) across the adult life span for each brain and body phenotype (eFigure 1B in Supplement 1), based on individuals without any neuropsychiatric illness or other serious medical conditions (eMethods in Supplement 1). The normative reference ranges were then used to estimate standardized phenotypic deviation scores (z scores) for individuals with a neuropsychiatric disorder (schizophrenia, bipolar disorder, depression, or generalized anxiety disorder).21,22 A deviation score was estimated separately for each brain and body phenotype (age and sex specific), quantifying the number of standard deviations an individual deviated from the reference median. Deviation scores for healthy individuals were estimated using 10-fold cross-validation (eMethods in Supplement 1).
Estimating Organ System–Specific Health Scores
A principled approach was developed to summarize phenotypic deviation scores at an organ system level to enable systematic mapping of multisystem health profiles. Phenotypes were grouped based on relevance to the health and function of 2 brain systems (GM and WM) (eTables 1 and 2 in Supplement 1) and 7 body systems (pulmonary, musculoskeletal, kidney, metabolic, hepatic, cardiovascular, and immune) (eTable 3 in Supplement 1). Deviations from the established normative ranges for all phenotypes relevant to a particular system were subsequently combined to yield a single organ-specific health score (OHS) for each system and individual, excluding those with comorbid psychiatric conditions. Health scores were calibrated such that OHS = 0 indicates the median of healthy, normal organ function and OHS < 0 suggests a potential deterioration of organ health, controlling for age and sex.
For example, to estimate phenotype weights for the metabolic health score, the patient group comprised individuals diagnosed with chronic metabolic diseases, including diabetes and disorders of lipoprotein metabolism (eMethods and eTable 4 in Supplement 1). In this way, phenotypes differentiating chronic metabolic diseases were weighted highly when computing the composite metabolic health score and analogously for the other organ systems (eFigure 1C in Supplement 1). The phenotype weights were then used to compute organ health scores for individuals with 1 or more neuropsychiatric disorders (eMethods and eTables 5-9 in Supplement 1).
Ten-fold cross-validation was performed to ensure that organ health scores were not computed for the same individuals who were used to estimate phenotype weights. A composite body health score was also computed using all body phenotypes. Differences in organ health scores between disorder groups and the healthy comparison group were tested using analysis of covariance, adjusting for age and sex. The false discovery rate (FDR) was using the Benjamini-Hochberg procedure across 4 disorder groups × 10 organ systems = 40 tests. Cross-validated logistic regression models were trained to classify an individual’s diagnostic status based on phenotypic deviation scores (eFigure 1D and eMethods in Supplement 1).
Results
There were 85 748 participants with preselected neuropsychiatric disorders (36 324 male) and 87 420 healthy control individuals (40 560 male) included in this study. The Table provides demographic and clinical characteristics.
Table. Demographic Characteristics Stratified by Diagnosis.
| Study groupa | Brain phenotypes | Body phenotypes | |||||||
|---|---|---|---|---|---|---|---|---|---|
| T1-weighted MRI | Diffusion MRI | ||||||||
| No. of individuals | Age, mean (SD), y | Male, No. (%) | No. of individuals | Age, mean (SD), y | Male, No. (%) | No. of individualsb | Age, mean (SD), y | Male, No. (%) | |
| Healthy control | 10 889 | 59.0 (13.5) | 5096 (46.8) | 10 005 | 58.6 (13.5) | 4673 (46.7) | 84 308 | 53.2 (7.9) | 39 255 (46.4) |
| Schizophrenia | 390 | 43.8 (13.7) | 136 (34.9) | 383 | 43.3 (13.5) | 135 (35.2) | 2100 | 55.8 (8.4) | 1184 (56.4) |
| Bipolar disorder | 600 | 62.5 (7.5) | 289 (48.2) | 546 | 62.5 (7.5) | 253 (46.3) | 5853 | 55.0 (8.0) | 2696 (46.1) |
| Depression | 9902 | 63.0 (7.4) | 3435 (34.7) | 9256 | 63.1 (7.5) | 3188 (34.4) | 81 631 | 55.8 (7.9) | 27 923 (34.2) |
| Generalized anxiety disorder | 2063 | 62.2 (7.3) | 733 (35.5) | 1920 | 62.3 (7.4) | 689 (35.9) | 11 456 | 54.3 (7.6) | 3841 (33.5) |
| Dementia | 370 | 72.5 (8.1) | 184 (49.7) | 206 | 71.7 (8.3) | 125 (60.7) | 6506 | 64.7 (5.0) | 3470 (53.3) |
Abbreviation: MRI, magnetic resonance imaging.
Clinical groups are defined based on lifetime diagnosis (eMethods in Supplement 1).
Individuals with at least 1 body phenotype available were included.
Normative Models
Normative reference ranges across the adult life span were established for 203 imaging, blood, urine, and physiological markers. Phenotypic variation was best modeled by the Box-Cox t distribution compared to the other 20 distribution families evaluated (eFigure 2 in Supplement 1). Both linear and nonlinear patterns of age-related trajectories were captured across different phenotypes (eFigure 3 in Supplement 1).
Multisystem Health Profiles in Neuropsychiatric Disorders
We found that all organ-specific health scores were on average significantly lower in individuals with neuropsychiatric disorders compared to age- and sex-matched healthy peers (Figures 1 and 2; eFigures 4-6 in Supplement 1). Specifically, body health scores were markedly lower for individuals with schizophrenia (mean [SD] OHS, −1.65 [1.80]), bipolar disorder (mean [SD] OHS, −0.81 [1.48]), depression (mean [SD] OHS, −0.80 [1.49]), and generalized anxiety disorder (mean [SD] OHS, −0.53 [1.35]) compared to healthy individuals. Consistent across the 4 disorders, poor organ health was most evident for the metabolic system (mean OHS range: −1.24 to −0.45), hepatic system (mean OHS range: −0.85 to −0.21), immune system (mean OHS range: −0.65 to −0.19), and kidney system (mean OHS range: −0.37 to −0.12) (Figure 2).
Figure 1. Brain and Body Health Scores in Neuropsychiatric Disorders Stratified by Organ System.
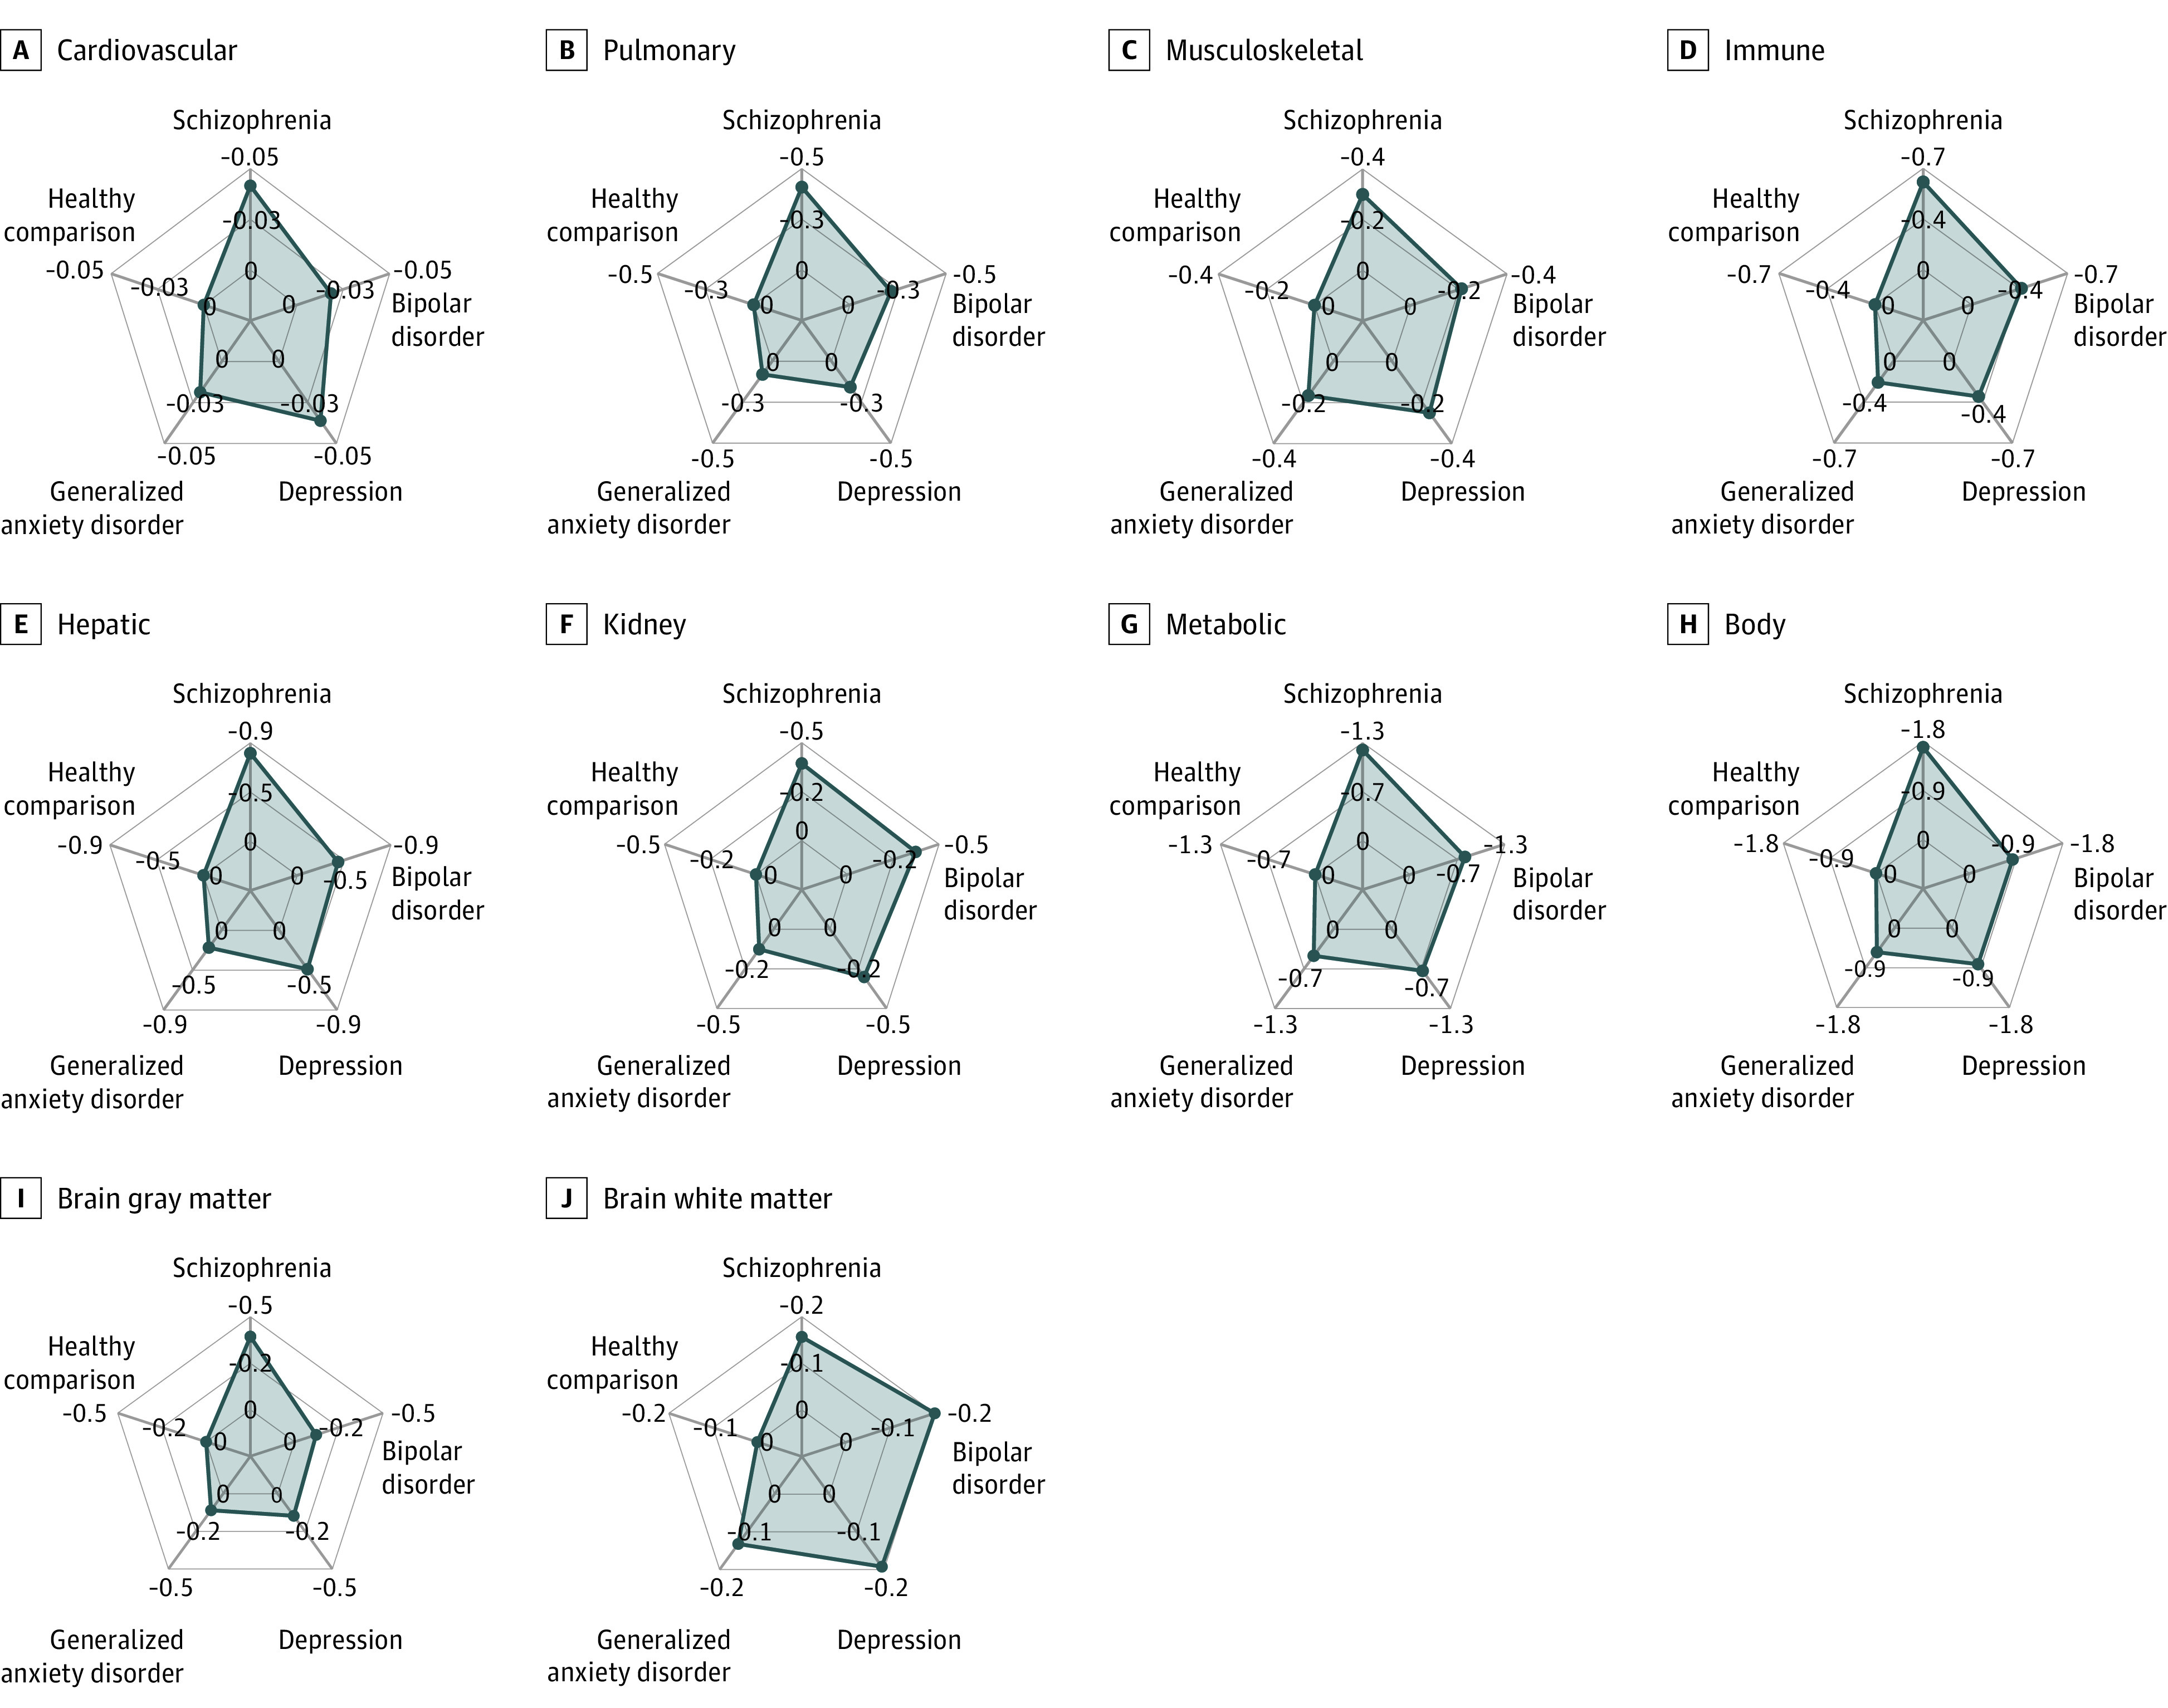
Organ and system health scores were computed for each organ system (2 brain and 7 body) and for each individual. A score of 0 indicates healthy, normal organ function (ie, median score across healthy comparison individuals), and scores below 0 suggest deterioration of organ health, controlling for age and sex. Radial axes show the mean of estimated organ and system health scores across individuals within each neuropsychiatric disorder and healthy comparison individuals. An overall body health score was estimated using all body phenotypes. Distributions of estimated organ and system health scores across individuals in each group are shown in eFigure 6 in Supplement 1.
Figure 2. Brain and Body Health Scores in Neuropsychiatric Disorders Stratified by Diagnosis Group.
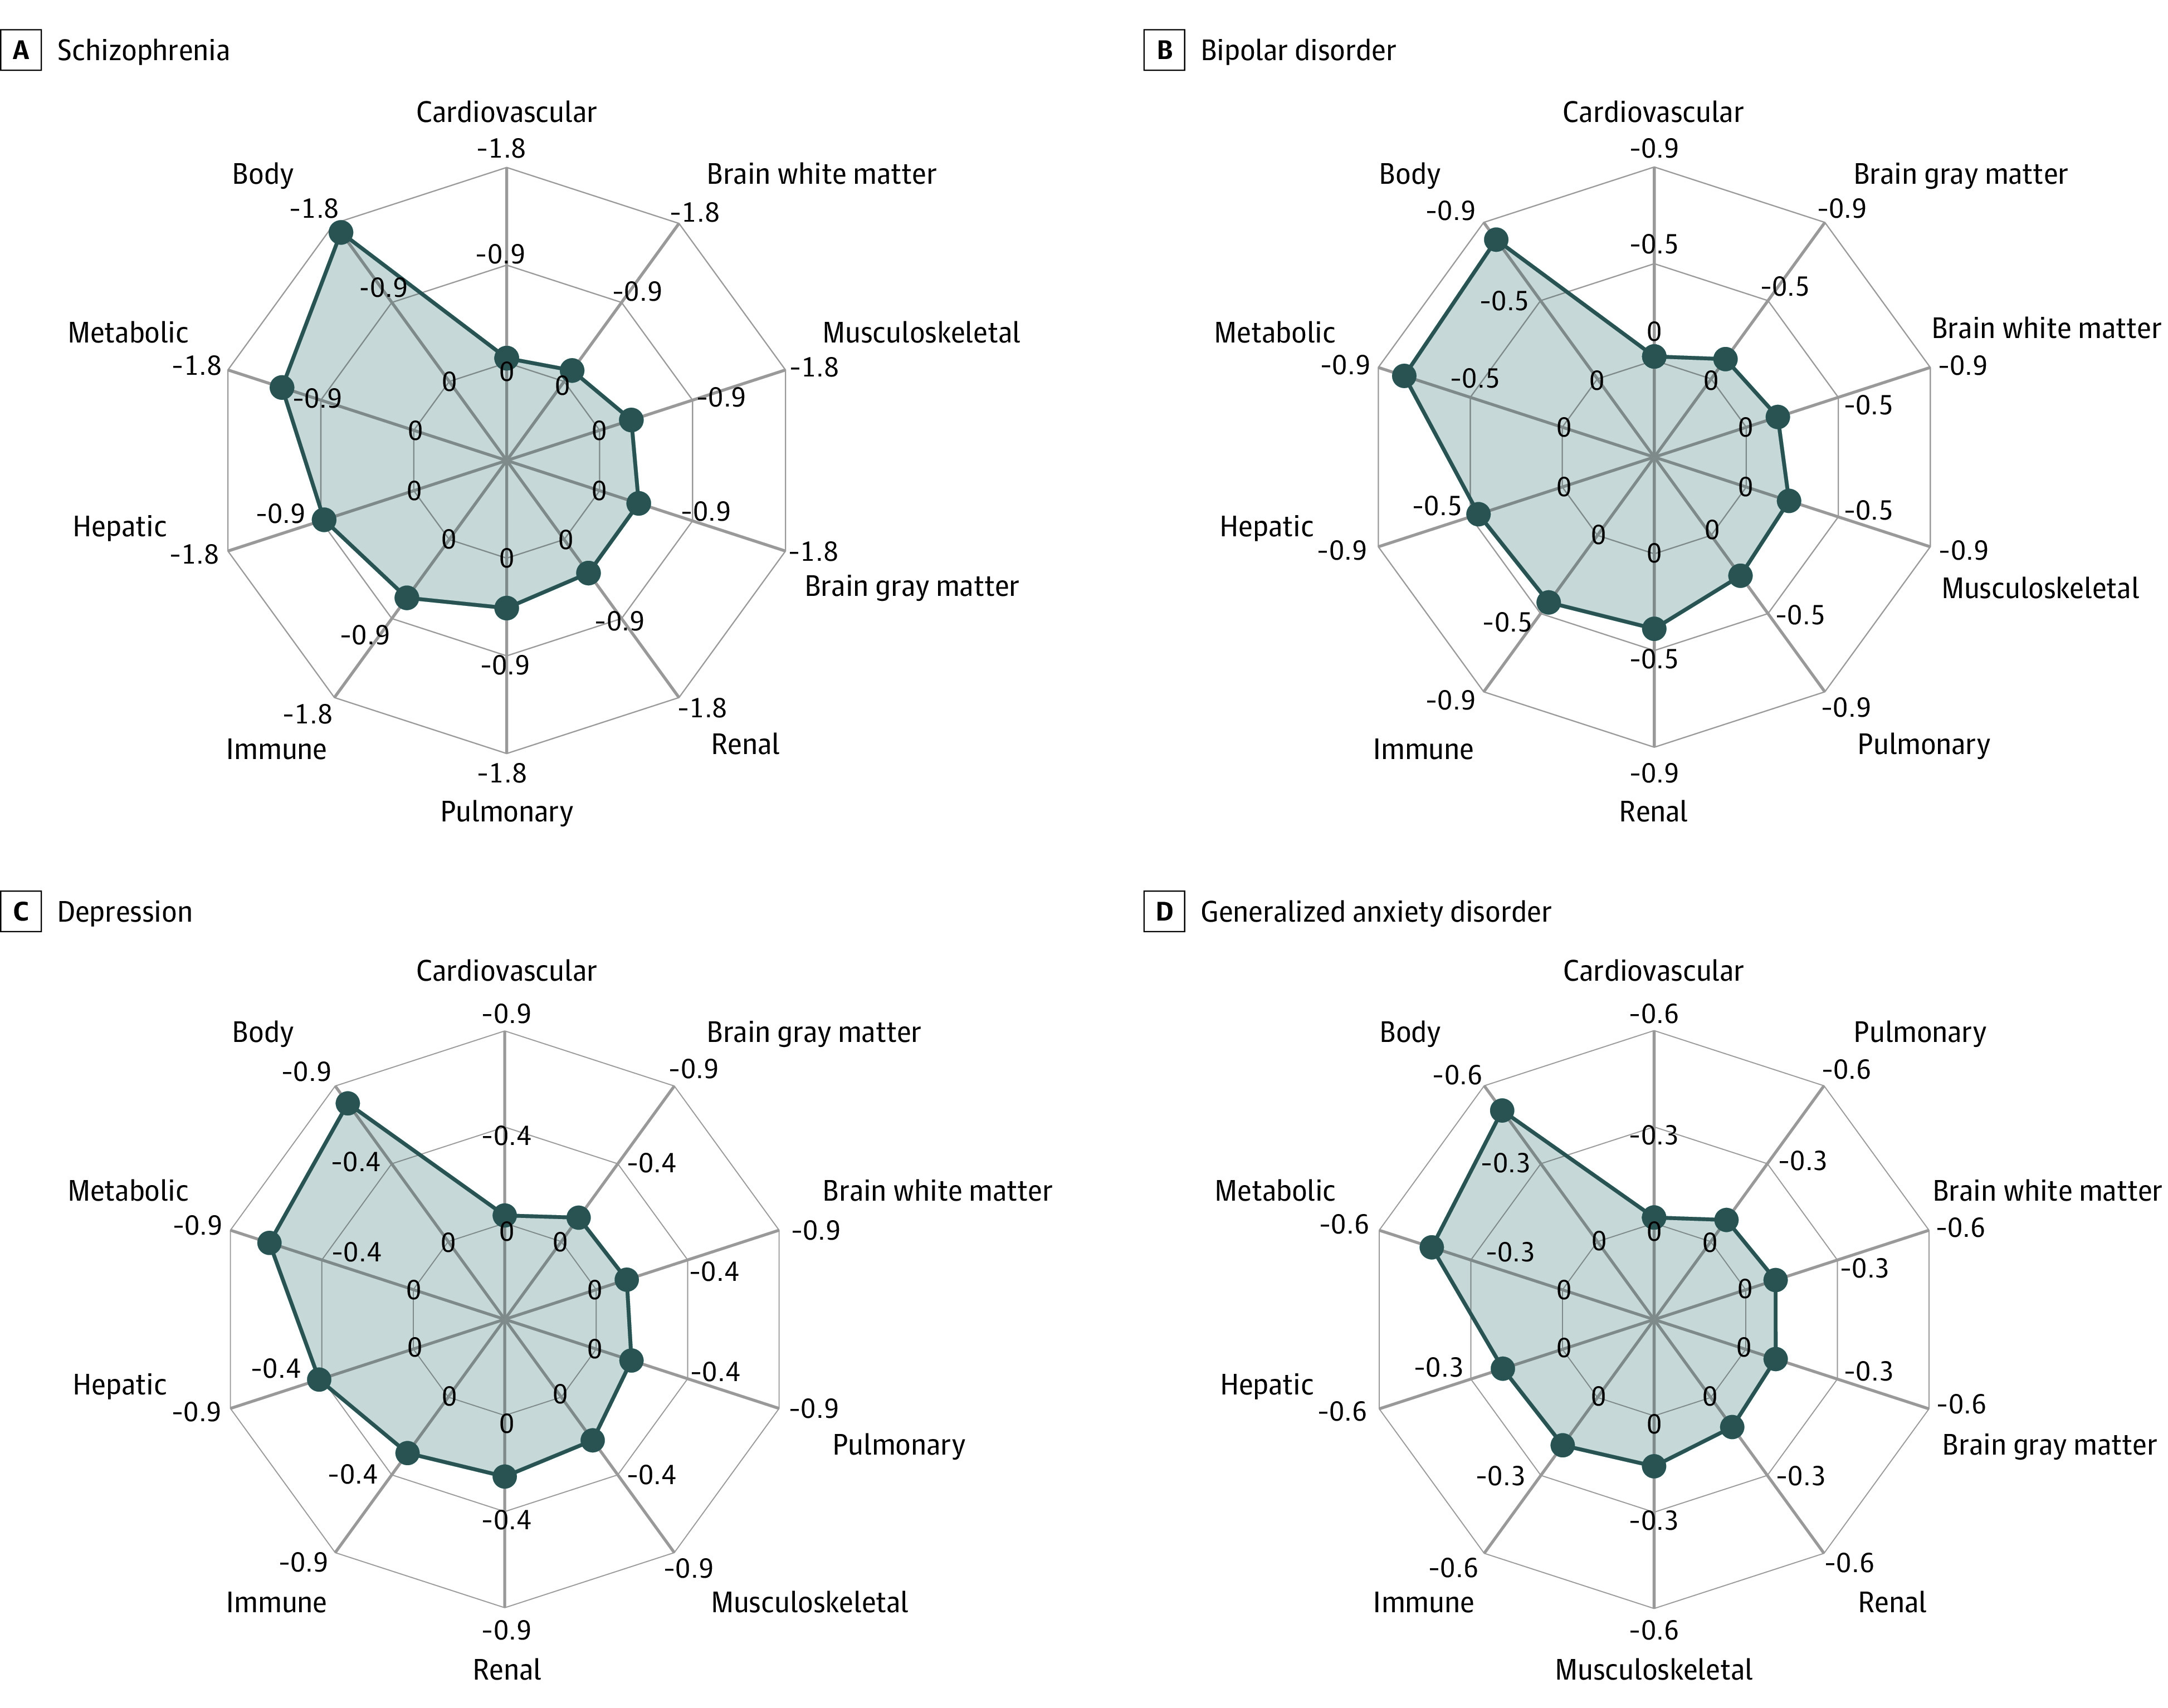
Radial plots show the mean estimated organ health scores within each neuropsychiatric disorder. Organ systems in each plot were organized counterclockwise according to the mean health score from the smallest to the largest value.
Of the disorders studied, brain health was poorest in individuals with schizophrenia (mean [SD] GM/WM OHS, −0.37 [0.63]/−0.12 [0.67]). In contrast, bipolar disorder (mean [SD] GM/WM OHS, −0.11 [0.62]/−0.16 [0.52]), depression (mean [SD] GM/WM OHS, −0.14 [0.77]/−0.15 [0.65]), and generalized anxiety disorder (mean [SD] GM/WM OHS, −0.10 [0.53]/−0.10 [0.45]) groups showed only marginally poorer brain health relative to healthy control individuals. The effect sizes observed in brain health scores were consistent with subtle structural brain changes observed in individuals with bipolar disorder, depression, or anxiety,23,24,25,26 while effect sizes for schizophrenia were relatively small to moderate.27,28 Body health was on average poorer than brain health in these patients, which may be partly explained by physical comorbidities (eFigure 7 in Supplement 1).
Diagnostic Classification Using Brain and Body Phenotypes
Despite the neural basis of the included disorders, we found that body phenotypes provided the most accurate diagnostic classification for schizophrenia (area under the receiver operating characteristic curve [AUC], 0.81; 95% CI, 0.79-0.82), bipolar disorder (AUC, 0.67; 95% CI, 0.67-0.68), depression (AUC, 0.67; 95% CI, 0.67-0.67), and generalized anxiety disorder (AUC = 0.63; 95% CI, 0.63-0.63) compared to both brain phenotypes (AUC for schizophrenia = 0.79 [95% CI, 0.79-0.79], bipolar disorder = 0.58 [95% CI, 0.57-0.58], depression = 0.58 [95% CI, 0.58-0.58], and anxiety = 0.57 [95% CI, 0.57-0.58]) and individual body systems (Figure 3A). When examining whether deviations of brain or body phenotypes would most accurately differentiate 2 neuropsychiatric diagnoses (transdiagnostic), we found that brain phenotypes substantially outperformed body phenotypes (schizophrenia-other: mean AUC for body = 0.70 [95% CI, 0.70-0.71] and mean AUC for brain = 0.79 [95% CI, 0.79-0.79]; bipolar disorder-other: mean AUC for body = 0.60 [95% CI, 0.59-0.60] and mean AUC for brain = 0.65 [95% CI, 0.65-0.65]; depression-other: mean AUC for body = 0.61 [95% CI, 0.60-0.63] and mean AUC for brain = 0.65 [95% CI, 0.65-0.66]; anxiety-other: mean AUC for body = 0.63 [95% CI, 0.62-0.63] and mean AUC for brain = 0.66 [95% CI, 0.65-0.66]) (Figure 3B).
Figure 3. Accuracy of Diagnostic and Transdiagnostic Disease Classification.
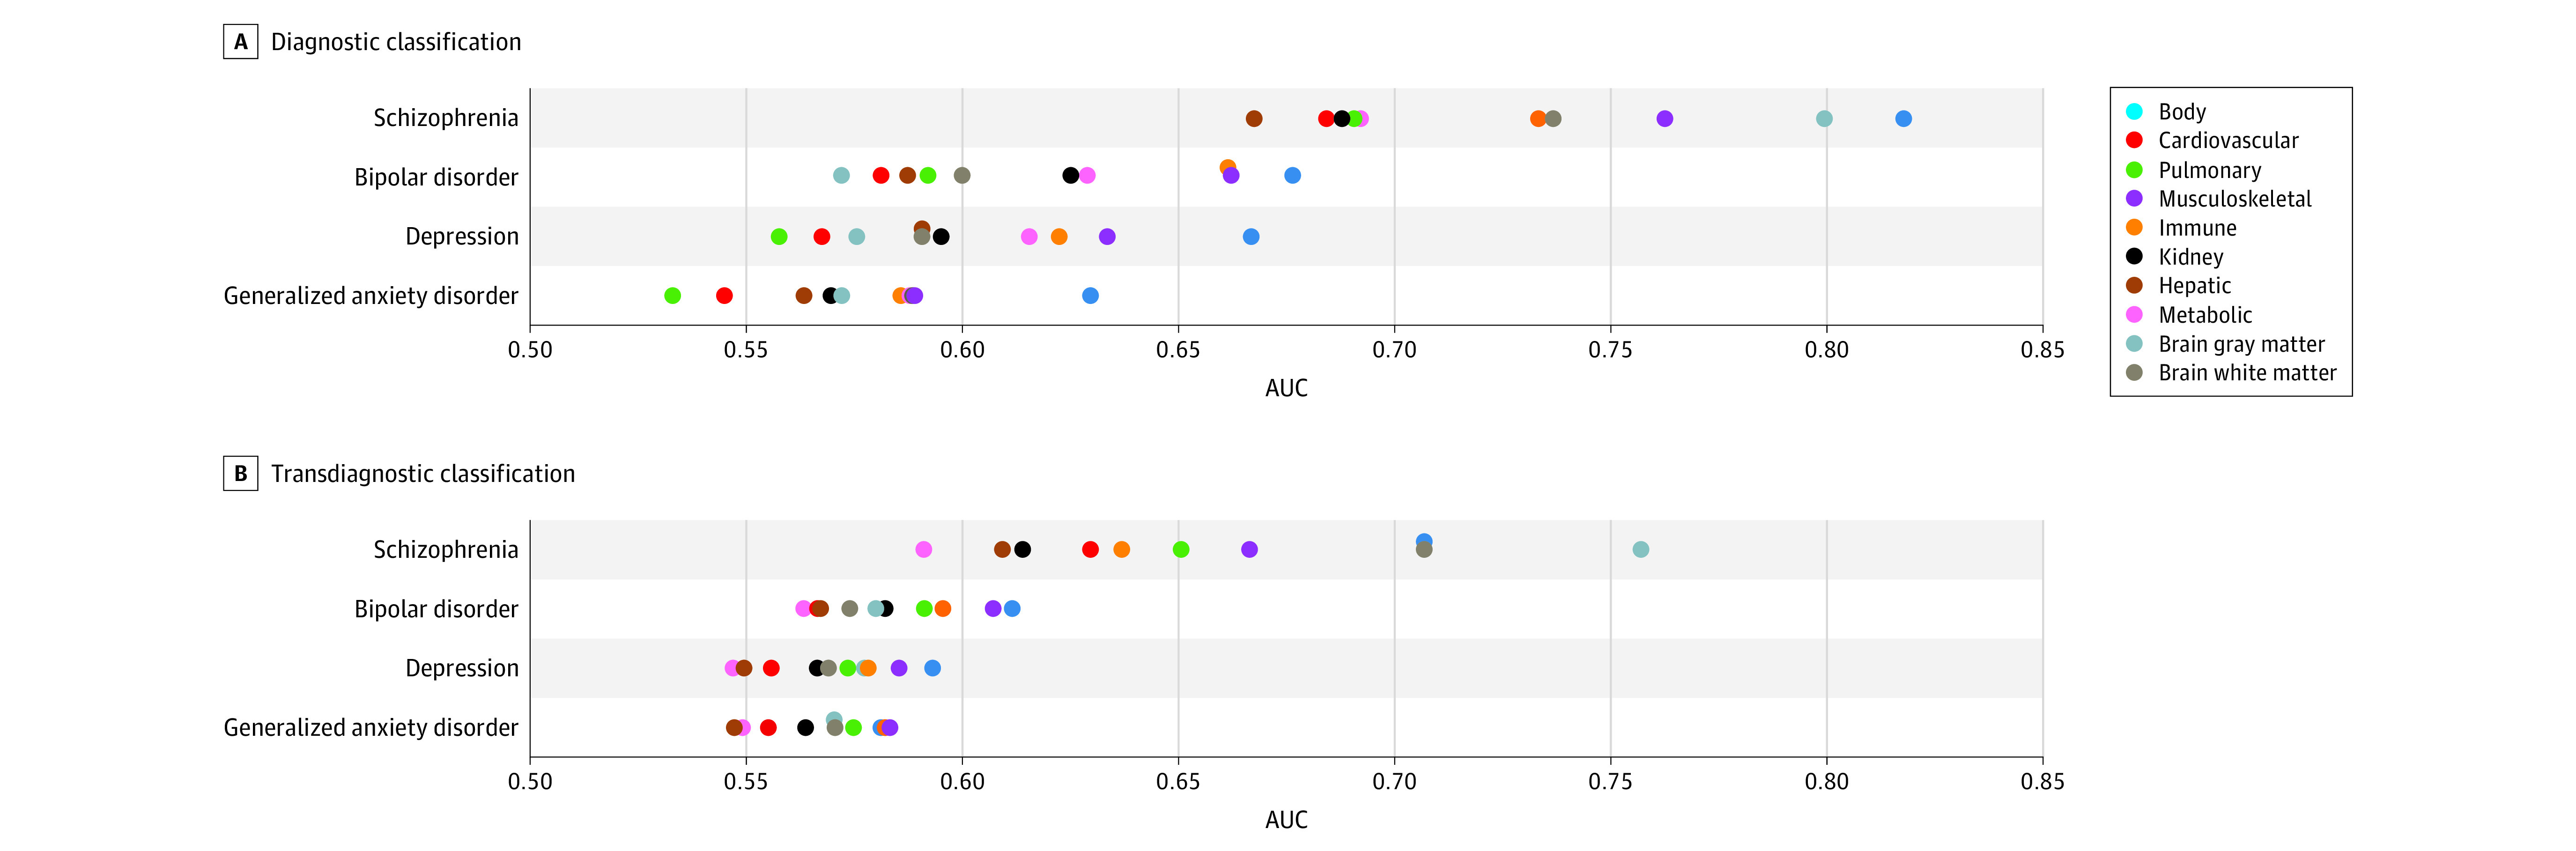
A, A logistic regression model was trained to classify an individual’s diagnostic status, including specific diseases and healthy control. Classification models were established for each organ system, using organ-specific phenotypic deviation scores. Each row represents 1 target disease group, and icons are positioned to indicate the classification accuracy, as quantified by the area under the receiver operating characteristic curve (AUC). B, A logistic regression model was trained to classify an individual’s diagnostic status between disease pairs. Each row represents 1 target disease group, and icons are positioned to the average accuracy in differentiating each disease group from all the other groups.
Supplementary Analyses
Supplementary analyses were undertaken to contrast the above findings with organ health scores evaluated in a neurodegenerative condition (dementia). Similar to the above findings, we found that dementia manifested markedly poor body health (mean [SD] OHS, −1.61 [1.73]). Most people (6269/6506 [96.4%]) had not experienced dementia onset at the time of body function assessment. However, brain health was substantially poorer in individuals with dementia (mean [SD] GM/WM OHS, −0.59 [0.56]/−0.20 [0.60]) compared to the 4 neuropsychiatric disorders studied (eFigures 4-6 in Supplement 1). Unlike these 4 neuropsychiatric disorders, we found that brain phenotypes outperformed all body systems for dementia classification (GM AUC, 0.91; 95% CI, 0.91-0.91 and WM AUC, 0.83; 95% CI, 0.83-0.84), although body phenotypes continued to provide modest diagnostic utility (AUC, 0.73; 95% CI, 0.72-0.73) (eFigure 8A in Supplement 1). This suggests that neurodegeneration was a more prominent manifestation of dementia compared to poor physical health. We also found that dementia was characterized by a distinct profile of brain deviations, enabling accurate differentiation from the other 4 diagnostic groups (mean GM AUC, 0.89; 95% CI, 0.89-0.89 and mean WM AUC, 0.81; 95% CI, 0.81-0.82) (eFigure 8B in Supplement 1). Pairwise transdiagnostic classification accuracies are shown in eFigure 9A and B in Supplement 1. High-ranked brain GM and WM phenotypes transdiagnostically associated with dementia are shown in eFigure 9C and D and eFigure 10 in Supplement 1.
Discussion
In this cross-sectional study, by establishing normative models of brain and body function over the adult life span using population-based cohorts, we mapped multisystem health profiles for 4 common neuropsychiatric disorders. We showed that individuals diagnosed with these neuropsychiatric disorders were not only characterized by deviations from normative reference ranges for brain phenotypes but also presented considerably poorer physical health across multiple body systems compared to their healthy peers. Poor physical health was a more pronounced manifestation of neuropsychiatric illness than brain health. However, brain phenotypes enabled more accurate differentiation between pairs of neuropsychiatric diagnoses.
Despite profound deviations from established normative reference ranges for multiple body systems (eg, metabolic, hepatic, immune, and kidney), chronic physical comorbidities were often not diagnosed (eFigure 7 in Supplement 1), even years after body function assessment. Disparities in these physical health outcomes may reflect the lack of physical examination,7,29 preventive screening, intervention,30,31 and access to standard health care systems common among people with mental illness.5
Across the 4 neuropsychiatric disorder groups, the metabolic, hepatic, and immune systems consistently showed poor health scores. Poor metabolic health is consistent with the commonly reported increased risk of developing metabolic diseases, including diabetes,32,33,34 metabolic syndrome,35,36 and obesity,37 in people with mental illness and may be partly attributable to adverse effects of antipsychotics38 and chronic stress.39,40 Chronic psychological stress is associated with mental illness and leads to dysregulation of the hypothalamic-pituitary-adrenal axis and endocrine and metabolic systems.41,42,43 Hence, our findings of poor metabolic health in neuropsychiatric illness could be due to chronic stress exacerbating a genetic disposition for these conditions through dysregulation of metabolic and endocrine pathways. Poor hepatic health may be associated with excessive alcohol consumption,44 higher rates of hepatitis B and hepatitis C infection,13,45 and psychotropic drug-induced hepatotoxicity46,47 in people with mental illness. In contrast, poor immune health could be a driver or consequence of the reciprocally increased risk between immune-inflammatory response and psychiatric disorders.14,48,49 Although to a lesser extent, significantly poorer kidney health was also observed in these patients, which may in part relate to the adverse effects of mood stabilizers, especially lithium,50,51 while poor pulmonary and musculoskeletal health may be associated with smoking,52 disease-related sedentary behaviors, physical inactivity,53 and social withdrawal.54
Poor body health may also be associated with premature aging in midlife. Biological brain age deviates from chronological age in a number of brain disorders.55,56 This suggests a process of accelerated brain aging and may explain why some individuals manifest increased risk of age-related disease. To test these hypotheses, longitudinal studies are needed to determine the interplay between brain and body health throughout the course of psychiatric illness.
Whereas body phenotypes were generally more accurate than the brain in diagnostic classification, classification models for brain phenotypes outperformed all body systems in differentiating distinct diagnoses. Our models are not intended for disease classification under clinical settings, but rather provide an alternative and quantitative mapping of how brain and body systems may be differentially affected in neuropsychiatric conditions. Our results suggest that patterns of abnormal deviations in brain GM and WM were relatively distinct between different neuropsychiatric disorders. This distinction was strongest for schizophrenia compared to anxiety, depression, and bipolar disorder, where the latter 3 could not be accurately differentiated. This may be partly explained by the higher comorbidity rates among the 3 disorders compared to schizophrenia in the UK Biobank cohort (eMethods in Supplement 1), diagnostic instability,57,58 and shared neurobiology and neural-behavior mechanisms59,60,61,62 across the 3 disorders.
In supplementary analyses, to provide a point of reference, we compared our findings of poor body health to a common neurodegenerative condition (ie, dementia). We found that dementia manifested the poorest brain and body health of all the disorders studied (eFigure 4 in Supplement 1). Although dementia is often associated with progressive GM loss,63,64 the most extreme deviations from normative ranges were observed in the metabolic and hepatic systems (eFigure 5 in Supplement 1), consistent with the 4 neuropsychiatric conditions. The combination of insulin resistance and hepatic dysfunction in dementia has been hypothesized to lead to inadequate clearance from the brain of amyloid and toxic metabolites produced by the liver, which cross the blood-brain barrier,65 leading to brain inflammation and pathology. Of note, body phenotypes were assessed when participants were relatively young (Table) and had not experienced dementia onset or diagnosis (prodromal, 6269/6506 [96.4%]) at the time of body function assessment. Our results suggest that physical health may have deteriorated in these individuals, possibly contributing to the risk of developing dementia later in life.66,67 Prospective studies are needed to track organ health throughout the life span and identify when body and brain systems first deviate from the normative reference ranges established here. Future work is also needed to test whether our organ health scores, especially the metabolic and hepatic health scores, can predict dementia onset and enable early identification of individuals at risk of dementia.
Our findings provide biological evidence supporting the adoption of established preventive public health principles and strategies commonly used in the general population for physical illness (eg, Diabetes Prevention Program68) in psychiatry care to complement disease-specific psychotropic medication and psychological treatments. This may be a cost-effective way to reduce disease burden and mortality across neuropsychiatric conditions.5
The physical health of people with mental illness needs to be routinely assessed and adequately managed to reduce morbidity and mortality and improve patient well-being.1,31 The organ-specific health scores developed in our study enabled a systematic and holistic evaluation of brain-body health status in people with common neuropsychiatric disorders. Further work is needed to determine whether our organ health scores enable prediction of physical comorbidity in advance of disease onset and identification of individuals at risk of developing physical illness. This in turn could drive new preventive strategies.
Limitations
This study has limitations. Body phenotypes were only available in 1 cohort (UK Biobank), and participants in this cohort had a narrower age range (37 to 74 years) than in other cohorts (18 to 95 years). This limited a comprehensive characterization of age-related changes in body systems across the adult life span. Brain health scores were restricted to MRI-derived phenotypes. Inclusion of neuroimaging phenotypes such as magnetic resonance spectroscopy of cerebral metabolites69,70 would complement the MRI-derived phenotypes used here and further characterize brain health in a way that that might be more sensitive to early brain dysfunction. Nevertheless, MRI scans and other physiological markers comprising our organ health scores are already widely accessible in clinical and primary care settings, facilitating direct, cost-effective, and feasible clinical implementation. Further, a within-individual comparison of brain and body health deviations was not feasible, because not all brain and body phenotypes were available for all individuals. It is also important to acknowledge biases inherent to the cohorts studied. UK Biobank predominantly comprises individuals of White British ancestry, and further work is needed to test our models in individuals of various races and ethnicities. Individuals with serious illness may have been unable or less likely to participate in certain assessments, yielding sampling biases in disease cohorts and underestimation of illness severity and comorbidities.71
Conclusions
In this study, marked deviations from normative reference ranges for brain and body health were evident across multiple organ systems in people with neuropsychiatric disorders in this study. The metabolic, hepatic, and immune systems showed the poorest health and function for the disorders studied. Despite the unequivocal neural basis of common neuropsychiatric disorders, the findings of this study suggest that poor body health and function may be important illness manifestations that require ongoing treatment in patients. Routinely monitoring body health and integrated physical and mental health care in psychiatric practice may provide cost-effective targets for reducing the adverse effect of physical comorbidity in people with mental illness.
eMethods
eFigure 1. Overview of study design.
eFigure 2. Comparison of model distribution among converged GAMLSS models.
eFigure 3. Examples of GAMLSS models for age-related trajectories in healthy individuals.
eFigure 4. Brain and body health scores in neuropsychiatric disorders stratified by organ system.
eFigure 5. Brain and body health scores in dementia.
eFigure 6. Distribution of brain and body health scores in neuropsychiatric disorders stratified by organ system.
eFigure 7. Physical comorbidity rates.
eFigure 8. Accuracy of diagnostic and transdiagnostic disease classification.
eFigure 9. Pairwise transdiagnostic disease classification and feature weights.
eFigure 10. Feature weights differentiating individuals with dementia from other neuropsychiatric disorders.
eTable 1. Brain gray matter phenotypes.
eTable 2. Brain white matter phenotypes.
eTable 3. Body phenotypes.
eTable 4. Disease categories used for the estimation of phenotype weights specific to each organ system.
eTable 5. Diagnostic codes of schizophrenia.
eTable 6. Diagnostic codes of depression.
eTable 7. Diagnostic codes of bipolar disorder.
eTable 8. Diagnostic codes of generalized anxiety disorder.
eTable 9. Diagnostic codes of dementia.
Data sharing statement
References
- 1.DE Hert M, Correll CU, Bobes J, et al. Physical illness in patients with severe mental disorders. I. prevalence, impact of medications and disparities in health care. World Psychiatry. 2011;10(1):52-77. doi: 10.1002/j.2051-5545.2011.tb00014.x [DOI] [PMC free article] [PubMed] [Google Scholar]
- 2.Reilly S, Olier I, Planner C, et al. Inequalities in physical comorbidity: a longitudinal comparative cohort study of people with severe mental illness in the UK. BMJ Open. 2015;5(12):e009010. doi: 10.1136/bmjopen-2015-009010 [DOI] [PMC free article] [PubMed] [Google Scholar]
- 3.Vos T, Lim SS, Abbafati C, et al. ; GBD 2019 Diseases and Injuries Collaborators . Global burden of 369 diseases and injuries in 204 countries and territories, 1990-2019: a systematic analysis for the Global Burden of Disease Study 2019. Lancet. 2020;396(10258):1204-1222. doi: 10.1016/S0140-6736(20)30925-9 [DOI] [PMC free article] [PubMed] [Google Scholar]
- 4.Vigo D, Thornicroft G, Atun R. Estimating the true global burden of mental illness. Lancet Psychiatry. 2016;3(2):171-178. doi: 10.1016/S2215-0366(15)00505-2 [DOI] [PubMed] [Google Scholar]
- 5.Firth J, Siddiqi N, Koyanagi A, et al. The Lancet Psychiatry Commission: a blueprint for protecting physical health in people with mental illness. Lancet Psychiatry. 2019;6(8):675-712. doi: 10.1016/S2215-0366(19)30132-4 [DOI] [PubMed] [Google Scholar]
- 6.Launders N, Kirsh L, Osborn DPJ, Hayes JF. The temporal relationship between severe mental illness diagnosis and chronic physical comorbidity: a UK primary care cohort study of disease burden over 10 years. Lancet Psychiatry. 2022;9(9):725-735. doi: 10.1016/S2215-0366(22)00225-5 [DOI] [PMC free article] [PubMed] [Google Scholar]
- 7.Hippisley-Cox J, Parker C, Coupland C, Vinogradova Y. Inequalities in the primary care of patients with coronary heart disease and serious mental health problems: a cross-sectional study. Heart. 2007;93(10):1256-1262. doi: 10.1136/hrt.2006.110171 [DOI] [PMC free article] [PubMed] [Google Scholar]
- 8.Jones S, Howard L, Thornicroft G. ‘Diagnostic overshadowing’: worse physical health care for people with mental illness. Acta Psychiatr Scand. 2008;118(3):169-171. doi: 10.1111/j.1600-0447.2008.01211.x [DOI] [PubMed] [Google Scholar]
- 9.Viron MJ, Stern TA. The impact of serious mental illness on health and healthcare. Psychosomatics. 2010;51(6):458-465. doi: 10.1016/S0033-3182(10)70737-4 [DOI] [PubMed] [Google Scholar]
- 10.Kim SW, Park WY, Jhon M, et al. Physical health literacy and health-related behaviors in patients with psychosis. Clin Psychopharmacol Neurosci. 2019;17(2):279-287. doi: 10.9758/cpn.2019.17.2.279 [DOI] [PMC free article] [PubMed] [Google Scholar]
- 11.Shefer G, Henderson C, Howard LM, Murray J, Thornicroft G. Diagnostic overshadowing and other challenges involved in the diagnostic process of patients with mental illness who present in emergency departments with physical symptoms–a qualitative study. PLoS One. 2014;9(11):e111682. doi: 10.1371/journal.pone.0111682 [DOI] [PMC free article] [PubMed] [Google Scholar]
- 12.Ayerbe L, Forgnone I, Foguet-Boreu Q, González E, Addo J, Ayis S. Disparities in the management of cardiovascular risk factors in patients with psychiatric disorders: a systematic review and meta-analysis. Psychol Med. 2018;48(16):2693-2701. doi: 10.1017/S0033291718000302 [DOI] [PubMed] [Google Scholar]
- 13.Hughes E, Bassi S, Gilbody S, Bland M, Martin F. Prevalence of HIV, hepatitis B, and hepatitis C in people with severe mental illness: a systematic review and meta-analysis. Lancet Psychiatry. 2016;3(1):40-48. doi: 10.1016/S2215-0366(15)00357-0 [DOI] [PMC free article] [PubMed] [Google Scholar]
- 14.Jiang M, Qin P, Yang X. Comorbidity between depression and asthma via immune-inflammatory pathways: a meta-analysis. J Affect Disord. 2014;166:22-29. doi: 10.1016/j.jad.2014.04.027 [DOI] [PubMed] [Google Scholar]
- 15.Cullen AE, Holmes S, Pollak TA, et al. Associations between non-neurological autoimmune disorders and psychosis: a meta-analysis. Biol Psychiatry. 2019;85(1):35-48. doi: 10.1016/j.biopsych.2018.06.016 [DOI] [PMC free article] [PubMed] [Google Scholar]
- 16.Scott KM, Lim C, Al-Hamzawi A, et al. Association of mental disorders with subsequent chronic physical conditions: World Mental Health Surveys from 17 countries. JAMA Psychiatry. 2016;73(2):150-158. doi: 10.1001/jamapsychiatry.2015.2688 [DOI] [PMC free article] [PubMed] [Google Scholar]
- 17.Fortin J-P, Cullen N, Sheline YI, et al. Harmonization of cortical thickness measurements across scanners and sites. Neuroimage. 2018;167:104-120. doi: 10.1016/j.neuroimage.2017.11.024 [DOI] [PMC free article] [PubMed] [Google Scholar]
- 18.Fortin J-P, Parker D, Tunç B, et al. Harmonization of multi-site diffusion tensor imaging data. Neuroimage. 2017;161:149-170. doi: 10.1016/j.neuroimage.2017.08.047 [DOI] [PMC free article] [PubMed] [Google Scholar]
- 19.Sudlow C, Gallacher J, Allen N, et al. UK Biobank: an open access resource for identifying the causes of a wide range of complex diseases of middle and old age. PLoS Med. 2015;12(3):e1001779. doi: 10.1371/journal.pmed.1001779 [DOI] [PMC free article] [PubMed] [Google Scholar]
- 20.Bethlehem RAI, Seidlitz J, White SR, et al. ; 3R-BRAIN; AIBL; Alzheimer’s Disease Neuroimaging Initiative; Alzheimer’s Disease Repository Without Borders Investigators; CALM Team; Cam-CAN; CCNP; COBRE; cVEDA; ENIGMA Developmental Brain Age Working Group; Developing Human Connectome Project; FinnBrain; Harvard Aging Brain Study; IMAGEN; KNE96; Mayo Clinic Study of Aging; NSPN; POND; PREVENT-AD Research Group; VETSA . Brain charts for the human lifespan. Nature. 2022;604(7906):525-533. doi: 10.1038/s41586-022-04554-y [DOI] [PMC free article] [PubMed] [Google Scholar]
- 21.Marquand AF, Rezek I, Buitelaar J, Beckmann CF. Understanding heterogeneity in clinical cohorts using normative models: beyond case-control studies. Biol Psychiatry. 2016;80(7):552-561. doi: 10.1016/j.biopsych.2015.12.023 [DOI] [PMC free article] [PubMed] [Google Scholar]
- 22.Rutherford S, Kia SM, Wolfers T, et al. The normative modeling framework for computational psychiatry. Nat Protoc. 2022;17(7):1711-1734. doi: 10.1038/s41596-022-00696-5 [DOI] [PMC free article] [PubMed] [Google Scholar]
- 23.Schmaal L, Hibar DP, Sämann PG, et al. Cortical abnormalities in adults and adolescents with major depression based on brain scans from 20 cohorts worldwide in the ENIGMA Major Depressive Disorder Working Group. Mol Psychiatry. 2017;22(6):900-909. doi: 10.1038/mp.2016.60 [DOI] [PMC free article] [PubMed] [Google Scholar]
- 24.Harrewijn A, Cardinale EM, Groenewold NA, et al. Cortical and subcortical brain structure in generalized anxiety disorder: findings from 28 research sites in the ENIGMA-Anxiety Working Group. Transl Psychiatry. 2021;11(1):502. doi: 10.1038/s41398-021-01622-1 [DOI] [PMC free article] [PubMed] [Google Scholar]
- 25.Hibar DP, Westlye LT, Doan NT, et al. Cortical abnormalities in bipolar disorder: an MRI analysis of 6503 individuals from the ENIGMA Bipolar Disorder Working Group. Mol Psychiatry. 2018;23(4):932-942. doi: 10.1038/mp.2017.73 [DOI] [PMC free article] [PubMed] [Google Scholar]
- 26.Winter NR, Leenings R, Ernsting J, et al. Quantifying deviations of brain structure and function in major depressive disorder across neuroimaging modalities. JAMA Psychiatry. 2022;79(9):879-888. doi: 10.1001/jamapsychiatry.2022.1780 [DOI] [PMC free article] [PubMed] [Google Scholar]
- 27.van Erp TGM, Walton E, Hibar DP, et al. ; Karolinska Schizophrenia Project . Cortical brain abnormalities in 4474 individuals with schizophrenia and 5098 control subjects via the Enhancing Neuro Imaging Genetics Through Meta Analysis (ENIGMA) consortium. Biol Psychiatry. 2018;84(9):644-654. doi: 10.1016/j.biopsych.2018.04.023 [DOI] [PMC free article] [PubMed] [Google Scholar]
- 28.van Erp TG, Hibar DP, Rasmussen JM, et al. Subcortical brain volume abnormalities in 2028 individuals with schizophrenia and 2540 healthy controls via the ENIGMA consortium. Mol Psychiatry. 2016;21(4):547-553. doi: 10.1038/mp.2015.63 [DOI] [PMC free article] [PubMed] [Google Scholar]
- 29.Burns T, Cohen A. Item-of-service payments for general practitioner care of severely mentally ill persons: does the money matter? Br J Gen Pract. 1998;48(432):1415-1416. [PMC free article] [PubMed] [Google Scholar]
- 30.Robson D, Gray R. Serious mental illness and physical health problems: a discussion paper. Int J Nurs Stud. 2007;44(3):457-466. doi: 10.1016/j.ijnurstu.2006.07.013 [DOI] [PubMed] [Google Scholar]
- 31.Saxena S, Maj M. Physical health of people with severe mental disorders: leave no one behind. World Psychiatry. 2017;16(1):1-2. doi: 10.1002/wps.20403 [DOI] [PMC free article] [PubMed] [Google Scholar]
- 32.Yu M, Zhang X, Lu F, Fang L. Depression and risk for diabetes: a meta-analysis. Can J Diabetes. 2015;39(4):266-272. doi: 10.1016/j.jcjd.2014.11.006 [DOI] [PubMed] [Google Scholar]
- 33.Smith KJ, Deschênes SS, Schmitz N. Investigating the longitudinal association between diabetes and anxiety: a systematic review and meta-analysis. Diabet Med. 2018;35(6):677-693. doi: 10.1111/dme.13606 [DOI] [PMC free article] [PubMed] [Google Scholar]
- 34.Stubbs B, Vancampfort D, De Hert M, Mitchell AJ. The prevalence and predictors of type two diabetes mellitus in people with schizophrenia: a systematic review and comparative meta-analysis. Acta Psychiatr Scand. 2015;132(2):144-157. doi: 10.1111/acps.12439 [DOI] [PubMed] [Google Scholar]
- 35.Mitchell AJ, Vancampfort D, De Herdt A, Yu W, De Hert M. Is the prevalence of metabolic syndrome and metabolic abnormalities increased in early schizophrenia? a comparative meta-analysis of first episode, untreated and treated patients. Schizophr Bull. 2013;39(2):295-305. doi: 10.1093/schbul/sbs082 [DOI] [PMC free article] [PubMed] [Google Scholar]
- 36.Vancampfort D, Stubbs B, Mitchell AJ, et al. Risk of metabolic syndrome and its components in people with schizophrenia and related psychotic disorders, bipolar disorder and major depressive disorder: a systematic review and meta-analysis. World Psychiatry. 2015;14(3):339-347. doi: 10.1002/wps.20252 [DOI] [PMC free article] [PubMed] [Google Scholar]
- 37.McElroy SL, Kotwal R, Malhotra S, Nelson EB, Keck PE, Nemeroff CB. Are mood disorders and obesity related? a review for the mental health professional. J Clin Psychiatry. 2004;65(5):634-651. doi: 10.4088/JCP.v65n0507 [DOI] [PubMed] [Google Scholar]
- 38.Reynolds GP, Kirk SL. Metabolic side effects of antipsychotic drug treatment–pharmacological mechanisms. Pharmacol Ther. 2010;125(1):169-179. doi: 10.1016/j.pharmthera.2009.10.010 [DOI] [PubMed] [Google Scholar]
- 39.Kivimäki M, Bartolomucci A, Kawachi I. The multiple roles of life stress in metabolic disorders. Nat Rev Endocrinol. 2023;19(1):10-27. doi: 10.1038/s41574-022-00746-8 [DOI] [PMC free article] [PubMed] [Google Scholar]
- 40.Mariotti A. The effects of chronic stress on health: new insights into the molecular mechanisms of brain-body communication. Future Sci OA. 2015;1(3):FSO23. doi: 10.4155/fso.15.21 [DOI] [PMC free article] [PubMed] [Google Scholar]
- 41.Yang L, Zhao Y, Wang Y, et al. The effects of psychological stress on depression. Curr Neuropharmacol. 2015;13(4):494-504. doi: 10.2174/1570159X1304150831150507 [DOI] [PMC free article] [PubMed] [Google Scholar]
- 42.Vargas T, Conley RE, Mittal VA. Chronic stress, structural exposures and neurobiological mechanisms: a stimulation, discrepancy and deprivation model of psychosis. Int Rev Neurobiol. 2020;152:41-69. doi: 10.1016/bs.irn.2019.11.004 [DOI] [PMC free article] [PubMed] [Google Scholar]
- 43.Patriquin MA, Mathew SJ. The neurobiological mechanisms of generalized anxiety disorder and chronic stress. Chronic Stress (Thousand Oaks). 2017;1:1. doi: 10.1177/2470547017703993 [DOI] [PMC free article] [PubMed] [Google Scholar]
- 44.Regier DA, Farmer ME, Rae DS, et al. Comorbidity of mental disorders with alcohol and other drug abuse. results from the Epidemiologic Catchment Area (ECA) study. JAMA. 1990;264(19):2511-2518. doi: 10.1001/jama.1990.03450190043026 [DOI] [PubMed] [Google Scholar]
- 45.Ayano G, Tulu M, Haile K, et al. A systematic review and meta-analysis of gender difference in epidemiology of HIV, hepatitis B, and hepatitis C infections in people with severe mental illness. Ann Gen Psychiatry. 2018;17:16. doi: 10.1186/s12991-018-0186-2 [DOI] [PMC free article] [PubMed] [Google Scholar]
- 46.Telles-Correia D, Barbosa A, Cortez-Pinto H, Campos C, Rocha NB, Machado S. Psychotropic drugs and liver disease: a critical review of pharmacokinetics and liver toxicity. World J Gastrointest Pharmacol Ther. 2017;8(1):26-38. doi: 10.4292/wjgpt.v8.i1.26 [DOI] [PMC free article] [PubMed] [Google Scholar]
- 47.Todorović Vukotić N, Đorđević J, Pejić S, Đorđević N, Pajović SB. Antidepressants- and antipsychotics-induced hepatotoxicity. Arch Toxicol. 2021;95(3):767-789. doi: 10.1007/s00204-020-02963-4 [DOI] [PMC free article] [PubMed] [Google Scholar]
- 48.Tylee DS, Lee YK, Wendt FR, et al. An atlas of genetic correlations and genetically informed associations linking psychiatric and immune-related phenotypes. JAMA Psychiatry. 2022;79(7):667-676. doi: 10.1001/jamapsychiatry.2022.0914 [DOI] [PMC free article] [PubMed] [Google Scholar]
- 49.Ludvigsson JF, Olén O, Larsson H, et al. Association between inflammatory bowel disease and psychiatric morbidity and suicide: a Swedish nationwide population-based cohort study with sibling comparisons. J Crohns Colitis. 2021;15(11):1824-1836. doi: 10.1093/ecco-jcc/jjab039 [DOI] [PMC free article] [PubMed] [Google Scholar]
- 50.McKnight RF, Adida M, Budge K, Stockton S, Goodwin GM, Geddes JR. Lithium toxicity profile: a systematic review and meta-analysis. Lancet. 2012;379(9817):721-728. doi: 10.1016/S0140-6736(11)61516-X [DOI] [PubMed] [Google Scholar]
- 51.Iwagami M, Mansfield KE, Hayes JF, et al. Severe mental illness and chronic kidney disease: a cross-sectional study in the United Kingdom. Clin Epidemiol. 2018;10:421-429. doi: 10.2147/CLEP.S154841 [DOI] [PMC free article] [PubMed] [Google Scholar]
- 52.Gilbody S, Peckham E, Bailey D, et al. Smoking cessation for people with severe mental illness (SCIMITAR+): a pragmatic randomised controlled trial. Lancet Psychiatry. 2019;6(5):379-390. doi: 10.1016/S2215-0366(19)30047-1 [DOI] [PMC free article] [PubMed] [Google Scholar]
- 53.Vancampfort D, Firth J, Schuch FB, et al. Sedentary behavior and physical activity levels in people with schizophrenia, bipolar disorder and major depressive disorder: a global systematic review and meta-analysis. World Psychiatry. 2017;16(3):308-315. doi: 10.1002/wps.20458 [DOI] [PMC free article] [PubMed] [Google Scholar]
- 54.Wang J, Lloyd-Evans B, Giacco D, et al. Social isolation in mental health: a conceptual and methodological review. Soc Psychiatry Psychiatr Epidemiol. 2017;52(12):1451-1461. doi: 10.1007/s00127-017-1446-1 [DOI] [PMC free article] [PubMed] [Google Scholar]
- 55.Kaufmann T, van der Meer D, Doan NT, et al. ; Karolinska Schizophrenia Project (KaSP) . Common brain disorders are associated with heritable patterns of apparent aging of the brain. Nat Neurosci. 2019;22(10):1617-1623. doi: 10.1038/s41593-019-0471-7 [DOI] [PMC free article] [PubMed] [Google Scholar]
- 56.Tian YE, Cropley V, Maier AB, Lautenschlager NT, Breakspear M, Zalesky A. Biological aging of human body and brain systems. medRxiv. 2022:2022.2009.2003.22279337.
- 57.Scholten WD, Batelaan NM, Penninx BWJH, et al. Diagnostic instability of recurrence and the impact on recurrence rates in depressive and anxiety disorders. J Affect Disord. 2016;195:185-190. doi: 10.1016/j.jad.2016.02.025 [DOI] [PubMed] [Google Scholar]
- 58.Singh T, Rajput M. Misdiagnosis of bipolar disorder. Psychiatry (Edgmont). 2006;3(10):57-63. [PMC free article] [PubMed] [Google Scholar]
- 59.van Tol MJ, van der Wee NJ, van den Heuvel OA, et al. Regional brain volume in depression and anxiety disorders. Arch Gen Psychiatry. 2010;67(10):1002-1011. doi: 10.1001/archgenpsychiatry.2010.121 [DOI] [PubMed] [Google Scholar]
- 60.Brandl F, Weise B, Mulej Bratec S, et al. Common and specific large-scale brain changes in major depressive disorder, anxiety disorders, and chronic pain: a transdiagnostic multimodal meta-analysis of structural and functional MRI studies. Neuropsychopharmacology. 2022;47(5):1071-1080. doi: 10.1038/s41386-022-01271-y [DOI] [PMC free article] [PubMed] [Google Scholar]
- 61.Drevets WC, Price JL, Furey ML. Brain structural and functional abnormalities in mood disorders: implications for neurocircuitry models of depression. Brain Struct Funct. 2008;213(1-2):93-118. doi: 10.1007/s00429-008-0189-x [DOI] [PMC free article] [PubMed] [Google Scholar]
- 62.Goodkind M, Eickhoff SB, Oathes DJ, et al. Identification of a common neurobiological substrate for mental illness. JAMA Psychiatry. 2015;72(4):305-315. doi: 10.1001/jamapsychiatry.2014.2206 [DOI] [PMC free article] [PubMed] [Google Scholar]
- 63.Thompson PM, Hayashi KM, de Zubicaray G, et al. Dynamics of gray matter loss in Alzheimer’s disease. J Neurosci. 2003;23(3):994-1005. doi: 10.1523/JNEUROSCI.23-03-00994.2003 [DOI] [PMC free article] [PubMed] [Google Scholar]
- 64.Frisoni GB, Testa C, Zorzan A, et al. Detection of grey matter loss in mild Alzheimer’s disease with voxel based morphometry. J Neurol Neurosurg Psychiatry. 2002;73(6):657-664. doi: 10.1136/jnnp.73.6.657 [DOI] [PMC free article] [PubMed] [Google Scholar]
- 65.Shang Y, Widman L, Hagström H. Nonalcoholic fatty liver disease and risk of dementia. a population-based cohort study. Neurology. 2022;99(6):e574-e582. doi: 10.1212/WNL.0000000000200853 [DOI] [PMC free article] [PubMed] [Google Scholar]
- 66.Grande G, Qiu C, Fratiglioni L. Prevention of dementia in an ageing world: Evidence and biological rationale. Ageing Res Rev. 2020;64:101045. doi: 10.1016/j.arr.2020.101045 [DOI] [PubMed] [Google Scholar]
- 67.Norton S, Matthews FE, Barnes DE, Yaffe K, Brayne C. Potential for primary prevention of Alzheimer’s disease: an analysis of population-based data. Lancet Neurol. 2014;13(8):788-794. doi: 10.1016/S1474-4422(14)70136-X [DOI] [PubMed] [Google Scholar]
- 68.Knowler WC; Diabetes Prevention Program (DPP) Research Group . The Diabetes Prevention Program (DPP): description of lifestyle intervention. Diabetes Care. 2002;25(12):2165-2171. doi: 10.2337/diacare.25.12.2165 [DOI] [PMC free article] [PubMed] [Google Scholar]
- 69.Smucny J, Carter CS, Maddock RJ. Medial prefrontal cortex glutamate is reduced in schizophrenia and moderated by measurement quality: a meta-analysis of proton magnetic resonance spectroscopy studies. Biol Psychiatry. 2021;90(9):643-651. doi: 10.1016/j.biopsych.2021.06.008 [DOI] [PMC free article] [PubMed] [Google Scholar]
- 70.Simmonite M, Steeby CJ, Taylor SF. Medial frontal cortex GABA concentrations in psychosis spectrum and mood disorders: a meta-analysis of proton magnetic resonance spectroscopy studies. Biol Psychiatry. 2023;93(2):125-136. doi: 10.1016/j.biopsych.2022.08.004 [DOI] [PMC free article] [PubMed] [Google Scholar]
- 71.Swanson JM. The UK Biobank and selection bias. Lancet. 2012;380(9837):110. doi: 10.1016/S0140-6736(12)61179-9 [DOI] [PubMed] [Google Scholar]
Associated Data
This section collects any data citations, data availability statements, or supplementary materials included in this article.
Supplementary Materials
eMethods
eFigure 1. Overview of study design.
eFigure 2. Comparison of model distribution among converged GAMLSS models.
eFigure 3. Examples of GAMLSS models for age-related trajectories in healthy individuals.
eFigure 4. Brain and body health scores in neuropsychiatric disorders stratified by organ system.
eFigure 5. Brain and body health scores in dementia.
eFigure 6. Distribution of brain and body health scores in neuropsychiatric disorders stratified by organ system.
eFigure 7. Physical comorbidity rates.
eFigure 8. Accuracy of diagnostic and transdiagnostic disease classification.
eFigure 9. Pairwise transdiagnostic disease classification and feature weights.
eFigure 10. Feature weights differentiating individuals with dementia from other neuropsychiatric disorders.
eTable 1. Brain gray matter phenotypes.
eTable 2. Brain white matter phenotypes.
eTable 3. Body phenotypes.
eTable 4. Disease categories used for the estimation of phenotype weights specific to each organ system.
eTable 5. Diagnostic codes of schizophrenia.
eTable 6. Diagnostic codes of depression.
eTable 7. Diagnostic codes of bipolar disorder.
eTable 8. Diagnostic codes of generalized anxiety disorder.
eTable 9. Diagnostic codes of dementia.
Data sharing statement