

Abstract
Human in vitro oogenesis provides a framework for clarifying the mechanism of human oogenesis. To create its benchmark, it is vital to promote in vitro oogenesis using a model physiologically close to humans. Here, we establish a foundation for in vitro oogenesis in cynomolgus (cy) monkeys (Macaca fascicularis): cy female embryonic stem cells harboring one active and one inactive X chromosome (Xa and Xi, respectively) differentiate robustly into primordial germ cell‐like cells, which in xenogeneic reconstituted ovaries develop efficiently into oogonia and, remarkably, further into meiotic oocytes at the zygotene stage. This differentiation entails comprehensive epigenetic reprogramming, including Xi reprogramming, yet Xa and Xi remain epigenetically asymmetric with, as partly observed in vivo, incomplete Xi reactivation. In humans and monkeys, the Xi epigenome in pluripotent stem cells functions as an Xi‐reprogramming determinant. We further show that developmental pathway over‐activations with suboptimal up‐regulation of relevant meiotic genes impede in vitro meiotic progression. Cy in vitro oogenesis exhibits critical homology with the human system, including with respect to bottlenecks, providing a salient model for advancing human in vitro oogenesis.
Keywords: epigenetic reprogramming, in vitro oogenesis, meiotic prophase, primates, X‐chromosome reprogramming
Subject Categories: Development, Methods & Resources, Stem Cells & Regenerative Medicine
In vitro maturation of monkey pluripotent stem cells into fetal oocytes provides a unique model for advancing human oogenesis.
Introduction
Germ cells are a source of totipotency and evolution. They function for the generation of new individuals, thereby propagating and diversifying genetic and epigenetic information across generations. On the other hand, anomalies in germ‐cell development result in critical consequences, including infertility and genetic/epigenetic disorders of offspring. Human in vitro gametogenesis (IVG) aims at reconstituting multi‐stepped human oogenic or spermatogenic development in vitro using pluripotent stem cells (PSCs) as a starting material (Saitou & Hayashi, 2021). IVG will provide a vital tool for elucidating the mechanism of human germ cell development, including the disease states, as well as for opening up novel therapeutic possibilities.
For the reconstitution of human oogenic development, based on the concepts underlying in vitro oogenesis in mice (Hayashi et al, 2012; Hikabe et al, 2016), human PSCs (hPSCs) are first induced into human primordial germ cell‐like cells (hPGCLCs; Irie et al, 2015; Sasaki et al, 2015; Yokobayashi et al, 2017), which, upon aggregation with mouse embryonic ovarian somatic cells [xenogeneic reconstituted ovaries (xrOvaries)], differentiate into oogonia with epigenetic reprogramming and then into early oocyte‐like cells in preparation for meiotic recombination [“retinoic acid (RA)‐responsive” cell‐like cells, corresponding to the pre‐leptotene stage prior to the first meiotic prophase] (Li et al, 2017; Yamashiro et al, 2018, 2020). On the other hand, the efficiency for the differentiation of hPGCLCs into oogonia and RA‐responsive cell‐like cells in xrOvaries under the current condition is generally low, and the precise mechanisms underlying the progression and the arrest of the oogenic pathway remain unclear (Yamashiro et al, 2018, 2020).
For the goal of promoting human in vitro oogenesis, a key parameter requiring careful evaluation is the activity of X chromosomes. Females have two copies of gene‐rich X chromosomes, whereas males bear one X and one gene‐poor Y chromosome. To ensure a balanced X‐chromosome gene dosage between the sexes, epigenetic mechanisms inactivate one X chromosome (Xi) in females early in development (Lyon, 1961; Ohno, 1967; Zylicz & Heard, 2020). Concurrently, to compensate for the X chromosome:autosome (X:A) gene dosage, one active X chromosome (Xa) gains hyperactivation (X‐chromosome up‐regulation: XCU) in both females and males (Ohno, 1967; Deng et al, 2014; Larsson et al, 2019). As a result, somatic cells acquire and maintain one hyperactive Xa and one Xi. On the other hand, in female germ cells, epigenetic reprogramming reactivates Xi (X‐chromosome reactivation: XCR) and erases XCU on Xa, and consequently, fetal oocyte development proceeds with two Xa with little/no XCU, a dosage compensation state unique to fetal oocytes (Monk & McLaren, 1981; Tam et al, 1994; Sugimoto & Abe, 2007; Sangrithi et al, 2017; Vertesy et al, 2018; Chitiashvili et al, 2020; Mizuta et al, 2022). This reprogramming is critical not only for oocyte development but also, upon meiosis, for passing on an epigenetically equivalent X chromosome to the next generation (Monk & McLaren, 1981; Tam et al, 1994; Sugimoto & Abe, 2007; Vertesy et al, 2018). While hPSCs typically bear one hyperactive Xa and one Xi, they exhibit substantial epigenetic instability on Xi (Mekhoubad et al, 2012; Nazor et al, 2012; Vallot et al, 2015; Patel et al, 2017; Sahakyan et al, 2017; Bar et al, 2019; Yokobayashi et al, 2021), and the impact of such instability on human in vitro oogenesis remains unclarified. Thus, more detailed characterization and further development of human in vitro oogenesis are important areas of investigation.
As a parallel effort, in order to further foster human in vitro oogenesis while simultaneously creating a benchmark for its critical assessment, it is important to promote in vitro oogenesis research using a model with close physiology to humans, such as non‐human primates. Such investigations will also provide evolutionary insight into the mechanism of mammalian germ cell development. Cynomolgus monkeys (Macaca fascicularis; cy) are a primate closely related to humans (~8 million years of evolutionary difference from humans) and are a robust model for various biomedical investigations, including studies on developmental biology (Nakamura et al, 2021). They are thus highly suitable for use in in vitro oogenesis research. Accordingly, cyPSCs have been induced into cyPGCLCs (Sakai et al, 2019), and a recent study has shown that cy fetal oocyte development involves transcriptome dynamics similar to those in humans and that cy and human fetal ovarian reaggregates undergo appropriate maturation under the same in vitro culture condition, during which oogonia enter and complete the meiotic prophase, that is, mitotic oogonia differentiate into “RA‐responsive” (pre‐leptotene/leptotene), “meiotic” (zygotene/pachytene), and “oogenic” (diplotene) cells to form primordial follicles with granulosa cells in vitro (Mizuta et al, 2022).
Building on the above rationale/findings, we here set out to conduct in vitro oogenesis in cynomolgus monkeys. We found that in xrOvaries, cyPGCLCs differentiate rapidly into oogonia, then into “RA‐responsive” cell‐like cells, and then, remarkably, into “meiotic” cell‐like cells at the zygotene/pachytene stage. The progression from cyPGCLCs to oogonia to fetal oocyte‐like cells entails complete epigenetic reprogramming and broadly normal X‐chromosome dosage compensation. Nonetheless, Xi reactivation is partial, and characteristic epigenetic asymmetry remains between Xa and Xi, which is also partly observed in vivo. Based on a comparison between cy fetal oocyte‐like cells and human oogonia‐like cells, we then defined the Xi epigenetic state in PSCs as an Xi reprogramming determinant. Finally, a single‐cell transcriptome analysis delineated an in vitro versus in vivo transcriptome divergence upon oogonia‐to‐oocytes transition, with the in vitro pathway over‐activating a distinctive developmental program with suboptimal up‐regulation of some “RA‐responsive”/“meiotic” genes. Thus, by creating a foundation for cy in vitro oogenesis, our study uncovered the critical homology between human and cy in vitro oogenesis, including their bottlenecks, providing critical insights for advancing human in vitro oogenesis.
Results
Female cyESCs stably maintain one Xa and one Xi
To set out to conduct in vitro oogenesis in cynomolgus monkeys, we derived five independent female cyESC lines (3/15/18/19/22XRi lines) and cultured them in a primed state of pluripotency (see Materials and Methods; Sakai et al, 2019). Under this condition, all five lines (passage numbers 6–18, Dataset EV9) as well as one male line that bears a robust competence for cyPGCLC induction [656 Blimp1‐tdTomato:TFAP2C‐EGFP (BTAG) #42] (passage numbers 34–35, Dataset EV9; Sakai et al, 2019) formed flat and compacted colonies and grew exponentially with the maintenance of normal karyotype (Fig 1A–C). All lines uniformly expressed the key pluripotency markers POU5F1, SOX2, and NANOG (Fig 1D, Appendix Fig S1A).
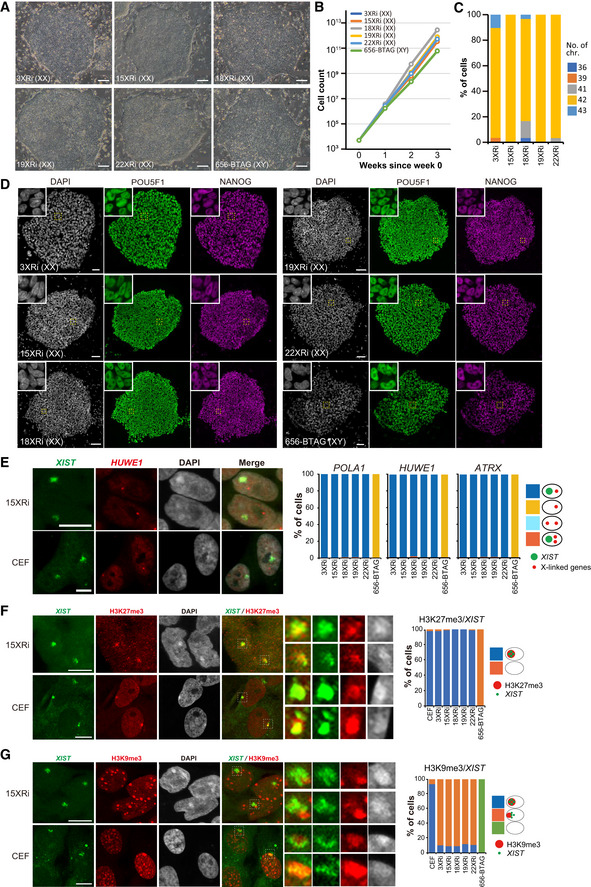
Figure 1. Female cyESC lines and their X‐chromosome properties.
-
APhase‐contrast images of five female (XX: 3/15/18/19/22XRi) cyESC lines and one male (XY: 656‐BTAG) cyESC line. Scale bars, 100 μm.
-
BGrowth curve of the cyESC lines. cyESCs were passaged every week (circles).
-
CKaryotype of the female cyESC lines. cyESCs were passaged 6–18 times before analysis. Thirty nuclei were analyzed for quantification for each line.
-
DImmunofluorescence (IF) images of cyESC colonies stained for pluripotency markers (POU5F1, NANOG). The colonies were counterstained with DAPI. Magnified images of the dotted boxed areas are shown in the insets. Scale bars, 100 μm.
-
E−GX‐chromosome properties of cyESC lines and cy embryonic fibroblasts (CEFs). (E) XIST (green), and HUWE1 (red) expression analyzed by RNA fluorescence in situ hybridization (RNA‐FISH). Representative images for 15XRi and CEFs are shown. The bar graphs, including the data for POLA1 and ATRX, show the percentages of cells with the indicated staining patterns. (F and G) XIST expression (green) and histone modifications (red) [H3K27me3 (F) and H3K9me3 (G)] analyzed by RNA‐FISH followed by IF. Representative images for 15XRi and CEFs are shown. Representative XIST‐positive areas (X chromosomes, dotted boxed areas) were magnified in the right panels. The bar graphs show the percentages of cells with the indicated staining patterns (n = 100 nuclei in each cell line). Scale bars, 10 μm.
Source data are available online for this figure.
To examine their X‐chromosome states, we performed RNA fluorescence in situ hybridization (RNA FISH) for XIST (X‐inactive‐specific transcript), the long non‐coding RNA that is typically expressed from and marks Xi (Brockdorff et al, 1992; Brown et al, 1992; Okamoto et al, 2011, 2021), and three representative X‐linked genes, POLA1, HUWE1, and ATRX, which are expressed from Xa. In nearly all nuclei in the female lines (passage numbers 9–21, Dataset EV9), XIST was detected as a single, relatively diffuse signal and localized in the DAPI‐dense area, most likely Xi, whereas the X‐linked genes were detected as single punctate signals with distinct localizations from XIST, most likely on Xa (Fig 1E, Appendix Fig S1B). The expression/localization of XIST and the X‐linked genes in cyESCs were similar to those in female cy embryonic fibroblasts (CEFs), except that in CEFs, the XIST signals were more compact and more frequently associated with the nuclear periphery with high DAPI density (Xi; Fig 1E, Appendix Fig S1B). We performed XIST RNA FISH followed by immunofluorescence (IF) analysis for two representative repressive histone modifications, histone H3 lysine 27 tri‐methylation (H3K27me3) and histone H3 lysine 9 tri‐methylation (H3K9me3). In CEFs, Xi with an XIST coating and high DAPI density was enriched with both H3K27me3 and H3K9me3 (Fig 1F and G). Notably, in nearly all nuclei in female cyESCs (passage numbers 9–21, Dataset EV9), H3K27me3 was strongly enriched in the XIST‐positive areas, whereas H3K9me3 did not show such an enrichment, but was often localized to a periphery of the XIST‐positive domains (Fig 1F and G, Appendix Fig S1C and D). Full‐length RNA sequencing analysis verified that the five female cyESCs expressed XIST and the X‐linked genes at a similar level (Appendix Fig S1E). Thus, unlike typical human female PSCs, all female cyESCs cultured under our condition bear one Xa and stably maintain one Xi, which is associated with a high level of H3K27me3 but not H3K9me3.
cyPGCLCs differentiate robustly into oogonia with faster kinetics than hPGCLCs
To induce cyPGCLCs, we cultured five female cyESC lines and one male cyESC line under a floating condition in the presence of key cytokines including bone morphogenetic protein 4 (BMP4; Sakai et al, 2019; Appendix Fig S2A). On day 8 (d8) of induction, we performed fluorescence‐activated cell sorting (FACS) by surface markers for cyPGCLCs, PDPN, and ITGA6 (Sakai et al, 2019), which revealed that cyPGCLC induction efficiency varied among the cyESC lines: 3/15/22XRi showed a high induction efficiency comparable to that of the male line (~40–70%), whereas 18/19XRi exhibited a lower efficiency (~10–30%; Appendix Fig S2B and C). The PDPN‐positive(+)/ITGA6+ cells expressed key pluripotency markers (POU5F1, NANOG) and transcription factors for cyPGC specification (SOX17, TFAP2C, PRDM1), but were negative for oogonia markers (DDX4, DAZL; Appendix Fig S2D). IF analyses of the floating aggregates gave a consistent result (Appendix Fig S2E).
We next explored whether, like hPGCLCs (Yamashiro et al, 2018, 2020), cyPGCLCs differentiate into oogonia in xrOvaries with mouse embryonic ovarian somatic cells. We sorted d8 PDPN+/ITGA6+ cells induced from the five female lines and BT+AG+ cells induced from the male line (5,000 cells), aggregated them with mouse embryonic ovarian somatic cells at embryonic day (E) 12.5 (75,000 cells), and following aggregate formation under a floating condition for 2 days, transferred the aggregates to an air–liquid interface culture (Appendix Fig S2A). All xrOvaries maintained an integrated morphology at least until around day 21 of the air–liquid interface culture (ag21), but some began to exhibit a disintegrated morphology, presumably due to de‐differentiation of PDPN+/ITGA6+ cells, from around ag28, and all xrOvaries with PDPN+/ITGA6+ cells from the 3XRi line showed highly aberrant morphology with extensive expansion of de‐differentiated cells by ag35 (Appendix Fig S3A). Nonetheless, a substantial fraction of xrOvaries with PDPN+/ITGA6+ cells from the other lines remained integrated at least until ag35 (Appendix Fig S3A). All xrOvaries with BT+AG+ cells from the male line showed an integrated morphology until ag35 (Appendix Fig S3A).
We performed IF analyses to examine the differentiation of the PDPN+/ITGA6+ cell‐derived cells, which are positive for human mitochondrial antigen (hMit), in xrOvaries at ag35, except those xrOvaries containing the 3XRi‐derived cells. All xrOvaries contained many TFAP2C+ cells (Appendix Fig S3B and D), and while the TFAP2C+/hMit+ cell ratio was high in xrOvaries with BT+AG+ cells from the male line (~80% on average), it was relatively low in xrOvaries with PDPN+/ITGA6+ cells from the female lines (~10–55% on average; Appendix Fig S3D), confirming the notion that some PDPN+/ITGA6+ cells de‐differentiate into TFAP2C‐negative(−) non‐cyPGCLCs in xrOvaries. On the other hand, remarkably, a substantial fraction (~5–20%) of the TFAP2C+ cells in all xrOvaries expressed DDX4 (Appendix Fig S3C and D), indicating that cyPGCLCs differentiate into oogonia with faster kinetics than hPGCLCs, which exhibit an equivalent differentiation only after ag77 (Yamashiro et al, 2018, 2020).
cyPGCLCs differentiate into oocyte‐like cells at the zygotene stage of the meiotic prophase
To more precisely examine the differentiation dynamics of cyPGCLCs in xrOvaries, we isolated cyESC lines expressing EGFP and tdTomato under the control of TFAP2C and DDX4, respectively [TFAP2C‐EGFP; DDX4 (cy vasa homologue)‐tdTomato (AGVT)], using the CRISPR/Cas9‐based homologous recombination technology (Cong et al, 2013; Appendix Fig S4A and B). We used 15XRi as the parental line, since it differentiates into cyPGCLCs and then into DDX4+ oogonia at a high efficiency, with a modest de‐differentiation in xrOvaries (Appendix Fig S3D). We cloned two independent AGVT lines (15XRi AGVT #7 and #105; passage numbers 15–25; Dataset EV9), which showed a normal karyotype and were robustly induced into AG+ cyPGCLCs (Appendix Fig S4C–F).
We generated xrOvaries with d8 AG+VT− cells (d8 cyPGCLCs) from the 15XRi AGVT #7 line (Fig 2A). At ag7, the xrOvaries showed a round, compacted morphology, and FACS analysis revealed the presence of an abundant number of AG+VT− cyPGCLCs (~10,000 cells/xrOvary; Fig 2B and C). At ag21, the xrOvaries became enlarged in size with increased numbers of AG+VT− cyPGCLCs (~17,000 cells/xrOvary) and, notably, incipient AG+VT+ oogonial cells (AG+VT+/AG+: ~2%; Fig 2B and C). At ag35, the xrOvaries appeared to somewhat flatten at their peripheries, and the AG+ cell number declined (~5,000 cells/xrOvary), but with an increase of AG+VT+ cells (AG+VT+/AG+: ~20%; Fig 2B and C). At ag49, the xrOvaries maintained a similar structure but with several cystic enlargements, and the AG+ cell number remained relatively constant (~5,000 cells/xrOvary) with a further increase of AG+VT+ cells (AG+VT+/AG+: > ~50%; Fig 2B and C). At ag63 and 77, the AG+ cell number declined substantially (~2,000 and 500 cells/xrOvary, respectively), with the majority being AG+VT+ and a small number of the cells differentiated into the AG−VT+ state (Fig 2C). In good agreement with this finding, IF analysis at ag77 revealed that a majority of DDX4+ cells expressed EGFP (AG) and were negative for “RA‐responsive” (SYCP3) or “meiotic” (γH2AX/DMC1/SYCP1) markers, indicating their oogonia identity (Appendix Fig S5A). Compared to the xrOvaries with PDPN+/ITGA6+ cells, those with d8 AG+VT− cells showed a lesser tendency for disintegration (Fig 2B, Appendix Fig S3A), most likely because AG+VT− cells represent a purer population of cyPGCLCs.
Figure 2. Induction of cyPGCLCs and their differentiation in xrOvaries.
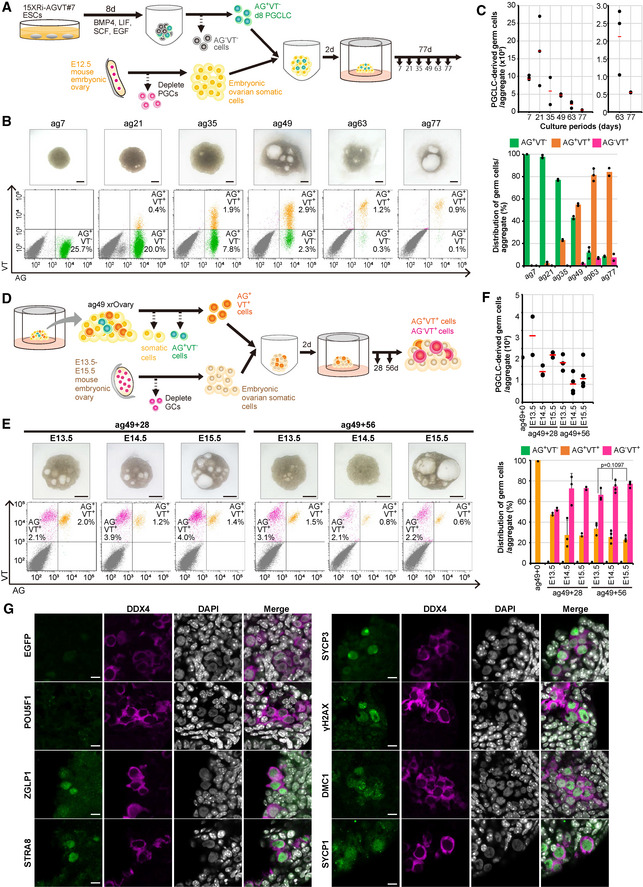
- Scheme of xrOvary culture. cyPGCLCs induced from the 15XRi AGVT line were aggregated with mouse embryonic ovarian somatic cells at E12.5 (xrOvaries) and cultured as indicated.
- (top) Bright‐field images of xrOvaries at the indicated time points. Scale bars, 1 mm. (bottom) AGVT expression dynamics analyzed by FACS. Percentages (/all live cells in xrOvaries) of germ cells with the indicated expression profiles are indicated.
- (top) Numbers of cyPGCLC‐derived germ cells/xrOvary at the indicated time points. Red lines indicate the average of two or three biological replicates. (bottom) Percentages of the indicated cells/germ cells. Standard deviations (SDs) are shown as error bars. Total numbers of cyPGCLC‐derived germ cells and AG+VT−/AG+VT+/AG−VT+ proportions were plotted based on the quantification of whole xrOvaries by FACS analysis. Dots represent individual data points of two or three biological replicates.
- Scheme of xrOvary passage culture. AG+VT+ cells in xrOvaries at ag49 were re‐aggregated with mouse embryonic ovarian somatic cells at E13.5/14.5/15.5 and cultured for an additional 28 or 56 days (ag49+28 or +56).
- (top) Bright‐field images of xrOvaries at ag49+28 or +56 with mouse embryonic ovarian somatic cells at the indicated embryonic days. Scale bars, 2 mm. (bottom) AGVT expression dynamics analyzed by FACS. Percentages (/all live cells in xrOvaries) of germ cells with the indicated expression profiles are indicated.
- (top) Numbers of AG+VT+ cell‐derived cells/xrOvary at the indicated time points. Red lines indicate the average of two or more biological replicates. (bottom) Percentages of the indicated cells/germ cells. SDs are shown as error bars. Total numbers of cyPGCLC‐derived germ cells and AG+VT−/AG+VT+/AG−VT+ proportions were plotted based on the quantification of whole xrOvaries by FACS analysis. The P‐value was calculated using the Kruskal–Wallis test. The numbers of xrOvaries analyzed were 2, 3, 2, 3, 4, and 4 for ag49+28 and +56 xrOvaries with E13.5, E14.5, and E15.5 mouse ovarian somatic cells. Dots represent individual data points.
- Representative IF images for the indicated marker expression in xrOvaries at ag49+56 with mouse embryonic ovarian somatic cells at E13.5. Scale bars, 10 μm.
Source data are available online for this figure.
Since the integrity/quality of xrOvary culture declined after ag49, we explored whether a passage of cyPGCLC‐derived cells in xrOvaries with mouse embryonic ovarian somatic cells at later developmental stages would promote further differentiation of cyPGCLC‐derived cells. We dissociated xrOvaries at ag49 into single cells, sorted AG+VT+ cells, and re‐aggregated them with mouse embryonic ovarian somatic cells at E13.5, E14.5, or E15.5 (2,500 ag49 AG+VT+ cells and 75,000 mouse embryonic ovarian somatic cells; Fig 2D). At 28 days after the passage (ag49+28), all xrOvaries appeared healthy and exhibited an integrated morphology, and FACS analysis revealed that the number of AG+VT+ cell‐derived cells was increased/maintained (~2,000–4,000 cells/xrOvary) and, notably, a majority of AG+VT+ cells differentiated into AG−VT+ cells (Fig 2E and F). At ag49+56, all xrOvaries remained apparently healthy, while the number of AG+VT+ cell‐derived cells declined (~1,000–2,000 cells/xrOvary), with most of them being in the AG−VT+ state and with an increase in VT highly positive (VTh+) cells (Fig 2E and F). We noted a tendency for AG+VT+ cells to differentiate into AG+VT− cells at faster kinetics in xrOvaries with E14.5 and E15.5 mouse embryonic ovarian somatic cells (Fig 2E and F). On the other hand, IF analysis at ag49+56 revealed that in all xrOvaries, most DDX4+ cells were negative for EGFP (AG) and POU5F1, and some were positive for “RA‐responsive” (ZGLP1/STRA8/SYCP3) or “meiotic” (γH2AX/DMC1/SYCP1) markers, with the acquisition of condensed, thread‐like chromatin (Fig 2G, Appendix Fig S5B; also see below). These findings indicate that AG+VT+ cells differentiate into AG−VT+ cells, and some of them enter the meiotic prophase in xrOvaries with mouse embryonic ovarian somatic cells at E13.5, E14.5, and E15.5.
To explore this point further, we analyzed the cell cycle state of the AG+VT+ and AG−VT+ cells at ag49+28 and ag49+56 (we used E14.5 and E15.5 mouse embryonic ovarian somatic cells for xrOvary formation). The distributions of DNA contents of these cells were similar to each other and to those of cyESCs and CEFs, with a majority being in the G1 phase (~78%) and a minority in the S/G2/M phases (~22%; Fig 3A−C), indicating that cells in the meiotic prophase with 4N are a minor population. Notably, however, the VTh+ cells at both ag49+28 and ag49+56 were enriched with 4N cells, with an increase in such cells at ag49+56 (Fig 3B and C). We then performed a spread analysis of the meiotic state of AG−VT+ cells at ag49+28 and ag49+56. At ag49+28, a great majority of SYCP3+ cells (~80%) expressed SYCP3 diffusely throughout their nuclei, did not show characteristic chromatin pairing, and were negative for RPA2, a key component of the RPA complex that binds to single‐stranded DNA (ssDNA) overhangs of DNA double‐strand breaks (DSBs) created upon meiotic recombination (Brown & Bishop, 2014; Hinch et al, 2020), and were considered to be in the pre‐leptotene stage (Fig 3D and E). On the other hand, the remaining SYCP3+ cells (~22%) exhibited numerous thread‐like SYCP3 localizations for chromatin pairings and a number of RPA2+ foci, indicating that they are in the leptotene stage (Fig 3D and E). At ag49+56, among SYCP3+ cells (36–67%/AG−VT+ cells), 42–67% were in the pre‐leptotene and 28–42% were in the leptotene stage, and remarkably, 5–13% showed typical SYCP3+ synaptonemal complex structures and many RPA2+ foci along the chromatin, which are characteristics of the zygotene stage (Fig 3D and E). Collectively, these results led us to conclude that in xrOvaries, cyPGCLCs differentiate robustly into oogonia and then enter the meiotic prophase, progressing at least up to the zygotene stage.
Figure 3. Progression of the meiotic prophase by cyPGCLC‐derived cells.
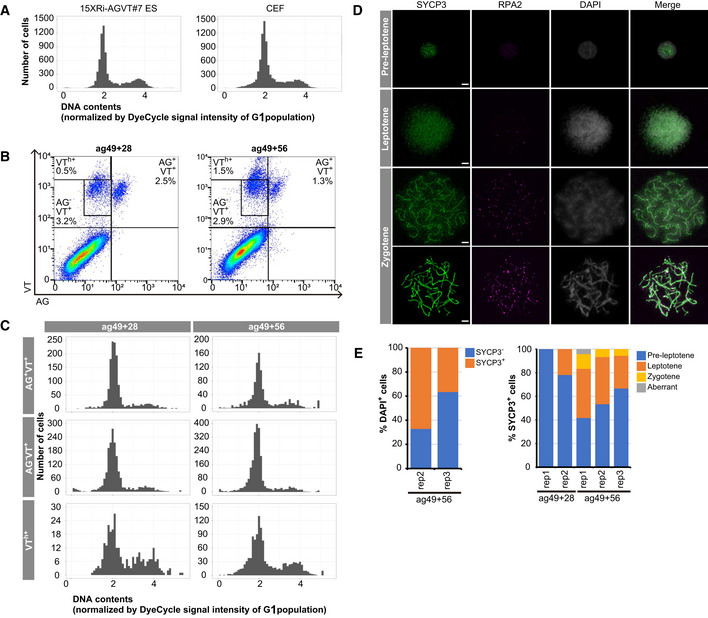
- Distributions of DNA contents in cyESCs (15XRi‐AGVT#7) and CEFs. DyeCycle signal intensity was normalized with that of the G1 cells (i.e., 2N cells).
- AGVT expression analyzed by FACS of cyPGCLC‐derived cells in xrOvaries at ag49+28 and +56. Percentages (/all live cells in xrOvaries) of the indicated cells are shown. Mouse embryonic somatic cells at E15.5 were used. VTh +: VT highly positive.
- Distributions of DNA contents in the indicated cells. Representative plots of three independent experiments are shown. Mouse embryonic somatic cells at E15.5 were used.
- Representative images of chromosome spreads of AG−VT+ cells at ag49+56 stained with SYCP3 (green) and RPA2 (magenta). The cells were classified as pre‐leptotene, leptotene, zygotene, or aberrant (as in E). Mouse embryonic somatic cells at E14.5 or E15.5 were used. Scale bar, 5 μm.
- (left) Percentages of SYCP3+ or SYCP3− cells/all AG−VT+ and DAPI+ cells at ag49+56. Mouse embryonic somatic cells at E14.5 (rep2) and E15.5 (rep3) were used. For quantification, 351 (rep2) and 131 (rep3) nuclei were analyzed. (right) Percentages of the indicated cells in xrOvaries at ag49+28 and ag49+56. Mouse embryonic somatic cells at E14.5 (rep1 and 2) and E15.5 (rep3) were used. For quantification, 12–54 SYCP3+ nuclei were analyzed for each biological replicate.
Source data are available online for this figure.
A transcriptome diversification upon oogonia‐to‐oocytes transition in vitro
Global transcriptome
To explore the transcriptome basis of the development from cyPGCLCs to oogonia to fetal oocyte‐like cells, we performed RNA sequence (RNA‐seq) analysis of the relevant cell types [cyESCs, d8 cyPGCLCs, ag7/21/35 AG+VT− cells, ag35/49/77 AG+VT+ cells, and ag49+52 AG−VT+ cells (with E13.5, E14.5, and E15.5 mouse embryonic ovarian somatic cells)], as well as cy germ cells at 8 weeks post‐fertilization (8 wpf), which consisted predominantly of oogonia (Mizuta et al, 2022), isolated from dissociated cy ovaries using PDPN and c‐KIT as surface markers. When the cells were sorted in this manner, germ cells accounted for ~60–80% of the sorted cells, with the remaining ~20–40% being ovarian somatic cells (Appendix Fig S6A and B). Thus, the data from this cell population are not only primarily representative of oogonia but also provide some information arising from minor somatic cell contamination; note that ovarian somatic cells are much smaller in volume and contain fewer transcripts than oogonia (Mizuta et al, 2022), and thus the impact of somatic cell contamination on the transcriptome would be minor.
Unsupervised hierarchical clustering (UHC) classified these cells into four major clusters that represent cyESCs, cyPGCLCs (d8, ag7/21/35 AG+VT−), oogonia (ag35/49/77 AG+VT+, germ cells at 8 wpf), and fetal oocyte‐like cells (ag49+52 AG−VT+), respectively (Appendix Fig S6C). Principal component analysis (PCA) delineated a pathway for their developmental progression and highlighted the acquisition of a distinct transcriptome in fetal oocyte‐like cells (ag49+52 AG−VT+; Fig 4A). We determined the 943 genes with significantly positive or negative scores of PC1 and PC2 loading [standard deviation (SD) > 2.5] (Fig 4A), which were classified roughly into five clusters that exhibited characteristic expression during the progression from cyPGCLCs to oogonia to fetal oocyte‐like cells (Fig 4B). In particular, ag49+52 AG−VT+ cells expressed the cluster 3 and 4 genes at a high level, which were enriched with genes for gene ontology (GO) terms such as “meiotic cell cycle,” “developmental process involved in reproduction,” and “meiotic nuclear division” (Fig 4B, Dataset EV2), in accord with the notion that they represent fetal oocyte‐like cells in preparation for or in the meiotic prophase.
Figure 4. Transcriptome dynamics during the development of cyESCs to fetal oocyte‐like cells.
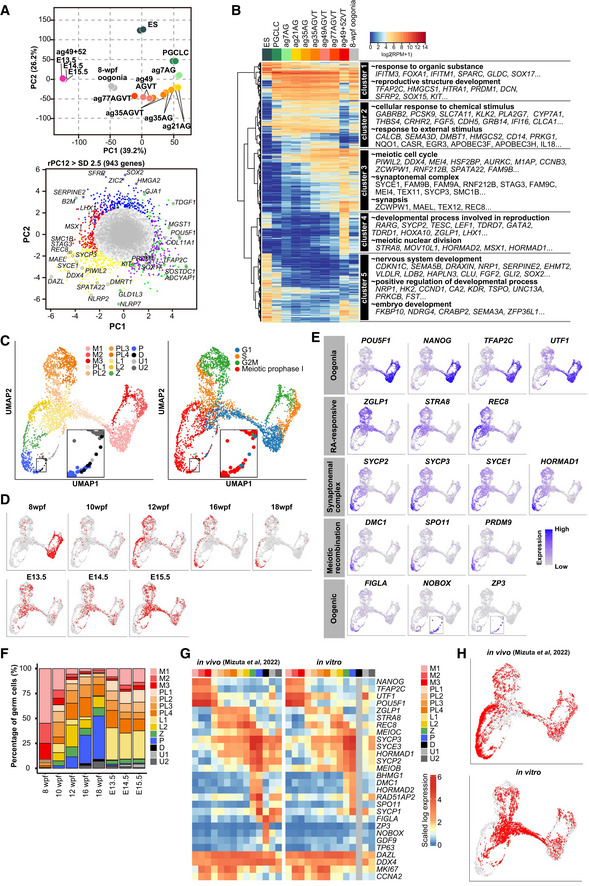
- (top) PCA of the transcriptomes of cyESC‐derived cells and cy oogonia [cell populations enriched with cy oogonia at 8 weeks post‐fertilization (wpf)]. (bottom) Scatter plot of the normalized loading scores of PCA. Genes bearing PC1/2 loading scores ± 2.5 SDs are colored according to the clusters in (B): green: cluster 1; purple: cluster 2; yellow: cluster 3; red: cluster 4; blue: cluster 5. Key genes are annotated on the plot. AG: AG+VT−; AGVT: AG+VT+; VT: AG−VT+.
- (left) UHC and heatmap of the expression of the 943 genes in (A, bottom). The average expression levels in two biological replicates except in the case of ag77 (one replicate) and ag49+52 (three replicates) are shown. The color coding is as indicated. (right) GO enrichments and representative genes in each cluster.
- UMAP plot and Louvain clustering of cy oogonia/fetal oocytes in vitro and in vivo (Mizuta et al, 2022; left) and their cell cycle stage prediction (right). M: mitotic; PL: pre‐leptotene; L: leptotene; Z: zygotene; P: pachytene; D: diplotene; U: unclassified. Diplotene cells are magnified in the inset. The color coding is as indicated.
- UMAP plot as in (C), with the annotation of in vivo and in vitro cells. wpf: weeks post‐fertilization for in vivo cells (Mizuta et al, 2022); E13.5/14.5/15.5: embryonic days of mouse embryonic ovarian somatic cells used for xrOvaries.
- UMAP plot as in (C), with the expression of genes representative of oogonia (POU5F1, NANOG, TFAP2C, UTF1), RA‐responsive cells (ZGLP1, STRA8, REC8), synaptonemal complex (SYCP2, SYCP3, SYCE1, HORMAD1), meiotic recombination (DMC1, SPO11, PRDM9), and oogenic cells (FIGLA, NOBOX, ZP3). Note that TFAP2C+ cells were essentially AG+VT+, while TFAP2C− cells were AG−VT+. The color coding is as indicated.
- Proportion of the 13 clusters in (C) in the indicated samples. For in vivo cells, the averages of two samples are shown for each stage except in the case of 10, 12 and 18 wpf (one replicate). The color coding is as indicated.
- Heatmaps of the expression of key genes associated with cy fetal oocyte development in the 13 clusters in (C). Separate heatmaps are shown for in vivo (left; Mizuta et al, 2022) and in vitro (right) cells. The color coding is as indicated.
Single‐cell transcriptome: Cell‐type classification and developmental progression
To examine the progression of fetal oocyte‐like cell development at a single‐cell resolution, we performed single‐cell RNA‐seq (scRNA‐seq) analysis of ag49+52 xrOvaries with E13.5, E14.5, and E15.5 mouse embryonic ovarian somatic cells using a 10X Chromium platform, and analyzed the data in comparison to those of cy fetal oocyte development from 8 to 18 wpf (Mizuta et al, 2022). We processed a total of 18,769 cells in vitro (7,827 AG+VT+/AG−VT+ cells and 10,942 mouse embryonic ovarian somatic cells), and with sequencing, 1,986 AG+VT+/AG−VT+ cells passed key quality filters (Appendix Fig S6D, Dataset EV1F; Wolock et al, 2019) and were subject to an integrated analysis with cy fetal oogonia/oocytes in vivo (Mizuta et al, 2022).
Uniform manifold approximation and projection (UMAP) for dimensionality reduction and Louvain clustering classified the relevant in vitro and in vivo cells into 13 clusters (Fig 4C−E). Based on the expression of key markers, we annotated them as mitotic 1/2/3, pre‐leptotene 1/2/3/4, leptotene 1/2, zygotene, pachytene, diplotene [some pachytene cells were manually classified as diplotene, as reported previously (Mizuta et al, 2022)], and unclassified (Fig 4C−E). The cell‐type compositions of ag49+52 xrOvaries with E13.5, E14.5, and E15.5 mouse embryonic ovarian somatic cells were very similar to each other and similar to those of cy fetal ovaries at ~12 wpf, but with enrichment of pre‐leptotene 1 and leptotene 1 cells (Fig 4D and F).
Mitotic 1/2/3 cells expressed oogonia markers (POU5F1, NANOG, TFAP2C, UTF1) and consisted mainly of in vitro AG+VT+ cells and in vivo cells at 8 wpf, but included in vivo cells from all developmental stages (Fig 4E and F), and were predicted to be primarily in the G1, S, and G2/M phases of the cell cycle, respectively (Tirosh et al, 2016; Fig 4C). There were no overt differences in the expression of key markers between in vitro and in vivo mitotic cells (Fig 4G). Pre‐leptotene 1 cells began to repress oogonia markers and to up‐regulate “RA‐responsive” markers (ZGLP1, STRA8, REC8), and were in the G1 phase (Fig 4C, E, and G). Pre‐leptotene 2/3/4 cells more fully repressed oogonia markers, expressed “RA‐responsive” markers, and initiated up‐regulation of genes for the synaptonemal complex, such as SYCP2/3, SYCE1, and HORMAD1, with pre‐leptotene 2 cells mainly in the S phase and pre‐leptotene 3/4 cells mainly in the G2 phase (Fig 4C, E, and G). Pre‐leptotene cells consisted of in vitro AG−VT+ cells and in vivo cells from all developmental stages, with the pre‐leptotene 1 cells being enriched with in vitro cells (Fig 4D and F). Compared to the in vivo cells, the in vitro pre‐leptotene cells were variable in oogonia marker repression and “RA‐responsive”/synaptonemal complex gene expression (Fig 4G). Leptotene 1/2 cells repressed oogonia markers, expressed “RA‐responsive” markers, and up‐regulated synaptonemal complex genes, but were negative/weak for key genes for meiotic recombination, such as DMC1, SPO11, and PRDM9, with leptotene 2 cells expressing “RA‐responsive”/synaptonemal complex genes at a higher level (Fig 4E and G). Leptotene 1 cells consisted nearly exclusively of in vitro cells, whereas the vast majority of leptotene 2 cells were in vivo cells (Fig 4D and F). Accordingly, on the UMAP plots, the developmental trajectories of in vitro and in vivo cells diverged upon pre‐leptotene‐to‐leptotene transition (Fig 4H). Zygotene/pachytene cells up‐regulated key genes for meiotic recombination, with pachytene cells expressing such genes at a higher level; zygotene/pachytene cells consisted predominantly of in vivo cells after 10 wpf (Fig 4D−G). Nonetheless, in accord with the cytologic analysis (Fig 3D and E), ~4% of in vitro cells were classified as zygotene, and notably, a small number of them (25 cells) were classified as pachytene (Fig 4F). On the UMAP plots, in vitro zygotene/pachytene cells were continuous from in vitro leptotene cells, that is, leptotene 1 cells, whereas in vivo zygotene/pachytene cells were continuous from in vivo leptotene cells, that is, leptotene 2 cells (Fig 4C, D, and H). Accordingly, in vitro zygotene/pachytene cells expressed genes for synaptonemal complex/meiotic recombination at lower/more variable levels than in vivo zygotene/pachytene cells (Fig 4G). Diplotene cells maintained genes for the synaptonemal complex, repressed those for meiotic recombination, and began to express “oogenic” genes (FIGLA, NOBOX, ZP3); diplotene cells consisted of in vivo cells at 16 and 18 wpf (Fig 4E−G).
On the UMAP plots, unclassified cells were divided into two clusters, U1 and U2: the U1 cells (nUMI: ~50,000; nGenes: ~8,750) consisted predominantly of in vitro cells, were predicted to be mainly in the G1 phase, and exhibited relatively high correlation with pre‐leptotene/leptotene cells (Fig 4C, D, and F, Appendix Fig S6D and E; see below). We noted that the U1 cells expressed some genes characterizing “oogenic” cells (SOHLH1, ZAR1, NPM2) and, somewhat unexpectedly, genes involved in male germ‐cell development such as NANOS2, PIWIL4, and EGR4 (Li et al, 2017; Hwang et al, 2020; Guo et al, 2021; Appendix Fig S6F). Thus, U1 cells were aberrantly differentiated cells in the xrOvary environment. On the other hand, the U2 cells consisted of both in vitro and in vivo cells and most likely represented low‐quality/aberrant pachytene cells, as they showed fewer nUMI (~10,000)/nGenes (~2,500) and relatively high correlation with pachytene cells, and were predicted to be in the meiotic prophase (Fig 4C, D, and F, Appendix Fig S6D and E; see below).
In vitro versus in vivo cell types
To gain further insight into the properties of fetal oocyte‐like cells in vitro, we examined the expression of highly variable genes (HVGs: 1,481 genes) that define the progression of cy fetal oocyte development and consist of eight clusters (Mizuta et al, 2022; Fig 5A). The in vitro and in vivo cells exhibited high concordance for HVG expression until the pre‐leptotene 1 stage (Fig 5A and B), but began to manifest a discernable difference from the pre‐leptotene 2 stage onward, with lower/variable expression of genes up‐regulated in the pre‐leptotene/leptotene cells (cluster 3/4 genes), which were enriched in genes for “regulation of transcription, DNA‐templated,” “pattern specification process,” and “meiotic cell cycle” (Fig 5A and B, Dataset EV3; Mizuta et al, 2022). Nonetheless, in vitro pachytene cells up‐regulated pachytene genes at a high level, which were enriched with those for “synapsis,” “double‐strand break repair,” and “reciprocal DNA recombination” (cluster 5/6 genes), although their expression profiles were somewhat discordant from those of in vivo cells (Fig 5A and B, Dataset EV3; Mizuta et al, 2022).
Figure 5. Comparison of cy oogonia/fetal oocytes in vivo and in vitro .
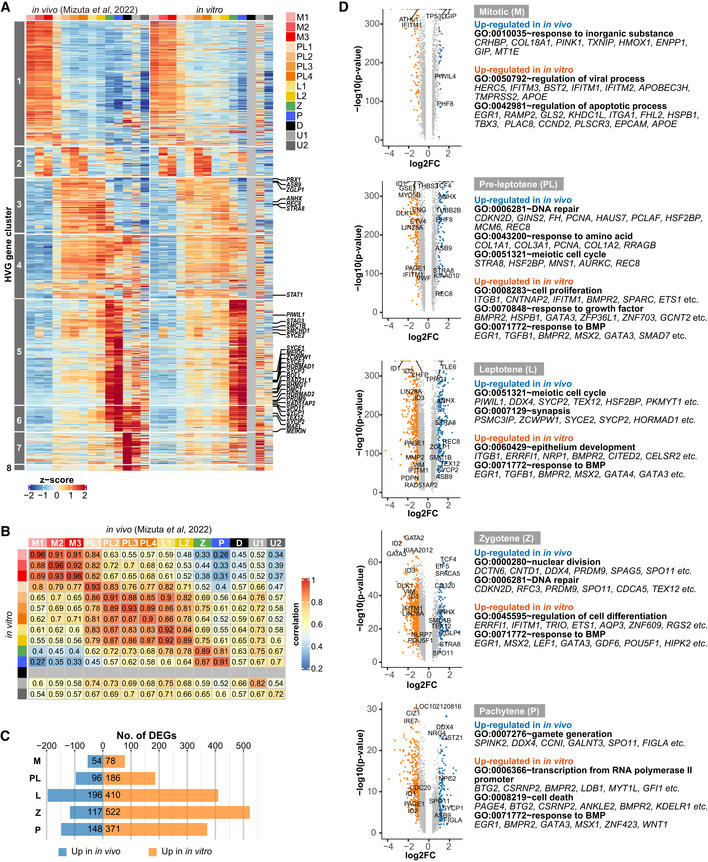
- Heatmaps of the expression of highly variable genes [HVGs (1,481 genes)] associated with cy fetal oocyte development (Mizuta et al, 2022) in cy oogonia/fetal oocytes in vivo (left) and in vitro (right). The HVG cluster numbers (left) and representative genes of clusters 3/4/5/6 (right) are shown. The color coding is as indicated.
- Correlation heatmap of the in vivo and in vitro cell clusters based on the expression of HVGs in (A). Diplotene cells were not found in vitro.
- Numbers of differentially expressed genes [DEGs: log2 (fold change) > 1] between the five comparison groups. M: M1–3; PL: PL1–4; L: L1–2.
- Volcano plots for DEGs in the five comparison groups. Blue: up‐regulated in vivo; orange: up‐regulated in vitro. GO enrichments and representative genes are shown.
We determined the differentially expressed genes (DEGs) between in vitro and in vivo cells representing the same developmental stages (Appendix Fig S6G). In accord with the correlation analysis of HVGs, in vitro and in vivo mitotic cells were very similar, showing a small number of DEGs (Fig 5B and C). From the pre‐leptotene stage onward, the number of DEGs increased, with larger numbers of genes up‐regulated in in vitro cells (Fig 5C). From the pre‐leptotene to pachytene stage, genes up‐regulated in in vitro cells were enriched with those involved in developmental processes such as “response to growth factors,” “epithelium development,” “regulation of cell differentiation,” and “transcription from RNA polymerase II promoter,” and included GATA2/3/4, MSX1/2, TBX1/3/5, HAND1/2, NKX2‐5, TFAP2A, ID1/2/3/4, HES1, SMAD7, BAMBI, SPRY4, SHISA2, and DUSP6, among many other relevant genes (Fig 5D, Dataset EV4). On the other hand, genes higher in in vivo cells were enriched with those involved in meiosis such as “DNA repair,” “meiotic cell cycle,” “synapsis,” and “nuclear division,” and included STRA8, REC8, SYCE2, SYCP2, SMC1B, HORMAD1, PRDM9, and SPO11 (Fig 5D, Dataset EV4). Taking these results together, we concluded that cyPGCLCs‐to‐oogonia development in xrOvaries is a robust process that faithfully recapitulates the corresponding in vivo development, and that upon oogonia‐to‐oocytes transition, the in vitro pathway diverges from the in vivo pathway, with mis‐regulation of genes for developmental processes and suboptimal up‐regulation of genes for meiosis, progressing up to the zygotene/pachytene stage and arresting further development of the oocytes.
A comprehensive epigenetic reprogramming during the progression from cyPGCLCs to oogonia to fetal oocyte‐like cells
To explore whether epigenetic reprogramming accompanies the progression of cyPGCLCs to oogonia to fetal oocyte‐like cells, we performed enzymatic methyl sequencing (EM‐seq) analysis (Vaisvila et al, 2021) for genome‐wide DNA methylation (5‐methylcytosine: 5mC) profiles of the relevant in vitro cell types [cyESCs, d8 cyPGCLCs, ag7/21/35 AG+VT− cells, ag35/49 AG+VT+ cells, ag49+52 AG−VT+ cells (with E15.5 mouse embryonic ovarian somatic cells), and CEFs], as well as the cell populations enriched with cy oogonia at 8 wpf (oogonia). We also performed whole‐genome sequencing (WGS) of the paternal individual whose spermatozoa were used for the derivation of 15XRi cyESCs and CEFs (Okamoto et al, 2021), and defined single nucleotide polymorphisms (SNPs) that discriminate methylation and expression on two parental alleles of the 15XRi‐derived cells and CEFs (Dataset EV10).
DNA methylation reprogramming on autosomes
cyESCs bore autosome‐wide 5mC levels of ~80%, and these levels showed a progressive and remarkable decrease during the progression from cyPGCLCs to oogonia to fetal oocyte‐like cells, reaching as low as ~6% in ag49+52 AG−VT+ cells (Fig 6A–C, Appendix Fig S7A, Dataset EV12). The autosome‐wide 5mC levels of the cell populations enriched with cy oogonia at 8 wpf were ~20% (Fig 6A, Dataset EV12), in accord with the idea that cyPGCs/oogonia in vivo undergo autosome‐wide DNA demethylation to an extent similar to that in ag35/49 AG+VT+ cells (~5%), while contamination of ovarian somatic cells (~20–40%) elevated the overall DNA methylation levels. DNA demethylation occurred on promoters, exons, introns, intergenic regions, and non‐promoter CpG islands (CGI) in a similar manner on paternal and maternal chromosomes (Fig 6A). Regarding differentially methylated regions (DMRs) of the imprinted genes, unlike CEFs, cyESCs exhibited aberrant methylation on some paternal (MEG3, ZDBF2) and maternal (BLCAP, FAM50B, DIRAS3, RB1, PEG3, NDN, MKRN3) DMRs (Fig 6D, Dataset EV11). Nonetheless, nearly all imprints, including those of aberrantly methylated DMRs (except the aberrantly methylated DMRs of MKRN3 and PEG10) were erased in ag35/49 AG+VT+/ag49+52 AG−VT+ cells (Fig 6D, Dataset EV11).
Figure 6. DNA methylation reprogramming on autosomes during the development of cyESCs to fetal oocyte‐like cells.
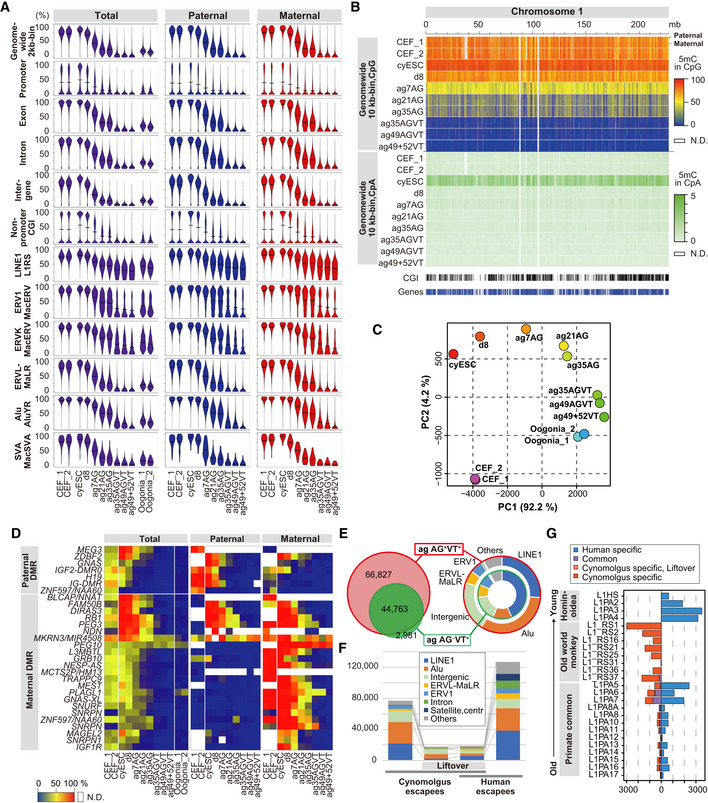
- Violin plots of the average 5mC (5‐methylcytosine) levels on the indicated genomic loci on the autosome for the indicated cell types. Data for the paternal and maternal alleles were generated using the reads overlapping with allelic SNPs. AG: AG+VT−; AGVT: AG+VT+; VT: AG−VT+.
- Heatmap of the 5mC [CpG (top) or CpA (bottom)] levels on chromosome 1 in the indicated samples. Data were generated using the reads overlapping with allelic SNPs. mb, megabases. The color coding is as indicated. N.D.: bins without enough CpGs (4) with read depth ≥ 4 in CpG or bins without enough mC + C calls (≥ 10) in CpA.
- PCA of indicated samples using the 5mC levels in the genome‐wide 2‐kb bins. Oogonia: cell populations enriched with cy oogonia at 8 wpf.
- Heatmap of the 5mC levels of the differentially methylated regions (DMRs) of the imprinted genes. Data for the paternal and maternal alleles were generated using the reads overlapping with allelic SNPs. The color coding is as indicated. N.D.: bins without enough CpGs (4) with read depth ≥ 4.
- (left) The relationship of the DNA demethylation escapees in ag35/49 AGVT cells (112,350 loci) and ag49+52 VT cells (49,495 loci). (right) Composition of the escapees in ag35/49 AGVT (outer) and ag49+52 VT cells (inner).
- Comparison and composition of the DNA demethylation escapees in cy and human germ cells. The data for human germ cells are from Tang et al (2015). The color coding is as indicated.
- Comparison and composition of the DNA demethylation escapees on LINE1 in cy and human germ cells.
We defined the “escapees” that showed resistance to autosome‐wide DNA demethylation in ag35/49 AG+VT+/ag49+52 AG−VT+ cells, which consisted predominantly of retrotransposons, including long interspersed nuclear elements 1 (LINE1), Alu sequences, endogenous retrovirus (ERV) 1, ERVK, and ERVL‐MaLR (Fig 6E, Dataset EV15). We compared cy and human escapees (Tang et al, 2015): Around half of cy escapees were lifted over to the human genome, and around half of these lifted‐over escapees were cy specific, with the remaining half being held in common by cynomolgus monkeys and humans (Fig 6F, Dataset EV15), indicating that a majority of the escapees consisted of species‐specific retrotransposons. Accordingly, for LINE1, a majority of the escapees belonged to either macaque‐specific (L1‐RS) or human‐specific (L1HS, L1PA2/3/4) classes of evolutionarily young age, while, for Alu, although the trend was similar, many also belonged to the primate‐common class with cy‐ or human‐specific sequences (Fig 6G, Appendix Fig S7B).
DNA methylation reprogramming on X chromosomes
The 15XRi‐AGVT #7 cyESCs expressed XIST and X‐linked genes from the maternal and paternal allele, respectively (Appendix Fig S7C and D), and at levels similar to those of their parental line and the other female cyESCs (Appendix Fig S1E), indicating that the 15XRi‐AGVT #7 cyESCs bear paternal Xa (Xp‐a) and maternal Xi (Xm‐i). In contrast, CEFs expressed the X‐linked genes from both the paternal and maternal alleles at a ratio of 1:1 (Appendix Fig S7C and D), indicating that they are a polyclonal population for parental X‐chromosome inactivation.
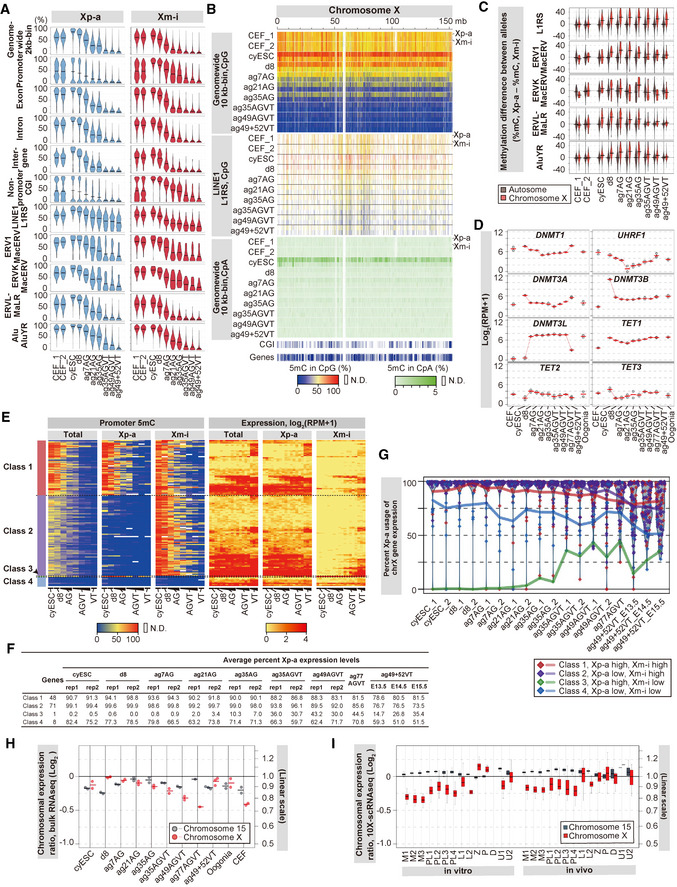
In cyESCs, Xp‐a exhibited a higher chromosome‐wide 5mC level (~85%) than Xm‐i (~70%); Xp‐a showed higher 5mC levels on exons, introns, and intergenic regions (Fig 7A, Dataset EV12). On the other hand, while Xp‐a showed a bimodal methylation profile on promoters/non‐promoter CGIs, Xm‐i exhibited globally methylated promoters/non‐promoter CGIs (Fig 7A). These findings are consistent with a previous report that Xa bears a higher chromosome‐wide 5mC level than Xi in part due to gene body‐specific methylation on Xa (Hellman & Chess, 2007). During the progression from cyPGCLCs to oogonia to fetal oocyte‐like cells, both Xp‐a and Xm‐i showed progressive, chromosome‐wide DNA demethylation, and like autosomes, acquired a highly demethylated state in ag49+52 AG−VT+ cells (Xp‐a: ~7.7%; Xm‐i: ~3.9%; Fig 7A and B, Dataset EV12). We noted that while Xp‐a showed chromosome‐wide demethylation highly similar to autosomes, Xm‐i exhibited unique profiles: Xm‐i showed resistance to demethylation on some promoters/non‐promoter CGIs, which retained > ~50% of 5mCs in ag35/49 AG+VT+/ag49+52 AG−VT+ cells (Figs 6A and 7A). In contrast, Xm‐i demethylated the escapees, particularly LINE1, more efficiently than Xp‐a (Fig 7A and B), and Xp‐a showed ~16% higher 5mC levels on average over 386 LINE1 loci than Xm‐i in ag35/49 AG+VT+/ag49+52 AG−VT+ cells (Fig 7C).
Figure 7. DNA methylation reprogramming on the X chromosomes during the development of cyESCs to fetal oocyte‐like cells.
-
AViolin plots of the average 5mC (5‐methylcytosine) levels on the indicated genomic loci on the X chromosomes for the indicated cell types. Data for the active paternal (Xp‐a) and inactive maternal (Xm‐i) X‐chromosome alleles were generated using the reads overlapping with allelic SNPs. CEF: cy embryonic fibroblasts; AG: AG+VT−; AGVT: AG+VT+; VT: AG−VT+.
-
BHeatmap of the 5mC [CpG (top: genome‐wide 10‐kb bins; middle: LINE1) or CpA (bottom)] levels on the X chromosome in the indicated samples. Data were generated using the reads overlapping with allelic SNPs. mb, megabases. The color coding is as indicated. N.D.: bins without enough mC + C calls (≥ 10) or annotation (L1RS) with mC + C calls ≥ 10.
-
CViolin plots (bar: average) of the differences in the 5mC levels between paternal and maternal alleles on the indicated retrotransposons on the autosomes (black) and the X chromosomes (red) in the indicated samples.
-
DExpression dynamics of genes for DNA methylation/demethylation during the development of cyESCs to fetal oocyte‐like cells. Oogonia: cell populations enriched with cy oogonia at 8 wpf.
-
EHeatmap of the promoter 5mC (left) and expression (right) level dynamics of the genes on the X chromosome during the development of cyESCs to fetal oocyte‐like cells. The Xp‐a and Xm‐i allelic data were generated using the reads overlapping allelic SNPs. The genes were classified according to their promoter 5mC levels on the Xp‐a and Xm‐i alleles in cyESCs: class 1 genes with high (≥ 50%) 5mC on both Xp‐a and Xm‐i (48 genes), class 2 genes with low (< 50%) 5mC on Xp‐a and high 5mC on Xm‐i (71 genes), a class 3 gene with high 5mC on Xp‐a and low 5mC on Xm‐i (XIST), and class 4 genes with low 5mC on both Xp‐a and Xm‐i (8 genes; Dataset EV13). (left) AG: ag7/21/35 AG; AGVT: ag35/49 AGVT; and VT: ag49+52 VT. (right) AG: ag7/21/35 AG_1 and _2; AGVT: ag35/49 AGVT_1 and _2/ag77 AGVT; and VT: ag49+52 VT_E13.5, _E14.5, and _E15.5. The progression of culture dates and the embryonic days of mouse embryonic ovarian somatic cells are indicated by progressively broadening underlines. The color coding is as indicated. N.D., promoters with insufficient read depths.
-
FAverage X‐pa usage ratio of X‐linked genes during the development of cyESCs to fetal oocyte‐like cells. The percent Xp‐a expression levels were calculated as . Average X‐pa‐derived SNP usage was calculated for the genes (the gene numbers are shown in the “Genes” column) selected in (E) and plotted in (G).
-
GExpression dynamics from the Xp‐a and Xm‐i alleles during the development of cyESCs to fetal oocyte‐like cells. Proportions of the expression from the Xp‐a allele in the four gene classes in (E) are plotted, with individual values plotted as diamonds and their averages shown as colored lines. The distributions of the Xp‐a ratio of all genes are shown as violin plots. Data points at 100% are dispersed within the range of 5% for better visualization. Raw data are available in Dataset EV13.
-
H, IDynamics of the X chromosome:autosome ratio (X:A ratio) of gene‐expression levels during the development of cyESCs to fetal oocyte‐like cells based on the bulk RNA‐seq (H) or 10X Chromium single‐cell data (I). The ratios of the 75%‐tile expression values of the genes from chromosome X or chromosome 15, relative to those of all genes are plotted in the log2 scale in (H) and as boxplots in the log2 scale in (I). In the boxplots, the central bands represent the median values; the lower/upper hinges represent the 25th/75th percentiles, respectively; the upper limits of the whiskers represent the largest values no further than 1.5 IQR (interquartile range) from the upper hinges; the lower limits of the whiskers represent the smallest values no further than 1.5 IQR from the lower hinges.
Mechanism for DNA methylation reprogramming
To gain insight into the mechanism for DNA methylation reprogramming, we examined the expression of genes associated with DNA methylation/demethylation. Upon cyPGCLC specification, the de novo DNA methyltransferases DNMT3A and especially DNMT3B were acutely down‐regulated, and their expression remained essentially low during the progression from cyPGCLCs to oogonia to fetal oocyte‐like cells (Fig 7D). It was somewhat unexpected that DNMT3L, a co‐factor for DNMT3A/B, was up‐regulated in cyPGCLCs and oogonia‐like cells (Fig 7D). The maintenance DNA methyltransferase DNMT1 was also down‐regulated, but its essential co‐factor UHRF1 was more dramatically repressed in oogonia‐like cells (Fig 7D). TET1/2/3, which oxidizes 5mC to generate 5‐hydroxymethylcytosine (5hmC) or further oxidized species that can in turn be either passively or enzymatically removed from DNA (Tahiliani et al, 2009; Wu & Zhang, 2014), showed relatively constant expression in the relevant cell types (Fig 7D). Accordingly, the CpA methylation, an index for de novo DNMT activity (Ramsahoye et al, 2000; Liao et al, 2015), was detected at a high level in cyESCs (for X chromosomes, predominantly on Xp‐a), but was very low/absent in cyPGCLC‐derived cells (Figs 6B and 7B, Appendix Fig S7E). These findings suggest that genome‐wide DNA demethylation involves, at least in part, a replication‐coupled, passive mechanism, either directly from 5mC or from 5hmC generated by the TET proteins, in cyPGCLC‐derived cells. Taking these results together, we conclude that the progression from cyPGCLCs to oogonia to fetal oocyte‐like cells entails nearly complete DNA methylation reprogramming, creating an epigenetic framework for oocyte development. This exhaustive reprogramming notwithstanding, unlike parental autosomes, Xa and Xi remain epigenetically asymmetric on some promoters/non‐promoter CGIs and LINE1 elements in oogonia/fetal oocyte‐like cells.
X‐chromosome reactivation and X‐chromosome dosage compensation
It has been shown that during female cyPGCs‐to‐oogonia development, cyPGCs/oogonia reactivate Xi (X‐chromosome reactivation: XCR) and erase hyperactivation of Xa (X‐chromosome up‐regulation: XCU), most likely through epigenetic reprogramming, and subsequently, fetal oocyte development proceeds with two Xa with little, if any, XCU, which represents an X‐chromosome dosage compensation unique to fetal oocytes (Okamoto et al, 2021; Mizuta et al, 2022). Accordingly, we next explored whether X‐chromosome DNA methylation reprogramming in cyPGCLC‐derived cells leads to XCR and an X‐chromosome dosage compensation state unique to fetal oocytes. The 128 X‐linked genes bore informative SNPs and EM‐seq reads and showed appropriate expression levels (Fig 7E, Dataset EV13), and we classified them into four classes based on their promoter 5mC levels in cyESCs: class 1 genes with high 5mC on both Xp‐a and Xm‐i (48 genes), class 2 genes with low 5mC on Xp‐a and high 5mC on Xm‐i (71 genes), a class 3 gene with high 5mC on Xp‐a and low 5mC on Xm‐i (XIST), and class 4 genes with low 5mC on both Xp‐a and Xm‐i (8 genes; Dataset EV13). In cyESCs, the vast majority of class 1/2 genes were expressed exclusively from Xp‐a, while XIST (class 3) was expressed exclusively from Xm‐i and class 4 genes were more biallelic, with ~75% on average being expressed from Xp‐a (Fig 7E−G, Dataset EV13). During the progression from cyPGCLCs to oogonia to fetal oocyte‐like cells, class 1/2 genes on Xm‐i were substantially reactivated, with, on average, ~30% of class 1/2 genes deriving from Xm in ag35/49 AG+VT+/ag49+52 AG−VT+ cells, and, remarkably, XIST (class 3) on Xm‐i was fully reactivated and class 4 genes became fully biallelic (Fig 7E−G, Appendix Fig S7D).
We then examined the X‐chromosome dosage compensation state in cyPGCLC‐derived cells by measuring their X chromosome:autosome ratio (X:A ratio) of gene expression levels. The bulk RNA‐seq data revealed that the X:A ratio increased to ~1.0 during the differentiation of cyESCs to cyPGCLCs, gradually decreased to ~0.8 during oogonia‐like cell differentiation, and then was elevated to ~1.0 in cy fetal oocyte‐like cells (Fig 7H, Dataset EV5). Consistent with these findings, the 10× scRNA‐seq datasets showed that the X:A ratio was ~0.8 in mitotic/pre‐meiotic (pre‐leptotene) cells and increased to ~1.0 in early meiotic (leptotene/zygotene) cells (Fig 7I, Datasets EV6 and EV7). The X:A ratio dynamics in vitro were in accordance with those observed during in vivo development (Fig 7I; Mizuta et al, 2022). Taken together, these findings indicate that XCR progresses substantially, although it is not completed, and X‐chromosome dosage compensation proceeds in a broadly normal manner during the progression from cyPGCLCs to oogonia to fetal oocyte‐like cells.
Xi epigenetic property in PSCs can be a determinant of Xi reprogramming in humans and monkeys
It has been reported that human PGCLCs (hPGCLCs) induced from a human iPSC (hiPSC) line (1390G3‐AGVT#526) differentiate into oogonia and then into “RA‐responsive” cell‐like cells (most likely, pre‐leptotene‐stage cells) in xrOvaries (Yamashiro et al, 2018), but their X‐chromosome reprogramming remains to be elucidated. In contrast to the 15XRi AGVT cyESC line bearing Xi with abundant H3K27me3 and little H3K9me3 (Fig 1), the 1390G3 AGVT hiPSC line showed Xi with little H3K27me3 and abundant H3K9me3 (Yokobayashi et al, 2021), and this difference should be informative when comparing the dynamics and extents of X‐chromosome reprogramming and reactivation between oogonia/fetal oocyte‐like cells induced from these two lines. To explore this point, we performed a long‐read sequencing of 1390G3 AGVT #526 using Oxford Nanopore Technology (ONT; Jain et al, 2018; Miga et al, 2020) and reconstructed the X‐chromosome allelic sequences based on DNA methylation profiles of the phasing blocks co‐determined by ONT, given that Xa bears a higher 5mC level than Xi (Fig 8A). The 5mC distributions determined by ONT across phased Xa and Xi were consistent with those determined by EM‐seq and by whole‐genome bisulfite sequencing (WGBS; Fig 8A; Yamashiro et al, 2018), corroborating the correct phasing of Xa and Xi.
Figure 8. DNA methylation reprogramming on the X chromosomes during human oogonia/RA‐responsive cell‐like cell development.
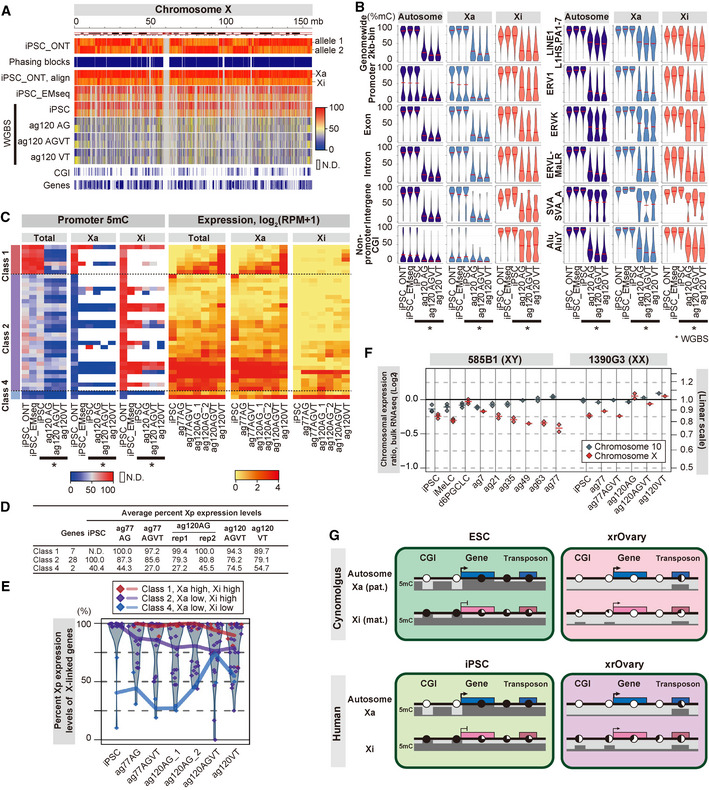
- Heatmap of the 5mC levels on the X chromosome (chromosome‐wide 10 kb bins) in the indicated samples (*) during human oogonia/RA‐responsive cell‐like cell development from a hiPSC line (1390G3 AGVT #526) reported in Yamashiro et al (2018). Data were generated using the reads overlapping with allelic SNPs. The X‐chromosome allelic sequences were phased based on the 5mC levels of the promoters, non‐promoter CGIs, and genome‐wide 10 kb bins. iPSC_ONT: 5mC levels of the phasing blocks; iPSC_ONT, align: 5mC levels of the phased X chromosome assigned as Xa and Xi; and iPSC_EMseq: 5mC levels of the hiPSCs determined by EM‐seq. mb, megabases. The color coding is as indicated. AG: AG+VT−; AGVT: AG+VT+; VT: AG−VT+.
- Violin plots of the average 5mC levels on the indicated genomic loci on the autosomes and the X chromosomes for the indicated cell types. Data for Xa and Xi were generated using the reads overlapping with allelic SNPs. iPSC_ONT: the methylome data of 1390G3‐AGVT#526 iPSCs analyzed by ONT whole‐genome sequencing; iPSC_EMseq: the methylome data of 1390G3‐AGVT#526 iPSCs analyzed by EM‐seq.
- Heatmap of the promoter 5mC (left) and expression (right) level dynamics of the genes on the X chromosome during the development of hiPSCs to human oogonia/RA‐responsive cell‐like cells. The Xa and Xi allelic data were generated using the reads overlapping allelic SNPs. The genes were classified according to their promoter 5mC levels on the Xa and Xi alleles in hiPSCs: class 1 genes with high (≥ 50%) 5mC on both Xp‐a and Xm‐i (7 genes), class 2 genes with low (< 50%) 5mC on Xp‐a and high 5mC on Xm‐i (28 genes), and class 4 genes with low 5mC on both Xp‐a and Xm‐i (3 genes; Dataset EV14). The color coding is as indicated. N.D.: bins without enough mC + C calls (≥ 10).
- Average Xa usage ratio of X‐linked genes during the development of hiPSCs to human oogonia/RA‐responsive cell‐like cells. The percent Xa expression levels were calculated as . Average Xa‐derived SNP usage was calculated for the genes (the gene numbers are shown in the “Genes” column) selected in (C) and plotted in (E). Note that the X reactivation rates of all informative genes were not significantly different between cy fetal oocyte‐like cells (ag49+52 VT cells with E13.5/14.5/15.5 mouse embryonic ovarian somatic cells) and human RA‐responsive cell‐like cells (ag120 VT cells; P > 0.22).
- Expression dynamics from the Xa and Xi alleles during the development of hiPSCs to human oogonia/RA‐responsive cell‐like cells. Proportions of the expression from the Xa allele in the three gene classes in (C) are plotted, with the individual values plotted as diamonds and their averages shown as colored lines. The distributions of the Xa ratio of all genes are shown as violin plots. Data points at 100% are dispersed within the range of 5% for better visualization. Raw data are available in Dataset EV14.
- X:A ratio of gene expression levels during human oogonia/RA‐responsive cell‐like cell development from hiPSCs based on the bulk RNA‐seq data (Yamashiro et al, 2018). The ratios of the 75%‐tile expression values of the genes from chromosome X or chromosome 10, relative to those of all genes are plotted in the log2 scale.
- A model for DNA methylation reprogramming in cy/hPGCLC‐derived cells in xrOvaries. 5mC levels on the representative genomic loci [CpG islands (CGIs), high CpG promoters, gene bodies, intergenic regions, and transposons] are show in dark (high 5mC) and pale (low 5mC) gray and by pie charts (black: methylated; white: unmethylated). Autosomes and Xa in PSCs show an essentially identical reprogramming profile, while Xi in PSCs exhibits a unique reprogramming profile that is dependent on the Xi epigenetic state in PSCs.
In hiPSCs, Xa (chromosome‐wide 5mC level: ~85%) exhibited a higher 5mC level than Xi (~70%) in exons, introns, and intergenic regions, and bimodal methylation on promoters/non‐promoter CGIs, while Xi exhibited globally methylated promoters/non‐promoter CGIs (Fig 8B, Dataset EV16). During the progression from hPGCLCs to oogonia to RA‐responsive cell‐like cells, Xa showed DNA methylation reprogramming similar to autosomes, whereas Xi exhibited demethylation resistance; irrespective of genomic elements, Xi showed ~40% 5mC levels in oogonia/RA‐responsive cell‐like cells (ag120 AGVT/VT cells; Fig 8B, Dataset EV16), and the demethylation resistance on Xi was similar to that on demethylation escapees consisting of retrotransposons on autosomes (Fig 8B), resulting in substantial epigenetic asymmetry on parental X chromosomes in oogonia/RA‐responsive cell‐like cells. Given the contrasting Xi epigenetic properties between 15XRi AGVT cyESCs and 1390G3 AGVT hiPSCs, that is, high H3K27me3 versus high H3K9me3 (Fig 1; Yokobayashi et al, 2021), these findings suggest the possibility that the Xi epigenetic properties in PSCs are a determinant of Xi reprogramming during in vitro oogenesis.
Despite the resistance of Xi to demethylation, Xi reactivation occurred to a good extent; on average, ~20% of informative genes were expressed from Xi in oogonia/RA‐responsive cell‐like cells (Fig 8C−E, Dataset EV14), and their X:A ratio of gene expression levels was ~1.0, a value expected for human fetal oocyte‐like cells (Chitiashvili et al, 2020; Mizuta et al, 2022; Fig 8F, Dataset EV17). Collectively, these findings led us to propose that in both humans and cynomolgus monkeys, PSC‐derived oogonia/fetal oocyte‐like cells remain epigenetically asymmetric on parental X chromosomes and incompletely, albeit substantially, reactivate Xi, with the reactivation extent depending on the epigenetic properties of Xi in PSCs (Fig 8G). Nevertheless, PSC‐derived oogonia/fetal oocyte‐like cells undergo broadly normal X‐chromosome dosage compensation, likely in part through remaining XCU (Ohno, 1967; Deng et al, 2014; Larsson et al, 2019).
Discussion
Oogenesis consists of three distinct phases: the first phase begins with PGC specification followed by oogonia differentiation with epigenetic reprogramming; the second phase involves oogonia‐to‐oocytes differentiation with the progression of meiotic prophase I to form oocytes at the diplotene stage, which are organized into primordial follicles with ensheathing granulosa cells; and the third phase entails oocyte growth and maturation (i.e., development of primordial follicles to fully grown follicles) with ensuing meiotic resumption. Here, we have demonstrated in vitro oogenesis up to the middle of the second phase using cyESCs as a starting material, thereby creating a foundation for the study of in vitro oogenesis in primates as well as a benchmark for critically evaluating human in vitro oogenesis.
We have shown that all female cyESCs cultured under our condition (see Materials and Methods) maintain one Xa and one Xi with XIST expression over a substantial number of passages (9–21 passages; Fig 1E–G, Appendix Fig S1B–E, Dataset EV9). This is in contrast to hPSCs cultured under a conventional condition, which exhibit a progressive “erosion” of Xi with XIST repression and de‐repression of genes on Xi over a comparable number of passages (4–20 passages; Mekhoubad et al, 2012; Nazor et al, 2012; Vallot et al, 2015; Patel et al, 2017; Sahakyan et al, 2017; Bar et al, 2019; Yokobayashi et al, 2021). Accordingly, Xi in hPSCs shows an unstable and impaired epigenetic state, including chromosome‐wide erasure of H3K27me3 and aberrant deposition of H3K9me3 (Mekhoubad et al, 2012, Nazor et al, 2012, Vallot et al, 2015, Patel et al, 2017, Sahakyan et al, 2017, Bar et al, 2019, Yokobayashi et al, 2021). Although it has been shown that DNA methylation of the XIST promoter on Xi is involved in Xi erosion (Fukuda et al, 2021), the detailed mechanism underlying Xi erosion remains unclear. Notably, however, a recent study has shown that lithium chloride (LiCl), a component of conventional hPSC culture media such as mTeSR1, activates WNT signaling and induces Xi erosion, and the removal of LiCl from the medium prevents hPSCs from Xi erosion (Cloutier et al, 2022). LiCl also induces Xi erosion in mouse epiblast stem cells (EpiSCs; Cloutier et al, 2022). These observations are consistent with the present findings that cyESCs cultured under our condition that includes a WNT inhibitor (IWR1; see Materials and Methods), but not those cultured under a conventional condition (Okamoto et al, 2021), evade Xi erosion, suggesting that the impact of WNT signaling on Xi stability is conserved among humans, monkeys, and mice, and likely other mammalian species. It would be interesting to explore whether hPSCs can be cultured with stable Xi in the presence of a WNT inhibitor. Also, to define the appropriate X‐chromosome epigenetic states for human/primate in vitro oogenesis, it is critical to explore the epigenetic‐state dynamics of Xa and Xi in the pre‐ and the early post‐implantation epiblast in humans/primates, and to evaluate the Xi epigenetic state in PSCs.
Using allele‐specific analyses, we have demonstrated nearly complete DNA methylation reprogramming on autosomes and Xa, and unique reprogramming dynamics on Xi during the progression from cyPGCLCs to oogonia to fetal oocyte‐like cells (Figs 6 and 7). In oogonia/fetal oocyte‐like cells, compared to autosomes/Xa, Xi retained higher 5mC levels on some promoters/non‐promoter CGIs, while Xi bore lower 5mC levels on LINE1, leaving some epigenetic asymmetry between Xa and Xi (Fig 7A–C). In oogonia/fetal oocyte‐like cells, Xi reactivation was incomplete, albeit substantial, with ~30% of X‐linked genes being expressed from Xi (Fig 7E–G, Dataset EV13). On the other hand, the X:A ratio transitions in vitro were highly similar to those during in vivo development, with fetal oocyte‐like cells showing an X:A ratio of ~1.0 (Fig 7H and I), indicating a broadly normal X‐chromosome dosage compensation, although careful gene‐by‐gene analysis would be required for a formal conclusion. We assume that such X‐chromosome dosage compensation is attained at least in part through residual XCU (Ohno, 1967; Deng et al, 2014; Larsson et al, 2019), a possibility that warrants investigation. In good agreement with these findings, it has been shown in both mice and humans that Xi reactivation is incomplete and somewhat heterogeneous in embryonic oocytes that enter the meiotic prophase (Sugimoto & Abe, 2007; Vertesy et al, 2018). Collectively, these findings support the idea that DNA methylation reprogramming during the progression from cyPGCLCs to oogonia to fetal oocyte‐like cells creates an epigenetic state permissive for oocyte development. To formally demonstrate this idea, it is important to define the genome‐wide epigenetic landscape of X chromosomes in an allele‐specific manner in human/cy oogonia/fetal oocytes and to explore whether the epigenetic asymmetries we observed in vitro, for example, those on the promoters/non‐promoter CGIs and LINE1, do exist and when such asymmetry is resolved during oocyte development.
We have shown that Xi in human oogonia/RA‐responsive cell‐like cells induced from a hiPSC line (1390G3 AGVT #526) exhibited a chromosome‐wide demethylation resistance similar to that of autosomal demethylation escapees (Fig 8A and B). This might be due to the highly repressive nature of Xi in 1390G3 hiPSCs, that is, chromosome‐wide H3K9me3 with no/minimal H3K27me3 (Yokobayashi et al, 2021), which is unlike the nature of Xi in cyESCs—that is, in cyESCs, Xi is associated predominantly with H3K27me3 but not with H3K9me3 (Fig 1F and G, Appendix Fig S1C and D)—suggesting that the Xi epigenetic properties in PSCs are a determinant of Xi reprogramming during human/cy in vitro oogenesis. A more systematic study using multiple female human/cyPSC lines is necessary to draw a formal conclusion. In order to further advance human in vitro oogenesis, it will be crucial to establish a culture condition for hPSCs that allows them to maintain an appropriate epigenetic state of Xi. As discussed above, an hPSCs culture with a WNT inhibitor would be one possible means of stabilizing their Xi epigenetic state.
In xrOvaries, cyPGCLCs differentiated robustly into oogonia‐like cells with appropriate transcriptome progression, whereas oogonia‐like cells took a divergent pathway toward oocytes, over‐activating genes for developmental processes with suboptimal up‐regulation of meiosis genes, progressing up to the zygotene/pachytene stage and arresting their further development (Fig 4). Given that oogonia‐like cells acquire an apparently appropriate transcriptome and DNA methylome for oocyte differentiation, including an apparently appropriate up‐regulation of germline reprogramming‐responsive genes (this was also the case for human oogonia/RA‐responsive cell‐like cell development; Appendix Fig S7F and G; Hill et al, 2018), their failure to robustly differentiate into oocytes can be attributed, at least in part, to a defect in extrinsic conditions, that is, the signaling/environment in xrOvaries. In particular, we noted that in vitro fetal oocyte‐like cells over‐activated genes downstream of BMP (GATA2/3/4, MSX1/2, TBX1/3/5, HAND1/2, NKX2‐5, TFAP2A, ID1/2/3/4, SMAD7, BAMBI) and FGF (SPRY4, DUSP6) signaling (Fig 5D, Dataset EV4). Attenuation of such over‐activated signaling pathways at an appropriate timing may lead to more proper oogonia‐to‐oocyte differentiation in xrOvaries.
It is also of note that U1 cells expressed genes characterizing “oogenic” cells (SOHLH1, ZAR1, NPM2) as well as those for male germ cell development (NANOS2, PIWIL4, EGR4; Appendix Fig S6F). These findings suggest that cues from xrOvaries might be sufficient to induce the oogonia‐to‐oocytes transition, but unlike syngeneic cues, they also over‐activate developmental programs on the reprogrammed “naive” epigenome of oogonia‐like cells, and the latter blocks a proper progression of the former, preventing the progress of the meiotic prophase beyond the zygotene/pachytene stage. On the other hand, human/cy oogonia enter and complete the meiotic prophase to form primordial follicles during an in vitro culture of human/cy fetal ovarian reaggregates (human/cy rOvaries); nonetheless, notably, many oogonia are arrested also at the pre‐leptotene stage likely due to suboptimal up‐regulation of key genes for the pre‐leptotene‐to‐leptotene transition, indicating that the pre‐leptotene‐to‐leptotene transition may be a vulnerable, rate‐limiting step for human/cy fetal oocyte development (Mizuta et al, 2022). Accordingly, to achieve a robust in vitro reconstitution of the first and second phases of oogenesis using PSCs as starting materials, it will be important to establish a culture of oogonia‐like cells in syngeneic rOvaries under a condition that allows an efficient oogonia‐to‐oocytes transition. It will also be vital to understand the signaling and transcriptional mechanism involved in the human/cy oogonia‐to‐oocytes transition, which appears to be divergent from that in mice (Mizuta et al, 2022). Such endeavors will be decisive for a step‐by‐step realization of in vitro oogenesis in humans and relevant primate species.
Materials and Methods
Animals
Experimental procedures using cynomolgus monkeys were approved by the Animal Care and Use Committee of the Shiga University of Medical Science. The procedures for oocyte collection, intracytoplasmic sperm injection (ICSI), and pre‐implantation embryo culture in cynomolgus monkeys were performed as described previously (Yamasaki et al, 2011). All ICR mice used in this study were purchased from the Shimizu Laboratory (Kyoto, Japan).
cyESC derivation from cynomolgus monkey embryos and cyESC culture
The female cyESC lines, 3‐, 15‐, 18‐, 19‐, and 22XRi, were established as described previously (Sakai et al, 2019). Briefly, inner cell masses (ICMs) of day 8 cy blastocysts were cultured on mouse embryonic fibroblasts (MEFs). The ICMs were cultured until primary colonies were obtained in the culture medium [Dulbecco's modified Eagle medium (DMEM)/F12 (Thermo Fisher, 10565018), 20% (v/v) Knockout Serum Replacement (KSR; Thermo Fisher, 10828028), non‐essential amino acids (NEAAs; Thermo Fisher, 1140050), penicillin/streptomycin (Thermo Fisher, 15140122), sodium pyruvate (Sigma Aldrich, S8636), L‐glutamine (Sigma Aldrich, G7513), 10 ng/ml basic FGF (Wako Pure Chemical Industries, 6805384), and 10 μM XAV939 (Calbiochem, 575545)]. The obtained colonies were passaged several times onto the fresh MEFs, and were dissociated with TrypLE Select (Thermo Fisher, 12563029) for further expansion. Cynomolgus ESCs were cultured on MEFs (5.0 × 10⁵ cells per well on a six‐well plate) at a seeding density of 2.5 × 10³ cells. The culture medium, AITS+IF20 (Sakai et al, 2019), consists of 50% Advanced RPMI 1640 (Thermo Fisher, 12633012), 50% Neurobasal (Thermo Fisher, 12348017), 1.6% (w/v) Albumax (Thermo Fisher, 11020062), 1 × ITS (Thermo Fisher, 41400045), 1 × NEAA, 2 mM L‐glutamine (Thermo Fisher, 25030081), 25 U/ml penicillin/streptomycin, 20 ng/ml bFGF (Wako, 060‐04543), and 2.5 μM IWR1 (Sigma Aldrich, IO161). The cells were passaged onto the fresh MEFs at around day 7–8 by dissociation with CTK solution [0.25% Trypsin (Sigma‐Aldrich, T4799‐5), 0.1% type IV collagenase (MP Biomedicals, 195110), 0.1 M CaCl2 (Sigma‐Aldrich, C3306), and 20% KSR (GIBCO, 10828‐028) in PBS] and TrypLE select.
Culture of cy embryonic fibroblasts (CEFs)
Cy embryonic fibroblasts were prepared as described previously (Okamoto et al, 2021). They were maintained in DMEM (Thermo Fisher, 10313‐021) and supplemented with 10% FBS, 1% penicillin/streptomycin, and 1× GlutaMAX™ Supplement (Thermo Fisher, 35050061). At a fully confluent state, the cells were passaged by treating with 0.25% Trypsin/EDTA (Thermo Fisher, 25200072) at 37°C for 3 min.
Generation of the 15XRi AGVT reporter cyESC lines
The donor vector for the TFAP2C‐p2A‐EGFP knock‐in cell lines was constructed as described previously (Sakai et al, 2019). To generate VASA‐p2A‐tdTomato knock‐in cyESC lines, homology arms extending 1.2 kb and 1.3 kb from the stop codon of cy DDX4 were amplified by PCR using the 3XRi genomic DNA as a template with KOD plus Neo DNA polymerase (TOYOBO, KOD‐401). The primer pairs were listed in Dataset EV18. The amplified homology arms were sub‐cloned into pCR™2.1 TOPO vector (Thermo Fisher, K4500‐40) and sequencing analysis was performed by Sanger sequencing. The donor vector with homology arms was amplified by inverse PCR to exclude the stop codon using KOD Plus Neo DNA polymerase. p2A‐tdTomato fragments with pgk‐Neo flanked by LoxP sequences were amplified by PCR using the donor vector used for BLIMP1‐p2A‐tdTomato (Sakai et al, 2019) and inserted in frame prior to the stop codon using an In‐Fusion HD Cloning Kit (Takara Bio, 639633).
A pair of the guide RNAs for the homologous recombination of the target vectors into the DDX4 locus using the CRISPR/Cas9 system were designed within 100 bp upstream and downstream of the stop codon by using the CRISPR direct website (https://crispr.dbcls.jp/). The 5′ ends of the designed oligo DNAs with compatible ends with the BbsI site were phosphorylated by T4 kinase (Takara Bio, 2021S) at 37°C, and then denatured at 95°C and annealed by gradually decreasing the incubation temperature down to 35°C. The annealed oligos were inserted into the BbsI site of the pX335‐U6‐Chimeric BB‐CBh‐hSpCas9n (D10A) vector (Addgene plasmid, 42335). The recombination activities of the designed guide RNAs were examined by single‐strand annealing (SSA) assay (Sakuma et al, 2013).
The introduction of both TFAP2C‐p2A‐EGFP and DDX4‐p2A‐tdTomato targeting vectors into the 15XRi cyESC line was performed as reported previously (Sakai et al, 2019). Briefly, 5.5 × 10⁵ of 15XRi cyESCs (at p4) were mixed with 1 μg of the TFAP2C‐p2A‐EGFP donor vector and 1 μg of guide RNAs/Cas9 expression vectors for the TFAP2C locus in 100 μl of Opti‐MEM (Thermo Fisher, 31985062) using the NEPA21 type II (Nepagene) at 130 V for 3.5 ms. The electroporated cells were seeded onto 5.0 × 10⁵ cells of puromycin/neomycin/hygromycin‐resistant (3r‐) MEFs in a 6 cm dish and cultured for 2 days. The cells were then cultured in the presence of 1 μg/ml puromycin (Thermo Fisher, A1113803) for 8 days. 5.5 × 10⁵ of the surviving 15XRi cyESCs were transfected with 1 μg of the DDX4‐p2A‐tdTomato vector and 1 μg of guide RNAs/Cas9 expression vectors for the DDX4 locus in 100 μl of Opti‐MEM. After electroporation with NEPA21 type II at 130 V for 3.5 ms, the cells were cultured on the 3r‐MEFs for 2 days. The transfected cells were selected by antibiotic selection with 200 μg/ml G418 (Gibco, 10131035) for 7 days. Finally, 5.5 × 10⁵ of the surviving 15XRi cyESCs were suspended in 100 μl Opti‐MEM containing 5 μg of the expression vector of Cre recombinase and plated onto wild‐type MEFs. One hundred colonies were picked up for expansion and genotyping by PCR.
For the genotyping, the genomic DNA was extracted by using a GenElute Mammalian Genome Purification Kit (Sigma, G1N350), and the successful insertion of the gene cassette and the absence of random integration of the vector sequence were confirmed by PCR using the primer pairs listed in Dataset EV18 and KOD one DNA polymerase (TOYOBO, KMM‐101). To verify the targeted/non‐targeted alleles, the sequences around the stop codon were amplified by PCR using the primer pairs listed in Dataset EV18 and KOD one DNA polymerase, and sequenced by Sanger sequence.
Karyotyping
cyESCs at 6 days after the passage in AITS+IF20 were treated with 80 ng/ml KaryoMAX Colcemid (Thermo Fisher, 15210040) at 37°C for 3 h, and then dissociated by CTK solution and TrypLE select. The cells were incubated in 2 ml of Buffered Hypotonic Solution (Genial Helix, GGS‐JL‐006b) and fixed with Carnoy's Solution (75% methanol and 25% acetic acid) on ice. Then, the fixed cells were washed twice and resuspended in 5 ml of Carnoy's solution. After spreading onto a glass slide, the chromosomes were stained with 0.1 μg/ml DAPI (Dojindo, D523) and mounted in VECTASHIELD mounting medium (Vector Laboratories, H‐1000). Chromosome spreads were observed with an FV‐1000D confocal microscope (Olympus) and the number of chromosomes was counted manually.
cyPGCLC induction
cyPGCLCs were induced as described previously (Sakai et al, 2019). Briefly, cyESCs 6–7 days after the passage were dissociated with 300 μl of CTK solution and then 300 μl of TrypLE select at 37°C for 5 min. Thereafter, 6,000 dissociated cells were plated into a well of a low‐binding V‐bottom 96‐well plate (Greiner, 651970), in aRB27 [Advanced RPMI 1640, 2 × B27 without vitamin A (GIBCO, 12587‐001), 0.1 mM NEAA, 2 mM L‐glutamine, and 25 U/ml penicillin–streptomycin] supplemented with 200 ng/ml human BMP4 (R&D Systems, 314‐BP), 1,000 U/ml of human LIF (Millipore, LIF1010), 100 ng/ml mouse SCF (R&D Systems, 455‐MC), 50 ng/ml human EGF (Peprotech, AF‐100‐15), and 10 μM Y‐27632 (Tocris, 1254). The cells were cultured at 37°C for 8 days.
Mouse embryonic ovarian somatic cell collection
Mouse embryonic ovarian somatic cells were collected as described previously with slight modifications (Yamashiro et al, 2018, 2020). Briefly, mouse embryos at embryonic days (E) 12.5, 13.5, 14.5, and 15.5 were dissected in PBS under a stereomicroscope (Leica, M205C), and then the female gonads were harvested and the mesonephros was removed with a tungsten needle in STO medium [DMEM (Gibco, 10313‐021) supplemented with 10% fetal bovine serum (Nichirei, 175012) and 1% penicillin/streptomycin]. The collected gonads were washed in 1 ml PBS twice, and then dissociated with 500 μl TrypLE Express (Gibco, 12604‐021), except for the E15.5 gonads, which were treated with 500 μl of five times diluted Trypsin–EDTA (Gibco, 15400‐054). After incubation in a 37°C water bath for 15–30 min, 500 μl of wash buffer [0.1% BSA fraction V (Gibco, 15260‐037) in DMEM/F12(1:1) (Gibco, 11330‐032)] supplemented with 0.2 mg/ml DNase I (Sigma‐Aldrich, DN25), or 500 μl of STO medium for the E15.5 gonads, was added, appropriate pipettings were performed, and the cell debris was excluded by filtering through a 70 μm mesh filter (pluriSelect, 43‐10070‐60). Washing with 1 ml of wash buffer was followed by incubation with CD15 MACS beads (Miltenyi Biotec, 130‐094‐530) and CD31 MACS beads (Miltenyi Biotec, 130‐097‐418) in 80 μl MACS buffer [0.5% BSA fraction V, 33 mM EDTA in PBS] on ice for 40 min. The cells were then washed with 5 ml MACS buffer and resuspended in 1 ml of MACS buffer to apply to an LD column (Miltenyi Biotec, 130‐042‐901) pre‐calibrated with 2 ml MACS buffer, and the flow‐through was collected as the somatic cell population.
The generation of xrOvaries
xrOvary generation was performed as described previously (Yamashiro et al, 2018, 2020). Briefly, d8 PGCLCs were collected by flow cytometry (see the “Fluorescence‐activated cell sorting (FACS)” section) as either (i) ITGA6+/PDPN+ or (ii) AG+VT− cells. After resuspension in 500 μl of fresh aRB27 medium containing 10 μM Y‐27632, 5,000 cyPGCLCs were mixed with 75,000 mouse embryonic ovarian somatic cells. After centrifugation at 200 g for 5 min at room temperature (RT), the cell pellets were resuspended in 100 μl of aRB27 containing 10 μM Y‐27632 and 1 μM retinoic acid (Sigma, R2625), and plated onto a Lipidure‐coated U‐bottom 96‐well plate (Thermo Fisher, 174925) to generate xrOvaries. After culturing at 37°C for 2 days, a glass capillary was used to transfer xrOvaries onto the Transwell‐COL membrane inserts (Corning, 3496) soaked in alpha‐MEM‐based medium [alpha‐Minimum Essential Medium (GIBCO, 32571‐036) supplemented with 10% fetal bovine serum (GIBCO, 10270106), 55 μM beta‐mercaptoethanol (GIBCO, 21985‐023), 1% penicillin/streptomycin, 2 mM L‐glutamine, and 150 nM L‐ascorbic acid (Sigma, A4403)]. The xrOvaries were cultured at 37°C under an atmosphere of 5% CO2 in the air and the half‐medium change was performed every 3rd day.
For xrOvary passage, AG+VT+ cells were isolated from xrOvaries at ag49 by flow cytometry. After resuspending the cells in 500 μl alpha‐MEM‐based medium with 10 μM Y‐27632, 2,500 cells were mixed with 75,000 mouse embryonic ovarian somatic cells at E13.5, E14.5 or E15.5, and centrifuged at 200 g for 5 min at RT. The cell pellets were resuspended in 100 μl of alpha‐MEM‐based medium containing 10 μM Y‐27632 and plated onto a Lipidure‐coated U‐bottom 96‐well plate. After culturing for 2 days at 37°C, the cell aggregates (xrOvaries) were transferred onto the Transwell‐COL membrane inserts soaked in alpha‐MEM‐based medium using a glass capillary. The xrOvaries were cultured at 37°C under an atmosphere of 5% CO2 in the air and the half‐medium change was performed every 3rd day.
Fluorescence‐activated cell sorting (FACS)
For FACS of cyESCs, to remove MEFs, a 1 × 10⁶ cell suspension was centrifuged at 100 g at RT for 5 min. The cell pellets were then resuspended in 100 μl of FACS buffer (0.1% BSA fraction V in PBS) supplemented with 10 μM Y‐27632 and 5 μl APC anti‐mouse/rat CD29 antibodies (Biolegend, 102216). After incubation on ice for 30 min with a light shield, the cells were washed with 1 ml FACS buffer once and then resuspended in 500 μl FACS buffer with 10 μM Y‐27632 and 5 μg/ml propidium iodide (PI; Sigma‐Aldrich, P4170). The cells were filtered through a cell strainer, and CD29−/PI− cells were collected as cyESCs by a flow cytometer (FACS Aria III; BD Biosciences) according to the manufacturer's instructions.
The floating aggregates of d8 cyPGCLCs were washed with 1 ml of PBS twice, and then treated with 300 μl of 1 mg/ml Type‐IV collagenase (MPBio, 195110) in aRB27 supplemented with 10 μM Y‐27632 at 37°C for 15 min. Washing with 1 ml PBS twice was followed by dissociation in 300 μl of 0.25% Trypsin/EDTA supplemented with 10 μM Y‐27632 at 37°C for 15 min. The cells were then washed in 1 ml of FACS buffer and filtered through a cell strainer (Falcon, 352235). If necessary, after washing with 1 ml of FACS buffer, the cells were stained with Brilliant Violet 421‐conjugated anti‐human/mouse CD49f (ITGA6) antibodies (Biolegend, 313624) and Alexa Fluor 647‐conjugated anti‐human PDPN antibodies (Biolegend, 337008) in FACS buffer on ice for 30 min. d8 cyPGCLCs (AG+VT− or ITGA6+/PDPN+ cells) were analyzed and sorted by a flow cytometer (FACS Aria III; BD Biosciences).
The xrOvaries at various culture periods were washed briefly in PBS, and then one or two aggregates were treated in 250 μl TrypLE Express with 10 μM Y‐27632 on a four‐well plate (NUNC, 176740) at 37°C for 15 min. Every 5 min, the cell aggregates were scratched with 30‐gauge needles. An addition of 750 μl of FACS buffer with 10 μM Y‐27632 was followed by pipetting about 10 times and filtration through a cell strainer. AG+VT−, AG+VT+, and AG−VT+ cells were collected separately by a flow cytometer.
Cells from cy fetal ovaries at 8 wpf were collected and frozen stocked as described previously (Mizuta et al, 2022). The frozen cell stocks were quickly thawed by incubating at 37°C, and the cells were washed with 1 ml of wash buffer with 10 μM Y‐27632, suspended in 100 μl of FACS buffer, and stained with Brilliant Violet 421‐conjugated anti‐human CD117 (c‐KIT) antibodies (Biolegend, 313215) and Alexa Fluor 488‐conjugated anti‐human PDPN antibodies (Biolegend, 337006) on ice for 20 min. The cells were washed with 1 ml FACS buffer twice and then resuspended in 500 μl of FACS buffer with 10 μM Y‐27632. c‐KIT+/PDPN+ germ cells were collected by flow cytometry (FACS Aria III; BD Biosciences) in 500 μl of wash buffer with 10 μM Y‐27632. For storage of the cell pellets for RNA‐seq or EM‐seq analysis, after centrifugation at 200 g for 5 min at RT, the supernatant was removed carefully with Gilson pipettes and the cell pellets were snap frozen in liquid nitrogen.
Immunofluorescence (IF) analysis
For IF analysis of cyESCs, 2,500 cyESCs were plated onto a gelatin‐coated 35 mm film‐bottom dish (Matsunami, FD10300) and maintained in AITS+IF20 at 37°C until reaching semi‐confluency. The cyESC colonies were washed with 1 ml of PBS and fixed with 100 μl of 4% PFA in PBS (Sigma‐Aldrich, 158127) for 15 min at RT. They were washed with 1 ml of PBS three times and then blocked in blocking buffer [10% normal donkey serum (Jackson ImmunoResearch, 017‐000‐121), 3% BSA (Sigma, A4503), and 0.1% Triton X‐100 (Sigma, T9284) in PBS] for 1 h at RT. The colonies were then stained with the primary antibodies in blocking buffer at 4°C overnight. The antibodies were diluted out by washing with 1 ml of PBS three times. The colonies were then stained with the secondary antibodies and DAPI in blocking buffer at RT for 1 h with a light shield. They were washed with 1 ml of PBS three times and mounted in VECTASHIELD mounting medium.
For the whole‐mount IF analysis of cyPGCLCs, two or three cyESC aggregates cultured for 8 days for the induction of cyPGCLCs were fixed with 150 μl of 4% PFA in PBS for 1 h at RT. The fixed aggregates were washed in 100 μl of wash buffer [1% BSA and 0.5% Triton X‐100 in PBS] once, and then stained with the primary antibodies in 50 μl of wash buffer at 4°C for 3 days. They were washed in 100 μl of wash buffer eight times and stained with the secondary antibodies and DAPI in 50 μl of wash buffer at 4°C for 2 days with a light shield. After washing with 100 μl of wash buffer eight times, the aggregates were mounted in VECTASHIELD mounting medium.
For the IF analysis of xrOvary tissue specimen, xrOvaries at various culture periods were fixed in 1 ml of 2% PFA in PBS at 4°C overnight. Then, they were washed in 2 ml of cold PBST [0.1% Tween20 (Wako, 166‐21115) in PBS] on ice three times and immersed with serial concentrations (10% and then 30%) of sucrose (Nacalai Tesque, 30404‐45) at 4°C for 30 min and overnight. The samples were embedded in the OCT compound (Sakura Finetek, 4583) and frozen. Tissue sections were prepared at a thickness of 8 μm at −20°C on a cryostat (Leica, CM1850) and placed onto a glass slide with Platinum‐PRO coating (Matsunami, PRO‐01) and dried completely. The tissue specimen was washed with PBST three times for 10 min each and incubated in 500 μl of blocking buffer [5% normal donkey serum and 0.2% Tween20 in PBS] for 60 min at RT. The sections were stained with the primary antibodies in 100 μl of blocking buffer at 4°C overnight. After washing with PBST four times, they were stained with the secondary antibodies and DAPI in blocking buffer for 1 h at RT with a light shield. Finally, they were washed in PBST four times and mounted with VECTASHIELD mounting medium with DAPI (Vector Laboratories, H‐1200).
For the IF analysis of cy germ cells from fetal ovaries, sorted cells were centrifuged at 200 g for 5 min at RT, and then the cell pellets were resuspended in 10–20 μl of wash buffer [0.1% BSA fraction V in DMEM/F12 (1:1)] with 10 μM Y‐27632. Coverslips of thickness 0.15–0.17 mm coated with Denhardt's solution were additionally coated with 0.01% poly‐L‐lysine solution (Sigma‐Aldrich, P4832). After washing three times with distilled water, the coverslips were placed in PBS. Ten microliter of the cell suspension was seeded onto the poly‐L‐lysine‐coated coverslips using a mouth pipette, fixed in 2 ml of 4% PFA in PBS for 1 h at RT, and then washed with PBST for 10 min at RT three times. The cells were incubated in 500 μl of blocking buffer [10% normal donkey serum, 3% BSA, and 0.1% Triton X‐100 in PBS] for 1 h at RT, and then stained with primary antibodies at 4°C overnight. The cells were washed in 2 ml of PBST for 10 min at RT three times and stained with the secondary antibodies and DAPI for 1 h at RT with a light shield. After washing in 2 ml of PBST for 10 min at RT three times, each coverslip was mounted with VECTASHIELD mounting medium.
The samples were analyzed with a confocal microscope (Zeiss, LSM780). All antibodies are listed in Dataset EV18. All image analyses of IF data were carried out using Fiji (ImageJ 1.53c, Java 1.8.0_172). In Appendix Fig S3D, the numbers of TFAP2C‐, hMit‐, and DDX4‐positive cells were counted manually based on the following criteria: when prominent and clear IF signals with expected subcellular localization were observed compared to background, they were judged as positive, and when not, as negative. We classified all ambiguous signals as negative.
RNA fluorescence in situ hybridization (FISH) and IF followed by RNA FISH analysis
RNA FISH
CyESCs on the coverslips were fixed in 4% paraformaldehyde for 10 min at RT, and then permeabilized in PBS containing 0.5% Triton X‐100 and 200 mM ribonucleoside vanadyl complex (RVC; BioLabs, S1402S) for 4 min on ice and kept in 70% ethanol at −20°C before performing the RNA‐FISH analysis.
The bacterial artificial chromosome (BAC) clones encompassing genes of interest were identified from the BAC libraries of rhesus macaques (Macaca mulatta) presented at www.genboree.org (Milosavljevic et al, 2005), and appropriate BAC clones were purchased from the BACPAC Resources Center (BPRC: https://bacpacresources.org/): The BAC probes used for the RNA‐FISH analysis were CH250‐104N22 for POLA1, CH250‐53K13 for ATRX, and CH250‐456P6 for HUWE1. For the detection of XIST RNA, two DNA probes were used: (i) a fragment corresponding to a part of exon 1 (3,064 bp), and (ii) a fragment corresponding to a part of exon 6 (7,074 bp). The probes were labeled with Green‐dUTP (for XIST; Abbott, 02N32‐050) or Orange‐dUTP (for POLA1/ATRX/HUWE1; Abbott, 02N33‐050) by nick translation (Abbott, 30‐801010) according to the manufacturer's instructions.
RNA FISH was carried out essentially as described previously (Okamoto et al, 2004; Okamoto, 2018). Briefly, cyESCs on the coverslips were dehydrated through a graded dilution series of ethanol (70, 90, and 100%) until completely dried. The probes (0.1 μg of probes with 10 μg of salmon sperm DNA and 1–5 μg of house‐made cyCot‐1 DNA per coverslip) were hybridized in 50% formamide, 2 × SSC, 20% dextran sulfate, 2 mg/ml BSA (BioLabs, B9000S), and 200 mM RVC overnight at 37°C. After washing in 50% formamide and 2 × SSC three times at 42°C and in 2 × SSC three times at 42°C, the samples were counterstained for 5 min with 0.1 μg/ml of DAPI, followed by a final wash in 2 × SSC. Samples were mounted in VECTASHIELD mounting medium, and images were acquired by a confocal laser scanning microscope (Olympus FV1000).
IF followed by XIST RNA FISH
IF followed by XIST RNA FISH was carried out as described previously (Okamoto et al, 2004, Okamoto, 2018). CyESCs on the coverslips were fixed for 10 min in 4% PFA (pH 7.4) at RT. Permeabilization of the cells was performed on ice in 0.5% Triton X‐100/PBS for 4 min. After rinsing in PBS, the preparations were blocked in 1 mg/ml BSA and 0.5 U/μl RNase inhibitor (Promega, N2111) in PBS for 15 min, incubated with primary antibodies for 1 h, and then washed in PBS three times and incubated with secondary antibodies (diluted in blocking buffer) for 30 min at RT. After washing in PBS, the preparations were post‐fixed in 4% PFA for 10 min at RT and rinsed in PBS. They were then washed twice in 2 × SSC for 10 min at RT. The hybridization with XIST probes (0.1 μg of probes with 10 μg of salmon sperm DNA per coverslip) was hybridized in 50% formamide, 2 × SSC, 20% dextran sulfate, 2 mg/ml BSA, and 200 mM RVC overnight at 37°C. After washing in 50% formamide and 2 × SSC three times at 42°C and in 2 × SSC three times at 42°C, the samples were counterstained for 3 min with 0.1 μg/ml of DAPI, followed by a final wash in 2 × SSC. Samples were mounted in VECTASHIELD mounting medium, and images were acquired by a confocal laser scanning microscope (Olympus FV1000).
All image analysis was carried out using Fiji (ImageJ v2.9/1.53t) software. The images of IF and FISH signals were taken as Z‐stacks and transformed into a maximum‐intensity projection image. The nuclei with prominent/clear FISH or IF signals were selected as successfully stained, and they were quantified by manual count.
Spread analysis of the meiotic chromosomes
xrOvaries were dissociated and AG−VT+ cells (2,000–3,000 cells) were collected at ag49+28 or ag49+56 as described above. They were centrifuged at 200 g at RT, and the supernatant was removed. After tapping the pellets vigorously, 500 μl of hypotonic buffer (30 mM Tris–HCl, pH 8.0, 50 mM sucrose, 17 mM sodium citrate, and 5 mM EDTA) supplemented with 2.5 mM DTT (Wako, 040‐29223) and 0.5 mM PMSF (Nacalai Tesque, 06297‐31) was added and pipetted gently up and down 20 times. The cells were incubated at 37°C for 30 min, and then immediately centrifuged at 200 g at RT. The cell pellets were resuspended in 10 μl of 100 mM sucrose and dispersed onto glass slides to make cell spreads in 1% PFA/0.2% Triton X‐100. The slides were incubated at RT overnight in a humid chamber and then washed with 0.5% DRIWEL (Fuji Film, 4902520‐009517) for 2 min and air dried.
For the IF analysis, the slides were blocked with 130 μl of blocking solution (10% normal donkey serum, 3% bovine serum albumin, and 0.2% Triton X‐100 in PBS) at RT for 2 h, and then incubated with primary antibodies in 130 μl of blocking buffer at 4°C overnight. The residual antibodies were diluted out by washing with PBS/0.2% Tween20 three times, and the slides were incubated with secondary antibodies and DAPI in 130 μl of the blocking buffer at RT for 2 h. After washing with PBS/0.2% Tween20 three times, the samples were mounted in VECTASHIELD mounting medium and staining patterns were observed by using a confocal microscope (Zeiss LSM780).
All IF images were analyzed using Fiji (ImageJ 1.53c, Java 1.8.0_172). In Fig 3E, the stage of meiotic prophase I was classified based on the SYCP3‐ and RPA2‐staining pattern of a cell spread as follows: pre‐leptotene: a few foci of SYCP3 with no RPA2 staining in the nucleus; leptotene: short segments of SYCP3 staining with a few RPA2 foci; zygotene: numerous long threads, but incomplete synapsis formation, of SYCP3 staining with many RPA2 foci.
Reference genomes and annotations
Genome sequences and transcript annotations for cynomolgus monkeys (macFas5.0) and humans (GRCh38.p12) were downloaded from the NCBI ftp site. Repeatmasker data for cynomolgus monkeys (macFas5), humans (GRCh38), bonobos (panPan3), chimpanzees (panTro6), gorillas (gorGor6), orangutans (ponAbe3), baboons (papAnu4), rhesus monkeys (rheMac10), and marmosets (calJac4) were downloaded from the UCSC table browser. Promoters were defined as the regions between 900‐bp upstream and 400‐bp downstream of the transcription start sites (TSSs). CpG islands on macFas5 were downloaded from the UCSC table browser and those on humans were obtained from Illingworth et al (2010) in the hg18 format, and then converted to GRCh38 format using the program liftOver. Differentially methylated regions (DMRs) of the imprinted genes were obtained from Court et al (2014), and converted to macFas5 format using liftOver for the analysis of cynomolgus data. Germline reprogramming‐responsive (GRR) genes in mice (Hill et al, 2018) were converted to their human counterparts based on the genomic location using liftOver. Among the 45 GRR genes in mice, 31 genes were identified in humans.
Full‐length RNA sequencing of cyESCs and d8 PGCLCs
A total of 2–5 × 10⁵ female cyESCs at passage numbers 11–35 were collected after trypsinization without exclusion of CD29+ MEFs, while male cyESCs do not include CD29+ MEFs. The mapping rates of MEF‐derived RNAs to the cynomolgus reference genome are shown in Dataset EV1C. 2.5 × 10⁵ d8 cyPGCLCs derived from the 15XRi‐AGVT#7 line cells were collected from the d8 cyESC aggregates by FACS. Total RNAs were extracted by using an RNeasy Mini Kit (QIAGEN, 74104) according to the manufacturer's instructions. For RNA sequencing, the library was prepared by using NEBNext Ultra II Directional RNA Library Prep Kit with Sample Purification Beads (NEB, E7765). The sequence data were acquired using a Nextseq 500 High Output Kit v2.5 (75 cycles; Illumina).
Mapping of full‐length RNA sequencing data
All read data were processed with cutadapt v1.18 and mapped with Tophat2 v2.1.1/bowtie2 v2.3.4.1 as described previously (Nakamura et al, 2015). Expression levels as FPKM (fragments per kilobase of exon per million reads) were calculated using cufflinks v2.2.1 (Dataset EV1). The bar graphs in Appendix Fig S1E were made using the R software.
Quantitative polymerase chain reaction (qPCR) and bulk 3′ RNA‐seq
For qPCR and transcriptome analysis, total RNA extraction from 5,000 to 20,000 cells was carried out using a Nucleospin RNA XS Extraction Kit (Takara, 740902). cDNA synthesis was performed as described previously (Nakamura et al, 2015). Briefly, 0.2 ng/μl of the V1(dT)24 sequence was annealed to the 3′ end of ~1 ng of total RNA by incubation at 70°C for 90 s. Reverse transcription was performed by adding 133 U/μl of SuperScript III (Invitrogen, 18080044), followed by serial incubation at 50°C for 5 min and 70°C for 10 min. The residual primers were excised by treating with 0.5 U/μl of Exonuclease I (Takara, 2650A) at 37°C for 30 min followed by 80°C for 25 min. Poly‐A was added to the 3′ end of the cDNAs by incubating at 37°C for 15 min and 70°C for 10 min in the presence of 3 mM dATPs (GE Healthcare, 28‐4065‐01) and 0.75 U/μl terminal deoxynucleotidyl transferase (TdT; Invitrogen, 10533‐065). For cDNA amplification, the cDNAs were applied to thermal cycling in the presence of 0.62 μM of V3(dT)24 and V1(dT)24, and 0.05 U/μl Ex Taq HS (Takara, RR006). The cDNAs at proper size were purified with a 0.6× volume of Axyprep Mag PCR Clean‐up (Corning MAG‐PCR‐CL). For qPCR, 4 μl of the 1:40 diluted cDNAs was mixed with Power SYBR Green PCR Master Mix (Thermo Fisher, 4367659) and the primer pairs (0.4 μM) listed in Dataset EV18, and qPCR was performed on a real‐time PCR system (Biorad, CFX384). The expression levels were expressed as the Ct values relative to the averaged Ct values of GAPDH and PPIA.
The cDNA library was constructed as described previously (Ishikura et al, 2016; Kojima et al, 2021). Briefly, 5 ng of the amplified cDNAs was further amplified in the presence of 0.01 μg/μl of the N‐V3(dT)24 primer and 0.01 μg/μl of the V1(dT)24 primer and 0.025 U/μl Ex Taq HS polymerase by four cycles of PCR. After removal of the PCR byproducts and residual PCR primer with a 0.6× volume of Axyprep Mag PCR Clean‐up, the 1:50 diluted cDNAs were fragmented with Covaris E220. The sheared cDNAs were treated with 0.01 U/μl of T4 DNA polymerase (NEB, M0203) for end‐polish, and then purified with 0.7× and 0.9× volumes of Axyprep Mag PCR Clean‐up. To provide the purified cDNAs with an Rd2SP‐adaptor‐seq, the cDNAs were incubated in the presence of 0.67 μM of the Rd2SP‐V1(dT)20 primer and 0.033 U/μl of Ex Taq HS polymerase using the following thermal cycling program: 95°C for 3 min, 67°C for 2 min, and 72°C for 2 min. Then, Rd1SP‐T adaptor was added to the cDNAs by incubating the cDNAs with 0.6 μl of 5 μM of the Rd1SP‐T adaptor and 1 μl of T4 ligase (NEB, M0202M). The cDNAs were purified by two rounds of purification using a 0.8× volume of AMPure XP, and amplified by PCR using 1 μM of the Nextera XT Index 1 (N7XX) primer and 1 μM of Index 2 (S5XX) primer. Finally, the amplified cDNAs were purified by two purification rounds with a 0.9× volume of AMPure XP and eluted with 30 μl of TE buffer. The quality and quantity of the cDNA libraries were evaluated by LabChip GX (Perkin Elmer), a Qubit dsDNA HS Assay Kit (Thermo Fisher, Q32854) and TaqMan‐PCR using Thunderbird Probe qPCR mix (TOYOBO, QPS‐101) and a TaqMan probe (Applied Biosystems, Ac04364396). The sequencing data were acquired using a NextSeq 500 High Output Kit v2.5 (75 cycles; Illumina).
Mapping bulk 3′ RNA‐seq data
All read data were processed with cutadapt v1.18 and mapped with Tophat2 v2.1.1/bowtie2 v2.3.4.1 as described previously (Nakamura et al, 2015). Read counts per gene were calculated using HTseq v0.11.0 (Dataset EV1).
Data analysis of the bulk 3′ RNA‐seq
The bulk 3′ RNA‐seq data were analyzed using the R software packages (version 4.0.5., 2021/03/31). Genes whose log2 (RPM + 1) values were > 4 in at least one sample were chosen and defined as “all expressed genes.” Unsupervised Hierarchical Clustering (UHC) was performed using the hclust function with Euclidean distances and Ward's method (ward.D2). Principal component analysis (PCA) was performed using the prcomp function, and differentially expressed genes (DEGs) were defined as those with more than 2.5 S.D. radius of scaled PC1 and PC2 values. The heatmap was generated using the heatmap.2 function. For Gene Ontology (GO) and Kyoto Encyclopedia of Genes and Genomes (KEGG) analyses, human gene annotations corresponding to cynomolgus monkeys were used as described previously (Sakai et al, 2019; Dataset EV8A), and analyses were performed using the DAVID web tool (Huang et al, 2009).
Single‐cell RNA‐seq
Single‐cell cDNA libraries were prepared using the 10X Genomics Chromium Next GEM Single Cell 3′ Reagent Kits v3.1 (10X Genomics) according to the manufacturer's instructions. Briefly, xrOvaries at ag49+52 were trypsinized to dissociate into single cells and applied to flow cytometry (FACS Aria III, BD Biosciences). CyESC‐derived germ cells were collected as FSC‐Whigh/DRAQ7−/AG+ and/or VT+ cells, while mouse embryonic ovarian somatic cells were collected as FSC‐Wlow/DRAQ7−/AG−VT− cells. Cy in vitro germ cells and mouse cells were mixed and the cell concentration was adjusted to 1,000 cells/μl and applied to a Chromium 10X Single Cell System (10X Genomics) to generate the Gel‐Bead in Emulsions (GEMs). cDNA libraries were prepared using a Chromium Next GEM Single Cell 3′ GEM, Library & Gel Bead Kit v3.1 (10X Genomics) following the manufacturer's instructions. The sequencing was performed with a Novaseq sequencer (Illumina).
Mapping single‐cell RNA‐seq
Read data for single‐cell cDNA data were processed with cellranger v6.0.1 with default setting and transcript reference, macFas5.0 annotation release 101 (Dataset EV1).
Data analysis of the single‐cell 3′ RNA‐seq
Mapped data were processed as described previously (Mizuta et al, 2022) with slight modifications. Briefly, the low‐quality cells were excluded based on the following criteria: (i) the number of detected genes was ≥ 1,000; (ii) the number of UMI molecules detected within a cell was ≥ 2,000 and ≤ 125,000; and (iii) the percentage of mitochondrial genes was ≥ 1% and ≤ 20%. After putatively excluding doublets/multiplets using the Scrublet python package (v. 0.2.1; Wolock et al, 2019), interspecies doublets composed of mouse somatic cells and cyESC‐derived cells were removed if common cell barcodes were detected in both filtered count matrices mapped to GRCm38.p6 and MacFas5.0. Then, the filtered count matrix was applied to noise reduction by RECODE (resolution of the curse of dimensionality; Imoto et al, 2022) and normalized by 100 k.
Analysis for in vitro and in vivo cy oogonia/fetal oocytes
DDX4 + in vitro and in vivo germ cells were extracted and merged. Note that “unclassified” cells in cy fetal ovary germ cells (Mizuta et al, 2022) were not included. Their raw count matrices were again processed by RECODE (Imoto et al, 2022), normalized by 100 k, and then log‐transformed [log (size‐scaled (ss) UMI + 1)]. Batch corrections, identification of highly variable genes (HVGs), and cell clustering were performed as described previously (Satija et al, 2015; Mizuta et al, 2022), and the germ cells were classified into 12 clusters. The germ cells were then visualized using Seurat's “RunUMAP” function (Satija et al, 2015). Based on the expression pattern of key marker genes, the clusters were annotated as “mitotic 1/2/3,” “pre‐leptotene 1/2/3/4,” “leptotene 1/2,” “zygotene,” “pachytene,” and “unclassified.” Because an “unclassified” cluster was composed of two heterogenous cell groups, it was further classified as “unclassified1/2” using Seurat's “FindClusters (resolution = 0.5)” function. In addition, cells expressing GDF9/ZP3/NOBOX were manually selected as “diplotene.” To plot HVGs, which were previously determined using cy fetal germ‐cell datasets (Mizuta et al, 2022), the germ‐cell count matrix was scaled by using Seurat's “ScaleData” function, and the z‐score of HVGs was averaged for each cluster. Correlation coefficients among each cell cluster were calculated based on the expression of HVGs. Cell cycle scoring and annotation were performed using the “Cell‐Cycle Scoring” function (Tirosh et al, 2016) as described in Mizuta et al (2022). RNA velocity analysis was performed using the “scvelo.pp.moments” and “scvelo.tl.velocity” functions in the scVelo python package (Bergen et al, 2020) as described previously (Mizuta et al, 2022).
Analysis of differentially expressed genes (DEGs) between in vitro and in vivo cy oogonia/fetal oocytes
Germ cell clusters (13 clusters and “diplotene”) were grouped into five clusters: “mitotic 1/2/3” as “Mitotic (M)”; “pre‐leptotene 1/2/3/4” as “Pre‐leptotene (PL)”; “leptotene 1/2” as “Leptotene (L)”; “zygotene” as “Zygotene (Z)”; and “pachytene” as “Pachytene (P).” Gene expression levels in cells within each cluster in vitro and in vivo were compared using the “FindMarkers (test.use = “MAST”)” function in the Seurat R package, and DEGs were defined as those with log2FC > 1 and P‐value < 0.05. Gene ontology (GO) enrichment analysis for DEGs was performed as described above (Dataset EV8B).
Analysis of the chromosomal expression ratio
The chromosomal expression ratio was calculated as described previously (Okamoto et al, 2021; Mizuta et al, 2022). Briefly, for bulk 3′ RNA‐seq data, the 75th‐percentile log2 (RPM + 1) values of the expressed genes (a maximum expression in log2 (RPM + 1) of more than four among the cells) on the autosomes and chromosome X were calculated for each individual sample. For the analysis of cynomolgus monkey cells, chromosome 15 was used as the representative autosome. To compare the expression ratio, the chromosome 15: total autosome ratio and the chromosome X:total autosome ratio (X:A ratio) were calculated. 11175:468:469 genes on all autosomes:chromosome 15:chromosome X were used.
For 10X single‐cell RNA‐seq data, the expressed genes were defined as those expressed in more than two cells. The average log2 (ss100kUMI + 1) values of all expressed genes on all autosomes, chromosome 15, and chromosome X were used to calculate the ratios chromosome 15:all autosomes and chromosome X:all autosomes. 12914:529:538 genes on total autosome:chromosome 15:chromosome X were used in this study.
Whole‐genome sequencing (WGS) of a cynomolgus monkey sperm donor, cyESCs, and CEFs
The genome sequence of a male cynomolgus monkey used as a sperm donor to establish the 15XRi ESC line was determined as described previously (Okamoto et al, 2021). For cyESCs and CEFs, the genomic DNAs were purified from the cell pellets (106 cells) by using a GenElute™ Mammalian Genome Purification Kit as instructed by the manufacturer. Since MEF‐derived sequences do not affect data quality, MEFs were excluded only briefly with CTK treatment. WGS analysis was performed by Macrogen as a customized service. Briefly, the DNA libraries were constructed by using a Truseq DNA PCR‐Free Kit (Illumina, 20015962) according to the manufacturer's instructions. The DNA libraries were sequenced by a HiSeq X Illumina sequencer, and the BCL (base call) binary was converted into FASTQ utilizing illumine package bcl2fastq.
Mapping whole‐genome sequencing data and SNP calling
Whole‐genome sequencing data for 15XRi (cyESCs), CEF8, CE0049, and CE0746 were processed with Trim_Galore! v0.6.3 and mapped on the macFas5.0 genome using bowtie2 v2.3.4.1 with the “‐‐very‐sensitive” and “‐X 2000” options. The resulting BAM files were processed with the MarkDuplicates script from Picard tools v2.18.21 with the “REMOVE_DUPLICATES = true” option to remove PCR duplicates.
SNPs for paternally homozygous but heterozygous in ESCs were used in this study. SNP lists were generated as follows:
Whole‐genome sequence data of cyESCs were applied to HaplotypeCaller v4.1.2.0, and then heterozygous positions were defined as those satisfying the following criteria: GT is either “0/1” or “1/2”; QUAL is > 100; GT is > 10; and REF and ALT have one nucleotide (heterozygous‐in‐ESC positions).
Whole‐genome sequence data of paternal individuals were applied to Igvtools v2.3.98, and then positions matching with heterozygous‐in‐ESCs positions were extracted.
Among the extracted positions, the paternally homozygous positions were extracted based on the following criteria: total read counts at the position are ≥ 10; 90% of total read counts at the position come from a certain nucleotide (A, C, G, or T).
If nucleotides of step 3 matched either REF or ALT of heterozygous‐in‐ESC positions, they were defined as paternally derived. The other nucleotides were defined as maternally derived. If nucleotides of step 3 matched neither REF nor ALT, their position information was excluded from the list.
SNP lists of CEFs were also determined as above using the whole‐genome sequence data of CEFs and their paternal individual. Summary of the SNP determination is available in Dataset EV10.
Whole‐genome methylome analysis
Genomic DNAs were purified from 10,000 to 20,000 cells by using Nucleospin Tissue XS (Macherey‐Nagel, 740901) and eluted in 10 μl elution buffer. The DNA concentration was quantitated by using a Qubit dsDNA HS Assay Kit (Thermo Fisher, Q32854) and 20–140 ng of genomic DNAs were mixed with 1 pg of pUC19 DNA and 20 pg of unmethylated lambda DNA for a total volume of 50 μl. The DNAs were then fragmented by sonication using an E220 focused‐sonicator from Covaris (peak incident power: 140W; duty factor: 10%; cycles per burst: 200; and treatment time: 130 ms). The fragmented DNA samples were purified by two rounds of Axygen beads purification (0.7× volumes and then 0.9× volumes). Then, all fragments were applied to library construction using a NEBNext Enzymatic Methy‐seq Kit (New England Biolabs, E7120) according to the manufacturer's instructions. Library concentrations and fragment sizes were evaluated with KAPA Library Quantification Kits (Nippon Genetics, KK4828) and a Labchip GX Touch HT nucleic acid analyzer (Perkin Elmer). The sequencing was performed using an Illumina Novaseq sequencer (Illumina).
Mapping and processing of EM‐seq data
All reads were processed with Trim_Galore! v0.6.3 with default settings to remove adapter and low‐quality sequences. Processed reads were mapped on the cynomolgus monkey genome, macFas5.0, using Bismark v0.22.1 and bowtie2 v2.3.4.1 with the “‐X 2000” option. The resulting BAM files were then processed with the script deduplicate_bismark to remove PCR duplicates, and methylation levels per CpG were calculated using the bismark_methylation_extractor script included in the Bismark package. All CpG sites with read depths ≥ 4 were used for the analysis.
Allelic methylation analysis of cynomolgus monkey data
The reference genome, macFas5.0, was masked with “N” at all SNP positions using the maskfasta command from BEDtools v2.27.1. EM‐seq data were re‐mapped on the masked macFas5.0 genome as described above. BAM files after PCR‐duplicate removal were processed with SNPsplit v0.3.2 with the “‐‐paired” and “‐‐bisulfite” options and the masked macFas5.0 reference in order to split mapped reads into paternal and maternal alleles. The resulting BAM files were processed with the bismark_methylation_extractor script with the “‐p” and “‐‐comprehensive” options. Because of the lower coverage of reads over CpGs, all bins with [sum of all mC and C call within a bin] ≥ 10 were used, and the percent methylations of CpG were calculated as .
Allelic expression‐level analysis of cynomolgus monkey data
Read data for transcriptome analysis were re‐mapped using the masked macFas5.0 reference, as described above. Mapped BAM files were processed with SNPsplit and the masked macFas5.0 reference in order to split the files into paternal and maternal alleles. Read counts per gene were calculated using HTseq for both BAM files, separately.
CpA methylation analysis
CpA methylation calls were obtained from “bismark_methylation_extracter” with the “‐‐CX” option. Allelic CpA methylations were processed in the same manner and all 5mC levels for CpA were calculated as ([sum of mC and C call] ≥ 10).
Retrotransposon analysis
Subgroups of LINE1 retrotransposon, L1_RS1 to L1RS37, were only detected in the cynomolgus (macFas5), rhesus (rheMac10), and baboon (panAnu4) genomes among currently available primate genomes listed in the “Reference genomes and annotations” section. For the analysis of all LINE1 retrotransposons and escapees (Fig 6G), the L1_RS subfamily was used to represent active LINE1s in Figs 6A and 7A−C. Similarly, L1HS and L1PA2, 3, 4, 5, 6, and 7 were enriched in human escapees (Fig 6G) and were therefore used to represent human LINE1s.
Subgroups of the Alu retrotransposons AluYRa, AluYRb, AluYRc, and AluYRd were only annotated in the cynomolgus, rhesus, and baboon genomes among currently available primate genomes listed in the “Reference genomes and annotations” section and were enriched in the cynomolgus escapees (Appendix Fig S7B). Therefore, these AluYR subfamilies were used to represent cynomolgus Alu sequences. Similarly, all AluY subgroups except AluYR were enriched in the human, bonobo, and chimpanzee genomes, and these subgroups were therefore used as representative human Alu sequences.
In the same manner, MacERV in ERV1 and ERVK, as well as MacSVA in SVA were only present in the cynomolgus, rhesus, and baboon genomes, and therefore were used as representative cynomolgus ERV1, ERVK, and SVA sequences, respectively.
Demethylation escapee analysis
Demethylation escapees for cynomolgus monkeys were defined as follows: EM‐seq data for ag35AGVT, ag49AGVT, and ag49+52VT were processed with the program methpipe v3.4.3 to calculate hypermethylated regions using the default settings. Hypermethylated regions for ag35AGVT and ag49AGVT were merged using “bedtools merge” with the default settings and set as “ag AG+VT+” escapees (112,350 loci). Hypermethylated regions for ag49+52VT were set as “ag AG−VT+” escapees (49,495 loci). Overlap of escapees was calculated using the “bedtools intersect” command.
Human escapees were defined using human female germ cell data at week 9 (Tang et al, 2015) and at weeks 10, 11, and 17 (Guo et al, 2015). Mapped BAM files were processed with methpipe, and hypermethylated regions were calculated separately. The hypermethylated regions for these samples were all merged with “bedtools merge” and set human female escapees (146,786 loci).
For the comparison of cy and human escapees, cy escapees were further merged (114,571 loci) and processed with the program liftOver (UCSC) to convert them to the human genome, GRCh38 (successful conversion in 37,208 loci and failed conversion in 114,571 loci). The overlap between cy and human escapees was calculated using the “bedtools intersect” command. All cy and human escapees were annotated with the “annotatePeaks.pl” script of Homer v4.11.1.
Promoter methylations and expression levels of X‐linked genes in cynomolgus monkeys
The Xp‐a and Xm‐i allelic data were generated using the reads overlapping allelic SNPs. Among all X‐linked genes (981 genes), genes meeting both of the following two criteria were selected for visualization and percent Xp‐a expression levels:
The promoters include four or more CpGs with read depth ≥ 4 in unphased total EM‐seq data in cyESCs, and the sum of mC and C calls in both Xp‐a and Xm‐i promoters are ≥ 10.
The maximum expression levels among all datasets in either Xp‐a or Xm‐i are at least 1 in RPM.
A total of 128 genes satisfying these criteria were classified according to their promoter 5mC levels on the Xp‐a and Xm‐i alleles in cyESCs: class 1 genes with high (≥ 50%) 5mC on both Xp‐a and Xm‐i (48 genes), class 2 genes with low (< 50%) 5mC on Xp‐a and high 5mC on Xm‐i (71 genes), a class 3 gene with high 5mC on Xp‐a and low 5mC on Xm‐i (XIST), and class 4 genes with low 5mC on both Xp‐a and Xm‐i (8 genes; Dataset EV13). Hierarchical clustering was performed using heatmap.2 in R (gplot 3.1.1) for expression levels from Xp‐a and Xm‐i alleles for visualization (Fig 7E).
Average percent Xp‐a expression levels were calculated as .
Long‐read sequencing analysis of human iPSCs
Cells of a human female iPSC line, 1390G3‐AGVT#526 (Yamashiro et al, 2018) at passage number 27, were cultured in StemFit AK03N (Ajinomoto, AK03N) on iMatrix‐511 (Nippi, 892014), trypsinized as described previously (Murase et al, 2020), and divided into 1 × 10⁶ cell aliquots. After centrifugation at 100 g for 5 min at RT, the supernatant was removed, and the cell pellets were snap‐frozen in liquid nitrogen. Then, 4–6 × 10⁶ cells were used to extract genomic DNA using an HMW DNA Extraction Kit for cells (Monarch, T3050) or HMW DNA Extraction Kit for Tissue (Monarch, T3060), and the DNA libraries were prepared using a Ligation Sequencing Kit (Oxford Nanopore Technologies, SQK‐LSK110) or Ultra‐Long DNA Sequencing Kit (Oxford Nanopore Technologies, SQK‐ULK001) per the manufacturer's instructions. The libraries were loaded onto FLO‐PRO002 (R9.4) flow cells and sequenced on a PromethION instrument (Oxford Nanopore Technologies). The libraries were loaded onto the flow cells three times, and after the first and second runs, the flow cells were washed with a Flow Cell Wash Kit (Oxford Nanopore Technologies, EXP‐WSH004).
Mapping and processing of the Oxford nanopore technologies (ONT) sequencing data
ONT fast5 data were processed with Megalodon v2.4.1 with the “‐‐remora‐modified‐bases dna_r9.4.1_e8 fast 0.0.0 5hmc_5mc CG 0,” “‐‐guppy‐config dna_r9.4.1_450bps_hac_prom.cfg,” and “‐‐outputs basecalls mappings mod_mappings mods” options and the human reference genome GRCh38.p12. An SNP list was made using Clair3 v0.1.11 with the “‐‐platform = ont” option and the GRCh38.p12 reference genome. SNPs with a “PASS” mark at the FILTER column and genotype (GT) of “1/1” or “1/2” were extracted and replaced with bases in the GRCh38.p12 reference genome to make a customized reference genome for the 1390G3 line, using the “bcftools consensus” command of BCFtools v1.15.1. Nanopore fast5 data were re‐mapped with Megalodon as described above using a customized 1390G3 genome, and an SNP list was made using Clair3.
Mapping and processing of the public human DNA methylome data
Whole‐genome bisulfite sequence data for hiPSCs, hPGCLCs, and hPGCLC‐derived cells in xrOvaries (Yamashiro et al, 2018) and human in vivo female germ cells (Guo et al, 2015; Tang et al, 2015) were obtained from the DDBJ or SRA databases. All reads were processed with Trim_Galore! and mapped on the masked 1390G3 reference genome as described above, using Bismark as described in Yamashiro et al (2018).
Haplotype phasing for ONT data and assignment of phasing blocks to Xa and Xi
SNPs with a “PASS” mark at the FILTER column were used to assign allele marks using the haplotag command of Whatshap v1.4. BAM files with the methylation call, “mod_mapping.bam,” were processed with the split command of Whatshap to split them into two alleles. Methylation calls per CpG were calculated using modbam2bed v0.5.3 with the “‐e ‐m 5mC ‐‐cpg” option. Xa and Xi were defined as follows: among phasing blocks (longer than 1,000,000 bases), the average 5mC levels of genome‐wide 10 kb bins showed a clear difference between alleles (Fig 8A, Table EV1). Hence, the 5mC levels of CGIs and promoters were higher in the allele that bears lower 5mC levels in genome‐wide 10 kb bins. Therefore, an allele that bears higher 5mC levels in CGIs and/or promoters and lower 5mC levels in genome‐wide 10‐kb bins was assigned as inactive X (Xi) and the other allele was assigned as active X (Xa; Table EV1).
Data processing for allele analysis of human data
Read data for hiPSCs, hPGCLCs, and hPGCLC‐derived cells in xrOvaries (Yamashiro et al, 2018) were re‐mapped on the customized human genome for the 1390G3 line with all allelic SNPs masked using Bismark as described above. The resulting BAM files were processed with SNPsplit with the “‐‐bisulfite” option and the masked 1390G3 reference genome to split them into two alleles. The resulting BAM files were processed with the bismark_methylation_extractor script with the “‐‐comprehensive” option. All bins with [sum of all mC and C call within a bin] ≥ 10 were used and 5mC levels were set as to detect limited signals.
Allelic expression‐level analysis of human public data
Read data for human transcriptome analysis were re‐mapped using the masked 1390G3 reference genome, as described above. Mapped BAM files were processed with SNPsplit and the masked 1390G3 reference genome to split them into paternal and maternal alleles. Read counts per gene were calculated using HTseq for both BAM files, separately. Xa and Xi assignments defined above were used to assign the alleles of gene expression.
Promoter methylations and expression levels of X‐linked genes in humans
The Xa and Xi allelic data were generated using the reads overlapping allelic SNPs. Among all X‐linked genes (1,305 genes), genes with both of the following two criteria were selected for visualization and percent Xa expression levels:
The promoters include a sum of mC and C calls ≥ 10 in both Xa and Xi promoters in iPSC_ONT.
The maximum expression levels among all datasets in either Xa or Xi are at least 1 in RPM.
A total of 37 genes satisfying these criteria were classified according to their promoter 5mC levels on the Xp‐a and Xm‐i alleles in cyESCs: class 1 genes with high (≥ 50%) 5mC on both Xa and Xi (7 genes), class 2 genes with low (< 50%) 5mC on Xa and high 5mC on Xi (28 genes), class 3 genes with high 5mC on Xa and low 5mC on Xi (no gene was assigned), and class 4 genes with low 5mC on both Xa and Xi (2 genes; Dataset EV14). Hierarchical clustering was performed using heatmap.2 in R (gplot 3.1.1) for expression levels from Xa and Xi alleles for visualization (Fig 8C).
Average percent Xa expression levels were calculated as .
Statistical analysis
All statistical analyses were performed using R software (v4.0.5 or v. 4.1.1). The Kruskal–Wallis test in Fig 2F was performed using the “kruskal.test” function. Welch's t‐tests in Figs 7F and 8D were performed using the “t.test” function with the “var.equal = F” option.
Author contributions
Mitinori Saitou: Conceptualization; resources; formal analysis; supervision; funding acquisition; investigation; methodology; writing – original draft; project administration; writing – review and editing. Sayuri Gyobu‐Motani: Conceptualization; data curation; formal analysis; funding acquisition; validation; investigation; visualization; methodology; writing – original draft; project administration; writing – review and editing. Yukihiro Yabuta: Data curation; formal analysis; validation; investigation; visualization; methodology; writing – original draft; writing – review and editing. Ken Mizuta: Data curation; formal analysis; validation; investigation; visualization; methodology; writing – original draft; writing – review and editing. Yoshitaka Katou: Data curation; formal analysis; validation; investigation; visualization; methodology; writing – original draft; writing – review and editing. Ikuhiro Okamoto: Data curation; formal analysis; validation; investigation; visualization; methodology; writing – original draft; writing – review and editing. Masanori Kawasaki: Data curation; investigation. Ayaka Kitamura: Data curation; investigation. Tomoyuki Tsukiyama: Data curation; investigation. Chizuru Iwatani: Data curation; investigation. Hideaki Tsuchiya: Data curation; investigation. Taro Tsujimura: Data curation; investigation. Takuya Yamamoto: Data curation; investigation. Tomonori Nakamura: Data curation; supervision; investigation.
Disclosure and competing interests statement
The authors declare that they have no conflict of interest. MS is an EMBO Associate Member.
Supporting information
Appendix
Table EV1
Dataset EV1
Dataset EV2
Dataset EV3
Dataset EV4
Dataset EV5
Dataset EV6
Dataset EV7
Dataset EV8
Dataset EV9
Dataset EV10
Dataset EV11
Dataset EV12
Dataset EV13
Dataset EV14
Dataset EV15
Dataset EV16
Dataset EV17
Dataset EV18
Source Data for Figure 1
Source Data for Figure 2
Source Data for Figure 3
Acknowledgements
We thank the members of our laboratory for their helpful input on this study, and Y. Nagai, N. Konishi, E. Tsutsumi, and M. Kawasaki of the Saitou Laboratory for their technical assistance. We are grateful to the animal care staff at the Research Center, Shiga University of Medical Science for their assistance with the animals, and to Single‐Cell Genome Information Analysis Core (SignAC) in ASHBi for the RNA/EM/long‐read sequence analyses. This work was supported by grants‐in‐aid for JSPS Fellows from JSPS (19K16013, 22K15380) to SG‐M, and grants‐in‐aid for Specially Promoted Research from JSPS (17H06098, 22H04920), a JST‐ERATO Grant (JPMJER1104), a grant from HFSP (RGP0057/2018), and grants from the Pythias Fund and Open Philanthropy Project (2018‐193685) to MS.
The EMBO Journal (2023) 42: e112962
Data availability
The accession numbers for the data in this study are as follows: the EM‐seq, 10X scRNA‐seq, full‐length RNA‐seq, and bulk 3′ RNA‐seq datasets: GSE216206 (the GEO database, https://www.ncbi.nlm.nih.gov/geo/query/acc.cgi?acc=GSE216206); the whole‐genome sequence datasets: DRA014996 (the DDBJ database, https://ddbj.nig.ac.jp/resource/sra‐submission/DRA014996); and ONT whole‐genome sequencing: JGAS000573 (NBDC human database, https://ddbj.nig.ac.jp/resource/jga‐study/JGAS000573). The R and Python code to reproduce the analyses and figures are available on request. Information on all mapping data is available in Dataset EV1.
References
- Bar S, Seaton LR, Weissbein U, Eldar‐Geva T, Benvenisty N (2019) Global characterization of X chromosome inactivation in human pluripotent stem cells. Cell Rep 27: 20–29 [DOI] [PubMed] [Google Scholar]
- Bergen V, Lange M, Peidli S, Wolf FA, Theis FJ (2020) Generalizing RNA velocity to transient cell states through dynamical modeling. Nat Biotechnol 38: 1408–1414 [DOI] [PubMed] [Google Scholar]
- Brockdorff N, Ashworth A, Kay GF, McCabe VM, Norris DP, Cooper PJ, Swift S, Rastan S (1992) The product of the mouse Xist gene is a 15 kb inactive X‐specific transcript containing no conserved ORF and located in the nucleus. Cell 71: 515–526 [DOI] [PubMed] [Google Scholar]
- Brown MS, Bishop DK (2014) DNA strand exchange and RecA homologs in meiosis. Cold Spring Harb Perspect Biol 7: a016659 [DOI] [PMC free article] [PubMed] [Google Scholar]
- Brown CJ, Hendrich BD, Rupert JL, Lafreniere RG, Xing Y, Lawrence J, Willard HF (1992) The human XIST gene: analysis of a 17 kb inactive X‐specific RNA that contains conserved repeats and is highly localized within the nucleus. Cell 71: 527–542 [DOI] [PubMed] [Google Scholar]
- Chitiashvili T, Dror I, Kim R, Hsu FM, Chaudhari R, Pandolfi E, Chen D, Liebscher S, Schenke‐Layland K, Plath K et al (2020) Female human primordial germ cells display X‐chromosome dosage compensation despite the absence of X‐inactivation. Nat Cell Biol 22: 1436–1446 [DOI] [PMC free article] [PubMed] [Google Scholar]
- Cloutier M, Kumar S, Buttigieg E, Keller L, Lee B, Williams A, Mojica‐Perez S, Erliandri I, Rocha AMD, Cadigan K et al (2022) Preventing erosion of X‐chromosome inactivation in human embryonic stem cells. Nat Commun 13: 2516 [DOI] [PMC free article] [PubMed] [Google Scholar]
- Cong L, Ran FA, Cox D, Lin S, Barretto R, Habib N, Hsu PD, Wu X, Jiang W, Marraffini LA et al (2013) Multiplex genome engineering using CRISPR/Cas systems. Science 339: 819–823 [DOI] [PMC free article] [PubMed] [Google Scholar]
- Court F, Tayama C, Romanelli V, Martin‐Trujillo A, Iglesias‐Platas I, Okamura K, Sugahara N, Simon C, Moore H, Harness JV et al (2014) Genome‐wide parent‐of‐origin DNA methylation analysis reveals the intricacies of human imprinting and suggests a germline methylation‐independent mechanism of establishment. Genome Res 24: 554–569 [DOI] [PMC free article] [PubMed] [Google Scholar]
- Deng X, Berletch JB, Nguyen DK, Disteche CM (2014) X chromosome regulation: diverse patterns in development, tissues and disease. Nat Rev Genet 15: 367–378 [DOI] [PMC free article] [PubMed] [Google Scholar]
- Fukuda A, Hazelbaker DZ, Motosugi N, Hao J, Limone F, Beccard A, Mazzucato P, Messana A, Okada C, San Juan IG et al (2021) De novo DNA methyltransferases DNMT3A and DNMT3B are essential for XIST silencing for erosion of dosage compensation in pluripotent stem cells. Stem Cell Reports 16: 2138–2148 [DOI] [PMC free article] [PubMed] [Google Scholar]
- Guo F, Yan L, Guo H, Li L, Hu B, Zhao Y, Yong J, Hu Y, Wang X, Wei Y et al (2015) The transcriptome and DNA Methylome landscapes of human primordial germ cells. Cell 161: 1437–1452 [DOI] [PubMed] [Google Scholar]
- Guo J, Sosa E, Chitiashvili T, Nie X, Rojas EJ, Oliver E, DonorConnect PK, Hotaling JM, Stukenborg JB et al (2021) Single‐cell analysis of the developing human testis reveals somatic niche cell specification and fetal germline stem cell establishment. Cell Stem Cell 28: 764–778 [DOI] [PMC free article] [PubMed] [Google Scholar]
- Hayashi K, Ogushi S, Kurimoto K, Shimamoto S, Ohta H, Saitou M (2012) Offspring from oocytes derived from in vitro primordial germ cell‐like cells in mice. Science 338: 971–975 [DOI] [PubMed] [Google Scholar]
- Hellman A, Chess A (2007) Gene body‐specific methylation on the active X chromosome. Science 315: 1141–1143 [DOI] [PubMed] [Google Scholar]
- Hikabe O, Hamazaki N, Nagamatsu G, Obata Y, Hirao Y, Hamada N, Shimamoto S, Imamura T, Nakashima K, Saitou M et al (2016) Reconstitution in vitro of the entire cycle of the mouse female germ line. Nature 539: 299–303 [DOI] [PubMed] [Google Scholar]
- Hill PWS, Leitch HG, Requena CE, Sun Z, Amouroux R, Roman‐Trufero M, Borkowska M, Terragni J, Vaisvila R, Linnett S et al (2018) Epigenetic reprogramming enables the transition from primordial germ cell to gonocyte. Nature 555: 392–396 [DOI] [PMC free article] [PubMed] [Google Scholar]
- Hinch AG, Becker PW, Li T, Moralli D, Zhang G, Bycroft C, Green C, Keeney S, Shi Q, Davies B et al (2020) The configuration of RPA, RAD51, and DMC1 binding in meiosis reveals the nature of critical recombination intermediates. Mol Cell 79: 689–701 [DOI] [PMC free article] [PubMed] [Google Scholar]
- Huang DW, Sherman BT, Lempicki RA (2009) Systematic and integrative analysis of large gene lists using DAVID bioinformatics resources. Nat Protoc 4: 44–57 [DOI] [PubMed] [Google Scholar]
- Hwang YS, Suzuki S, Seita Y, Ito J, Sakata Y, Aso H, Sato K, Hermann BP, Sasaki K (2020) Reconstitution of prospermatogonial specification in vitro from human induced pluripotent stem cells. Nat Commun 11: 5656 [DOI] [PMC free article] [PubMed] [Google Scholar]
- Illingworth RS, Gruenewald‐Schneider U, Webb S, Kerr AR, James KD, Turner DJ, Smith C, Harrison DJ, Andrews R, Bird AP (2010) Orphan CpG islands identify numerous conserved promoters in the mammalian genome. PLoS Genet 6: e1001134 [DOI] [PMC free article] [PubMed] [Google Scholar]
- Imoto Y, Nakamura T, Escolar EG, Yoshiwaki M, Kojima Y, Yabuta Y, Katou Y, Yamamoto T, Hiraoka Y, Saitou M (2022) Resolution of the curse of dimensionality in single‐cell RNA sequencing data analysis. Life Sci Alliance 5: e202201591 [DOI] [PMC free article] [PubMed] [Google Scholar]
- Irie N, Weinberger L, Tang WW, Kobayashi T, Viukov S, Manor YS, Dietmann S, Hanna JH, Surani MA (2015) SOX17 is a critical specifier of human primordial germ cell fate. Cell 160: 253–268 [DOI] [PMC free article] [PubMed] [Google Scholar]
- Ishikura Y, Yabuta Y, Ohta H, Hayashi K, Nakamura T, Okamoto I, Yamamoto T, Kurimoto K, Shirane K, Sasaki H et al (2016) In vitro derivation and propagation of Spermatogonial stem cell activity from mouse pluripotent stem cells. Cell Rep 17: 2789–2804 [DOI] [PubMed] [Google Scholar]
- Jain M, Koren S, Miga KH, Quick J, Rand AC, Sasani TA, Tyson JR, Beggs AD, Dilthey AT, Fiddes IT et al (2018) Nanopore sequencing and assembly of a human genome with ultra‐long reads. Nat Biotechnol 36: 338–345 [DOI] [PMC free article] [PubMed] [Google Scholar]
- Kojima Y, Yamashiro C, Murase Y, Yabuta Y, Okamoto I, Iwatani C, Tsuchiya H, Nakaya M, Tsukiyama T, Nakamura T et al (2021) GATA transcription factors, SOX17 and TFAP2C, drive the human germ‐cell specification program. Life Sci Alliance 4: e202000974 [DOI] [PMC free article] [PubMed] [Google Scholar]
- La Manno G, Soldatov R, Zeisel A, Braun E, Hochgerner H, Petukhov V, Lidschreiber K, Kastriti ME, Lonnerberg P, Furlan A et al (2018) RNA velocity of single cells. Nature 560: 494–498 [DOI] [PMC free article] [PubMed] [Google Scholar]
- Larsson AJM, Coucoravas C, Sandberg R, Reinius B (2019) X‐chromosome upregulation is driven by increased burst frequency. Nat Struct Mol Biol 26: 963–969 [DOI] [PubMed] [Google Scholar]
- Li L, Dong J, Yan L, Yong J, Liu X, Hu Y, Fan X, Wu X, Guo H, Wang X et al (2017) Single‐cell RNA‐Seq analysis maps development of human germline cells and gonadal niche interactions. Cell Stem Cell 20: 858–873 [DOI] [PubMed] [Google Scholar]
- Liao J, Karnik R, Gu H, Ziller MJ, Clement K, Tsankov AM, Akopian V, Gifford CA, Donaghey J, Galonska C et al (2015) Targeted disruption of DNMT1, DNMT3A and DNMT3B in human embryonic stem cells. Nat Genet 47: 469–478 [DOI] [PMC free article] [PubMed] [Google Scholar]
- Lyon MF (1961) Gene action in the X‐chromosome of the mouse (Mus musculus L.). Nature 190: 372–373 [DOI] [PubMed] [Google Scholar]
- Mekhoubad S, Bock C, de Boer AS, Kiskinis E, Meissner A, Eggan K (2012) Erosion of dosage compensation impacts human iPSC disease modeling. Cell Stem Cell 10: 595–609 [DOI] [PMC free article] [PubMed] [Google Scholar]
- Miga KH, Koren S, Rhie A, Vollger MR, Gershman A, Bzikadze A, Brooks S, Howe E, Porubsky D, Logsdon GA et al (2020) Telomere‐to‐telomere assembly of a complete human X chromosome. Nature 585: 79–84 [DOI] [PMC free article] [PubMed] [Google Scholar]
- Milosavljevic A, Harris RA, Sodergren EJ, Jackson AR, Kalafus KJ, Hodgson A, Cree A, Dai W, Csuros M, Zhu B et al (2005) Pooled genomic indexing of rhesus macaque. Genome Res 15: 292–301 [DOI] [PMC free article] [PubMed] [Google Scholar]
- Mizuta K, Katou Y, Nakakita B, Kishine A, Nosaka Y, Saito S, Iwatani C, Tsuchiya H, Kawamoto I, Nakaya M et al (2022) Ex vivo reconstitution of fetal oocyte development in humans and cynomolgus monkeys. EMBO J 41: e110815 [DOI] [PMC free article] [PubMed] [Google Scholar]
- Monk M, McLaren A (1981) X‐chromosome activity in foetal germ cells of the mouse. J Embryol Exp Morphol 63: 75–84 [PubMed] [Google Scholar]
- Murase Y, Yabuta Y, Ohta H, Yamashiro C, Nakamura T, Yamamoto T, Saitou M (2020) Long‐term expansion with germline potential of human primordial germ cell‐like cells in vitro. EMBO J 39: e104929 [DOI] [PMC free article] [PubMed] [Google Scholar]
- Nakamura T, Yabuta Y, Okamoto I, Aramaki S, Yokobayashi S, Kurimoto K, Sekiguchi K, Nakagawa M, Yamamoto T, Saitou M (2015) SC3‐seq: a method for highly parallel and quantitative measurement of single‐cell gene expression. Nucleic Acids Res 43: e60 [DOI] [PMC free article] [PubMed] [Google Scholar]
- Nakamura T, Fujiwara K, Saitou M, Tsukiyama T (2021) Non‐human primates as a model for human development. Stem Cell Reports 16: 1093–1103 [DOI] [PMC free article] [PubMed] [Google Scholar]
- Nazor KL, Altun G, Lynch C, Tran H, Harness JV, Slavin I, Garitaonandia I, Muller FJ, Wang YC, Boscolo FS et al (2012) Recurrent variations in DNA methylation in human pluripotent stem cells and their differentiated derivatives. Cell Stem Cell 10: 620–634 [DOI] [PMC free article] [PubMed] [Google Scholar]
- Ohno S (1967) Sex chromosomes and sex‐linked genes. Berlin: Springer‐Verlag; [Google Scholar]
- Okamoto I (2018) Combined immunofluorescence, RNA FISH, and DNA FISH in preimplantation mouse embryos. Methods Mol Biol 1861: 149–159 [DOI] [PubMed] [Google Scholar]
- Okamoto I, Otte AP, Allis CD, Reinberg D, Heard E (2004) Epigenetic dynamics of imprinted X inactivation during early mouse development. Science 303: 644–649 [DOI] [PubMed] [Google Scholar]
- Okamoto I, Patrat C, Thepot D, Peynot N, Fauque P, Daniel N, Diabangouaya P, Wolf JP, Renard JP, Duranthon V et al (2011) Eutherian mammals use diverse strategies to initiate X‐chromosome inactivation during development. Nature 472: 370–374 [DOI] [PubMed] [Google Scholar]
- Okamoto I, Nakamura T, Sasaki K, Yabuta Y, Iwatani C, Tsuchiya H, Nakamura SI, Ema M, Yamamoto T, Saitou M (2021) The X chromosome dosage compensation program during the development of cynomolgus monkeys. Science 374: eabd8887 [DOI] [PubMed] [Google Scholar]
- Patel S, Bonora G, Sahakyan A, Kim R, Chronis C, Langerman J, Fitz‐Gibbon S, Rubbi L, Skelton RJP, Ardehali R et al (2017) Human embryonic stem cells do not change their X inactivation status during differentiation. Cell Rep 18: 54–67 [DOI] [PMC free article] [PubMed] [Google Scholar]
- Ramsahoye BH, Biniszkiewicz D, Lyko F, Clark V, Bird AP, Jaenisch R (2000) Non‐CpG methylation is prevalent in embryonic stem cells and may be mediated by DNA methyltransferase 3a. Proc Natl Acad Sci U S A 97: 5237–5242 [DOI] [PMC free article] [PubMed] [Google Scholar]
- Sahakyan A, Kim R, Chronis C, Sabri S, Bonora G, Theunissen TW, Kuoy E, Langerman J, Clark AT, Jaenisch R et al (2017) Human naive pluripotent stem cells model X chromosome dampening and X inactivation. Cell Stem Cell 20: 87–101 [DOI] [PMC free article] [PubMed] [Google Scholar]
- Saitou M, Hayashi K (2021) Mammalian in vitro gametogenesis. Science 374: eaaz6830 [DOI] [PubMed] [Google Scholar]
- Sakai Y, Nakamura T, Okamoto I, Gyobu‐Motani S, Ohta H, Yabuta Y, Tsukiyama T, Iwatani C, Tsuchiya H, Ema M et al (2019) Induction of the germ‐cell fate from pluripotent stem cells in cynomolgus monkeys. Biol Reprod 102: 620–638 [DOI] [PubMed] [Google Scholar]
- Sakuma T, Hosoi S, Woltjen K, Suzuki K, Kashiwagi K, Wada H, Ochiai H, Miyamoto T, Kawai N, Sasakura Y et al (2013) Efficient TALEN construction and evaluation methods for human cell and animal applications. Genes Cells 18: 315–326 [DOI] [PubMed] [Google Scholar]
- Sangrithi MN, Royo H, Mahadevaiah SK, Ojarikre O, Bhaw L, Sesay A, Peters AH, Stadler M, Turner JM (2017) Non‐canonical and sexually dimorphic X dosage compensation states in the mouse and human germline. Dev Cell 40: 289–301 [DOI] [PMC free article] [PubMed] [Google Scholar]
- Sasaki K, Yokobayashi S, Nakamura T, Okamoto I, Yabuta Y, Kurimoto K, Ohta H, Moritoki Y, Iwatani C, Tsuchiya H et al (2015) Robust In vitro induction of human germ cell fate from pluripotent stem cells. Cell Stem Cell 17: 178–194 [DOI] [PubMed] [Google Scholar]
- Satija R, Farrell JA, Gennert D, Schier AF, Regev A (2015) Spatial reconstruction of single‐cell gene expression data. Nat Biotechnol 33: 495–502 [DOI] [PMC free article] [PubMed] [Google Scholar]
- Sugimoto M, Abe K (2007) X chromosome reactivation initiates in nascent primordial germ cells in mice. PLoS Genet 3: e116 [DOI] [PMC free article] [PubMed] [Google Scholar]
- Tahiliani M, Koh KP, Shen Y, Pastor WA, Bandukwala H, Brudno Y, Agarwal S, Iyer LM, Liu DR, Aravind L et al (2009) Conversion of 5‐methylcytosine to 5‐hydroxymethylcytosine in mammalian DNA by MLL partner TET1. Science 324: 930–935 [DOI] [PMC free article] [PubMed] [Google Scholar]
- Tam PP, Zhou SX, Tan SS (1994) X‐chromosome activity of the mouse primordial germ cells revealed by the expression of an X‐linked lacZ transgene. Development 120: 2925–2932 [DOI] [PubMed] [Google Scholar]
- Tang WW, Dietmann S, Irie N, Leitch HG, Floros VI, Bradshaw CR, Hackett JA, Chinnery PF, Surani MA (2015) A unique gene regulatory network resets the human germline epigenome for development. Cell 161: 1453–1467 [DOI] [PMC free article] [PubMed] [Google Scholar]
- Tirosh I, Izar B, Prakadan SM, Wadsworth MH 2nd, Treacy D, Trombetta JJ, Rotem A, Rodman C, Lian C, Murphy G et al (2016) Dissecting the multicellular ecosystem of metastatic melanoma by single‐cell RNA‐seq. Science 352: 189–196 [DOI] [PMC free article] [PubMed] [Google Scholar]
- Vaisvila R, Ponnaluri VKC, Sun Z, Langhorst BW, Saleh L, Guan S, Dai N, Campbell MA, Sexton BS, Marks K et al (2021) Enzymatic methyl sequencing detects DNA methylation at single‐base resolution from picograms of DNA. Genome Res 31: 1280–1289 [DOI] [PMC free article] [PubMed] [Google Scholar]
- Vallot C, Ouimette JF, Makhlouf M, Feraud O, Pontis J, Come J, Martinat C, Bennaceur‐Griscelli A, Lalande M, Rougeulle C (2015) Erosion of X chromosome inactivation in human pluripotent cells initiates with XACT coating and depends on a specific heterochromatin landscape. Cell Stem Cell 16: 533–546 [DOI] [PubMed] [Google Scholar]
- Vertesy A, Arindrarto W, Roost MS, Reinius B, Torrens‐Juaneda V, Bialecka M, Moustakas I, Ariyurek Y, Kuijk E, Mei H et al (2018) Parental haplotype‐specific single‐cell transcriptomics reveal incomplete epigenetic reprogramming in human female germ cells. Nat Commun 9: 1873 [DOI] [PMC free article] [PubMed] [Google Scholar]
- Wolock SL, Lopez R, Klein AM (2019) Scrublet: computational identification of cell doublets in single‐cell transcriptomic data. Cell Syst 8: 281–291 [DOI] [PMC free article] [PubMed] [Google Scholar]
- Wu H, Zhang Y (2014) Reversing DNA methylation: mechanisms, genomics, and biological functions. Cell 156: 45–68 [DOI] [PMC free article] [PubMed] [Google Scholar]
- Yamasaki J, Iwatani C, Tsuchiya H, Okahara J, Sankai T, Torii R (2011) Vitrification and transfer of cynomolgus monkey (Macaca fascicularis) embryos fertilized by intracytoplasmic sperm injection. Theriogenology 76: 33–38 [DOI] [PubMed] [Google Scholar]
- Yamashiro C, Sasaki K, Yabuta Y, Kojima Y, Nakamura T, Okamoto I, Yokobayashi S, Murase Y, Ishikura Y, Shirane K et al (2018) Generation of human oogonia from induced pluripotent stem cells in vitro . Science 362: 356–360 [DOI] [PubMed] [Google Scholar]
- Yamashiro C, Sasaki K, Yokobayashi S, Kojima Y, Saitou M (2020) Generation of human oogonia from induced pluripotent stem cells in culture. Nat Protoc 15: 1560–1583 [DOI] [PubMed] [Google Scholar]
- Yokobayashi S, Okita K, Nakagawa M, Nakamura T, Yabuta Y, Yamamoto T, Saitou M (2017) Clonal variation of human induced pluripotent stem cells for induction into the germ cell fate. Biol Reprod 96: 1154–1166 [DOI] [PubMed] [Google Scholar]
- Yokobayashi S, Yabuta Y, Nakagawa M, Okita K, Hu B, Murase Y, Nakamura T, Bourque G, Majewski J, Yamamoto T et al (2021) Inherent genomic properties underlie the epigenomic heterogeneity of human induced pluripotent stem cells. Cell Rep 37: 109909 [DOI] [PubMed] [Google Scholar]
- Zylicz JJ, Heard E (2020) Molecular mechanisms of facultative heterochromatin formation: an X‐chromosome perspective. Annu Rev Biochem 89: 255–282 [DOI] [PubMed] [Google Scholar]