Abstract
Introduction
Deuterium metabolic imaging (DMI) and quantitative exchange label turnover (QELT) are novel MR spectroscopy techniques for non-invasive imaging of human brain glucose and neurotransmitter metabolism with high clinical potential. Following oral or intravenous administration of non-ionizing [6,6’-2H2]-glucose, its uptake and synthesis of downstream metabolites can be mapped via direct or indirect detection of deuterium resonances using 2H MRSI (DMI) and 1H MRSI (QELT), respectively.
The purpose of this study was to compare the dynamics of spatially resolved brain glucose metabolism, i.e., estimated concentration enrichment of deuterium labeled Glx (glutamate+glutamine) and Glc (glucose) acquired repeatedly in the same cohort of subjects using DMI at 7T and QELT at clinical 3T.
Methods
Five volunteers (4m/1f) were scanned in repeated sessions for 60 min after overnight fasting and 0.8g/kg oral [6,6’-2H2]-glucose administration using time-resolved 3D 2H FID-MRSI with elliptical phase encoding at 7T and 3D 1H FID-MRSI with a non-Cartesian concentric ring trajectory readout at clinical 3T.
Results
One hour after oral tracer administration regionally averaged deuterium labeled Glx4 concentrations and the dynamics were not significantly different over all participants between 7T 2H DMI and 3T 1H QELT data for GM (1.29±0.15 vs. 1.38±0.26 mM, p=0.65 & 21±3 vs. 26±3 μM/min, p=0.22) and WM (1.10±0.13 vs. 0.91±0.24 mM, p=0.34 & 19±2 vs. 17±3 μM/min, p=0.48). Also, the observed time constants of dynamic Glc6 data in GM (24±14 vs. 19±7 min, p=0.65) and WM (28±19 vs. 18±9 min, p=0.43) dominated regions showed no significant differences.
Between individual 2H and 1H data points a weak to moderate negative correlation was observed for Glx4 concentrations in GM (r=−0.52, p<0.001), and WM (r=−0.3, p<0.001) dominated regions, while a strong negative correlation was observed for Glc6 data GM (r=−61, p<0.001) and WM (r=−0.70, p<0.001).
Conclusion
This study demonstrates that indirect detection of deuterium labeled compounds using 1H QELT MRSI at widely available clinical 3T without additional hardware is able to reproduce absolute concentration estimates of downstream glucose metabolites and the dynamics of glucose uptake compared to 2H DMI data acquired at 7T. This suggests significant potential for widespread application in clinical settings especially in environments with limited access to ultra-high field scanners and dedicated RF hardware.
Keywords: Deuterium metabolic Imaging, Quantitative exchange label turnover, deuterium labeled glucose, clinical 3T, MR spectroscopy
Introduction
Glucose is the main energy source in the mammalian brain and its metabolism provides fuel for physiological brain function and cellular maintenance via adenosine triphosphate (ATP) synthesis. Moreover, oxidative glucose metabolism generates precursors required for neurotransmitter biosynthesis, e.g., glutamate (1, 2). Several common pathologies are characterized by alterations in brain glucose uptake compared to healthy tissue as a result of impaired glucose metabolism, e.g., Alzheimer’s disease (3), depression and schizophrenia (4), tissue ischemia and cancer (5).
[18F]-Fluorodeoxyglucose ([18F]-FDG) positron emission tomography (PET) is the current clinical gold standard to image tissue specific glucose uptake. However, it does not provide information about downstream metabolites, e.g., oxidative neurotransmitter synthesis of glutamate or glycolytic lactate production due to glucose trapping of the tracer and is an invasive technique, since FDG is radioactive (6, 7).
Deuterium metabolic imaging (DMI) is as novel technique for the non-invasive mapping of brain glucose metabolism using time resolved 2H Magnetic Resonance Spectroscopic Imaging (MRSI) after oral or intravenous administration of harmless and safe deuterium labeled glucose ([6,6’]-2H-Glc) as tracer (8, 9). A simultaneous detection of glucose uptake and downstream metabolic products, such as glutamate, glutamine and lactate provide complementary information and allows for separating oxidative from non-oxidative metabolic pathways during glucose metabolism (10, 11). However, modifications of the MR scanner configuration and external frequency sources may be required to facilitate 2H DMI as transmission and reception of 2H Larmor frequency is not widely supported by all MR vendors and additional dedicated RF equipment is needed (12-14). Furthermore, the majority of human DMI applications was performed at ultra-high magnetic field strengths (≥4T).
Recently quantitative exchange label turnover (QELT) has been introduced, which indirectly detects accumulation of deuterium labeled metabolites using conventional time resolved 1H MRS/MRSI at ultra-high magnetic field strength (≥7T) (15-18) and clinical 3T (19). Due to an exchange of deuterium labeled and unlabeled molecules, a signal decrease of the resonance of the respective metabolite can be detected in conventional 1H MR spectra, similarly as performed using 13C labeled glucose (20, 21). In contrast to DMI, no additional hardware is required, such as dual-tuned dedicated RF coils or modifications of the MR scanner itself. Additionally, an extended neurochemical profile is quantified as QELT simultaneously detects other resonances present in 1H MR spectra, which are not involved in glucose metabolism.
The aim of the study was to assess the reproducibility of the QELT method compared to the more common DMI approach for monitoring the dynamics of spatially resolved glucose uptake and oxidative Glx synthesis. Both direct (2H DMI) and indirect (1H QELT) deuterium detection methods were employed to acquire time-resolved 3D data from the same cohort of participants, repeatedly, at 7T and clinical 3T, respectively. The concentration estimates were quantified using internal referencing to evaluate and compare the performance of both methods.
Methods
Study protocol
Approved by the local ethics committee of the Medical University of Vienna, this study included two separate MRI protocols, i.e., time-resolved deuterium metabolic imaging (DMI) and quantitative exchange label turnover (QELT) conducted on separate days, 1-3 months apart, on an experimental 7T and clinical 3T MR systems, respectively. Before, during and after the initial DMI protocol, capillary puncture blood sampling was performed every 15 min over the course of 1.5 hours from the toe (accessible sampling site without moving the volunteer out of the MR scanner) using two identical standard strip glucometers (Verio, OneTouch) for cross checking.
Volunteers
Five lean volunteers without history of neurological, psychiatric or metabolic diseases (4 male/ 1 female, BMI: 22±1 kg/m2, age: 33±5 years) were recruited and gave written informed consent to participate in this study. For both DMI and QELT MRI protocols, volunteers were scanned after overnight fasting and immediately after oral tracer administration using 0.8 g/kg body weight deuterium-labeled glucose ([6,6’]-2H-Glc ≥99% purity, Cambridge Isotopes) dissolved in 200 ml water. The tracer was consumed within one minute, immediately before volunteers were moved inside the scanner bore.
7T 2H DMI protocol
2H DMI data acquisition was supported by the vendor, without any modification of the scanner hardware. Data were acquired on a Siemens 7T (dot Plus) whole body MR system using a 1 channel transmit/ 32 channel receive 1H head coil (Nova Medical, Wilmington, MA, USA) and a dual-tuned (2H/1H) quadrature transmit-receiver birdcage coil (Stark Contrast MRI Coils Research, Germany) to acquire anatomical high-resolution 1H MR images and 3D 2H MR spectroscopic images, respectively. The DMI protocol includes initial preparation scans, i.e., unlocalized pulse-acquire B1 mapping (TR=1500 ms, TE=0.35 ms, 20 steps, URef=20-440 V) to estimate the required reference voltage followed by 10 consecutive 3D FID MRSI scans using elliptical phase encoding with the following parameters: FOV: 200x200x175 mm3, matrix size: 16x16x14, nominal voxel volume: 1.95 ml, 2 averages, TR=290 ms, TE=1.5 ms, TA=6:37 min, BW=500 Hz, 128 samples, flip angle: 86° (for additional sequence details see Supplementary Table 1). After each 3D MRSI dataset, the frequency was updated to account for potential frequency drifts. High resolution T1-weighted 3D MP2RAGE images were acquired using both dual-tuned (2H/1H) birdcage head coil and 32 channel receiver head coils after the subject was repositioned using the following parameters: 1.1mm3 isotropic nominal voxel volume, FOV: 165x220x220 mm3, grid size: 144x192x192, TR=3930 ms, TI1=850 ms, TI2=3400 ms TE=3.28 ms, 3-fold GRAPPA accelerated and TA=4:29 min (using 32 channel head coil). Following co-registration of both 3D images, the latter were then used for tissue segmentation.
3T 1H QELT protocol
1H QELT data were acquired on a clinical routine Siemens 3T MR system (Prisma-Fit) using a 64-channel receiver head coil (Siemens Healthineers, Erlangen, Germany). The QELT protocol included an initial automated alignment localizer and EPI reference scans to set up the volumetric navigator sequence used for real-time motion correction (22). Following sequence preparation, 14 consecutive 3D 1H MRSI datasets were acquired over the course of ~60 min using a previously developed 3D 1H FID MRSI sequence with slice-selective excitation and a fast concentric ring trajectory readout including automatic interleaved real-time motion-, shim- and frequency drift correction (23, 24). The following parameters were applied (19): 0.24 ml isotropic nominal voxel volume, FOV: 200x200x130 mm3, VOI: 200x200x55 mm3, grid size: 32x32x21, centered around the posterior cingulate region, TE=0.8 ms, TR = 950 ms and TA=4:13 min (details see supplemental material table S2 for minimum reporting standards (25)). Within each TR unsuppressed water reference signals (20 FID points) were acquired using identical readout trajectories to approximate the coil sensitivity for each channel followed by a conventional WET water suppression scheme (26). Following the QELT MRSI scan a high resolution T1 weighted 3D MPRAGE scan was performed for anatomical imaging and tissue segmentation with the following parameters: 1mm3 isotropic nominal voxel volume, FOV: 208x250x250 mm3, grid size: 208x256x256, TR=1800 ms, TI=900 ms, TE=2.27 ms, 3-fold GRAPPA accelerated and TA=2:38 min.
Data Reconstruction
All data were reconstructed offline using a custom-built automated software pipeline (MATLAB R2021, bash, Python3.10).
The Cartesian phase-encoded 2H DMI MRSI data were Hamming filtered in all three spatial dimensions followed by a three dimensional Fourier transform.
For 1H QELT 3D MRSI data acquired using non-cartesian concentric ring trajectories the pipeline included in-plane convolutional re-gridding of the k-space (27), noise-decorrelation, channel-wise lipid decontamination (28) and coil combination (29) using weights determined by water unsuppressed pre-scans from each TR.
Spectral Fitting/Metabolite Quantification
Spectral fitting was performed voxel-wise in the frequency domain using LCModel (v6.3) (30). Quantification results with Cramer-Rao Lower Bounds (CRLB) >20% were excluded from further analysis. For 1H: Glc6 and 2H: Glx4 and Glc6 results a CRLB threshold of 50% was used. No CRLB threshold was used for the first 3 time points of 2H fit results (first 20 min). Spectral fitting of 2H DMI MRSI data used a custom-built basis set including simulated (31, 32) 2H resonances of water, glucose (Glc) and combined Glx.
For spectral quantification of 1H QELT MRSI data a modified basis set was used featuring 17 neurochemical metabolites (i.e., creatine, phosphocreatine, myo-inositol, N-acetylaspartate, N-acetylaspartylglutamate, glutathione, glycerophosphocholine, phosphocholine, aspartate, glucose-alpha, glucose-beta, taurine, glutamate, glutamine, gamma-aminobutyric acid, lactate) and a measured macromolecular background (33). This work focuses only on few relevant metabolites, i.e., tCr, Glu4+Gln4 (Glx4), and Glc6.
Deuterium-labeled glucose ([6,6’]-2H-Glc) features deuterium atoms on the 6th carbon position and during metabolic utilization particular downstream metabolites incorporate deuterium at specific carbon positions only, e.g., oxidatively synthesized glutamate and glutamine labeling occurs at the 4th carbon position in the brain. Therefore, Glc and Glx peaks in respective 2H MR spectra represent Glc6 (3.8 ppm) and Glx4 (2.3 ppm) resonances. While deuterium labeled resonances do not directly contribute to signals visible in 1H MR spectra, increasing levels of labeled Glx and Glc molecules eventually lead to a respective signal decrease of Glc6 and Glx4 resonances in the 1H spectrum, due to an exchange with unlabeled molecules, indirectly reflecting deuterium enrichment. Other 1H resonances of the same molecule (Glc1-5, and Glx23) remain stable. Therefore, using 1H MRS to reliably detect the signal decrease of a single molecular resonance only, labeled (Glu4=2.34 ppm, Gln4=2.44 ppm, Glc6=3.88 ppm) and combined unlabeled parts (Glu23, Gln23, Glc1-5: including Glu2=3,75 ppm, Glu3=2.10 ppm, Gln2=3.77 ppm, Gln3=2.13ppm, Glc1=4.63 ppm, Glc2=3.23 ppm, Glc3=3.47 ppm, Glc4=3.38 ppm, Glc5=3.45 ppm) of the respective metabolites were separated in the basis set to be fitted individually. To take J-coupling effects into account Glu4, Gln4 and Glc6 resonances were created by simulating Glu23, Gln23 or Glc1-5 (fully deuterated state: both protons are exchanged with deuterons) and subtraction from regular Glu, Gln, or Glc signals.
Concentration estimation
For all time points of 7T DMI and 3T QELT data 3D metabolite maps were created. Glx4 (2H and 1H resonances) and Glc6 (2H resonance) concentrations were given in mM units, while Glc6 (1H resonance) maps were given as ratio to total creatine as to the best of our knowledge no relaxation times were reported for 1H glucose at 3T. Concentration estimates were calculated as presented in (34), using natural abundance deuterated 2H water (averaged over the first 3 time points) and 1H total creatine as internal reference, for 7T DMI and 3T QELT, respectively. Relaxation times and in vivo concentrations were assumed using literature values (9, 14, 35-37): ([2H: waterT1/T2=350 ms/30 ms, GlxT1/T2=150 ms/40 ms, GlcT1/T2=67 ms/42 ms, 2H water concentration: 17.2 mM] , [1H T1: tCrGM/WM= 1.46 s/1.24 s, GlxGM/WM= 1.27 s/1.24 s, T2: tCrGM/WM = 201 ms/198 ms, GlxGM/WM= 134 ms/148 ms], tCrGM = 7.5 mM, tCrWM= 5.7 mM). The number of deuterons and protons per molecule contributing to the detected resonance was accounted for. Details of the quantification are shown in Supplementary Figure 1. Glx4 concentrations were not corrected for 2H label loss in order to compare signal increase and decrease in mM units between 2H and 1H acquisition methods (38). Voxel-wise fractional water content of GM and WM was taken into account, by using automatic GM/WM/CSF segmentation on high resolution T1-weighted 3D images using the FAST algorithm (39), followed by down-sampling to MRSI grid-size using MINC tools (MINC tools, v2.0, McConnell Brain Imaging Center, Montreal, QC, Canada). For regional averaging over GM and WM, an 80% threshold was used to minimize partial volume effects.
Statistical Analysis
Pearson correlation analysis was performed between regionally averaged 7T DMI and 3T QELT metabolite concentration time courses (Glx4 and Glc6) and between concentrations and time. Rank transformation of non-parametric tests are not recommended for small samples sizes and there is no fundamental objection of using a regular t-test(40). Therefore, paired t-test was favored over non-parametric tests to estimate differences between groups with a statistical significance threshold of p<0.05. To correct for multiple testing p-values were adjusted using Benjamini and Hochberg method(41). Linear fitting over time was performed for Glx4 signals (2H and 1H) averaged over GM and WM, while Glc6 signals were fitted mono exponentially. Statistical tests were performed using Python 3.10 (www.python.org, packages: scipy.stats).
7T 2H DMI vs. 3T 1H QELT comparison
Comparison and statistical analysis between the dynamics of Glx4 and Glc6 over time acquired using 7T 2H DMI (increasing concentrations) and 3T 1H QELT (decreasing concentrations) were performed on unsigned individual results. As the time scale of data acquisition differs between 7T 2H DMI and 3T 1H QELT experiments (differences within few min), concentration estimates (2H: Glx4, Glc6 1H: Glx4) and ratios to tCr (1H Glc6) were time matched via linear (Glx4) and mono-exponential (Glc6) interpolation using individual time constants from each participant to perform correlation analysis.
Absolute Glx4 increase/drop (in mM) acquired using 7T 2H DMI/ 3T 1H QELT at the end of the experiment was compared between two close time points (60 and 62 min) and identical time points (using interpolation) and results were tested for significant differences.
Data availability statement
Data generated by postprocessing methods (i.e., metabolic maps, LCModel basis sets, script files for data handling) are available online at: (https://github.com/MRSI-HFMR-Group-Vienna/DMIvsQELT.git). Raw data files are too large to be shared publicly and are available from the corresponding author on reasonable request for research purposes only. Due to data protection policy 3D high resolution images are only available upon reasonable request from the corresponding author if approved by the requesting researcher’s local ethics committee.
Results
Study protocol
Initial preparation scans following oral tracer administration of deuterium labeled glucose were finished 7±2min for both 7T 2H DMI and 3T 1H QELT measurements.
7T 2H DMI
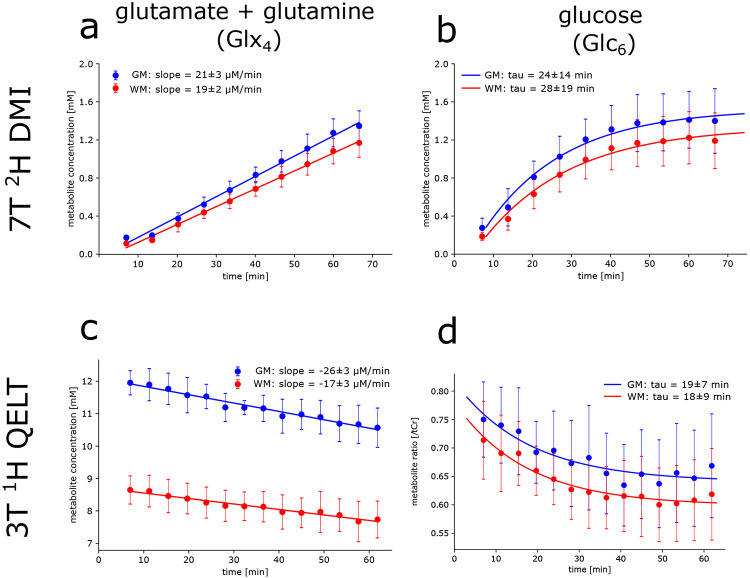
Strong positive correlation with time was observed for regionally averaged 2H Glx4 concentrations in GM (r=0.97, p<0.001) and WM (r=0.97, p<0.001) over all participants. After 67 min concentrations were significantly increasing to 1.36±0.16 mM (p=0.003) and 1.18±0.15 mM (p=0.002), in GM and WM, respectively. Slopes of the linear regression revealed a 14±3% faster signal (p=0.02) increase (steeper slopes) in GM (21±3 μM/min) compared to WM (19±2 μM/min) see Figure 1a.
Figure 1:
Time courses of 2H (top) and 1H (bottom) resonances from deuterium labeled (a,c) glutamate+glutamine (Glx4) and (b,d) glucose (Glc6) acquired using direct and indirect deuterium detection, i.e., 7T 2H DMI and 3T 1H QELT, respectively. Signal concentration estimates given in mM (a,b,c) and ratios to total creatine (d) were calculated voxel-wise and averaged over gray matter (GM, blue) and white matter (WM, red) dominated regions and over all participants. Concentration estimates and dynamics of increasing 2H Glx4 signals were not significantly different to decreasing 1H Glx4 acquired using DMI at 7T and QELT at clinical 3T, respectively in GM (1.29±0.15 vs. 1.38±0.26 mM, p=0.65 and 21±3 vs. 26±3 μM/min, p=0.22) and WM (red: 1.10±0.13 vs. 0.91±0.24 mM, p=0.34 and 19±2 vs. 17±3 μM/min, p=0.48). No significant differences were found between increasing 2H Glc6 and decreasing 1H Glc6 exponential time constants in GM (24±14 vs. 19±7 min, p=0.65) and WM (28±19 vs. 18±9 mM, p=0.43).
Similarly, strong positive correlation with time was observed for 2H Glc6 concentrations in GM (r=0.78, p<0.001) and WM (r=0.80, p<0.001), significantly increasing after 67 min to 1.42±0.34 mM (p=0.02) and 1.21±0.30 mM (p=0.02), respectively. Time constants of the exponential fit were not significantly different (p=0.129) between GM (24±14 min) and WM (28±19 min) see Figure 1b. Individual results of linear regression analysis for Glx4 concentrations and mono-exponential fitting for Glc6 concentrations are shown in Table 1 for all participants.
Table 1:
Individual concentration differences, slopes of the linear regression analysis and exponential time constants for 2H/1H Glx4 and Glc6 after 60 min (7T DMI) and 62 min (3T QELT).
| Metabolite | ΔCGM[mM]* | ΔCWM[mM]* | slopes GM [μM/min]* |
slopes WM [μM/min]* |
|---|---|---|---|---|
| Glx4 | ||||
| Participant 1 | +1.36/−0.99 | +1.20/−0.96 | +23.9/−21.8 | +21.0/−12.7 |
| Participant 2 | +1.43/−1.29 | +1.24/−0.68 | +24.1/−25.7 | +21.2/−17.4 |
| Participant 3 | +1.06/−1.72 | +0.92/−1.32 | +17.1/−30.7 | +15.1/−21.4 |
| Participant 4 | +1.17/−1.63 | +0.95/−0.93 | +18.7/−27.7 | +17.1/−17.7 |
| Participant 5 | +1.41/−1.30 | +1.17/−0.66 | +23.5/−23.0 | +19.9/−15.4 |
| ΔCGM[mM] | ΔCWM[mM]* | tau GM [min]* | tau WM [min]* | |
| Glc6 | ||||
| Participant 1 | +1.37/ − | +1.26/ − | 13.6/27.6 | 15.6/35.7 |
| Participant 2 | +1.8/ − | +1.56/ − | 23.7/8.4 | 25.7/11.8 |
| Participant 3 | +1.03/ − | +0.89/ − | 21.9/16.0 | 25.0/12.7 |
| Participant 4 | +1.72/ − | +1.52/ − | 49.1/20.3 | 63.6/16.1 |
| Participant 5 | +1.20/ − | +0.97/ − | 9.2/24.6 | 11.1/15.1 |
Notes. - ΔC … Concentration estimates in mM, GM … gray matter, WM … white matter, tau … exponential time constant, slopes … inclination of linear regression analysis
7T 2H DMI/3T 1H QELT
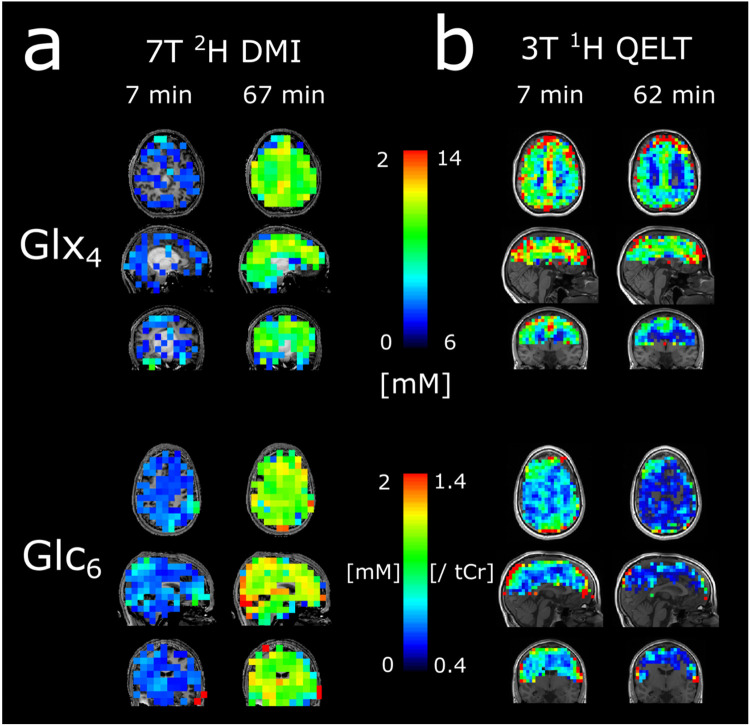
To directly visualize glucose uptake and downstream metabolite synthesis of Glx4 via increasing concentrations of 2H signals over time, 3D metabolic maps of 2H Glx4 and 2H Glc6 are shown from one representative participant for the first and last time point, i.e., 7 min and 67 min after oral administration of deuterium labeled glucose, see Figure 2a.
Figure 2:
Representative 3D (glutamate+glutamine) Glx4 and (glucose) Glc6 maps of 2H (a) and 1H (b) resonances acquired 7 min and 67/62 min after deuterium labeled glucose administration. The signal intensity increase/decrease of respective 2H and 1H resonances is clearly visible.
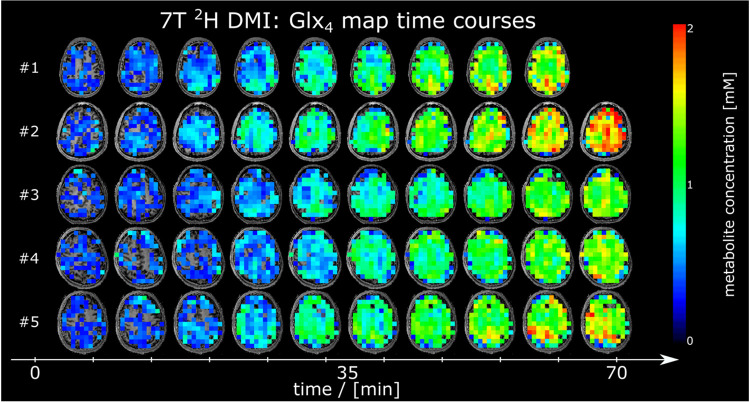
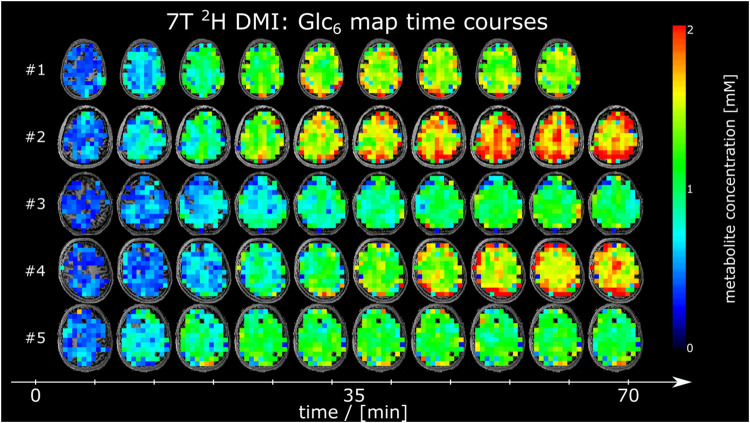
Time courses of 2H Glx4 and 2H Glc6 metabolic maps from a representative axial slice from all participants are shown in Figure 3 and Figure 4, respectively.
Figure 3:
Time courses of axial 2H glutamate+glutamine (Glx4) maps given in mM from all participants, detected using deuterium metabolic imaging (DMI) at 7T. No correction of 2H label loss was applied.
Figure 4:
Time courses of axial 2H glucose (Glc6) maps given in mM from all participants, acquired using deuterium metabolic imaging (DMI) at 7T.
No significant changes were found between regionally averaged deuterated 2H water signal (GM: p=0.99, WM: p=0.52) during the first 30 min after oral uptake of deuterated glucose. Averaged time courses of deuterated water acquired using 7T 2H DMI for GM and WM regions and over all participants are presented in Supplementary Figure 2.
Axial SNR maps from 2H water and Cramer-Rao Lower Bound maps from 2H Glx4, Glc6 and 2H water are shown from one representative participant for all time points in Supplementary Figure 3
Cramer-Rao Lower bound time courses from 7T 2H DMI metabolites averaged over GM+WM voxels and over all participants are shown in Supplementary Figure 5a.
The standardized quality criteria used for data exclusion was fulfilled by more than 78 % for 2H Glx4 and more than 94% for 2H Glc6 quantification results in GM and WM voxels.
3T 1H QELT
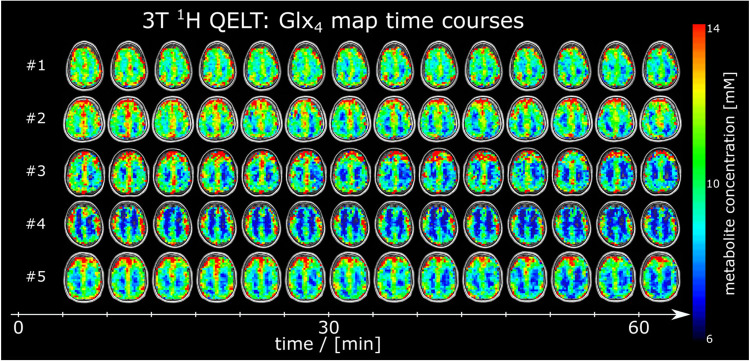
Moderate to strong negative correlation with time was observed for regionally averaged 1H Glx4 concentrations in GM (r=−0.67, p<0.001) and WM (r=−0.49, p<0.001) over all participants. 62 min after oral administration of deuterium labeled glucose, 1H Glx4 concentrations decreased by −1.38±0.26 mM (p<0.001) and −0.91±0.24 mM (p=0.003) compared to the initial time point (~7 min) in GM and WM, respectively. 54±10% faster signal (p<0.001) decrease (steeper slopes), representing faster Glx4 synthesis was observed in GM (−26±3 μM/min) compared to WM (−17±3 μM/min) see Figure 1c.
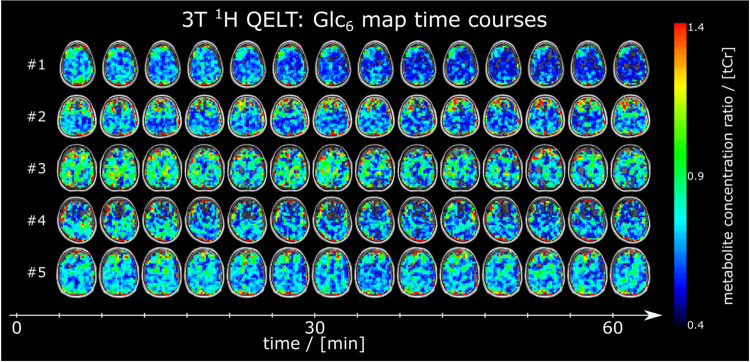
Weak to moderate negative correlation with time was observed for regionally averaged 1H Glc6/tCr ratios for GM (r=−0.36, p=0.002) and WM (r=−0.44, p<0.001) respectively, see Figure 1d. There was no significant difference (p=0.74) between exponential time constants of GM (19±7 min) and WM (18±9 min). Individual results of linear regression analysis of Glx4 concentrations and mono-exponential fitting for Glc6/tCr ratios are shown in Table 1 for all participants.
Figure 2b illustrates representative 3D metabolic maps of 1H Glx4 concentrations and 1H Glc6/tCr ratios from one participant for the first (~7 min) and last time point (~62 min) after tracer administration. Exchange between labeled and unlabeled molecules lead to decreasing amplitudes over time, indirectly representing uptake of 2H Glc6 and 2H Glx4 synthesis. Time courses of representative axial 1H Glx4 and 1H Glc6/tCr maps from all participants are shown in Figure 5 and Figure 6, respectively.
Figure 5:
Time courses of axial 1H glutamate+glutamine (Glx4) maps given in mM from all participants, detected using quantitative exchange label turnover (QELT) at clinical 3T. No correction of 2H label loss was applied. The signal intensity decrease is clearly visible in all participants.
Figure 6:
Time courses of axial 1H glucose (Glc6) maps given as ratio to total creatine (tCr) from all participants, detected using quantitative exchange label turnover (QELT) at clinical 3T.
Cramer-Rao Lower bound time courses from 3T 1H QELT metabolites averaged over GM+WM voxels and over all participants are shown in Supplementary Figure 5b. Axial SNR maps from 1H tNAA and Cramer-Rao Lower Bound maps from all 1H Glx4, Glc6 and tCr metabolites are shown from one representative participant for all time points in Supplementary Figure 4. The standardized quality criteria used for data exclusion was fulfilled by more than 65 % for 1H Glx4 and more than 67% for 1H Glc6 quantification results in GM and WM voxels.
7T 2H DMI vs. 3T 1H QELT
60 minutes after oral consumption of deuterium labeled glucose regionally averaged 2H Glx4 concentrations were not significantly different to the decrease of 1H Glx4 concentrations after 62 min for GM (1.29±0.15 vs. 1.38±0.26 mM, p=0.65) and WM (1.10±0.13 vs. 0.91±0.24 mM, p=0.34) regions, over all participants.
Further, unsigned slopes of the linear regression analysis showed no significant differences between 2H and 1H Glx4 dynamics over time for GM (21±3 vs. 26±3 μM/min, p=0.22) and WM (19±2 vs. 17±3 μM/min, p=0.48) data points.
Time matched 2H Glx4 concentrations (62 min) using linear interpolation individually for each participant showed no significant differences compared to the respective 1H Glx4 concentration decrease in GM (1.31±0.15 mM, p=0.72) and WM (1.12±0.14 mM, p=0.3) dominated regions.
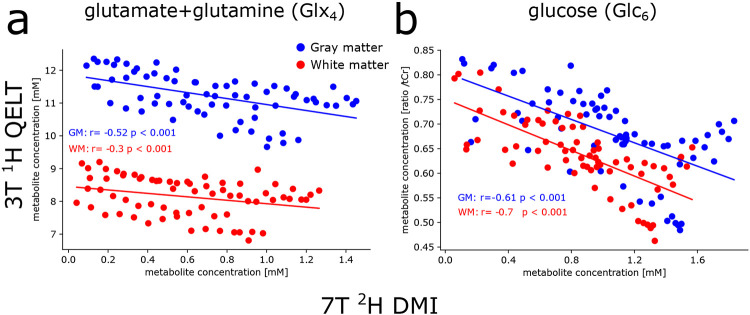
Correlation analysis on individual data points between averaged 2H and 1H Glx4 concentrations revealed a moderate negative correlation in GM (r=−0.52, p<0.001), while a weak negative correlation was observed in WM (r=−0.3, p<0.001), see Figure 7a.
Figure 7:
Correlation analysis between 2H and 1H resonances of Glx4 and Glc6 metabolites, averaged over gray matter (GM, blue) and white matter (WM, red) dominated regions. Data points for each participant were time matched via linear (for Glx4) or exponential (for Glc6) interpolation using individual slopes of linear regression analysis or time constants from mono-exponential fitting. Weak to moderate correlations were found between 2H and 1H signals for Glx4, for GM and WM regions, respectively, while strong correlation was found for Glc6 results.
No significant differences were observed between time constants of dynamic 2H Glc6 concentrations and 1H Glc6/tCr ratios in GM (24±14 vs. 19±7 min, p=0.65) and WM (28±19 vs. 18±9 min, p=0.43) dominated regions. A strong negative correlation was observed between individual data points of 2H Glc6 concentrations and 1H Glc6/tCr ratios in GM (r=−0.61, p<0.001) and WM (r=−0.70, p<0.001) regions, see Figure 7b.
Representative 2H and 1H sample spectra with corresponding spectral fit of single GM and WM voxels from the first and last time points of one representative participant are presented in Figure 8. Corresponding fit output from LCModel including concentrations (given in arbitrary units) and Cramer-Rao Lower Bounds are presented in Table 2.
Figure 8:
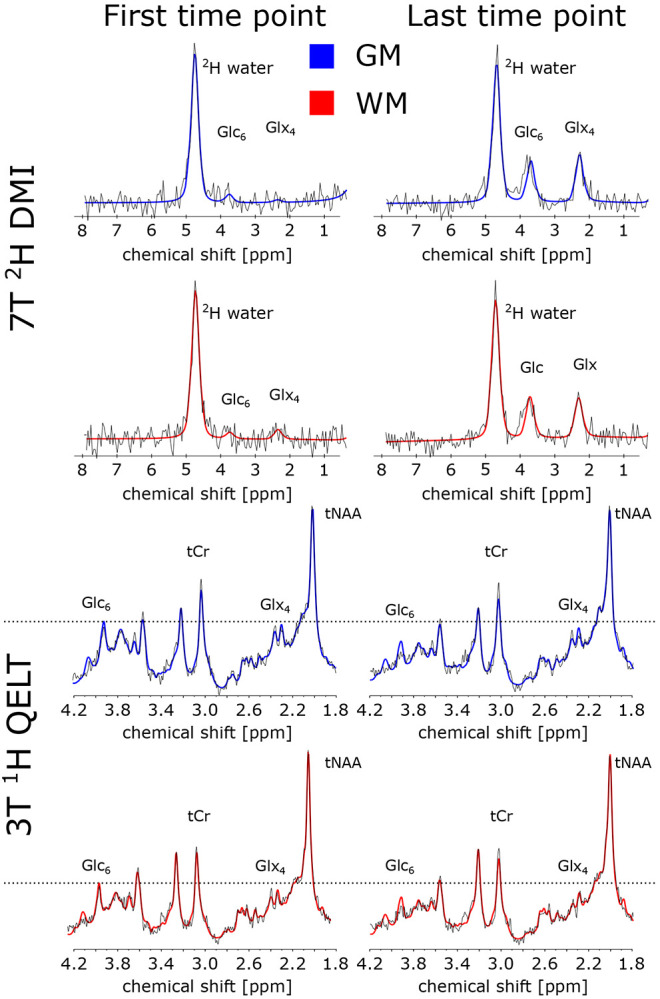
Sample spectra (black) and spectral fit results from LCModel (red) from representative gray matter (GM, blue) and white matter (WM, red) voxels acquired for the first and last time point using 2H DMI (a) and 1H QELT (b), at 7T and clinical 3T, respectively. For illustration purposes, spectra were first order corrected. Corresponding fit results of the respective voxels are shown in Table 2 for relevant metabolites, i.e., glutamate+glutamine (Glx4), glucose (Glc6), total creatine (tCr) and 2H water.
Table 2:
LCModel spectral fit output of a single representative GM and WM voxel for selected 2H and 1H metabolites from the first (5 min) and last (60 min) time point after deuterium labeled glucose ingestion, acquired using 7T 2H DMI and 3T 1H QELT, respectively.
| Gray matter voxel concentration [a.u.] (CRLB [%]) |
White matter voxel concentration [a.u.] (CRLB [%]) |
|||
|---|---|---|---|---|
| Metabolite | first time point [a.u. (CRLB %)] |
last time point [a.u. (CRLB %)] |
first time point [a.u. (CRLB %)] |
last time point [a.u. (CRLB %)] |
| 7T 2H DMI | ||||
| 2H water | 4.68 (3%) | 5.38 (3%) | 4.29 (3%) | 5.13 (3%) |
| Glx4 | 0.08 (154%) | 1.84 (9%) | 0.29 (46%) | 1.48 (10%) |
| Glc6 | 0.26 (50%) | 1.58 (10%) | 0.18 (72%) | 1.54 (9%) |
| 3T 1H QELT | ||||
| tCr | 9.40E5 (4%) | 8.92E5 (5%) | 7.80E5 (4%) | 7.09E5 (5%) |
| Glx4 | 1.65E6 (7%) | 1.31E6 (10%) | 1.06E6 (10%) | 8.18E5 (14%) |
| Glc6 | 5.54E5 (22%) | 3.79E5 (27%) | 5.69E5 (18%) | 3.06E5 (35%) |
Notes. – 2H water = deuterated water, Glx4 = combined glutamate+glutamine (4th carbon position resonance), Glc6 = glucose beta anomer (6th carbon position resonance), tCr= total creatine
Blood glucose results
Compared to baseline (0 min) glucose concentration in blood plasma increased significantly (p=0.033) from 86±7 (76-97) mg/dl to 126±25 (91-164) mg/dl at 34±2 min after oral consumption of deuterium labeled glucose. Glucose concentrations further decreased to 106±17 (86-132) mg/dl at 100±1 min on average see Supplementary Figure 6.
Discussion
This study presents non-invasive imaging of human brain glucose metabolism with high spatial resolution, using deuterium metabolic imaging (2H DMI) at 7T and quantitative exchange label turnover (1H QELT) at clinical 3T, repetitively, in the same cohort of subjects. One hour after oral administration of deuterium labeled glucose absolute concentration estimates and the individual dynamics of accumulated deuterium labeled metabolites such as glucose (Glc6) and combined glutamate+glutamine (Glx4) were comparable between both methods and in good agreement with values reported in literature (10, 12, 14, 18).
Faster metabolic activity represented by faster deuterium labeled Glx4 accumulation was observed for gray matter (GM) compared to white matter (WM) dominated regions, over all participants for both methods, but was less pronounced in 7T 2H DMI data compared to 3T 1H QELT data (14% vs 54% faster), presumably due to partial volume contamination, as a result of lower spatial resolution of DMI data. Observed regional differences of metabolic activity are in the range of reported values from [18F]FDG-PET literature (~33 % higher oxidative Glc consumption in GM than in WM) (42-44). Relative regional differences of TCA cycle rates (68%) reported in 13C-studies are higher (45, 46) compared to metabolic differences presented in this study. However, no significant differences were found for Glc6 dynamics between GM and WM dominated regions in this study for both 7T DMI and 3T QELT methods.
Although the nominal spatial resolution is higher in this study compared to recent DMI literature (1.95 ml vs. 2.7ml) (13, 14, 18), the point spread function is still suboptimal and still a major limitation of the currently implemented 7T DMI method to resolve fine structures of the brain. This presumably causes significant partial volume contamination, which could explain the intrasubject variability between 7T DMI and 3T QELT sessions especially in WM dominated regions and additionally smaller differences between GM and WM slopes of 2H Glx4 dynamics. Physiological variance of glucose metabolism between repeated sessions could additionally affect the results. Using spatial spectral non-cartesian sampling of the k-space (47, 48), could potentially increase the spatial resolution without prolonging scan time, but puts more stress on the gradient system due to the 6.5 times lower gyromagnetic ratio of 2H compared to 1H as higher gradient amplitudes are required and additionally smaller voxel yield lower SNR (49). These challenges need to be addressed in future DMI studies.
Glx4 concentration estimates were not corrected for 2H label loss in the TCA cycle (glutamate: 38±1%, glutamine: 41±5%(38)). While it is straight forward to correct 2H Glx4 concentration estimates acquired using DMI by a fixed factor, a correction of indirectly detected 1H Glx4 concentrations can only be performed on the dynamics (Glx4 decrease over time). General correction of absolute 1H Glx4 estimates (including e.g., baseline measurements) would introduce a systematic error. As a correction of only 2H Glx4 results would lead to more confusion, we decided to compare results of the Glx4 dynamics between direct (DMI) and indirect (QELT) detection without correction of 2H label loss (18, 38).
To reliably detect a 10-20% decrease in signal amplitude for labeled metabolites using 1H QELT MRSI at 3T a high temporal stability is required, which has been tested extensively in a previous study (19) during test and re-test repeatability measurements, presenting a coefficient of variation of <2 % for stable unlabeled metabolites (i.e., tCr, tNAA, Glx2+3). To exclude the possibility of a systematic error causing the decrease of labeled Glx4 and Glc6 in 1H QELT data, control measurements using regular glucose (dextrose) were performed in another study using a similar sequence (without motion correction) at 7T (15) and were therefore, not repeated.
In general, using 1H MRS to detect glucose in the human brain is notoriously difficult, due to overlapping resonances between 3.5-4 ppm and inherently low SNR. However, by separating labeled from unlabeled resonances in the basis set for spectral fitting, i.e., 1H Glc6 and 1H Glc1-5, respectively, it was possible to fit 1H Glc6 (for the more abundant Glucose-Beta anomer) with a Cramer-Rao Lower Bounds threshold <50% in more than 67 % of GM and WM voxels. These results have to be interpreted carefully, however, the signal decay of 1H Glc6 (given as ratio to tCr) over time, presumably due to exchange of labeled and unlabeled molecules, could be fitted individually per subject and yielded time constants, which were not significantly different compared to 2H Glc6 results from DMI data. It has been reported, that glucose detection at 3T is more reliable compared to using ultra-high field MR scanners (≥7T) (50, 51). Therefore, we decided to include indirectly detected 1H Glc6 results using 3T 1H QELT in this study, which would be otherwise excluded given the conventional CRLB threshold of <20 %. Spectral fitting of the unlabeled component 1H Glc1-5 was, however, not feasible with sufficiently low CRLB. To the best of our knowledge, no relaxation times of glucose at 3T were reported in literature, and therefore only ratios to total creatine were reported for 1H Glc6 results.
One of the main limitations of 1H QELT MRSI is that a baseline reference scan is required, to estimate the signal drop over time, which should be assessed, ideally, before tracer administration. This study acquired the first 3D dataset on average 7±2min after oral tracer administration, where accumulation of labeled metabolites was considered negligible.
Additionally, the center of k-space yields higher contributions to signal amplitude compared to the periphery and therefore, was sampled in the beginning of each 3D readout (inside-out order of consecutive concentric ring trajectories).
In contrast to 1H QELT, direct deuterium detection using 2H DMI does not require a baseline scan to estimate absolute concentrations for a given time point, but to follow the dynamics of 2H Glc6 and 2H Glx4 over time and perform reliable exponential and linear fitting, metabolite concentrations shortly after tracer administration need to be detected, which suffer from inherently low SNR. Using relative Cramer-Rao Lower bounds to estimate the standard deviation of spectral fit results and exclude data points by applying a strict threshold is not always recommended, especially when dealing with low SNR data (52, 53). 7T DMI data during the first 20 min after tracer administration (first 3 time points) featured low SNR as a result of low label concentration. However, fitting results reflected those values and were in the expected range for 2H Glc6 and 2H Glx4, although Cramer-Rao Lower bound values were well beyond the established 20% threshold. Therefore, we decided to include fitting results into our dynamic analysis. An increased CRLB threshold of 50% was used for all following time points (>20 min) of 7T DMI data.
In one volunteer 7T DMI data was acquired only for 9 time points (~60 min) and 16% higher nominal voxel volume before the protocol was adapted and applied for all further participants. As a result, 2H water concentration averaged over all subjects featured higher standard deviations for the first 9 time points, as illustrated in Supplementary Figure 2.
We are aware that the applied fitting models are not appropriate to reflect or represent real quantitative rates for neither Glx4 nor Glc6, and only serve as an approximation to illustrate and compare the dynamics between direct and indirect deuterium detection methods, i.e., 7T 2H DMI and 3T 1H QELT. Additionally, it has been previously shown in DMI literature, that deuterium labeled Glx4 increases approximately linearly during the first 60 min after oral tracer administration(12, 13, 18).
This study demonstrates that indirect detection of deuterium labeled compounds using 1H QELT MRSI is able to reproduce absolute concentration estimates of downstream glucose metabolites and the dynamics of glucose uptake compared to results from the same cohort of participants acquired using DMI at 7T. To the best of our knowledge, dynamic results of spatially resolved deuterium labeled Glc6 are reported for the first time using indirect detection of 1H QELT MRSI. Compared to DMI 1H QELT MRS allows for higher spatial and temporal resolution, while simultaneously detecting unlabeled metabolites and can be employed on widely available clinical 3T systems without additional hardware. This suggests significant potential for widespread application in clinical settings especially in environments with limited access to ultra-high field scanners and dedicated dual-tuned radiofrequency coils.
Supplementary Material
Acknowledgements
The financial support by the Austrian Federal Ministry for Digital and Economic Affairs, the National Foundation for Research, Technology and Development and the Christian Doppler Research Association, Austrian Science Fund and National Institute of Health is gratefully acknowledged.
Funders:
This work was supported by the National Institute of Health NIH R01EB031787 and the Austrian Science Fund: WEAVE I 6037 & KLI 1106 and Christian Doppler Laboratory for MR Imaging Biomarkers (BIOMAK)
Footnotes
Declaration of interest: R. Lanzenberger received investigator-initiated research funding from Siemens Healthcare regarding clinical research using PET/MR. He is a shareholder of the start-up company BM Health GmbH since 2019.
References
- 1.Dienel GA. Fueling and imaging brain activation. ASN Neuro. 2012;4(5). [DOI] [PMC free article] [PubMed] [Google Scholar]
- 2.Mergenthaler P, Lindauer U, Dienel GA, Meisel A. Sugar for the brain: the role of glucose in physiological and pathological brain function. Trends Neurosci. 2013;36(10):587–97. [DOI] [PMC free article] [PubMed] [Google Scholar]
- 3.Norat P, Soldozy S, Sokolowski JD, et al. Mitochondrial dysfunction in neurological disorders: Exploring mitochondrial transplantation. NPJ Regen Med. 2020;5(1):22. [DOI] [PMC free article] [PubMed] [Google Scholar]
- 4.Manji H, Kato T, Di Prospero NA, et al. Impaired mitochondrial function in psychiatric disorders. Nature Reviews Neuroscience. 2012;13(5):293–307. [DOI] [PubMed] [Google Scholar]
- 5.Koppenol WH, Bounds PL, Dang CV. Otto Warburg's contributions to current concepts of cancer metabolism. Nat Rev Cancer. 2011;11(5):325–37. [DOI] [PubMed] [Google Scholar]
- 6.Hahn A, Gryglewski G, Nics L, et al. Quantification of Task-Specific Glucose Metabolism with Constant Infusion of 18F-FDG. J Nucl Med. 2016;57(12):1933–40. [DOI] [PubMed] [Google Scholar]
- 7.Hesketh RL, Wang J, Wright AJ, et al. Magnetic Resonance Imaging Is More Sensitive Than PET for Detecting Treatment-Induced Cell Death-Dependent Changes in Glycolysis. Cancer Res. 2019;79(14):3557–69. [DOI] [PMC free article] [PubMed] [Google Scholar]
- 8.De Feyter HM, de Graaf RA. Deuterium metabolic imaging - Back to the future. J Magn Reson. 2021;326:106932. [DOI] [PMC free article] [PubMed] [Google Scholar]
- 9.Lu M, Zhu XH, Zhang Y, et al. Quantitative assessment of brain glucose metabolic rates using in vivo deuterium magnetic resonance spectroscopy. J Cereb Blood Flow Metab. 2017;37(11):3518–30. [DOI] [PMC free article] [PubMed] [Google Scholar]
- 10.De Feyter HM, Behar KL, Corbin ZA, et al. Deuterium metabolic imaging (DMI) for MRI-based 3D mapping of metabolism in vivo. Sci Adv. 2018;4(8):eaat7314. [DOI] [PMC free article] [PubMed] [Google Scholar]
- 11.Veltien A, van Asten J, Ravichandran N, et al. Simultaneous Recording of the Uptake and Conversion of Glucose and Choline in Tumors by Deuterium Metabolic Imaging. Cancers (Basel). 2021;13(16). [DOI] [PMC free article] [PubMed] [Google Scholar]
- 12.Kaggie JD, Khan AS, Matys T, et al. Deuterium metabolic imaging and hyperpolarized (13)C-MRI of the normal human brain at clinical field strength reveals differential cerebral metabolism. Neuroimage. 2022;257:119284. [DOI] [PubMed] [Google Scholar]
- 13.Ruhm L, Avdievich N, Ziegs T, et al. Deuterium metabolic imaging in the human brain at 9.4 Tesla with high spatial and temporal resolution. Neuroimage. 2021;244:118639. [DOI] [PMC free article] [PubMed] [Google Scholar]
- 14.Seres Roig E, De Feyter HM, Nixon TW, et al. Deuterium metabolic imaging of the human brain in vivo at 7 T. Magn Reson Med. 2023;89(1):29–39. [DOI] [PMC free article] [PubMed] [Google Scholar]
- 15.Bednarik P, Goranovic D, Svatkova A, et al. Deuterium labeling enables non-invasive 3D proton MR imaging of glucose and neurotransmitter metabolism in the human brain at 7T. Nat Biomed Eng. 2022. [Google Scholar]
- 16.Cember ATJ, Wilson NE, Rich LJ, et al. Integrating (1)H MRS and deuterium labeled glucose for mapping the dynamics of neural metabolism in humans. Neuroimage. 2022;251:118977. [DOI] [PMC free article] [PubMed] [Google Scholar]
- 17.Rich LJ, Bagga P, Wilson NE, et al. (1)H magnetic resonance spectroscopy of (2)H-to-(1)H exchange quantifies the dynamics of cellular metabolism in vivo. Nat Biomed Eng. 2020;4(3):335–42. [DOI] [PMC free article] [PubMed] [Google Scholar]
- 18.Ruhm L, Ziegs T, Wright AM, et al. Dynamic observation of 2H labeled compounds in the human brain with 1H versus 2H magnetic resonance spectroscopy at 9.4T. bioRxiv. 2022:2022.01.24.477582. [Google Scholar]
- 19.Niess F, Hingerl L, Strasser B, et al. Noninvasive 3-Dimensional 1H-Magnetic Resonance Spectroscopic Imaging of Human Brain Glucose and Neurotransmitter Metabolism Using Deuterium Labeling at 3T: Feasibility and Interscanner Reproducibility. Invest Radiol. 2023. [DOI] [PMC free article] [PubMed] [Google Scholar]
- 20.Boumezbeur F, Besret L, Valette J, et al. NMR measurement of brain oxidative metabolism in monkeys using 13C-labeled glucose without a 13C radiofrequency channel. Magn Reson Med. 2004;52(1):33–40. [DOI] [PubMed] [Google Scholar]
- 21.Ziegs T, Ruhm L, Wright A, Henning A. Mapping of glutamate metabolism using 1H FID-MRSI after oral administration of [1-13C]Glc at 9.4 T. Neuroimage. 2023;270:119940. [DOI] [PMC free article] [PubMed] [Google Scholar]
- 22.Bogner W, Hess AT, Gagoski B, et al. Real-time motion- and B0-correction for LASER-localized spiral-accelerated 3D-MRSI of the brain at 3T. Neuroimage. 2014;88:22–31. [DOI] [PMC free article] [PubMed] [Google Scholar]
- 23.Hingerl L, Strasser B, Moser P, et al. Clinical High-Resolution 3D-MR Spectroscopic Imaging of the Human Brain at 7 T. Invest Radiol. 2020;55(4):239–48. [DOI] [PubMed] [Google Scholar]
- 24.Moser P, Eckstein K, Hingerl L, et al. Intra-session and inter-subject variability of 3D-FID-MRSI using single-echo volumetric EPI navigators at 3T. Magn Reson Med. 2020;83(6):1920–9. [DOI] [PMC free article] [PubMed] [Google Scholar]
- 25.Lin A, Andronesi O, Bogner W, et al. Minimum Reporting Standards for in vivo Magnetic Resonance Spectroscopy (MRSinMRS): Experts' consensus recommendations. NMR Biomed. 2021;34(5):e4484. [DOI] [PMC free article] [PubMed] [Google Scholar]
- 26.Ogg RJ, Kingsley PB, Taylor JS. WET, a T1- and B1-insensitive water-suppression method for in vivo localized 1H NMR spectroscopy. J Magn Reson B. 1994;104(1):1–10. [DOI] [PubMed] [Google Scholar]
- 27.Hingerl L, Bogner W, Moser P, et al. Density-weighted concentric circle trajectories for high resolution brain magnetic resonance spectroscopic imaging at 7T. Magn Reson Med. 2018;79(6):2874–85. [DOI] [PMC free article] [PubMed] [Google Scholar]
- 28.Bilgic B, Chatnuntawech I, Fan AP, et al. Fast image reconstruction with L2-regularization. J Magn Reson Imaging. 2014;40(1):181–91. [DOI] [PMC free article] [PubMed] [Google Scholar]
- 29.Strasser B, Chmelik M, Robinson SD, et al. Coil combination of multichannel MRSI data at 7 T: MUSICAL. NMR Biomed. 2013;26(12):1796–805. [DOI] [PMC free article] [PubMed] [Google Scholar]
- 30.Provencher SW. Estimation of metabolite concentrations from localized in vivo proton NMR spectra. Magn Reson Med. 1993;30(6):672–9. [DOI] [PubMed] [Google Scholar]
- 31.Naressi A, Couturier C, Devos JM, et al. Java-based graphical user interface for the MRUI quantitation package. MAGMA. 2001;12(2-3):141–52. [DOI] [PubMed] [Google Scholar]
- 32.Starcuk ZS J; Strbak O; Graveron-Dmilly D. Simulation of coupled-spin systems in the steady-state free-precession acquisition mode for fast magnetic resonance (MR) spectroscopic imaging. Measurement Science and Technology. 2009;20(10). [Google Scholar]
- 33.Povazan M, Hangel G, Strasser B, et al. Mapping of brain macromolecules and their use for spectral processing of (1)H-MRSI data with an ultra-short acquisition delay at 7 T. Neuroimage. 2015;121:126–35. [DOI] [PubMed] [Google Scholar]
- 34.Gasparovic C, Song T, Devier D, et al. Use of tissue water as a concentration reference for proton spectroscopic imaging. Magn Reson Med. 2006;55(6):1219–26. [DOI] [PubMed] [Google Scholar]
- 35.Choi C, Coupland NJ, Bhardwaj PP, et al. T2 measurement and quantification of glutamate in human brain in vivo. Magn Reson Med. 2006;56(5):971–7. [DOI] [PubMed] [Google Scholar]
- 36.Cocking D, Damion RA, Franks H, et al. Deuterium brain imaging at 7T during D(2) O dosing. Magn Reson Med. 2023;89(4):1514–21. [DOI] [PMC free article] [PubMed] [Google Scholar]
- 37.Mlynarik V, Gruber S, Moser E. Proton T (1) and T (2) relaxation times of human brain metabolites at 3 Tesla. NMR Biomed. 2001;14(5):325–31. [DOI] [PubMed] [Google Scholar]
- 38.de Graaf RA, Thomas MA, Behar KL, De Feyter HM. Characterization of Kinetic Isotope Effects and Label Loss in Deuterium-Based Isotopic Labeling Studies. ACS Chem Neurosci. 2021;12(1):234–43. [DOI] [PMC free article] [PubMed] [Google Scholar]
- 39.Jenkinson M, Beckmann CF, Behrens TE, et al. Fsl. Neuroimage. 2012;62(2):782–90. [DOI] [PubMed] [Google Scholar]
- 40.Winter JCFd. Using the Student’s t-test with extremely small sample sizes. Practical Assessment, Research, and Evaluation. 2013;18(10). [Google Scholar]
- 41.Jafari M, Ansari-Pour N. Why, When and How to Adjust Your P Values? Cell J. 2019;20(4):604–7. [DOI] [PMC free article] [PubMed] [Google Scholar]
- 42.Hyder F, Fulbright RK, Shulman RG, Rothman DL. Glutamatergic function in the resting awake human brain is supported by uniformly high oxidative energy. J Cereb Blood Flow Metab. 2013;33(3):339–47. [DOI] [PMC free article] [PubMed] [Google Scholar]
- 43.Hyder F, Rothman DL. Quantitative fMRI and oxidative neuroenergetics. Neuroimage. 2012;62(2):985–94. [DOI] [PMC free article] [PubMed] [Google Scholar]
- 44.Yu Y, Herman P, Rothman DL, et al. Evaluating the gray and white matter energy budgets of human brain function. J Cereb Blood Flow Metab. 2018;38(8):1339–53. [DOI] [PMC free article] [PubMed] [Google Scholar]
- 45.Pan JW, Stein DT, Telang F, et al. Spectroscopic imaging of glutamate C4 turnover in human brain. Magn Reson Med. 2000;44(5):673–9. [DOI] [PubMed] [Google Scholar]
- 46.Shulman RG, Rothman DL, Behar KL, Hyder F. Energetic basis of brain activity: implications for neuroimaging. Trends Neurosci. 2004;27(8):489–95. [DOI] [PubMed] [Google Scholar]
- 47.Clarke WT, Hingerl L, Strasser B, et al. Three-dimensional, 2.5-minute, 7T phosphorus magnetic resonance spectroscopic imaging of the human heart using concentric rings. NMR Biomed. 2023;36(1):e4813. [DOI] [PMC free article] [PubMed] [Google Scholar]
- 48.Valkovic L, Chmelik M, Meyerspeer M, et al. Dynamic (31) P-MRSI using spiral spectroscopic imaging can map mitochondrial capacity in muscles of the human calf during plantar flexion exercise at 7 T. NMR Biomed. 2016;29(12):1825–34. [DOI] [PMC free article] [PubMed] [Google Scholar]
- 49.Bogner W, Otazo R, Henning A. Accelerated MR spectroscopic imaging-a review of current and emerging techniques. NMR Biomed. 2021;34(5):e4314. [DOI] [PMC free article] [PubMed] [Google Scholar]
- 50.Joers JM, Deelchand DK, Kumar A, et al. Measurement of Hypothalamic Glucose Under Euglycemia and Hyperglycemia by MRI at 3T. J Magn Reson Imaging. 2017;45(3):681–91. [DOI] [PMC free article] [PubMed] [Google Scholar]
- 51.Tkac I, Oz G, Adriany G, et al. In vivo 1H NMR spectroscopy of the human brain at high magnetic fields: metabolite quantification at 4T vs. 7T. Magn Reson Med. 2009;62(4):868–79. [DOI] [PMC free article] [PubMed] [Google Scholar]
- 52.Kreis R. The trouble with quality filtering based on relative Cramer-Rao lower bounds. Magn Reson Med. 2016;75(1):15–8. [DOI] [PubMed] [Google Scholar]
- 53.Landheer K, Juchem C. Are Cramer-Rao lower bounds an accurate estimate for standard deviations in in vivo magnetic resonance spectroscopy? NMR Biomed. 2021;34(7):e4521. [DOI] [PubMed] [Google Scholar]
Associated Data
This section collects any data citations, data availability statements, or supplementary materials included in this article.
Supplementary Materials
Data Availability Statement
Data generated by postprocessing methods (i.e., metabolic maps, LCModel basis sets, script files for data handling) are available online at: (https://github.com/MRSI-HFMR-Group-Vienna/DMIvsQELT.git). Raw data files are too large to be shared publicly and are available from the corresponding author on reasonable request for research purposes only. Due to data protection policy 3D high resolution images are only available upon reasonable request from the corresponding author if approved by the requesting researcher’s local ethics committee.


