

Abstract
Objective:
In low- and middle-income countries, undernutrition remains a major risk factor for child growth retardation. In addition, the emergence of obesity in recent years is adding another public health concern in that both stunting and obesity are associated with serious adverse health consequences. This review was designed to evaluate the prevalence of stunting and obesity in Ecuador.
Design:
Electronic databases were searched for articles published through February 2018 reporting the prevalence of stunting and/or obesity. Selected data were subjected to meta-analysis and pooled prevalence and their 95 percentiles (95 % CI) were calculated.
Setting:
Studies were identified in Medline, Web of Science, CINAHL, Cochrane Database and Ibero-America databases.
Participants:
Population of Ecuador.
Results:
Twenty-three articles were selected according to the inclusion/exclusion criteria of the study. The estimate of pooled prevalence of stunting was 23·2 % (95 % CI 23·3, 23·5) in preschoolers (age < 5 years), but was markedly higher in indigenous and rural communities. Pooled prevalence of obesity was 8·1 % (95 % CI 6·9, 9·3), 10·7 % (95 % CI 9·6, 11·7) and 10·5 % (95 % CI 9·2, 11·8) in preschoolers, school-age children (age: 5–11 years) and adolescent (age: 12–18 years), respectively. In adults (age ≥ 19 years), the rate of obesity was remarkably high as indicated by an overall estimate equal to 44·2 % (95 % CI 43·1, 45·4).
Conclusions:
This study underlines high levels of stunting among children and obesity among adults in Ecuador, both of which are not equally distributed among the population. The magnitude of this double burden emphasises the need for sustained and targeted interventions.
Keywords: Stunting, Obesity, Double burden, Ecuador
In the last few decades, the prevalence of obesity has increased significantly throughout the world including low- and middle-income countries (LMIC), as well as high-income countries(1,2). According to recent epidemiological data from the WHO, the prevalence of obesity in the world has nearly tripled since 1975(1,2). In LMIC, although the rate of obesity is rising, nutritional deficiencies are still frequent(3,4), increasing the risk of growth faltering and stunting in children(4,5). Whilst nutritional deficiencies increase the risk of infection(6), obesity is often associated with chronic metabolic diseases including diabetes and CVD(7,8). Consequently, while LMIC continue to deal with the problems of undernutrition and infectious diseases, they are also experiencing a rapid upsurge in obesity and chronic metabolic diseases(3). This uncommon coexistence of undernutrition and obesity creates a ‘double burden’ situation that increases social and economic stress in countries with limited resources(3,5).
Ecuador is a South American Andean middle-income country with about 16·5 million population, of which about 60 % live in urban areas. Its population is heterogeneous with the majority (about 72 %) is represented by the descendants of inter-ethnic unions (commonly called Mestizos). Minorities are represented mostly by Afro-Ecuadorians, the descendants of Black Africans (about 7·2 %); Native Ecuadorians, the descendants of native Indigenous inhabitants (about 7 %); and White Caucasians, the descendant of European immigrants (about 6·1 %). Geographically, Indigenous populations are located mostly in remote regions in the Amazon forest and highlands, which often have less access to healthcare facilities(9,10). Because of the geographic and economic disparities, minorities are more vulnerable to nutritional deficiencies and diseases(10–12). At the same time, rapid economic and demographic changes in Ecuador are altering the balance of dietary intake and promoting the replacement of low-energy plant-based diet with high-energy diet rich in fat predominantly from animal sources(11,13). With this change, which is mostly located in urban areas, the occurrence of obesity and metabolic diseases is rapidly increasing. Independent studies were conducted to determine the importance of obesity and undernutrition in different locations in Ecuador, but the trend of occurrence and disparity in Ecuadorian population is still unclear. The objective of this study was to conduct a systematic literature review to evaluate the prevalence of stunting and obesity in Ecuador and assess the magnitude of these problems in relation to age, gender, ethnicity and geographical location. The findings of this search could provide valuable information needed to elaborate preventive interventions.
Methods
Search strategy and study eligibility
This systematic review was conducted in accordance with the Cochrane Collaboration’s systematic review framework and Preferred Reporting Items for Systematic Reviews and Meta Analyses (PRISMA) guidelines and reporting checklist(14) (Table S1-Checklist). To identify all studies relevant to stunting and obesity in Ecuador, a comprehensive search of major electronic databases was conducted up to February 2018, with no start date restriction. The following databases were searched: Medline/PubMed (http://www.ncbi.nlm.nih.gov/pubmed), Web of Science (https://www.webofknowledge.com), Cumulative Index of Nursing and Allied Health Literature (CINAHL) (https://web.a.ebscohost.com), Cochrane Database of Systematic Reviews (http://www.thecochranelibrary.com) and Ibero-America (Scielo and Redalyc) (https://scielo.conicyt.cl, https://www.redalyc.org). The search strategy was constructed using medical subject headings and the following keywords: ‘obesity’, ‘overweight’, ‘stunting’, ‘underweight’, ‘growth retardation’ or ‘nutritional deficiency’ and ‘Ecuador’. All publication types were searched without language restriction or age limitation, and relevant studies were extracted and manually cross-referenced. In this selection, we included only records that involved human subjects of any age and presented anthropometric indices reflecting body weight status according to standard definitions. We excluded studies that were based on animal models and/or in vitro experiments, or pertaining to patients diagnosed with a disease and undergoing treatments. Short communications, articles and meta-analysis reviews were included. Editorials, letters to the editor, meeting abstracts and literature reviews were excluded.
Anthropometric indices and definition of outcomes
Anthropometric indices used in selected studies were based on internationally known standards including WHO and International Diabetes Federation(15,16). In preschoolers (age < 5 years), school-age children (5–11 years) and adolescents (age: 12–18 years), anthropometric indices used to assess physical growth and body weight were weight-for-age, length/height-for-age, weight-for-length/height and BMI-for-age. All of these indices were expressed as z scores calculated according to WHO standards(15,17) and in comparison with international reference values that provide an assessment of optimal growth(17). Preschoolers, school-age children and adolescents were classified as stunted if their length/height-for-age z scores were ≤2 sd, and underweight if their weight-for-age z score ≤2 sd. Overweight and obesity were determined for preschoolers as well as other children by z scores between >1 sd and ≤ 2 sd and > 2 sd in BMI-for-age, respectively. Additionally, some studies classified preschoolers as overweight if their weight-for-height (WHZ) was >2 sd. For adults (age ≥ 19 years), BMI (kg/m2) was used to classify overweight and obese according to the following cut-offs: ≥25 and <30 for overweight and ≥30 for obesity(15,17). To assess abdominal obesity, some studies adopted the criteria of the International Diabetes Federation based on the measurements of waist circumference and define abdominal obesity when waist circumference (WC) is ≥94 cm for men and ≥88 cm for women(16).
Study selection and data extraction
Using the inclusion and exclusion criteria, three authors (T.H., V.A.A. and L.C.) reviewed independently identified references in a two-phase process: based on reading of titles and abstracts, and then of full text. Data extraction from selected studies was reported independently by the authors using a pre-established data extraction and assessment template. The following information was independently extracted from each article by the investigators using a standardised form: study design, geographic location, years of survey, sample size, age, gender and ethnicity of participants, outcome definition (i.e. specific diagnostic criteria or cut-off of selected outcomes) and reported prevalence of stunting, underweight, overweight and/or obesity. Discrepancies in the evaluation of the studies were resolved through discussion and unanimous agreement.
Publication heterogeneity and data analysis
Statistical heterogeneity was assessed using the DerSimonian and Laird’s Q and I2 tests(18). The Q test provides information about the presence or the absence of heterogeneity between studies, whereas the I2 statistic quantifies the degree of heterogeneity(19,20). Values of I2 of 25, 50 and 75 % were considered low, medium and high heterogeneity, respectively(19). To develop a summary of measures in the overall population, we plotted computed results for the prevalence of stunting and obesity in separate Forest plots according to the method of Neyloff et al.(20). Since there was heterogeneity among studies, the random effects model of DerSimonian-Laird was applied to compute pooled prevalence(18,20). Random effects model is more conservative than fixed effects model and takes into account any heterogeneity inherent in the meta-analysis, in addition to the weight of each study in the analysis according to the sample size. Therefore, study variance impact on study weight is considerably diminished and so is the influence of individual studies’ weights to the model as a whole. All point estimates of analyses and their 95 % CI, used in the forest plot, were calculated using the random effects models as reported by Neyeloff et al.(20).
Quality assessment and risk of bias
The methodological quality of included studies was evaluated independently by two authors (V.A. and L.C.), using the Newcastle–Ottawa Scale(21) modified by Nansseu et al.(22). The Newcastle–Ottawa Scale was designed to assess the quality of non-randomised studies in meta-analyses. This scale was formulated by a star distribution system, assigning a maximum of ten stars for the risk of bias in three areas: selection of study groups (4 stars), comparability of groups (2 stars) and ascertainment of the outcome of interest (3 stars). Total scale range was zero to ten, with higher score indicating better study quality. A score equal to or higher than seven was considered to indicate high study quality, a score between four to six was moderate quality, and a score equal to or under three was considered low quality. Discrepancies of quality assessment rating were resolved through discussion with the third member of the study (T.H.) and unanimous agreement.
Results
Search results and studies’ characteristics
The screening process and results of database search are presented in the PRISMA flow diagram (Fig. 1). A total of 180 papers were initially retrieved using the search format described in the Methods section. Among this first selection, 131 studies were excluded because of duplication between databases and the remaining forty-nine studies were selected for initial identification. Of these, fourteen studies were excluded because they were not related to Ecuador population or focused on obesity-related diseases which were clearly not relevant to the prevalence of stunting and/or obesity. The remaining thirty-five studies were further studied by careful reading of the full text. After the full review, twelve studies were excluded because they were (i) reviews, editorials or meeting abstracts (6); (ii) Non-human studies (4) and (iii) duplicates (2). Ultimately, twenty-three studies were included in the final selection and presented in this review. In general, these studies covered several regions in Ecuador, among which two studies were based on nationwide surveys(3,23). Most studies were conducted in urban areas often in and around big cities such as Cuenca, Quito and Guayaquil. Only few studies took place in rural regions and in Amazon forest communities. While several studies examined the prevalence of stunting and/or obesity with age and gender, a limited number reported the distribution among ethnicities(3,8,24) or between rural and urban regions(23,25,26). The sample size of studies ranges from twenty subjects in a study conducted in Galapagos Islands(27) to a maximum of 1 294 372 subjects reported in a nationwide survey(23). The quality assessment indicated that all studies failed to provide the response rate and characterise the non-respondents in comparison with the respondents; likewise, reporting and/or controlling for important factors was unsatisfactory. In general, two studies were with high-quality evidence(3,8) and the others were of moderate quality (Table S2). Because age could impact the prevalence of stunting and/or obesity, we subdivided the studies in four groups according to the age: preschoolers (age <5 years), school-age children ≥5 years and ≤ 11 years (5–11 years), adolescents ≥12 years and ≤18 years (12–18 years) and adults (≥19 years).
Fig. 1.

Preferred Reporting Items for Systematic Reviews and Meta-Analyses (PRISMA) flow chart illustrating the selection of the studies included in the systematic review
Prevalence of stunting and obesity in children and adolescents
The characteristics of the studies relevant to preschoolers, school-age children and adolescents are represented in Tables 1–3, respectively. According to these subdivisions, there were nine(3,23,24,27–32), four(3,9,33,34) and seven studies(3,25,26,34–37), respectively. While the obesity rate was reported in most studies of these subdivisions, only few described the prevalence of stunting in school-age children and adolescents. Because of these differences, random effects model analysis of stunting data was performed only for preschoolers, while obesity data were computed for the three subdivisions. The resulting forest plots are presented in Figs. 2 and 3, respectively.
Table 1.
Characteristics of studies relevant to stunting and obesity in infants (age < 5 years)*
| Reference no. | Location (s) | Study duration | Sample size | Gender (%) (female/male) | Age (months) | Subject characteristics | Finding | ||
|---|---|---|---|---|---|---|---|---|---|
| Stunting | Underweight | Obese | |||||||
| León et al.(29) | Babahoyo | 2007 | 140 | 50/50 | 3–60 | Rural | 18·6 % | 8·6 % | 5 % |
| Díaz et al.(31) | Cuenca | 2013 | 577 | 51/49 | 12–59 | Urban | 24·2 % | All ages: 7·9 % F: 6·6 %, M: 9·5 % |
All: 4·70 % Age: 12–23 months: F: 0·9 %, M: 1 % 24–35 months: F: 1·2 %, M: 0·0 % 36–47 months: F: 0 %, M: 0 % 48–59 months: F: 0 %, M: 0 % |
| Ortiz et al.(24) | Cuenca Nabon |
2008 | 703 | Cuenca: 51/49 Nabon: 49/51 |
0–24 | Rural and Urban highlands | All: 34·1 % Cuenca:17·7 % Nabon:37·4 % |
Not reported | Cuenca: 5·7 % Nabon: 6·2 % |
| Freire et al.(3) | Nationwide survey | 2011–2013 | 8894 | 51/49 | 0–59 | Rural and Urban | All: 25·3 %, F: 24·8 %, M: 25·3 % Age: 0–5 months: 16·8 % 6–11 months: 19·9 % 12–23 months: 32·6 % 24–35 months: 29·1 % 36–47 months: 27·2 % 48–59 months: 22·1 % Indigenous: 43·2 % |
Not reported | Ow/Ob, All: 8·6 % Age: 0–5 months: 9·3 % 6–7 months: 9 % 12–23 months: 10·5 % 24–35 months: 6·4 % 36–47 months: 7·7 % 48–59 months: 10 % |
| World bank group(23) | Nationwide survey | 2004 | 1 294 372 | 50/50 | 0–60 | Urban and rural | All: 23·1 % F: 24·0 %, M: 22·1 % U: 16·9 %, R: 30·6 % Age: 0–5 months: 3·3 % 6–11 months: 12·4 % 12–23 months: 35·9 % 24–35 months: 31·1 % 36–47 months: 35·4 % 48–60 months: 34·1 % Ethnicity: Indigenous 46·6 % Mestizo 21·1 % White 18·6 % Black: 14·2 % |
All: 9·3 % F: 9·8 %, M: 8·8 % U: 7·7 %, R: 11·3 % Age 0–5 months: 0·8 % 6–11 month: 8 % 12–23 month: 16 % 24–35 month: 14·3 % 36–47 month: 10·4 % 48–60 month: 7·1 % Ethnicity Indigenous:15·3 % Mestizo 8·7 % White 6·2 % Black: 11·4 % |
Obese: Not recorded Overweight: All: 3·2 % F: 3·7 %, M: 2·7 % U: 3·5 %, R: 2·8 % Age 0–5 months: 5·3 % 6–11 months: 3·9 % 12–23 months: 4·1 % 24–35 months: 1·5 % 36–47 months: 2·8 % 48–60 months: 3·1 % Ethnicity Indigenous: 3·4 % Mestizo 3·0 % White 5·0 % Black: 3·0 % |
| Waldrop et al.(27) | Galapagos | 2010 | 20 | 61/39 | <6 | Island residents | Not reported | Not reported | 10 % |
| Handal et al.(32) | Cayambe-Tabacundo | 2003–2004 | 283 | 3–61 | All: 53·4 % | Not reported | Not reported | ||
| So et al.(30) | Amazon Region | 2011–2013 | 1407 | 50/50 | 6–72 | Indigenous community | All: 35·9 % | Not reported | Not reported |
| Arsenaul et al.(28) | Quito (2 sites) | 2003–2005 | 564 | 51/49 | 6–35 | Rural and peri-urban, low income | 12–23 months: 54·8 % 24–35 months: 44·3 % |
Not reported | Not reported |
F, female; M, male; U, urban; R, rural; Indigenous, native Ecuadorians; Mestizo, descendants of mixed marriage; Montubio, mestizo people living in countryside of coastal Ecuador; Ow, overweight; Ob, obesity.
All studies adopted the WHO z scores.
Table 3.
Characteristics of studies relevant to stunting and obesity in adolescents (12–18 years)*
| Reference no. | Location | Study duration | Sample size | Gender (%) (female/male) | Age (years) | Subjects characteristics | Findings | ||
|---|---|---|---|---|---|---|---|---|---|
| Stunting | Underweight | Ow, Ob, and AO | |||||||
| Casapulla et al.(37) | Quito | 2015 | 433 | Cariamanga: 69/31 Pomasqui: 68/32 |
13–18 | Urban-Sierra region. Urban schools in Quito |
Not reported | All:7·3 % Cariamanga: 6·5 % Pomasqui: 8·0 % |
-Cariamanga: All: Ow: 10·3 %, Ob: 7·5 % -Pomasqui: All: Ow: 8·9 %, Ob: 5·2 % M, Ow: 6·6 %, Ob:3·7 %, AO:12 % F Ow:11·0 %, Ob:7·6 %, AO: 33 % |
| Freire et al.(3) | Nationwide survey | 2011–2013 | 8529 | Not reported | 12–19 | All regions and ethnicities | All: 19 % F: 21·1 % M: 17·3 % Indigenous: 19·5 % Afroecuadorian: 13·4 % Montubio: 21·7 % Mestizo: 16·9 % |
Not reported | Ow/Ob All: 26·0 %, F:28·8 % M: 23·3 % Indigenous: 48·8 % Afro Ecuadorian: 43·7 % Montubio : 17·8 % Mestizo: 26·1 % |
| Cambizaca et al.(25) | Loja | 2013–2014 | 1337 | 61/40 | 11–17 | Publics high schools | Not reported | F: 3·42 %, M: 2·83 % U: 3·0 %, R: 3·5 % |
Ow, F: 20 %, M: 20·3 % U: 20·5, R:18·7 % Ob, F: 7·40 %, M:5·5 % U: 7·1 %, R: 3·1 % |
| Garrido et al.(26) | Paute | 2014 | 314 | 57./43 | 12–19 | Urban and Rural schools | All: 24·8 % Urban: 16·3 % Rural: 31·8 % |
Not reporting | Ow, All:19·8 % U:24·1 %, R: 16·2 % Ob: All:2·95 U:4·3 %, R:1·7 % AO: All:1·6 % U:2·8 %, R:0·6 %, |
| Ramos et al.(34) | Riobamba | 2013 | 2099 | 48/52 | 12–19 | Urban | Not reported | UW: 2·0 % | Ow:16·6 %, Ob: 4·9 % |
| Yepez et al.(35) | Esmeraldas Guayaquil Machala Manta Portoviejo Quevedo |
2006–2007 | 2829 | 52/49 | <19 | Urban | Not reported | All: 16·8 % Age: 12–14 years: 16·8 % 15–16 years: 16·5 % 17–18 years: 16·4 % |
Ow: 13·7 %, Ob: 7·5 % Age: 12–14 years: Ow: 14·3 %, Ob: 7·8 % 15–16 years: Ow: 13·3 %, Ob: 7·8 % 17–18 years: Ow: 12·6 %, Ob: 5·5 % |
| Castro et al.(36) | Loja, Quito | 2001 | 302 | 100 | 12–19 | Semi urban | Not reported | All: 50 % | Ow: 8·3 %, Ob: 0·7 % |
F, female; M, male; Ow, overweight; Ob, obesity; AO, abdominal obesity; U, urban; R, rural; Indigenous, native Ecuadorians; Mestizo, descendants of mixed marriage; Mulatto, descendants of mixed white and black ancestries; Montubio, mestizo people living in countryside of coastal Ecuador.
All studies adopted the WHO z scores.
Fig. 2.
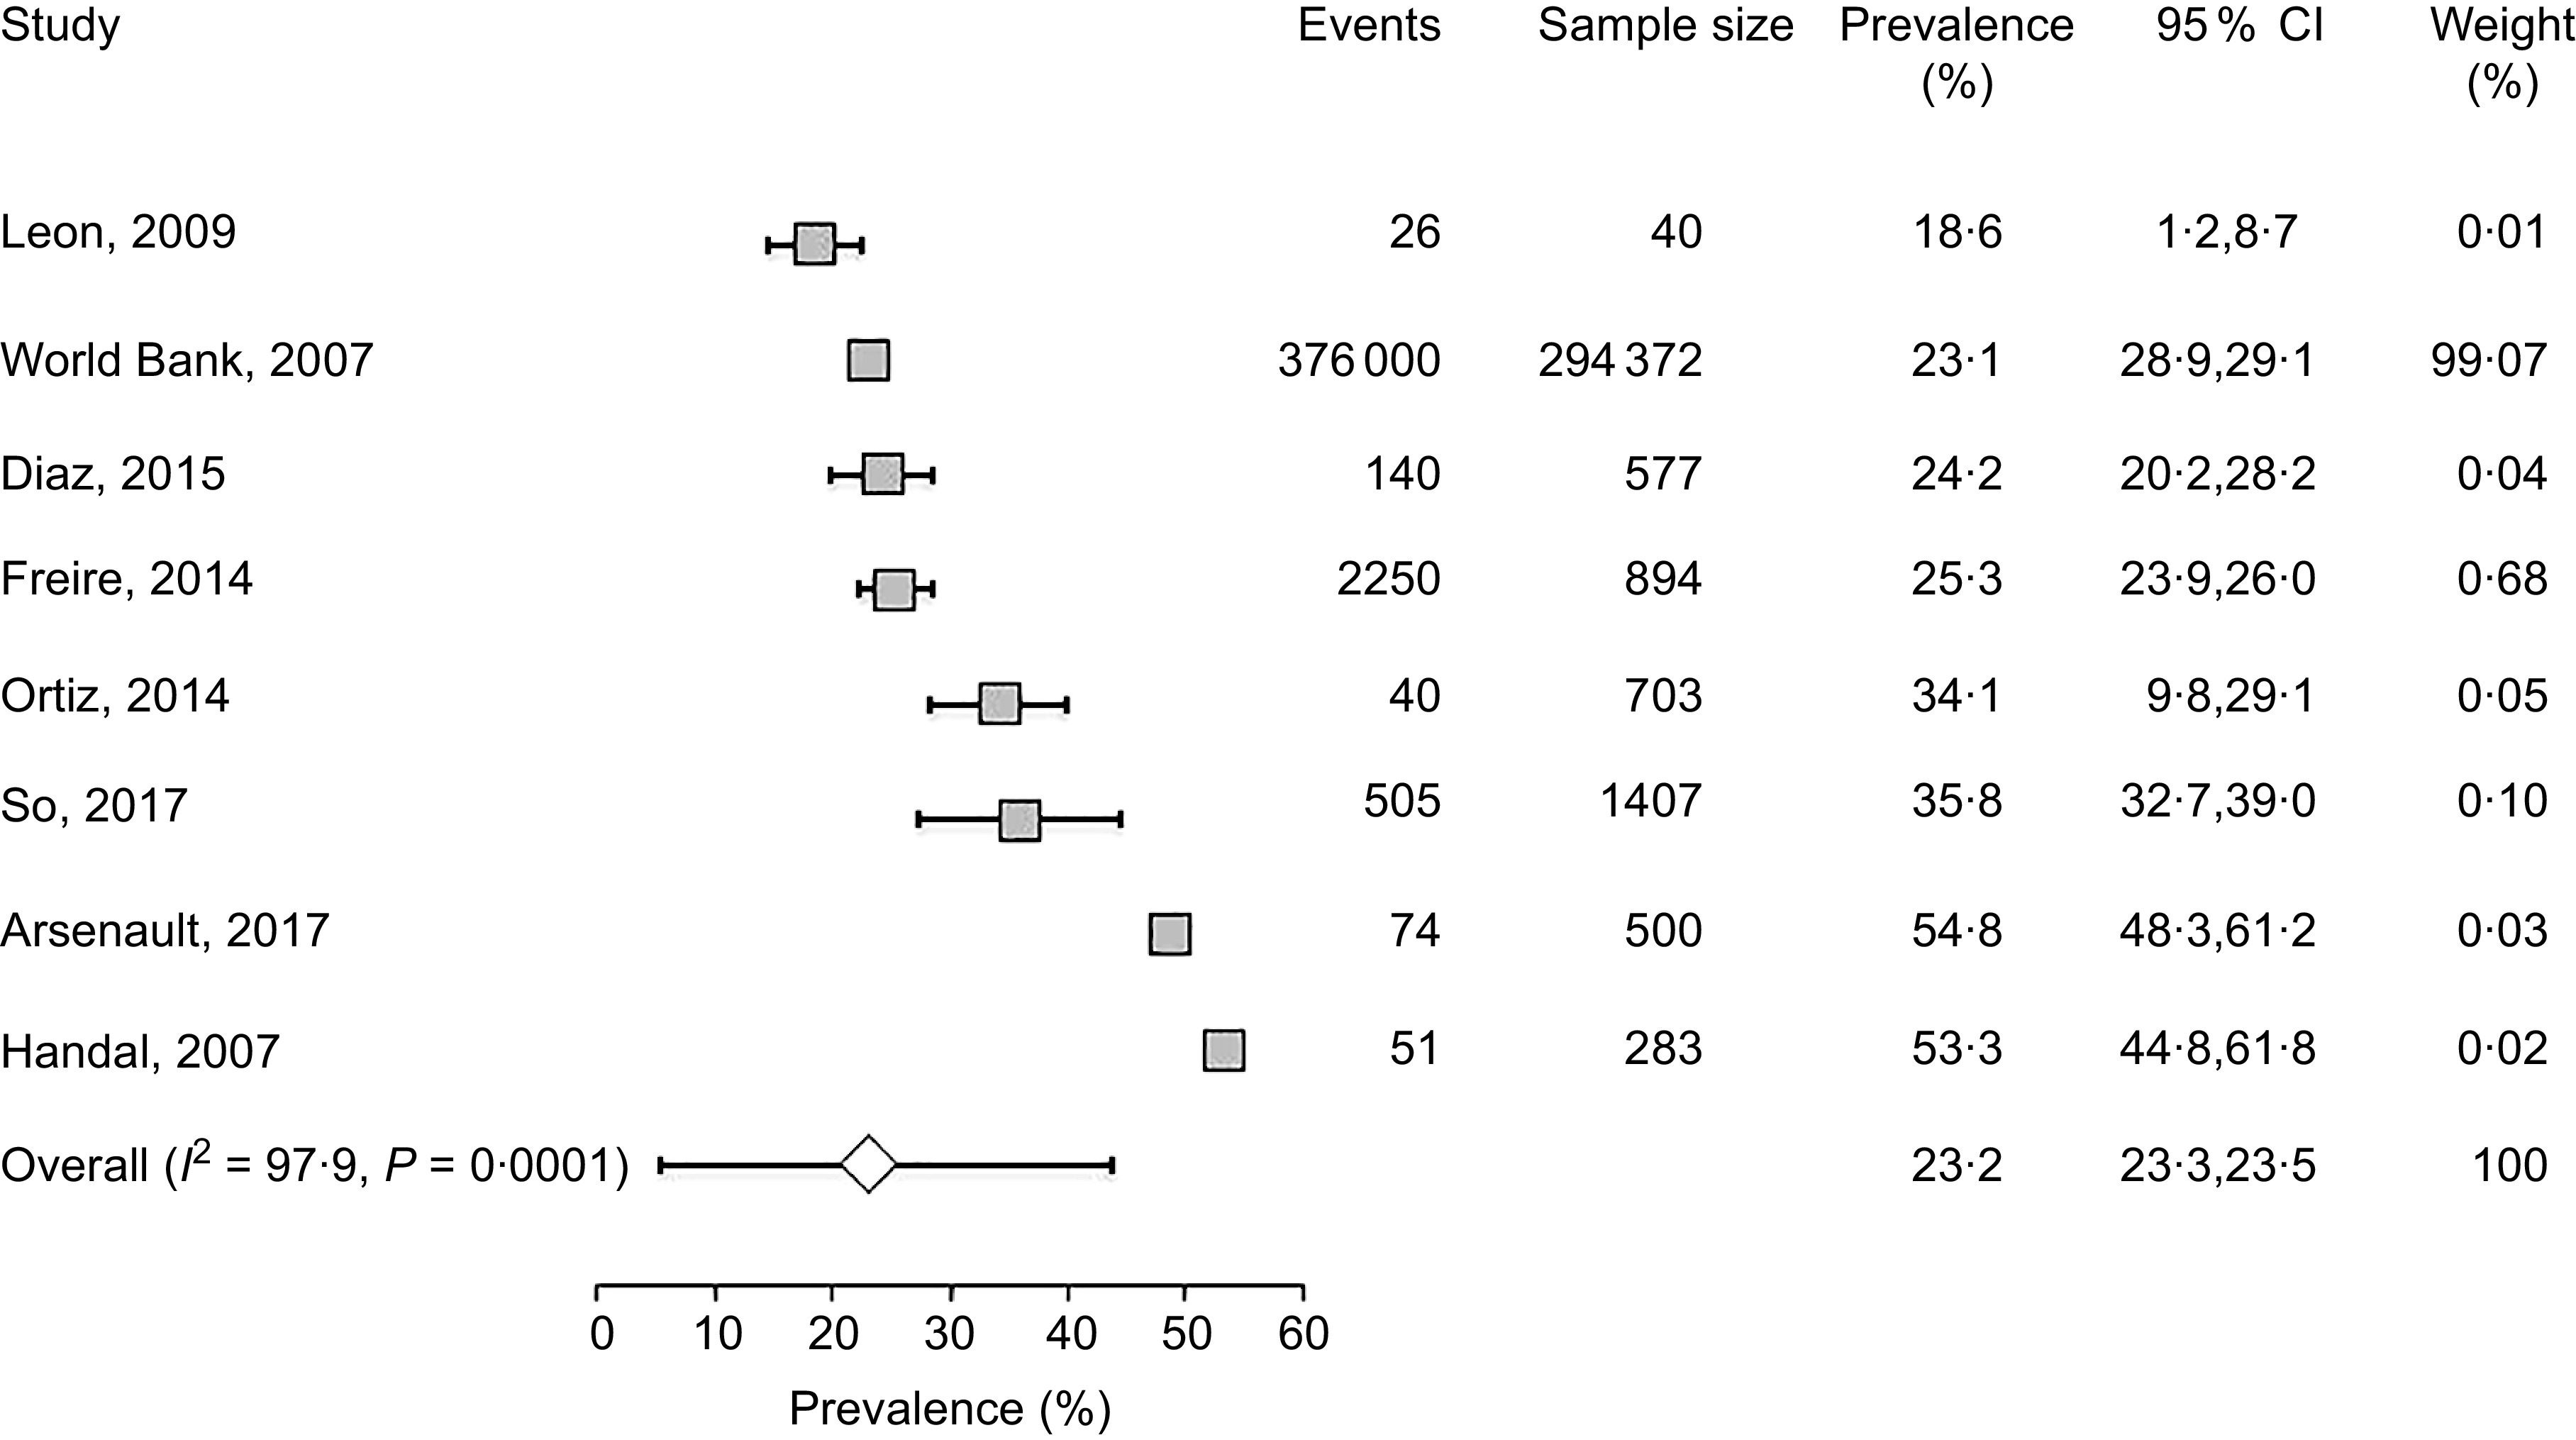
Forest plot of a random effects meta-analysis of the prevalence of stunting in preschoolers (age <5 years). Values are standardised mean differences (95 % CI). The shaded squares represent the point estimate for each individual study, and the horizontal line extending from each square represents the upper and lower limits of 95 % CI. The characteristics of each study include number of events, sample size, prevalence, 95 % CI and study weight. The white diamonds represent the overall estimate of pooled prevalence
Fig. 3.
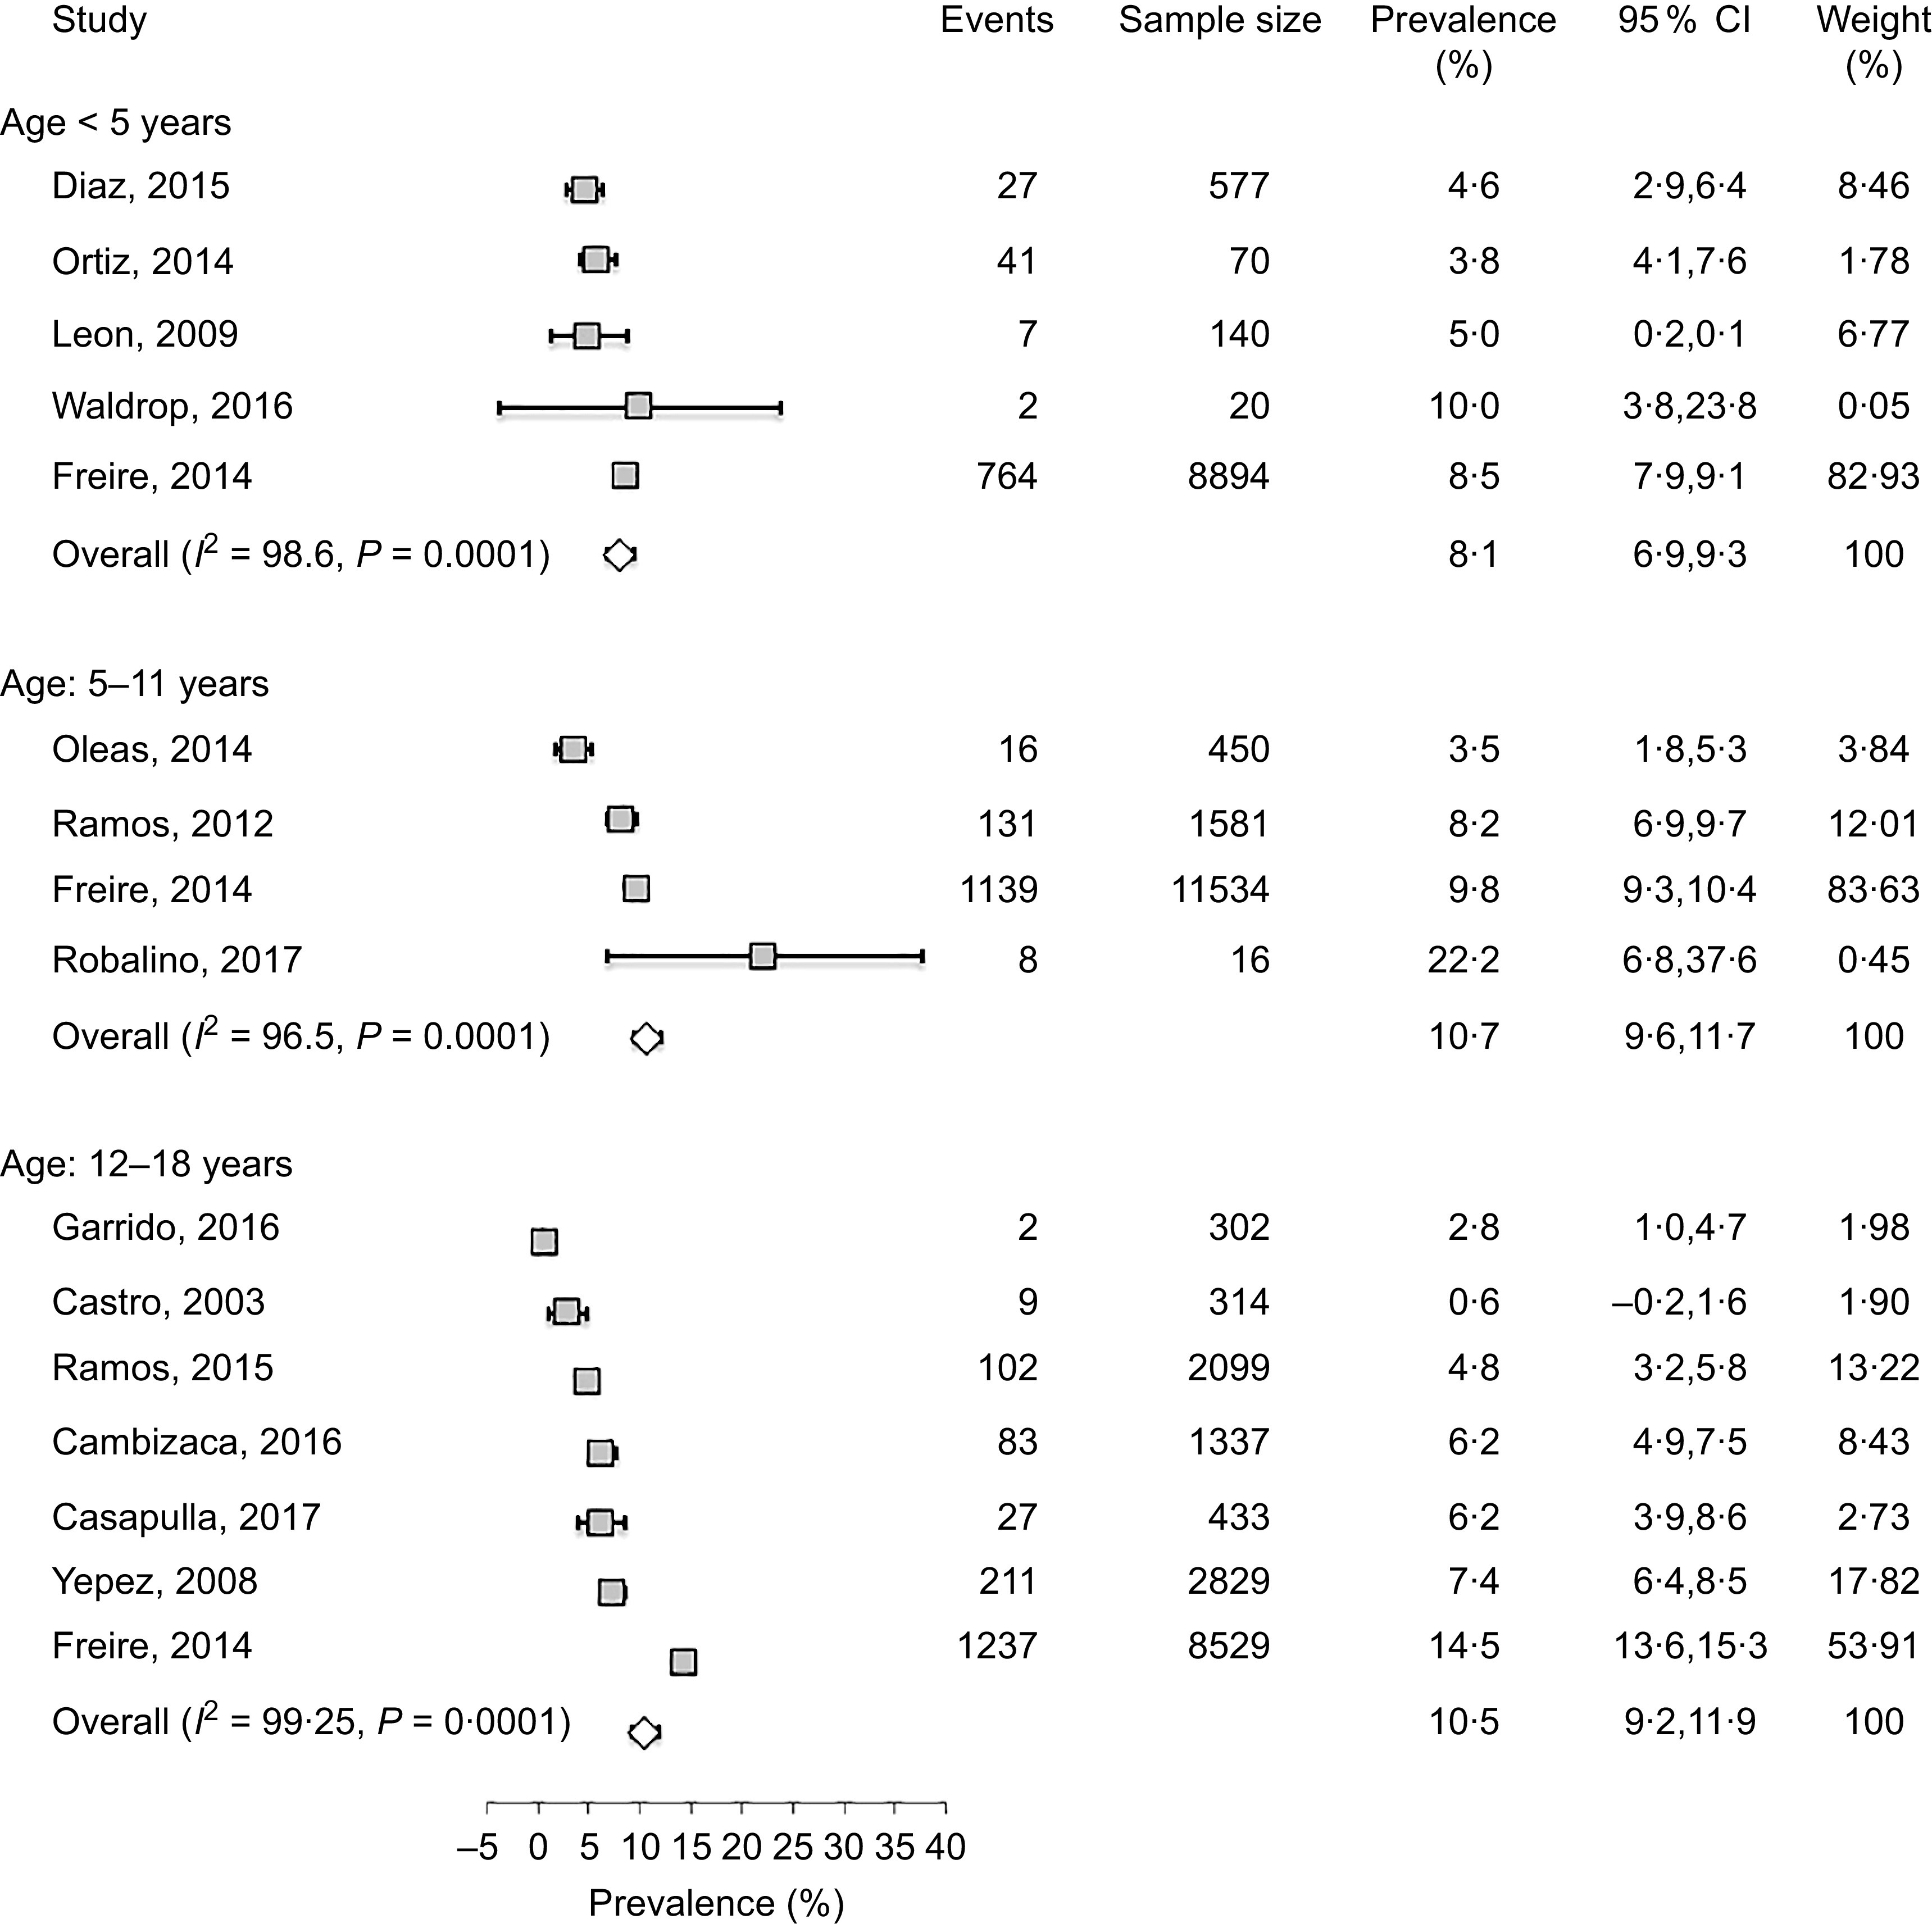
Forest plot of a random effects meta-analysis of the prevalence of obesity in preschoolers (age < 5 years), school-age children (age: 5–11 years) and adolescents (age: 12–18 years). Values are standardised mean differences (95 % CI). The shaded squares represent the point estimate for each individual study, and the horizontal line extending from each square represents the upper and lower limits of the 95 % CI. The white diamonds represent the overall estimate of pooled prevalence in percent
In preschoolers, the overall pooled estimate of stunting was 23·2% (95 % CI 23·3, 23·5) (Fig. 2). There was, however, a high level of heterogeneity among these studies (I2 = 97·9) which could be related to variations of age, ethnicity and/or geographic location. Interestingly, a large data collection from a nationwide survey(23) indicated that the prevalence of underweight and stunting was relatively low (0·8 and 3·3 %, respectively) in newborns (age: 0–5 months), but increased in the following months to reach markedly high proportions (7·1 and 34·1 %, respectively) at the age of 48–60 months. This progressive age-associated increase was also corroborated by the study of Freire et al.(3) based on a later survey(38). Another important finding was the disparity of prevalence among ethnicities(3,23). A study based on an early national survey (ENDEMAIN 2004) reported an alarming rate of stunting exceeding 46·6 % in Indigenous preschoolers, while this rate varied from 14·2 to 21·1 % in children of other ethnicities(23). The same study also reported a markedly higher occurrence of stunting in rural than urban areas(23). Similarly, another study conducted in low-income rural and peri-urban areas of Quito indicated that the rate of stunting was markedly higher than average pooled estimate, reaching 54·8 %(32).
Few investigations examined the rate of stunting in school-age children and adolescents as shown in Tables 2 and 3. While three studies(3,9,33) reported a wide range (14·9–44 %) of prevalence in school-age children, two other investigations(3,26) indicated that the rate of stunting in adolescents varied between 19 and 24·8 %(3,26). There was no clear difference between males and females in both age-school children and adolescents, but once again there was significant disparity among ethnicities with markedly high rates in Indigenous school-age children (36·5 %)(3). Furthermore, a study conducted in the Paute region by Garrido et al.(26) indicated that stunting was clearly higher in rural (31·8 %) than urban areas (16·3 %) (Table 3).
Table 2.
Characteristics of studies relevant to school-age children (5–11 years)*
| Reference no. | Location | Study duration | Sample size | Gender (%) (female/male) | Age (years) | Findings | ||
|---|---|---|---|---|---|---|---|---|
| Stunting | Underweight | Ow and Ob | ||||||
| Robalino et al.(9) | Riobamba | 2017 | 36 | 50/50 | 5–6 | All: 44 % F: 38·89 %; M: 50 % |
Not reported | Ow All: 5·56 %, F: 5·56 %, M: 5·56 % Ob All: 2·78 % F: 5·56 %, M: 0 % |
| Freire et al.(3) | Nationwide survey | 2011–2013 | 11 534 | 52/48 | 5–11 | All: 14·9 % F:14·8 %, M:15 % Ethnicity: Indigenous: 36·5 % AfroEcudorian: 7·7 % Montubio: 10·0 % Mestizo and White: 13·7 % |
Not reported | Ow: F: 18·15 %, M: 19·80 % Ob: F: 6·95 %, M: 12·70 % Ow/Ob: Indigenous: 24·0 % Afro-Ecuadorian: 26·5 % Montubio: 16·9 % Mestizo and White: 30·7 % |
| Ramos et al.(34) | Riobamba | 2013 | 1581 | 50/50 | 5–11 | Not reported | Not reported | All Ow:19·4 % Ob: 8·3 % Ow: F: 24·4 % M: 31·0 |
| Oleas et al.(33) | Imbabura | 2008–2009 | 450 | 42/56 | 6–12 | All: 22 % | All:7·3 % | Ow: 10 % Ob: 3·6 % AO: 6 % |
F, female; M, male; Indigenous, native Ecuadorians; Mestizo, descendants of mixed marriage; Montubio, mestizo people living in countryside of coastal Ecuador; White, descendants of European Caucasians; Ow, overweight; Ob, obesity; AO, abdominal obesity.
All studies adopted the WHO z scores.
The studies that examined the prevalence of obesity in preschoolers, school-age children and adolescents are listed in Tables 1–3, respectively. In general, the prevalence of obesity was relatively low in early childhood (preschoolers) and did not show a clear change in school-age children and adolescents; estimates of pooled prevalence were 8·1 % (95 % CI 6·9, 9·3), 10·7 % (95 % CI 9·6, 11·7) and 10·5 % (95 % CI 9·2, 11·8), respectively (Fig. 3). Although age subdivisions were created to narrow potential differences among studies, a high level of heterogeneity persisted in each of these subdivisions as indicated by an I2 > 75 %. While obesity rate was comparable between males and females in each subdivision, there were clear differences between ethnicities(3), and between rural and urban locations(25,26). As indicated above, while stunting was prevalent in Indigenous communities, the proportions of overweight/obese in school-age children and adolescent were also noticeably high in these communities reaching 24 and 48·8 %, respectively(3). Taken together, these findings indicate that obesity and stunting co-exist in Indigenous communities, possibly affecting children at different age ranges.
Prevalence of obesity in adults
The prevalence of overweight and obesity in adults has been reported in eight studies(3,8,27,39–43) (Table 4), six of which reported the distribution among genders(3,8,40–43). While four studies examined the rate of abdominal obesity(8,39,41,42), only one study compared the disparity between ethnicities, and between rural and urban areas(8). In general, the results showed a markedly high prevalence of overweight and obese subjects reaching 45 and 25 %, respectively(27). Pooled estimate of the prevalence of obesity, analysed by the random effects model, was 44·2 % (95 % CI 43·1, 45·4) (Fig. 4). There was, however, high level of heterogeneity (I2 = 99·5 %) which could be linked to multiple factors including age, ethnicity and geographic location. In line with this, several studies indicated that the prevalence of obesity (assessed by BMI) was higher in females (ranging from 13·7 to 28 %) than males (ranging from 3·3 to 18·4 %)(3,8,41). In addition, although two studies reported that abdominal obesity was higher in females than males(8,41), two others reported comparable rates in both genders(42,43). The impact of age was reported in the study of Campoverde et al.(39) showing that obesity increased progressively with age reaching almost 35 % in older subjects (age > 60 years). There was also clear disparity between rural and urban populations with markedly higher rates in urban locations(8). Although comparative studies among ethnicities were sparse, one study reported that Afro-Ecuadorians had the highest prevalence of abdominal obesity (77·7 and 26·1 % for females and males, respectively)(8).
Table 4.
Characteristics of studies relevant to adults (age ⩾ 19 years)
| Reference no. | Location | Study duration | Sample size | Gender (%) (female/male) | Age (years) | Methods of measurements | Finding | |
|---|---|---|---|---|---|---|---|---|
| Ow | Ob | |||||||
| Orces et al.(8) | Andes and coastal | 2010 | 2053 | 53/47 | > 60 | BMI according WHO criteria. AO according to IDF criteria | F: 43·0 %, M: 40·3 % Rural: 18·75 %, Urban: 20·54 % |
Obesity: F: 22·6 %, M: 9·6 % Rural: 3·1, Urban: 7·03 Ethnicity: Indigenous: M: 7·5 %, F: 43·4 % White M: 20·5 %, F: 66·5 % Mulatto M: 29·1 %, F: 67·2 % Mestizo M: 15·5 %, F: 68·8 % Afro-Ecuadorians: M: 26·1 %, F: 77·7 % Abdominal obesity: F: 65·9 %, M:16·3 % |
| Sempertegui et al.(41) | Quito | 2003–2004 | 352 | 64/36 | > 65 | BMI according WHO criteria AO according to IDF criteria |
F: 41·2 %, M: 29·5 % | Obesity F: 14·0 %, M:3·3 % Abdominal obesity: All: 61 %, F: 75 %, M: 37 % |
| Jairala et al.(40) | Guayaquil | 2006–2011 | 441 | 37/63 | 21–85 | BMI according WHO criteria | All: 43·31 % F: 23·9 %, M:48·8 % |
Obesity: All: 27·21 %, F: 13·7 %, M:30·9 % |
| Torres et al.(43) | Cuenca | 2013–2014 | 318 | 57/43 | BMI according WHO criteria AO according to IDF criteria |
All: 39·9 % F: 36·3 %, M: 44·9 % |
Obesity: All: 23·6 %, F: 27·5 %, M: 18·4 % Abdominal obesity: All: 80·5 %, F: 846 %, M:750 % |
|
| Campoverde et al.(39) | Cuenca | 2013–2014 | 318 | 57/43 | >18 | BMI according WHO criteria | All: 41·3 % Age: <40 years: 35·2 %0 40–50 years:42·7 % > 60 years: 46·2 % |
Obesity: All: 21·13 % <40 years: 4·8 % 40–59 years: 29·0 % > 60 years: 34·6 % |
| Freire et al.(3) | Nationwide survey | 2011–2013 | 87 280 | 50/50 | 19–60 | BMI according WHO criteria | F: 38·3 %, M: 44·3 % | Obesity: F: 28·1 %, M: 17·0 % Ow/Ob All: 62·8 % F: 65·5 %, M:60 % |
| Waldrop et al.(27) | Isabela Galapagos | 2010 | 20 | F: 100 | Newborns | BMI according WHO criteria | All: 45 % | Obesity: All: 25 % |
| Salazar et al.(42) | Imbabura | 2014 | 297 | 46/54 | 33–53 | BMI according WHO criteria AO according to IDF criteria |
All 51·7 % F: 22 %, M:28·8 % |
Obesity: All: 17·9 % Abdominal obesity: All:59 %, F:60·9 %, M: 57·5 % |
IDF, International Diabetes Federation; F, female; M, male; Mestizo, descendants of mixed marriage; Mulatto, descendants of mixed white and black ancestries; Montubio, mestizo people living in countryside of coastal Ecuador; AO, abdominal obesity.
Fig. 4.
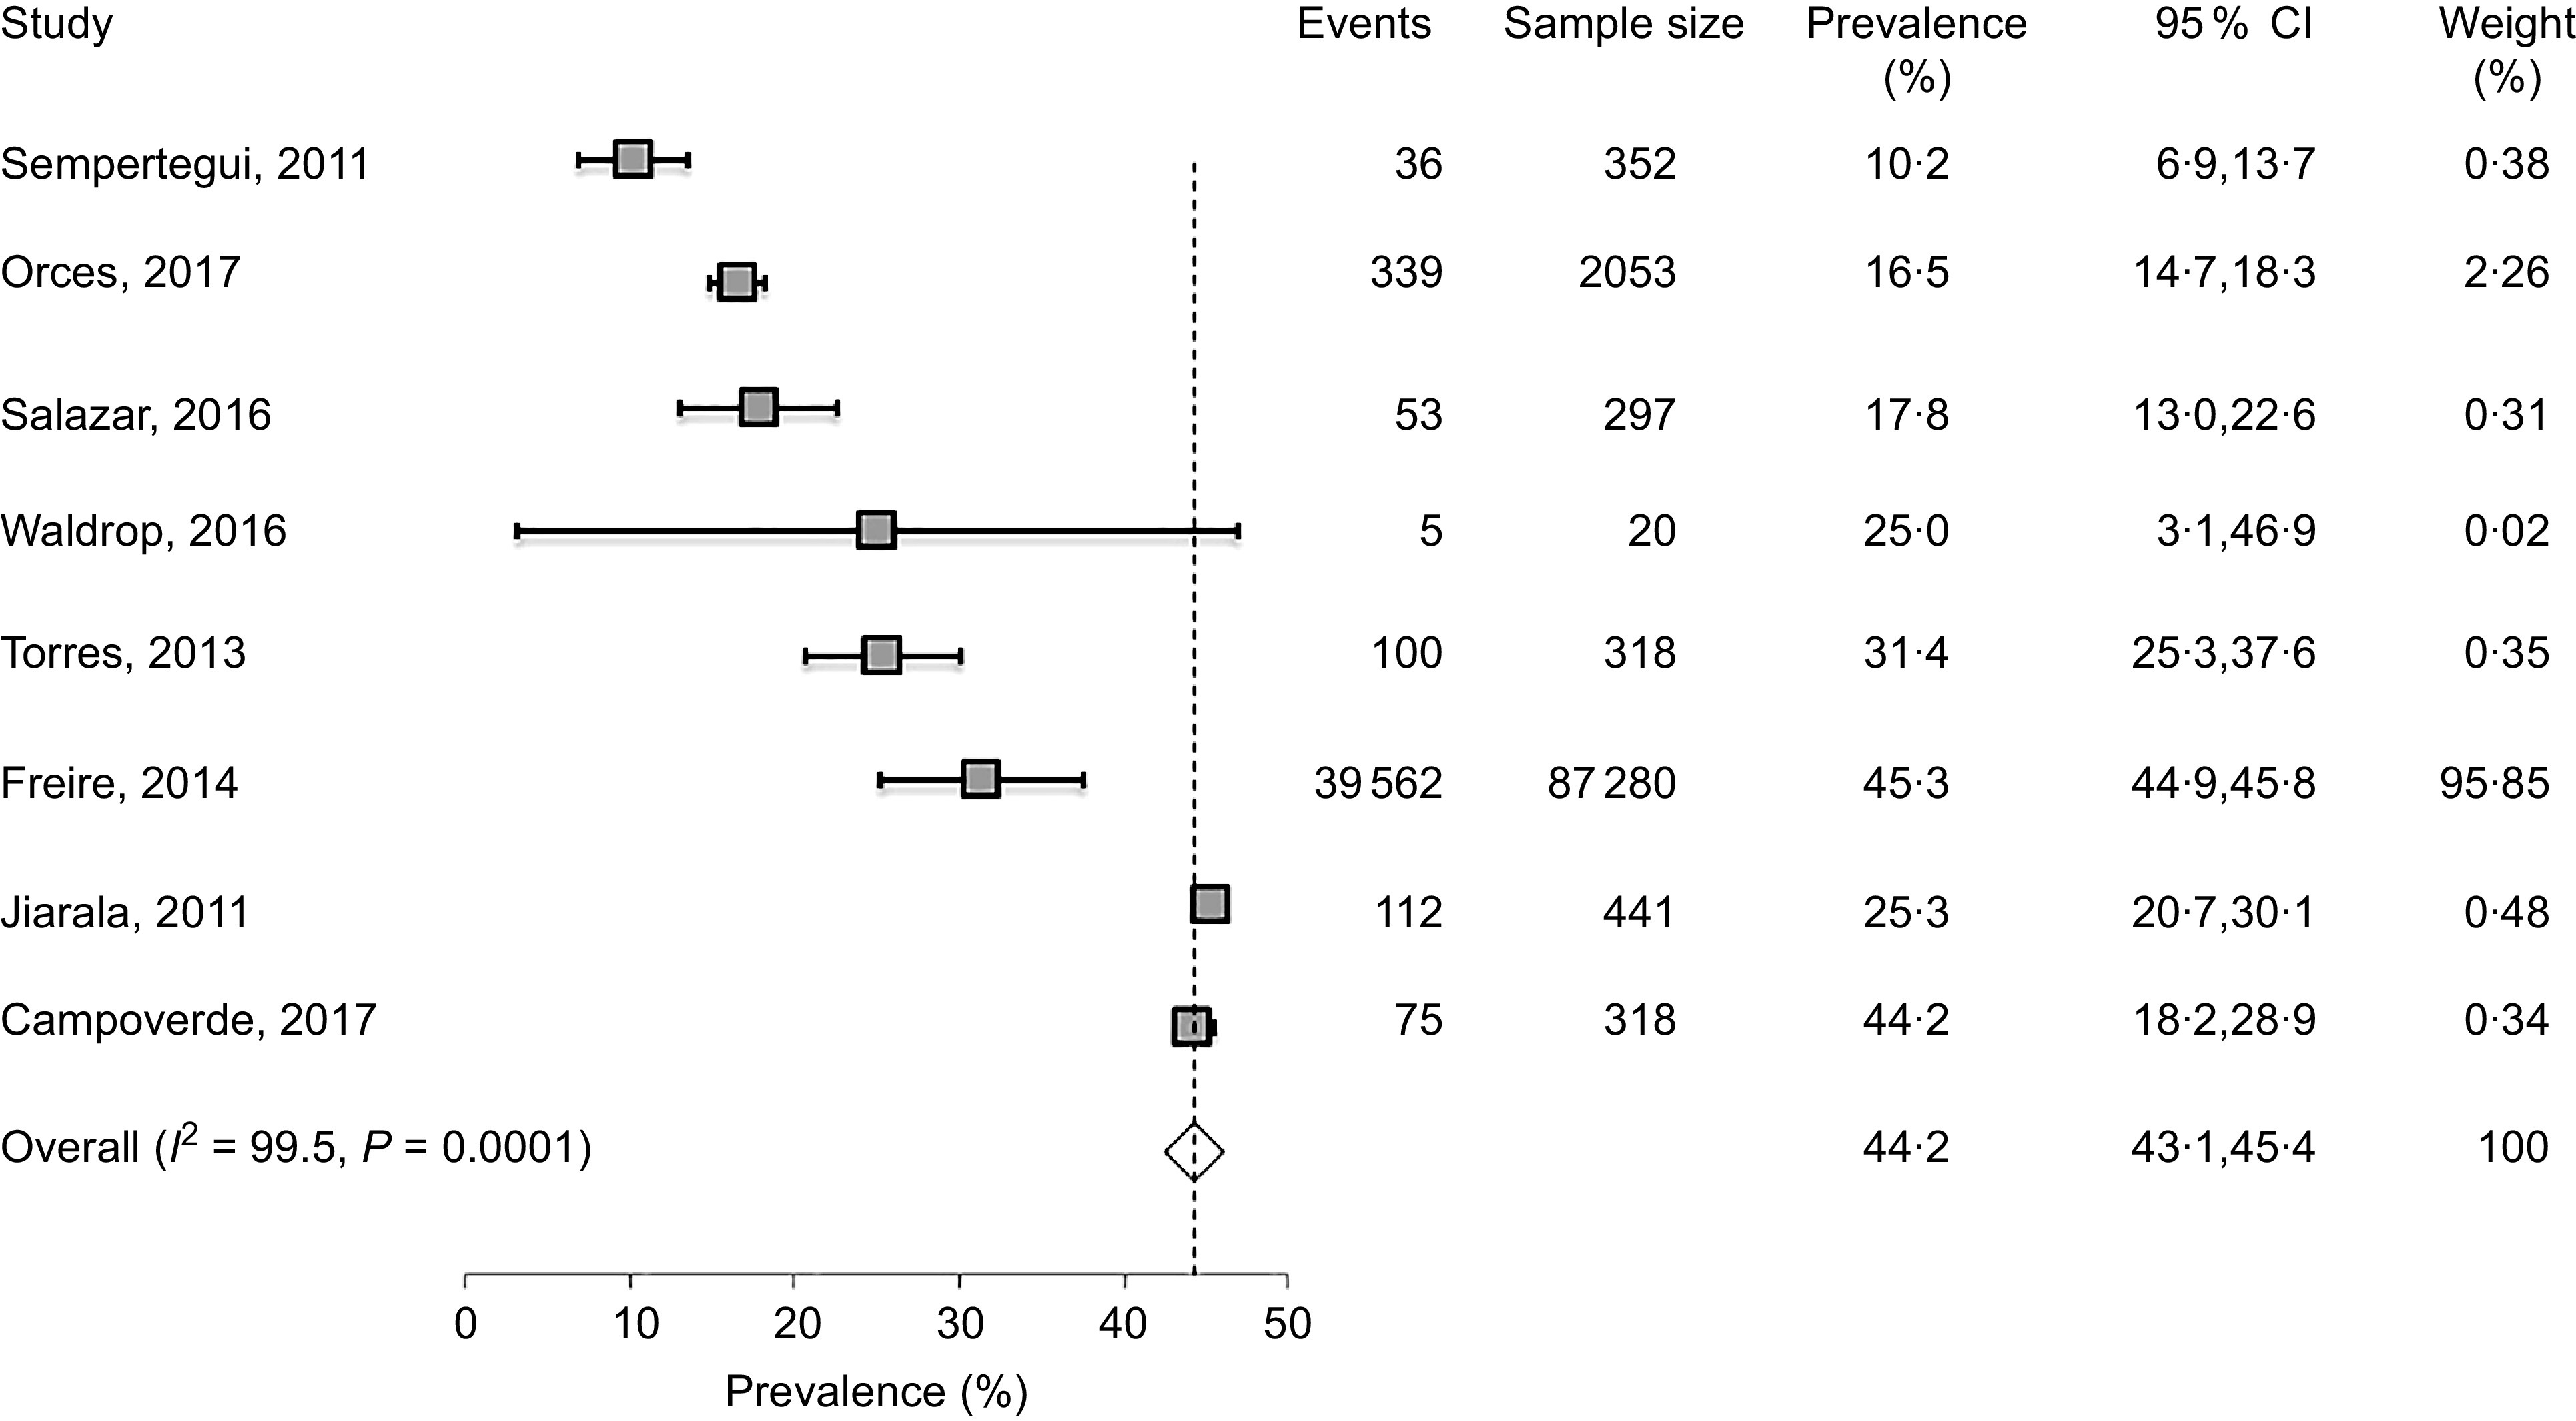
Forest plot of a random effects meta-analysis of the prevalence of obesity in adults (age ≥ 19 years). Values are standardised mean differences (95 % CI). The shaded squares represent the point estimate for each individual study, and the horizontal line extending from each square represents the upper and lower limits of the 95 % CI. The white diamonds represent the overall estimate of pooled prevalence in percentage
Discussion
This review sought to assess the prevalence of stunting and obesity in Ecuador and to provide a summary of available evidence on this topic. Overall, this study reports several key observations. First, stunting is markedly high among children and adolescent nationwide, but is mostly prevalent in low-income population including Indigenous and rural communities. Second, stunting co-exists with excess weight and obesity mostly in Indigenous communities, suggesting a possible causal relationship. Third, the prevalence of obesity is sensibly high in adults and is not equally distributed among ethnicities and rural–urban locations.
The present review emphasises the high prevalence of stunting in Ecuador and its heterogeneous distribution among ethnicities and geographical regions. In preschoolers, while average prevalence was about 23 %, it was markedly higher in Indigenous populations and rural regions reaching an alarming rate of 50 %. In comparison with surrounding countries, average estimate of stunting in Ecuador is relatively lower than Bolivia (41·6 %) and Guatemala (54·5 %), but remains relatively higher than Argentina (12·8 %) and Brazil (10·5 %)(44). Despite these variations, shared observation among these countries indicates that deprived subpopulations are the most affected by stunting(24,38,45,46). In Ecuador, most Indigenous populations are dispersed in remote locations in the Amazon forest and highland regions with poor access to food sources and healthcare facilities(9). The disparity of the occurrence of stunting is deeply rooted in differences of the socio-economic status with poverty and deprivation affecting mainly populations residing in rural remote areas such as Amazon forest and highlands of Andes Mountains(9,12) or impoverished neighbourhoods surrounding major cities with high unemployment(28,38,47).
Although several factors may contribute collectively to the manifestation of stunting, chronic undernutrition remains the most determinant cause of children development and health status(10,44,45,48). In Ecuador, several studies have reported the existence of severe nutritional deficiencies which could explain the high occurrence of stunting(3,32,41,47). In line with this, nutritional deficiencies, such as Fe and Zn deficiency, have been detected in stunted children as well as mothers(3,44). Similarly, other nutritional deficiencies exemplified by vitamin D deficiency(9) were also reported throughout the country but were mostly prevalent in rural and highland regions(9). It is known that agricultures at high altitudes are often associated with poorer crop production(45), lower nutritional value of food(46,49) and fewer income-generating options(45). As a result, children residing in these regions may experience inadequate essential nutrient intake(46,49,50) and less access to good-quality complementary foods(49). The importance of growth-limiting nutrient deficiencies is highlighted by some studies showing that complementary foods significantly improved children growth in Indigenous and rural communities(51,52).
In Ecuador, age distribution of stunting in preschoolers indicates that the rate of stunting increased rapidly from 5 to 6 months onwards until about 24 months, an age when the rate of stunting reached 35·9 %(23). Similar patterns of accelerated growth faltering during the 6–24-month period were also reported in other countries(53–55). It is not clear why this growth faltering occurs mostly during the period 6–24 months. It is, however, noteworthy to indicate that this time coincides with a reduction or cessation of breast-feeding which may increase the risk of nutritional deficiencies, seriously compromising normal growth of children(26). This suggests that poor feeding practices might play an important role in influencing the growth of children, mostly after 6 months of age. In Ecuador, children in low-income families are given common adult foods often with low nutritive value and hard to digest given the fragile digestive system at this age. These findings highlight a time frame for the development of childhood nutritional defects and could help to elaborate preventive interventions to curb the development of stunting at its early stages.
The high prevalence of stunting represents an important challenge in a country with limited resources like Ecuador. Stunting in childhood has short-term and long-term negative repercussions on human health and economic development(56). In addition to reduced physical growth and increased risks of morbidity and mortality(6,44,57), stunting is also associated with diminished cognitive and motor development(58,59) which may lead to poor academic achievement and low economic productivity(56,60). In relation to this, the evidence from Ecuador has been presented in a study of over 3000 preschool-age children, showing that stunting is associated with significant inferior language skills(61). In light of the results of this study, and knowing the lifetime cost of stunting, it is imperative that Ecuador elaborates and maintains a comprehensive strategy to address the root factors that lead to stunting. Such action is beneficial to human health as well as the country’s overall economic growth.
In addition to stunting, Ecuador is experiencing a high occurrence of obesity in adults. In general, the distribution of these conditions is defined mostly by economic inequality between communities, in that stunting is mostly affecting poor communities while obesity is encountered largely in economically advantaged urban residents(8,35). This pattern of independent distribution does not, however, explain the fact that stunting and obesity co-exist within the same Indigenous communities in Ecuador(3) and other countries(59,62). While this coexistence is unexpected, since stunting is caused by undernutrition and obesity is the result of over-nutrition, previous studies indicated that early life stunting is a risk factor for the development of obesity at later age(59,62,63) through a physiological adaptation mechanism referred to as ‘catch-up’ or ‘post-starvation obesity’(64–67). Because stunting and obesity, considered separately, each presents an important risk factor for the development of diseases, the co-existence of both conditions represents a double burden that increases tremendously public health concerns.
Although most studies reported in this review are recent and do not allow the assessment of the occurrence of obesity over time, there is a strong evidence that current rate of obesity is high among adult Ecuadorians. Moreover, the rate of obesity increases with age and is more prevalent in urban than rural regions. Similar heterogeneous trends were also reported in LMIC as well as high-income countries(1,68) – an indication that obesity is a common problem worldwide. Several factors could contribute to rural–urban disparity of obesity prevalence including diet composition and physical activity. In Ecuador, as is the case for most LMIC, obesity is associated with a fast trend of mechanisation and urbanisation which is also accompanied with important shifts in diet composition and physical activity. In the urban areas, reduced physical activity and increased consumption of ultra-processed energy-dense foods, to the detriment of traditional plant-based foods, contribute substantially to the development of obesity(3,11,13). Because obesity is often associated with diabetes and CVD(7,69), it is possible that increased risks of CVD in Ecuador(70–72) are linked to the rise of obesity(8). Taken together, these findings indicate that national effort towards the prevention and treatment of obesity, as well as undernutrition, should be a public health priority in Ecuador to limit the risk of co-morbidities.
Strengths and limitations of the study
The strengths of this review include a comprehensive and rigorous systematic search using well-established PRISMA guidelines. In addition, this search included multiple and widely known databases as well as uniform and reproducible data extraction using a preset checklist so as to minimise errors and bias(14). This review also included studies from different regions of the country. Like any systematic review, mainly from observational studies, this study has limitations. First, we included only studies published in international and peer-reviewed journals and may have missed important unpublished data or local/internal reports which is a common practice in some countries. Second, there was some variation and heterogeneity of sample size among studies which may have introduced some weakness in the meta-analysis. It is, however, important to indicate that our results are in agreement with other studies in South America and in other parts of the world(47,53,58). Third, this review did not calculate the effect of specific factors on the study outcomes, such as ethnicity, age and geographic location. This was due to the fact that the number of studies considering these factors was very limited and did not allow statistical analysis. Therefore, we included all studies to calculate overall pooled estimates and described the impact of these factors narratively in the results citing references when available. Finally, because most studies were relatively recent and did not allow an assessment over time, this review does not provide information on the longitudinal evolution of the study outcomes.
Conclusions
The prevalence of stunting is markedly high nationwide, but is mostly prevalent in low-income population including Indigenous and rural communities. In addition, the prevalence of obesity is strikingly elevated in adults and is not equally distributed among ethnicities and rural–urban locations. The existence of this double burden – stunting and obesity – represents a major public health concern that requires further robust and sustained interventions.
Acknowledgements
Acknowledgements: The authors would like to thank Dr. Thomas Fungwe for helpful discussion. Financial support: This work was made possible by the generous support of Hackensack University Medical Center. Conflicts of interest: None. Authorship: The authors’ contribution is as follows: V.A.A. and L.C. conducted the initial search. V.A.A., L.C. and T.H. analysed the data, designed and wrote the manuscript. All authors (T.H., V.A.A. and L.C.) read and approved the manuscript. Ethics of human subject participation: Not applicable.
Supplementary material
For supplementary material accompanying this paper visit https://doi.org/10.1017/S1368980020002049.
click here to view supplementary material
References
- 1.Ng M, Fleming T, Robinson M et al. (2014) Global, regional, and national prevalence of overweight and obesity in children and adults during 1980–2013: a systematic analysis for the Global Burden of Disease Study. Lancet 384, 766–781. [DOI] [PMC free article] [PubMed] [Google Scholar]
- 2.Collaboration NCDRF (2017) Worldwide trends in body-mass index, underweight, overweight, and obesity from 1975 to 2016: a pooled analysis of 2416 population-based measurement studies in 128.9 million children, adolescents, and adults. Lancet 390, 2627–2642. [DOI] [PMC free article] [PubMed] [Google Scholar]
- 3.Freire WB, Silva-Jaramillo KM, Ramirez-Luzuriaga MJ et al. (2014) The double burden of undernutrition and excess body weight in Ecuador. Am J Clin Nutr 100, 1636s–1643s. [DOI] [PubMed] [Google Scholar]
- 4.Hawkes C, Demaio AR & Branca F (2017) Double-duty actions for ending malnutrition within a decade. Lancet Global Health 5, e745–e746. [DOI] [PubMed] [Google Scholar]
- 5.Stevens GA, Finucane MM, Paciorek CJ et al. (2012) Trends in mild, moderate, and severe stunting and underweight, and progress towards MDG 1 in 141 developing countries: a systematic analysis of population representative data. Lancet 380, 824–834. [DOI] [PMC free article] [PubMed] [Google Scholar]
- 6.Caulfield LE, de Onis M, Blossner M et al. (2004) Undernutrition as an underlying cause of child deaths associated with diarrhea, pneumonia, malaria, and measles. Am J Clin Nutr 80, 193–198. [DOI] [PubMed] [Google Scholar]
- 7.Aballay LR, Eynard AR, Diaz Mdel P et al. (2013) Overweight and obesity: a review of their relationship to metabolic syndrome, cardiovascular disease, and cancer in South America. Nutr Rev 71, 168–179. [DOI] [PubMed] [Google Scholar]
- 8.Orces CH, Montalvan M, Tettamanti D et al. (2017) Prevalence of abdominal obesity and its association with cardio metabolic risk factors among older adults in Ecuador. Diab Metab Syndr 11, Suppl. 2, S727–S733. [DOI] [PubMed] [Google Scholar]
- 9.Robalino FdRX, Balladares A, Guerendiain M et al. (2017) Anthropometric and hematological tests to diagnosis nutritional deficiencies in school children of indigenous communities living in the Andean region of Ecuador. Rev Nutr 30, 723–733. [Google Scholar]
- 10.Fotso JC (2006) Child health inequities in developing countries: differences across urban and rural areas. Int J Equity Health 5, 9–17. [DOI] [PMC free article] [PubMed] [Google Scholar]
- 11.Galicia L, Grajeda R & de Romana DL (2016) Nutrition situation in Latin America and the Caribbean: current scenario, past trends, and data gaps. Rev Panam Salud Publica 40, 104–113. [PubMed] [Google Scholar]
- 12.Katuli S, Natto ZS, Beeson L et al. (2013) Nutritional status of highland and lowland children in Ecuador. J Trop Pediatr 59, 3–9. [DOI] [PubMed] [Google Scholar]
- 13.Ochoa-Aviles A, Verstraeten R, Lachat C et al. (2009) Dietary intake practices associated with cardiovascular risk in urban and rural Ecuadorian adolescents: a cross-sectional study. BMC Public Health 14, 939–950. [DOI] [PMC free article] [PubMed] [Google Scholar]
- 14.Moher D, Liberati A, Tetzlaff J et al. (2009) Preferred reporting items for systematic reviews and meta analyses: the PRISMA statement. PLoS Med 6, e1000097. [DOI] [PMC free article] [PubMed] [Google Scholar]
- 15.de Onis M, Onyango A, Borghi E et al. (2012) Worldwide implementation of the WHO Child Growth Standards. Public Health Nutr 15, 1603–1610. [DOI] [PubMed] [Google Scholar]
- 16.Aschner P, Buendia R, Brajkovich I et al. (2011) Determination of the cutoff point for waist circumference that establishes the presence of abdominal obesity in Latin American men and women. Diabetes Res Clin Pract 93, 243–247. [DOI] [PubMed] [Google Scholar]
- 17.de Onis M, Onyango AW & Borghi E (2007) Development of a WHO growth reference for school-aged children and adolescents. Bull World Health Organ 85, 660–667. [DOI] [PMC free article] [PubMed] [Google Scholar]
- 18.DerSimonian R & Laird N (1986) Meta-analysis in clinical trials. Control Clin Trials 7, 177–188. [DOI] [PubMed] [Google Scholar]
- 19.Higgins JP, Thompson SG, Deeks JJ et al. (2003) Measuring inconsistency in meta-analyses. BMJ 327, 557–560. [DOI] [PMC free article] [PubMed] [Google Scholar]
- 20.Neyeloff JL, Fuchs SC & Moreira LB (2012) Meta-analyses and Forest plots using a microsoft excel spreadsheet: step-by-step guide focusing on descriptive data analysis. BMC Res Notes 5, 52. [DOI] [PMC free article] [PubMed] [Google Scholar]
- 21.Wells GA, Shea B, Paterson J et al. (2011) The Newcastle-Ottawa Scale (NOS) for assessing the quality of nonrandomised studies in meta-analyses. http://www.ohri.ca/programs/clinical_epidemiology/oxford.asp (accessed March 2018).
- 22.Nansseu JR, Noubiap JJ, Mengnjo MK et al. (2016) The highly neglected burden of resistant hypertension in Africa: a systematic review and meta-analysis. BMJ Open 6, e011452. [DOI] [PMC free article] [PubMed] [Google Scholar]
- 23.World Bank (2007) Nutritional Failure in Ecuador: Causes, Consequences and Solutions. Washington, DC: World Bank. [Google Scholar]
- 24.Ortiz J, Van Camp J, Wijaya S et al. (2014) Determinants of child malnutrition in rural and urban Ecuadorian highlands. Public Health Nutr 17, 2122–2130. [DOI] [PMC free article] [PubMed] [Google Scholar]
- 25.Cambizaca GC, Sanabria G & Morocho L (2016) Factores que predisponen al sobrepeso y obesidad en estudiantes de colegios fiscales del canton Loja- Ecuador [Factors that predispose overweight and obesity in students from public schools in Loja, Ecuador]. Rev Habanera de Ciencias Medicas 15, 163–176. [Google Scholar]
- 26.Flor-Garrido P, Romo ML & Abril-Ulloa V (2016) Differences in nutritional status, physical activity, and fruit and vegetables consumption in urban and rural schooling-going adolescents in Paute, Ecuador. Arch Latinoam Nutr 66, 230–238. [PubMed] [Google Scholar]
- 27.Waldrop JB, Page RA & Bentley ME (2016) Perceptions of body size in mothers and their young children in the Galapagos Islands. Matern Child Health J 20, 2012–2018. [DOI] [PMC free article] [PubMed] [Google Scholar]
- 28.Arsenault JE & Brown KH (2017) Dietary protein intake in young children in selected low-income countries is generally adequate in relation to estimated requirements for healthy children, except when complementary food intake is low. J Nutr 147, 932–939. [DOI] [PMC free article] [PubMed] [Google Scholar]
- 29.Leon VA, Terry BB & Quintana JI (2009) Estado nutricional en ninos menores de 5 anos en un consultorio de Babahoyo (Republica de Ecuador) [Nutritional status of children below 5 year of age in an outpatient office in Babahoyo – Ecuador]. Revista Cubana Higiene Epidemiologia. V.47, N.1. Recovered from de http://scielo.sld.cu/scielo.php?pid=S156130032009000100003&script=sci_arttext (accessed February 2018).
- 30.So M, Ellenikiotis YA, Husby HM et al. (2017) Early childhood dental caries, mouth pain, and malnutrition in the Ecuadorian amazon region. Int J Environ Res Public Health 14, 1–12. [DOI] [PMC free article] [PubMed] [Google Scholar]
- 31.Diaz-Granda R & Huiracocha L (2015) Evaluacion antropometrica de los preescolares de la zona urbana en Cuenca, Ecuador [Anthropometric evaluation of preschoolers in the urban area in Cuenca, Ecuador]. Maskana 2, 135–146. [Google Scholar]
- 32.Handal AJ, Lozoff B, Breilh J et al. (2007) Sociodemographic and nutritional correlates of neurobehavioral development: a study of young children in a rural region of Ecuador. Rev Panam Salud Publica 21, 292–300. [DOI] [PubMed] [Google Scholar]
- 33.Oleas M (2014) Overweight and obesity prevalence and risk factors in school children. Imbabura province. Ecuador. Rev Child Nutri 41, 61–67. [Google Scholar]
- 34.Ramos P, Carpio T, Delagado V et al. (2015) Sobrepeso y obesidad en escolares y adolescentes del area urbana de la cuidad de Riobamba, Ecuador [Overweight and obesity in schoolchildren and adolescents in the urban area of Riobamba, Ecuador]. Rev Esp Nutr Hum Diet 19, 21–27. [Google Scholar]
- 35.Yepez R, Carrasco F & Baldeon ME (2008) Prevalencia de sobrepeso y obesidad en estudiantes adolescentes ecuatorianos del area urbana [Prevalence of overweight and obesity in adolescent students from Ecuadorean urban areas]. Arch Latinoam Nutr 58, 139–143. [PubMed] [Google Scholar]
- 36.Castro Burbano J, Fornasini M & Acosta M (2003) Prevalence of and risk factors for overweight among school girls 12 to 19 year old in semiurban region of Ecuador. Rev Panam Salud Publica 15, 277–284. [DOI] [PubMed] [Google Scholar]
- 37.Casapulla SL, Howe CA, Mora GR et al. (2017) Cardiometabolic risk factors, metabolic syndrome and prediabetes in adolescents in the Sierra region of Ecuador. Diabetol Metab Syndr 9, 24–32. [DOI] [PMC free article] [PubMed] [Google Scholar]
- 38.Freire WR, Ramirez MJ, Belmont P et al. (2013) Resumen Ejecutivo. Tomo I. Encuesta Nacional de Salud Y Nutricion del Ecuador. ENSANUT ECU 2011–2013 Ministerio de Salud Plublica/Instituto Nacional de Estadistica y Censos [Executive Summary. Volume I. National Survey of Health and Nutrition of Ecuador. ENSANUT ECU 2011–2013, Ministry of Public Health/National Institute of Statistics and Census]. Edition 1, Quito Ecuador. https://www.unicef.org/ecuador/esanut-2011–2013–2bis.pdf (accessed February 2018).
- 39.Campoverde ME, Anez R, Salazar J et al. (2014) Risk factors for obesity in adults from the city of Cuenca, Ecuador. Rev Latinoam de Hiperte 9, 1–10. [Google Scholar]
- 40.Jairala IH, Aveiga Parra JC, Orus MG et al. (2011) Diagnostico nutricional segun el indice de masa corporal en trabajadores de Guayaquil, Ecuador [Nutritional diagnosis according to the body mass index in Guayaquil workers, Ecuador]. Rev Sindrome Cardiometabolico 11, 1–15. [Google Scholar]
- 41.Sempertegui F, Estrella B, Tucker KL et al. (2011) Metabolic syndrome in the elderly living in marginal peri-urban communities in Quito, Ecuador. Public Health Nutr 14, 758–767. [DOI] [PMC free article] [PubMed] [Google Scholar]
- 42.Lugo S, Saavedra N, Noboa M et al. (2016) Prevalencia de parámetros nutricionales, bioquímicos y estilos de vida en adultos con fenotipos cardiometabólicos de Imbabura, Ecuador [Prevalence of nutritional, biochemical and lifestyle parameters in adults with cardiometabolic phenotypes from Imbabura, Ecuador]. Nutr Clín Diet Hosp 36, 153–161. [Google Scholar]
- 43.Torres MO, Siguenza W, Ortiz R et al. (2013) Prevalencia de la obesidad en individuos adultos en las parroquias urbanas de la ciudad de Cuenca, Ecuador [Prevalence of obesity in adult individuals in the urban townships of Cuenca, Ecuador]. Rev Sindrome Cardiometabolico 3, 76–88. [Google Scholar]
- 44.Black RE, Victora CG, Walker SP et al. (2013) Maternal and child undernutrition and overweight in low income and middle-income countries. Lancet 382, 427–451. [DOI] [PubMed] [Google Scholar]
- 45.Morales R, Aguilar AM & Calzadilla A (2004) Geography and culture matter for malnutrition in Bolivia. Econ Hum Biol 2, 373–389. [DOI] [PubMed] [Google Scholar]
- 46.Gragnolati M & Marini A (2006) Nonlinear Effects of Altitude on Child Growth in Peru : A Multilevel Analysis: Policy Research Working Paper Series: 3823. The World Bank e-Library. doi: 10.1596/1813507 9450-3823.
- 47.Freire WB, Belmont P, Lopez-Cevallos DF et al. (2015) Ecuador’s national health and nutrition survey: objectives, design, and methods. Ann Epidemiol 25, 877–878. [DOI] [PubMed] [Google Scholar]
- 48.Jehn M & Brewis A (2009) Paradoxical malnutrition in mother-child pairs: untangling the phenomenon of over- and under-nutrition in underdeveloped economies. Econ Hum Biol 7, 28–35. [DOI] [PubMed] [Google Scholar]
- 49.Leonard WR, Dewalt KM, Stansbury JP et al. (2000) Influence of dietary quality on the growth of highland and coastal Ecuadorian children. Am J Hum Biol 12, 825–837. [DOI] [PubMed] [Google Scholar]
- 50.Berti PR, Leonard WR & Berti WJ (1998) Stunting in an Andean Community: prevalence and Etiology. Am J Hum Biol 10, 229–240. [DOI] [PubMed] [Google Scholar]
- 51.Iannotti LL, Lutter CK, Waters WF et al. (2017) Eggs early in complementary feeding increase choline pathway biomarkers and DHA: a randomized controlled trial in Ecuador. Am J Clin Nutr 106, 1482–1489. [DOI] [PMC free article] [PubMed] [Google Scholar]
- 52.Roy SK, Jolly SP, Shafique S et al. (2007) Prevention of malnutrition among young children in rural Bangladesh by a food-health-care educational intervention: a randomized, controlled trial. Food Nutr Bull 28, 375–383. [DOI] [PubMed] [Google Scholar]
- 53.Kroker-Lobos MF, Pedroza-Tobias A, Pedraza LS et al. (2014) The double burden of undernutrition and excess body weight in Mexico. Am J Clin Nutr 100, 1652S–1658S. [DOI] [PubMed] [Google Scholar]
- 54.Alderman H & Headey D (2018) The timing of growth faltering has important implications for observational analyses of the underlying determinants of nutrition outcomes. PLoS One 13, e0195904. [DOI] [PMC free article] [PubMed] [Google Scholar]
- 55.Roth DE, Krishna A, Leung MS et al. (2017) Early childhood linear growth faltering in low-income and middle income countries as a whole-population condition: analysis of 179 Demographic and Health Surveys from 64 countries (1993–2015). Lancet Global Health 5, e1249–e1257. [DOI] [PMC free article] [PubMed] [Google Scholar]
- 56.McGovern ME, Krishna A, Aguayo VM et al. (2017) A review of the evidence linking child stunting to economic outcomes. Int J Epidemiol 46, 1171–1191. [DOI] [PMC free article] [PubMed] [Google Scholar]
- 57.Ozaltin E, Hill K & Subramanian SV (2010) Association of maternal stature with offspring mortality, underweight, and stunting in low- to middle-income countries. JAMA 303, 1507–1516. [DOI] [PMC free article] [PubMed] [Google Scholar]
- 58.Casale D, Desmond C & Richter L (2014) The association between stunting and psychosocial development among preschool children: a study using the South African Birth to Twenty cohort data. Child Care Health Dev 40, 900–910. [DOI] [PubMed] [Google Scholar]
- 59.Ramirez-Zea M, Kroker-Lobos MF, Close-Fernandez R et al. (2014) The double burden of malnutrition in indigenous and nonindigenous Guatemalan populations. Am J Clin Nutr 100, 1644S–16451S. [DOI] [PubMed] [Google Scholar]
- 60.Pollitt E, Gorman KS, Engle PL et al. (1995) Nutrition in early life and the fulfillment of intellectual potential. J Nutr 125, 1111s–1118s. [DOI] [PubMed] [Google Scholar]
- 61.Paxson C & Schady N (2007) Cognitive development among young children in Ecuador: the roles of wealth, health, and parenting. J Hum Resour 42, 49–84. [Google Scholar]
- 62.Vonaesch P, Tondeur L, Breurec S et al. (2017) Factors associated with stunting in healthy children aged 5 years and less living in Bangui (RCA). PLoS One 12, e0182363. [DOI] [PMC free article] [PubMed] [Google Scholar]
- 63.Sudfeld CR, McCoy DC, Danaei G et al. (2015) Linear growth and child development in low- and middle income countries: a meta-analysis. Pediatrics 135, e1266–e1275. [DOI] [PubMed] [Google Scholar]
- 64.Hoffman DJ, Martins PA, Roberts SB et al. (2007) Body fat distribution in stunted compared with normal height children from the shantytowns of Sao Paulo, Brazil. Nutrition 23, 640–646. [DOI] [PubMed] [Google Scholar]
- 65.Martins PA, Hoffman DJ, Fernandes MT et al. (2004) Stunted children gain less lean body mass and more fat mass than their non-stunted counterparts: a prospective study. Br J Nutr 92, 819–825. [DOI] [PubMed] [Google Scholar]
- 66.Prioreschi A, Munthali RJ, Kagura J et al. (2018) The associations between adult body composition and abdominal adiposity outcomes, and relative weight gain and linear growth from birth to age 22 in the Birth to Twenty Plus cohort, South Africa. PLoS One 13, e0190483. [DOI] [PMC free article] [PubMed] [Google Scholar]
- 67.Savanur MS & Ghugre PS (2016) BMI, body fat and waist-to-height ratio of stunted v. non-stunted Indian children: a case-control study. Public Health Nutr 19, 1389–1396. [DOI] [PMC free article] [PubMed] [Google Scholar]
- 68.Lanas F, Bazzano L, Rubinstein A et al. (2016) Prevalence, distributions and determinants of obesity and central obesity in the Southern Cone of America. PLoS One 11, e0163727. [DOI] [PMC free article] [PubMed] [Google Scholar]
- 69.Gharib M, Kaul S, LoCurto J et al. (2015) The obesity factor in critical illness: between consensus and controversy. J Trauma Acute Care Surg 78, 866–873. [DOI] [PubMed] [Google Scholar]
- 70.Hernandez-Hernandez R, Silva H, Velasco M et al. (2010) Hypertension in seven Latin American cities: the Cardiovascular risk factor multiple evaluation in latin America (CARMELA) study. J Hypertens 28, 24–34. [DOI] [PubMed] [Google Scholar]
- 71.Pagan E, Chatenoud L, Rodriguez T et al. (2017) Comparison of trends in mortality from coronary heart and cerebrovascular diseases in North and South America: 1980 to 2013. Am J Cardiol 119, 862–871. [DOI] [PubMed] [Google Scholar]
- 72.Miranda JJ, Herrera VM, Chirinos JA et al. (2013) Major cardiovascular risk factors in Latin America: a comparison with the United States: The Latin American Consortium of Studies in Obesity (LASO). PLoS One 564, e54056. [DOI] [PMC free article] [PubMed] [Google Scholar]
Associated Data
This section collects any data citations, data availability statements, or supplementary materials included in this article.
Supplementary Materials
For supplementary material accompanying this paper visit https://doi.org/10.1017/S1368980020002049.
click here to view supplementary material