

Abstract
Urinary glycoproteins associated with aggressive prostate cancer (AG-PCa) were previously reported using post-digital rectal examination (DRE) urine specimens. To explore the potential of using pre-DRE urine specimens for detecting AG-PCa, we compared glycoproteins between pre- and post-DRE urine specimens, verified the previously identified post-DRE AG-PCa-associated urinary glycoproteins in pre-DRE urine specimens, and explored potential new glycoproteins for AG-PCa detection in pre-DRE urine specimens. Quantitative glycoproteomic data were acquired for 154 pre-DRE urine specimens from 41 patients with no cancer at biopsy, 48 patients with non-AG-PCa (Gleason score = 6), and 65 patients with AG-PCa (Gleason score 7 or above). Compared to glycopeptides from the post-DRE urine data, humoral immunity-related proteins were enriched in pre-DRE urine samples, whereas immune cell-related proteins were enriched in post-DRE urine samples. Analyses of AG-PCa-associated glycoproteins from pre-DRE urine revealed that the three urinary glycoproteins, prostate-specific antigen (PSA), prostatic acid phosphatase (ACPP), and CD97 antigen (CD97) that were previously identified in post-DRE urine samples were also observed as AG-PCa associated glycoproteins in pre-DRE urine. In addition, we identified 3 new glycoproteins, Fibrillin 1 (FBN1), Vitronectin (VTN) and Hemicentin 2 (HMCN2), to be potentially associated with AG-PCa in pre-DRE urine specimens. In summary, glycoprotein profiles differ between pre- and post-DRE urine specimens. The identified AG-PCa-associated glycoproteins may be further evaluated in large cohort of pre-DRE urine specimens for detecting clinically significant PCa.
Keywords: aggressive prostate cancer, digital rectal examination, urinary glycoproteins, glycoproteomics, mass spectrometry
Introduction
As of 2022, prostate cancer (PCa) in males was the most frequently diagnosed cancer, with 268,490 new cases annually in the United States alone [1], an increase of ~20,000 cases from the previous year (248,530 new cases in 2021) [2]. PCa is the second leading cause of death (34,500 deaths in 2021) in male population in the United States [1]. Approximately 80% of males diagnosed with PCa have a low risk of cancer progression and limited threat to their life, even without clinical therapy [3], and are thought to have a life expectancy of 10 years [4]. It is crucial to monitor the development of low-risk PCa, also known as indolent or nonaggressive PCa (NAG-PCa), to prevent the progression to aggressive PCa (AG-PCa), thus improving the patient’s quality of life and reducing the mortality rate. However, the unpredictability of clinical PCa diagnostic tests has affected the prognosis of PCa for decades [5]. Therefore, it is necessary to identify biomarkers that can be applied to very early stages of PCa to predict the trajectory of progression from indolent, NAG-PCa to AG-PCa.
Cancer-related proteins in body fluids in the specific tumor type not only reliably determine the origin of the disease but also reflect disease-specific changes suggestive of the disease state. In addition, the accessibility in body fluids make them good biomarker candidates for non-invasive cancer diagnostics [6,7]. Most extracellular proteins are glycoproteins, which include secreted proteins, transmembrane proteins, and cell surface proteins [8,9]. The accessibility of these glycoproteins in body fluids for cancer diagnostics explains the clinical utility of the glycoproteins as the major class of biomarkers [10], and most proteins approved by the US Food and Drug Administration as tumor markers are glycoproteins [11]. To identify new circulation biomarkers associated with AG and Non-AG PCa diseases, biomarker candidates were selected or triaged based on glycoproteomics data derived from AG- and NAG-PCa tissues, which identified several glycoproteins associated with AG-PCa, thereby providing important breakthroughs in the analysis of extracellular or secreted glycoproteins [12–18].
Compared with serum, urine is an ideal biospecimen for the noninvasive biomarker discovery of PCa [19,20]. In blood, secretory proteins from cancer tissues are diluted as they get mixed with proteins secreted from various other tissues and organs, resulting in decreased sensitivity and specificity for detecting PCa-specific proteins. Further, the anatomic location of the prostate gland in the genitourinary system is advantageous for detecting disease-related tumor cells, DNA, RNA, and proteins in the urine [21]. Urine related proteins as surrogates for the early detection of AG-PCa are ideal for biomarker development because urine can be obtained rapidly, inexpensively, reliably, and non-invasively, making it is an easy-to-use biospecimen. Moreover, the prostate and other urological organs secreted vesicles may be released into the urine from the plasma membrane or fusion of intracellular multi-vesicular bodies with the plasma membrane [22]. Interestingly, in our preliminary studies of prostate-specific antigen (PSA) in PCa tissues, sera, and urine samples from patients with AG- and NAG-PCa, we found that urinary proteins were better surrogates for prostate tissues than serum markers [16,19]. We detected significantly lower expression of PSA in the tissue section of AG tumors and in cells that had metastasized to distant organs (lymph node and lung pleural effusion) when PSA was quantified in both the primary localized PCa (AG and Non-AG) and metastatic disease. The lower expression of PSA in aggressive tumors was confirmed by SWATH-MS proteomics analysis [16,23] and by clinical ELISA assay for PSA in urine [24]. These data suggest that urine is a good proxy for proteins from PCa.
We recently applied quantitative global proteomics and glycoproteomics to analyze urine data for AG- and NAG-PCa from post-DRE urine specimens and identified 13 candidate glycoproteins significantly associating with the AG disease, including prostatic acid phosphatase (ACPP), prostate-specific antigen (PSA), clusterin (CLU), CD97 antigen (CD97) [24,25].
Digital rectal examination (DRE) is an invasive procedure performed by physicians to aid in PCa diagnosis. DRE has been used for PCa screening in asymptomatic populations and can significantly change the levels of specific proteins in both urine and serum samples [26,27]. Our previous studies on AG-PCa-associated glycoprotein biomarkers were conducted using post-DRE urine specimens. To promote broad applications and develop a convenient self-test for urinary detection of AG-PCa, biomarkers from pre-DRE urine samples should be evaluated.
In this study, we used the reported automated workflow [24,28,29] for urinary protein isolation and glycopeptide enrichment to evaluate urine samples of post-DRE and pre-DRE to 1) determine the difference in glycoproteins between pre-DRE and post-DRE urine samples, 2) investigate the clinical utility of detecting AG-PCa for the candidate glycoproteins previously identified from post-DRE urine for detecting AG-PCa in pre-DRE urine, and 3) identify AG-PCa-associated glycoproteins in pre-DRE urine.
Materials and methods
Urine specimens
The present study utilized two clinical cohorts that the first cohort was composed of pre-DRE urine samples and the second cohort included post-DRE urine samples. The pre-DRE cohort contained 154 archived first-catch non-DRE urine specimens (41 cancer biopsy negative and 113 PCa with Gleason score ≥6) collected by the Center for Prostate Disease Research (CPDR, Rockville, MD, USA) under an institutional review board approved protocol (IRB# Protocol DBS.2020.135 & 908925) from patients undergoing diagnostic biopsy. The urine samples were collected from men suspicious of prostate cancer prior to diagnostic biopsy. The urine was collected in urine collection cups containing preservative (Assay Assure Genelock; Sierra Diagnostics LLC) and placed on ice. The urine samples were processed by centrifugation at 2000rpm for 10 min to remove the cell debris and then the supernatant was aliquoted in 5ml aliquots and then stored at −80 oC. The post-DRE cohort containing 292 urine specimens (PCa with Gleason score ≥6) were collected by the Department of Urology at Johns Hopkins University School of Medicine (Baltimore, MD, USA). The post-DRE samples have been studied in our previous work [24]. Additionally, we analyzed urine samples from pre-DRE urine specimens with matched post-DRE samples collected from 14 patients. Table S1 listed the clinical information of the urine samples.
Chemicals and reagents
Sep-PAK C18 and Oasis MAX resins were from Waters (Milford, MA, USA). C4 resin (35 µm, 300 Å) was obtained from Separation Methods Technologies (Newark, DE, USA). Lys-C and trypsin were purchased from Promega (Madison, WI, USA). PNGase F was purchased from New England Biolabs (# P0705L, Ipswich, MA, USA). Indexed retention time (iRT) standard peptides were from Biognosys Inc (Zurich, Switzerland). All other chemicals were obtained from Sigma Aldrich (St. Louis, MO, USA). Spike-in peptides with C-terminal lysine or arginine labeled with 13C and 15N were synthetized by Thermo Fisher Scientific (Waltham, MA, USA) and Synpeptide Co. (Shanghai, China).
Automated digestion of human urine specimens by proteases
Each pre-DRE urine sample (500 µL) was desalted, protease digested and followed by intact glycopeptide enrichment automatically on Versette (Thermo Fisher Scientific) following our published experimental workflow [24,28,29]. The desalting and digestion processes were done on C4-tips via conditioning, sample loading, washing and “on-tip” protein digestion steps. The intact glycopeptide enrichment process was done on C18/MAX-tips via conditioning, sample loading, washing, elution of non-glycosylated peptides and elution of glycopeptides. We added 10 µg Lys-C and 10 µg Trypsin for urinary protein digestion of each sample. After the intact glycopeptide enrichment, we added 2 µL PNGaseF to remove all N-linked glycans from glycopeptides. The detailed sample preparation procedure of intact glycopeptide enrichment was referenced as our previous publication [29].
Isolation of N-linked glycopeptides from pre-DRE human urine samples
For pre-DRE samples, we used an automated strategy to enrich intact glycopeptides in the digested urine samples and PNGase F to remove N-glycans, as recently described by our group [28,29,30]. The N-linked glycosite-containing peptides after PNGase F treatment were used for DIA-MS analysis together with iRT peptides in a Orbitrap Exploris™ 480 MS (Thermo Fisher Scientific). Considering the low level of proteins in the pre-DRE samples, half of the total de-glycopeptides enriched from 500 μL urine was used for DIA-MS analysis. The synthetic heavy peptides (100 fmol for each) were spiked into each sample.
LC-MS/MS analysis of urinary N-linked glycosite-containing peptides
The pre-DRE urine samples and 14 patient matched pre-/post-DRE samples were analyzed using DIA-MS on an Orbitrap Exploris™ 480 MS (Thermo Fisher Scientific™) connected to an EASY-nLC 1200 system nano-flow UHPLC (Thermo Fisher Scientific™). PicoFrit® LC-MS Columns (New Objective, MA, USA) were packed at 28 cm long with 1.9 μm/120Å ReproSil-Pur C18 resin (Dr. Maisch, Ammerbuch, Germany) for reversed phase peptide analyses. The N-linked glycosite-containing peptides were separated over a running time of 85 min using a gradient of 6–30 % buffer B (90 % acetonitrile and 0.1 % formic acid, buffer A with 3% acetonitrile and 0.1 % formic acid) at a flow rate of 200 nL/min. The MS parameters were as follows: MS1, AGC target 1 × 10⁶, resolution 120,000, maximum injection time 60 ms, isolation window 12.0 m/z, scan range 400−1200 m/z; MS2, AGC target 1 × 10⁶, resolution 30,000, maximum injection time 50 ms, and collision energy (%) 30. [24,28,29].
Urinary PSA analysis
Specimens were analyzed at the EDRN Biomarker Reference Laboratory at Johns Hopkins University in a blinded fashion on the Beckman Coulter Access 2 Immunoassay Analyzer (BeckmanCoulter, Inc.) for total PSA. The PSA assay utilizes the dual monoclonal antibodies in sandwich assay formats with chemiluminescence detection. The assay characteristics which have minimal cross-reactivity to other PSA isoforms have been previously described [30].
DIA data analysis
All raw DIA data of glycosite-containing peptides from both the pre- and post-DRE samples were analyzed via directDIA, a library-free approach embedded in Spectronaut (version 15) with a precursor and protein q-value cutoff of 1%. The additionally collected 14 paired samples (i.e., pre- and post-DRE urine from the same patient) were analyzed via directDIA independently from the aforementioned pre-DRE and post-DRE samples. The details for the database search are as previous [25]: an allowance for tryptic peptides of up to two missed cleavages within the length range of 7 to 52 amino acids. The fixed modification was on carbamidomethylation of cysteine (C). The variable modifications were on oxidation of methionine (M) and acetylation of protein N-terminal. Since N-glycosylated asparagine (N) is converted to aspartic acid (D) by PNGase F treatment, conversion of N to D was set as a variable modification as well. All other settings were kept as default setting including quantification approach. The database for directDIA searches contains of an iRT fusion protein and human proteins (Swiss-Prot, downloaded on 02/20/2019, 20,418 human proteins). The relative abundances of the glycopeptides from individual urine sample were normalized to the sum of the abundances of all the glycopeptides identified from the same urine sample (considered as the total protein amount) [25,31].
Statistical Analysis
The ability to differentiating two groups of samples (e.g., biopsy-negative vs PCa) through logistic regression was evaluated using receiver operating characteristic (ROC) analysis for the urinary markers and multi-urinary marker panels. The data (missing values were median imputed based on Gleason group/biopsy-negative) were log-transformed followed by z-score prior to ROC analysis. We used bootstrap resampling (n=500) of the data to construct and evaluate the predictive models of presented markers and panels to ensure statistical stability of the results. The mean ROC curves were depicted based on bootstrap resampling results and an area under the curve (AUC) was computed for the mean ROC curve [24]. All the analyses were carried out in R (version 3.5). The predictive models were built using caret (version 6.0–85) and ROC curves and AUCs were generated using pROC (version 1.13).
Results
Differences in urinary glycoprotein profiles between pre- and post-DRE samples
To compare the glycoprotein profiles between pre- and post-DRE urine samples, we analyzed two sets of samples that each contained more than 40 urine specimens from patients with AG-PCa (Gleason score ≥ 7) and 40 urine specimens from patients with NAG-PCa (Table S1). The first set contained pre-DRE urine specimens composed of 41 cancer negative biopsy cases, 48 cases with Gleason score of 6, 27 cases with Gleason score of 3+4, 14 cases with Gleason score of 4+3, and 24 cases with Gleason score ≥8. The second set included post-DRE urine samples from 76, 150, and 67 cases with Gleason scores of 6, 7 (75 cases with Gleason score of 3+4 and 75 cases with Gleason score of 4+3), and ≥ 8, respectively.
Glycoproteomic analysis of the pre- and post-DRE urine samples was performed as previously described [25,32]. After filtering and combining the glycopeptides based on their glycosylation sites, 1,044 glycosite-containing peptides were identified (Table S2). Next, we evaluated differences in the detected glycopeptides between pre- and post-DRE (Figure 1a). In patients with a Gleason score of 6, 315 glycopeptides were commonly identified in > 50% of the pre- and post-DRE urine samples, 66 glycopeptides were only observed in > 50% of pre-DRE urine samples, and 130 glycopeptides were only found in > 50% of post-DRE urine samples. We also compared the other three Gleason score groups for glycopeptides common to both the pre- and post-DRE sets and found similar differences in the identified glycopeptides between these samples as shown in Figure 1a.
Fig. 1.
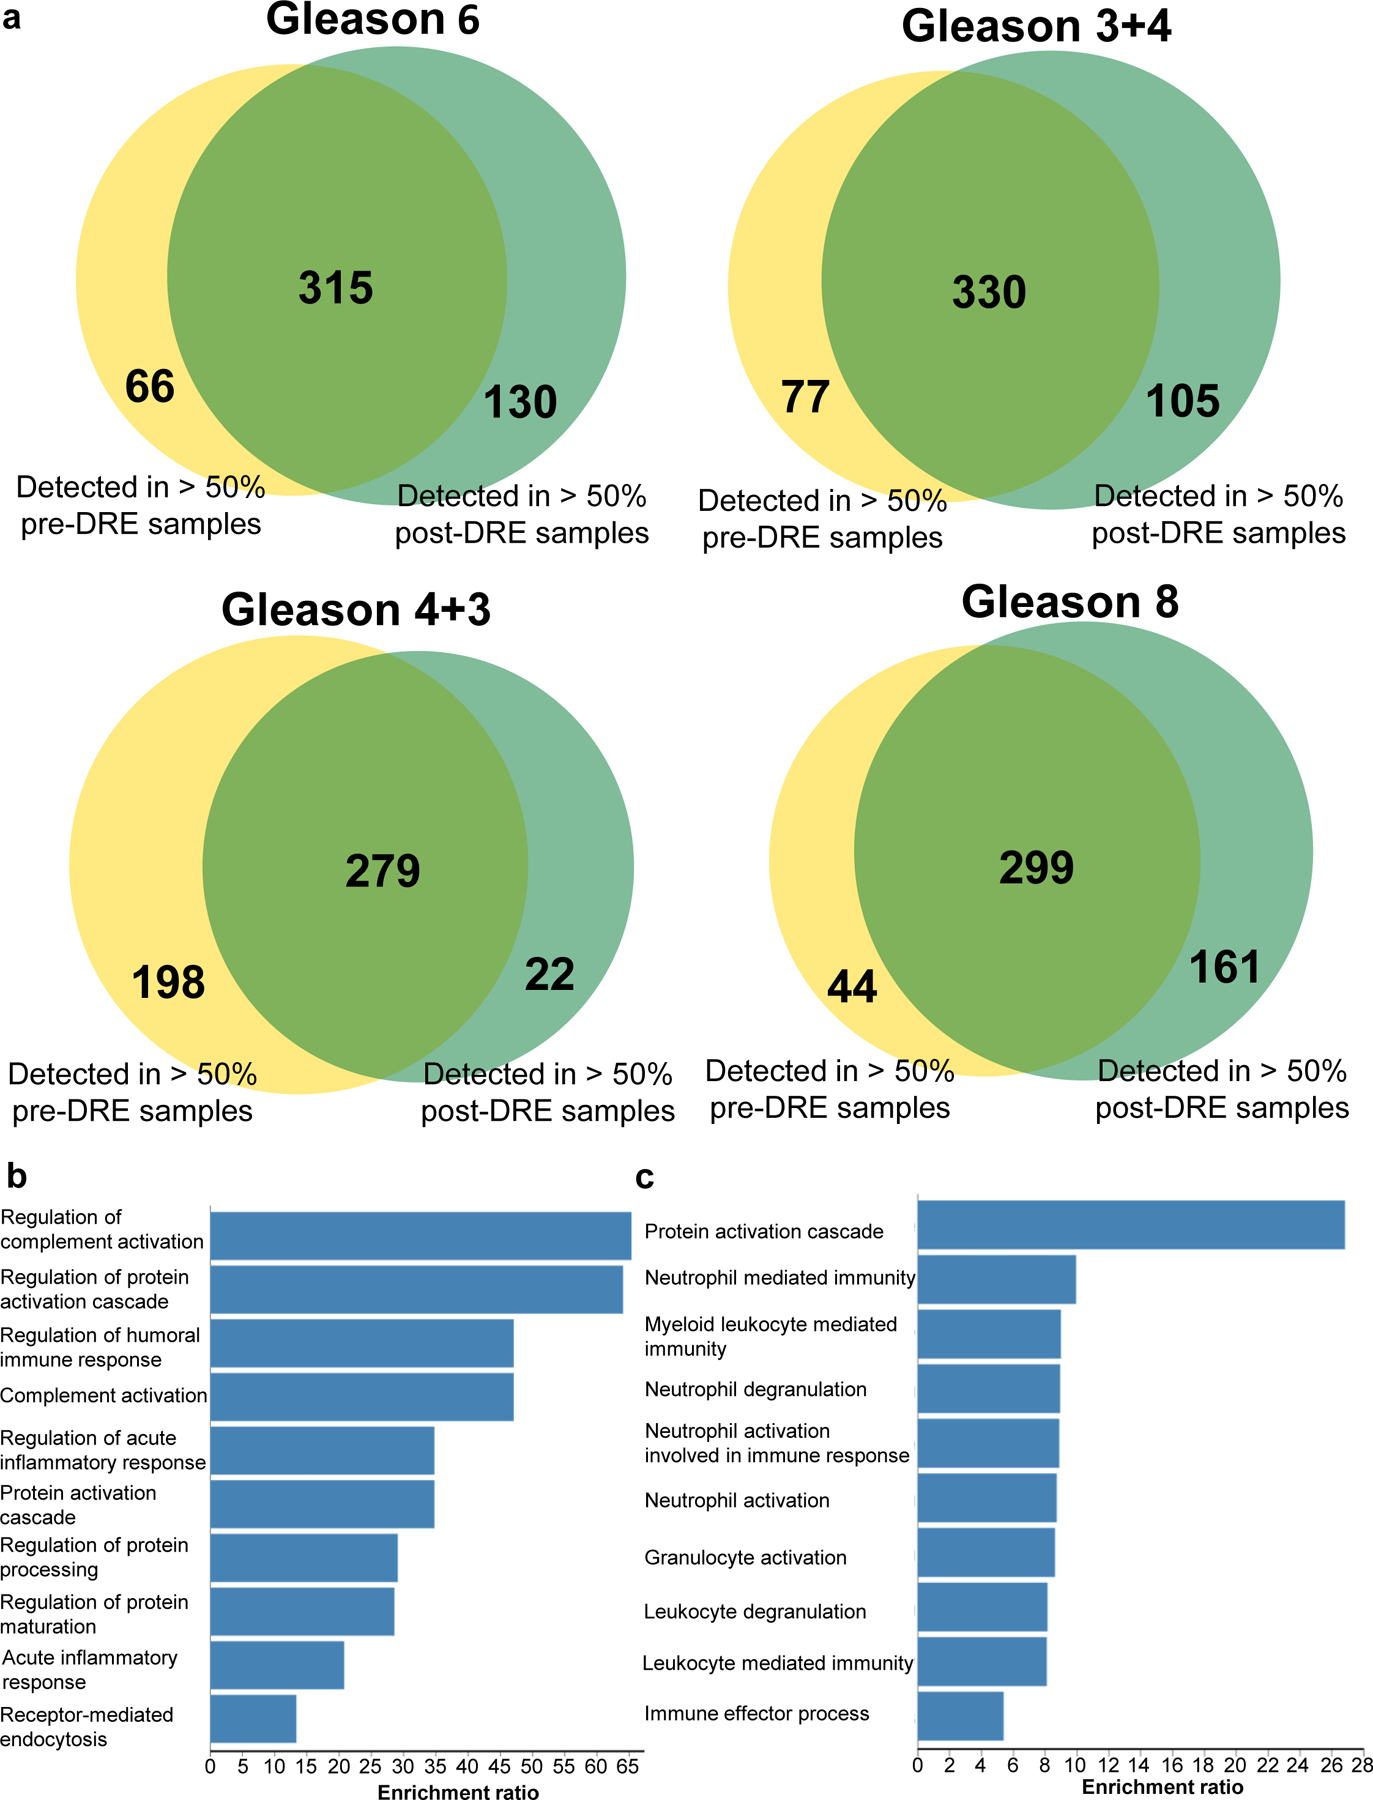
Glycopeptide detection difference between pre- and post-DRE urine samples. a. Comparison of identified glycopeptides between pre-DRE and post-DRE based on glycopeptides quantified in >50% of the samples in each group for Gleason score 6, 3+4, 4+3, and 8. b. Biological processes of the glycoproteins of the top 40 quantified glycopeptides in pre-DRE urine samples. c. Biological processes of the glycoproteins of the top 40 quantified glycopeptides in post-DRE urine samples.
The glycoproteins of the top 40 glycoproteins containing differential abundant glycopeptides in pre-DRE and post-DRE (Table S3) were used for gene ontology (GO) analysis to identify biological processes associated with pre-DRE and post-DRE [33]. As shown in Figure 1b, the glycoproteins identified in pre-DRE urine samples are associated with biological processes (FDR<0.05) such as regulation of complement activation (e.g., CLU), regulation of protein activation cascade (e.g., complement component 4 binding protein beta, C4BPB), and regulation of humoral immune response (e.g., vitronectin, VTN). In contrast, the glycoproteins found in post-DRE urine samples were related to biological processes (FDR <0.05, Figure 1c) such as neutrophil mediated immunity (e.g., aminopeptidase N, ANPEP), myeloid leukocyte mediated immunity (e.g., N-acetylglucosamine-6-sulfatase, GNS), and immune effector process (e.g., maltase-glucoamylase, MGAM). Taken together, secreted humoral immunity-related proteins were detected early in pre-DRE urine samples, and immune cell-related enzymes were more prevalent in the post-DRE urine samples.
The variation in glycopeptide abundances were observed between pre-DRE and post-DRE urine samples. However, the pre- and post-DRE urine were not collected from the same patient, which may display some bias. Therefore, we collected pre- and matched post-DRE urine from the same patient (N=14 pairs), which included 4 biopsy negative (BxN) samples, 6 Gleason score 6 (G6) samples, and 4 Gleason score 7 (G7) samples. Urinary PSA was measured by clinical ELISA assay and quantitative proteomics approach via DIA-MS was used to determine glycopeptide signatures (Tables S4–S5). We focused on measurements of urinary PSA and ACPP, since these two were commonly detected in both pre-DRE and post-DRE urine samples as well as in the paired samples. The urinary PSA intensity was higher in post-DRE urine compared to pre-DRE urine in majority of the samples (Figure 2a). Similar result was found for the ACPP, the intensity of the ACPP was higher in post-DRE urine than in pre-DRE urine (Figure 2b).
Fig. 2.
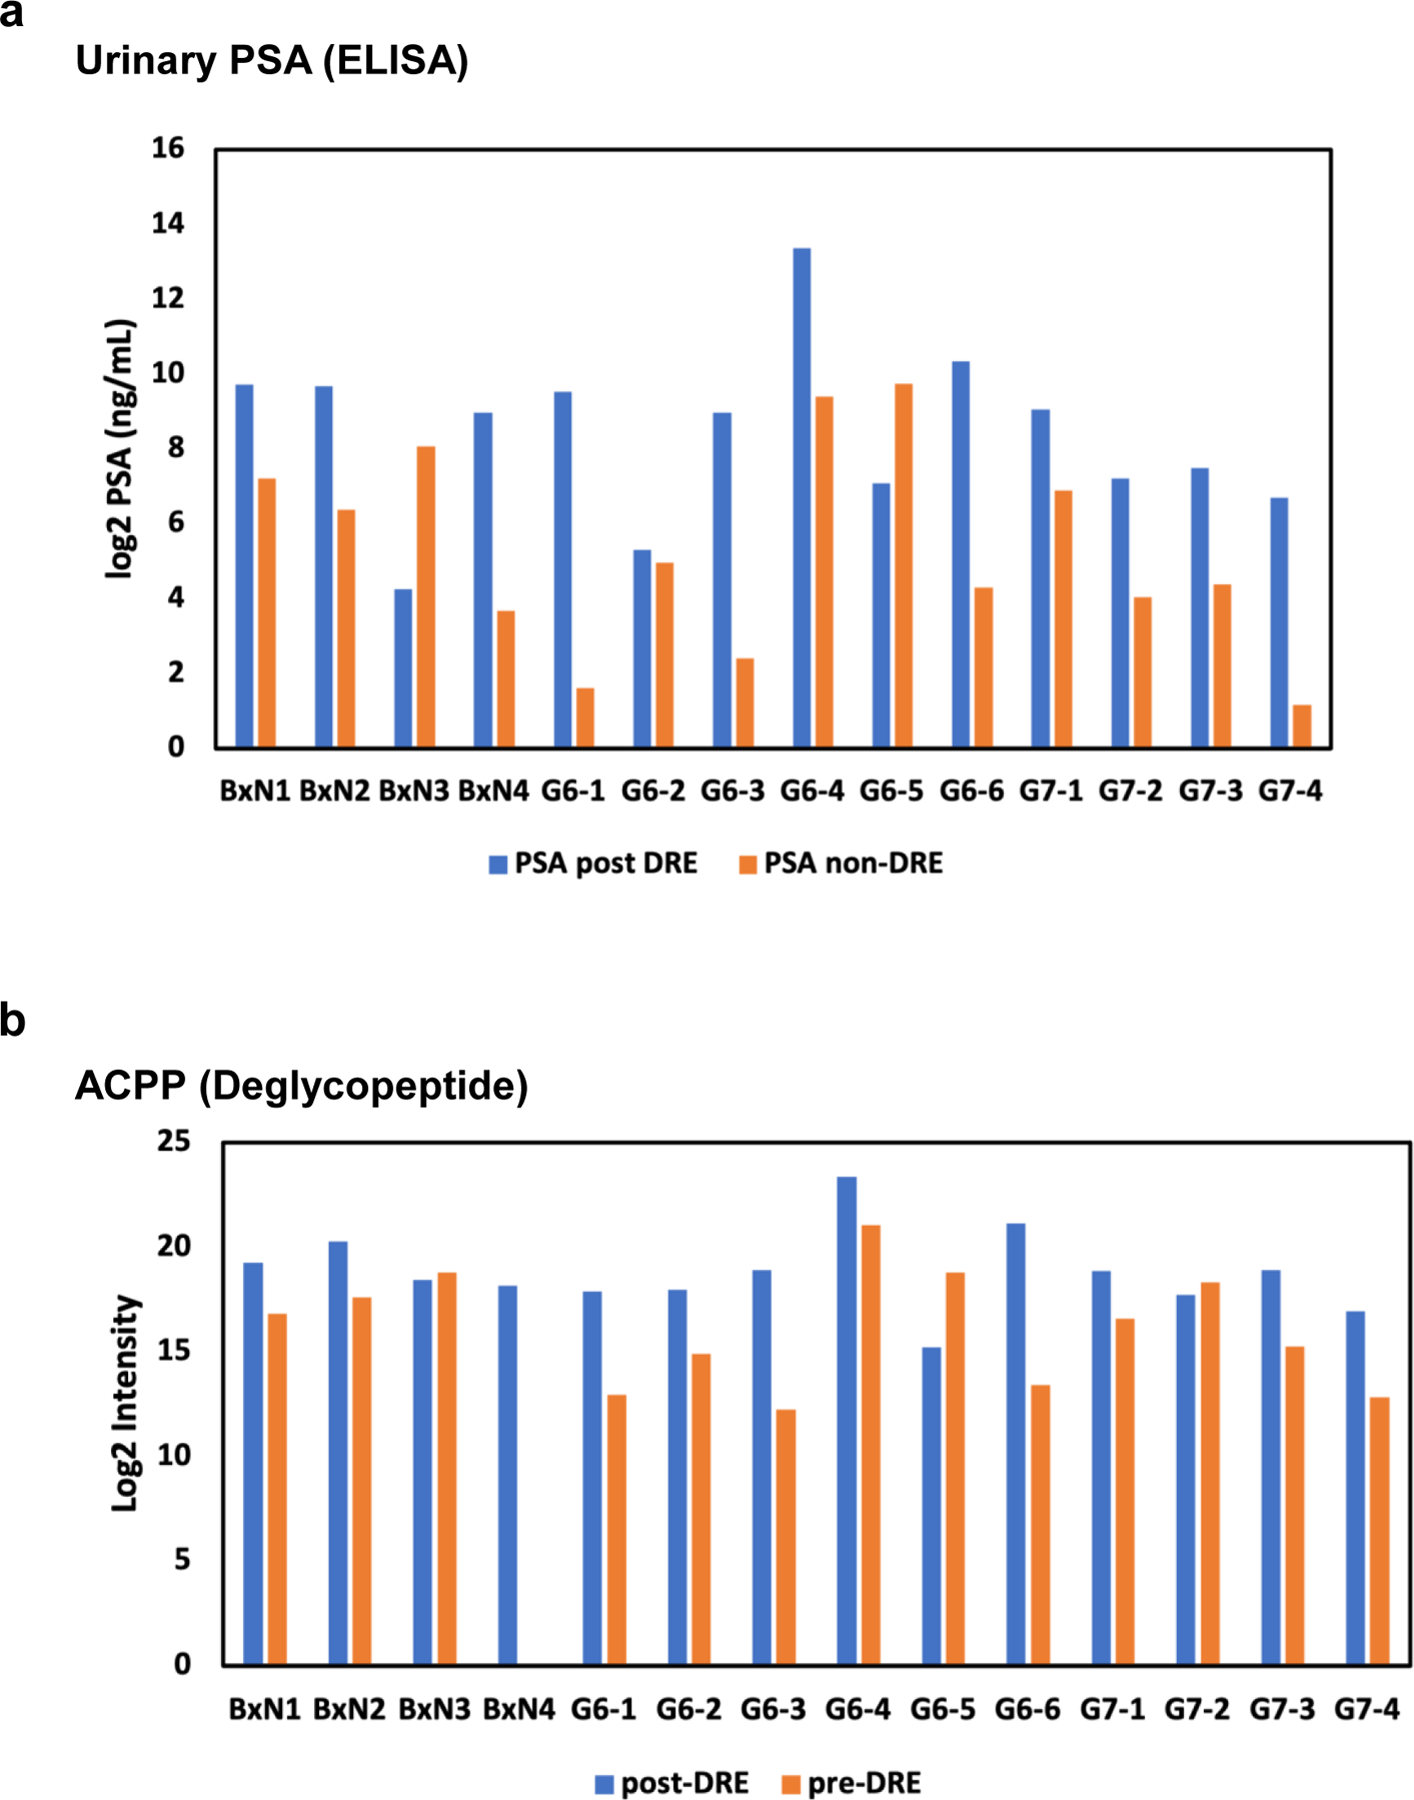
Comparison of urinary PSA and ACPP using matched pre-DRE and post DRE paired samples. a. intensity of urinary PSA in pre-DRE and post-DRE urine from the same patient. b. intensity of ACPP in pre-DRE and post-DRE urine from the same patient.
In summary, elevated glycoproteins in the pre-DRE urine samples mainly represented the complement pathways and were predominantly secreted proteins. Elevated proteins in the post-DRE urine samples were mainly involved in leukocyte/neutrophil activation and degranulation processes and were predominantly enzymes and receptor proteins. The results from paired samples further indicated that the abundances of proteins/glycopeptides were different in post- and pre-DRE samples.
Performances of post-DRE urinary glycoprotein biomarker for detecting AG-PCa using pre-DRE urine
Our previous glycoproteomic analysis of post-DRE urine samples from patients with AG- and NAG-PCa revealed several urinary glycoprotein biomarker candidates, including urinary PSA, ACPP, and CD97. Herein, we evaluated the clinical utility of these glycoproteins along with urinary PSA in distinguishing AG-PCa from NAG-PCa/biopsy negative using pre-DRE urine samples.
The glycopeptide, FLN*ESYK of ACPP (referred to as ACPP for simplicity), which was identified as an AG-PCa-associated marker candidate in post-DRE urine samples, showed an association with AG-PCa in pre-DRE urine samples and a decreased intensity in the AG-PCa group compared to the combined group of NAG-PCa and biopsy-negative cases (BxN & G6; fold-change = 1.27 and ρ = 0.018; Figure 3a). Similarly, pre-DRE urinary ACPP level was also decreased in PCa (Gleason score ≥6) compared to biopsy-negative cases (BxN) with 1.36-fold decrease (ρ = 0.012, Figure 3b). The ROC analysis revealed that ACPP in pre-DRE urine had a moderate performance in distinguishing AG-PCa group from BxN & G6 group with an AUC of 0.60 (Figure S1a, Table S6), whereas an AUC of 0.62 (Figure 3c, Table S6) was achieved for separating PCa from BxN.
Fig. 3.
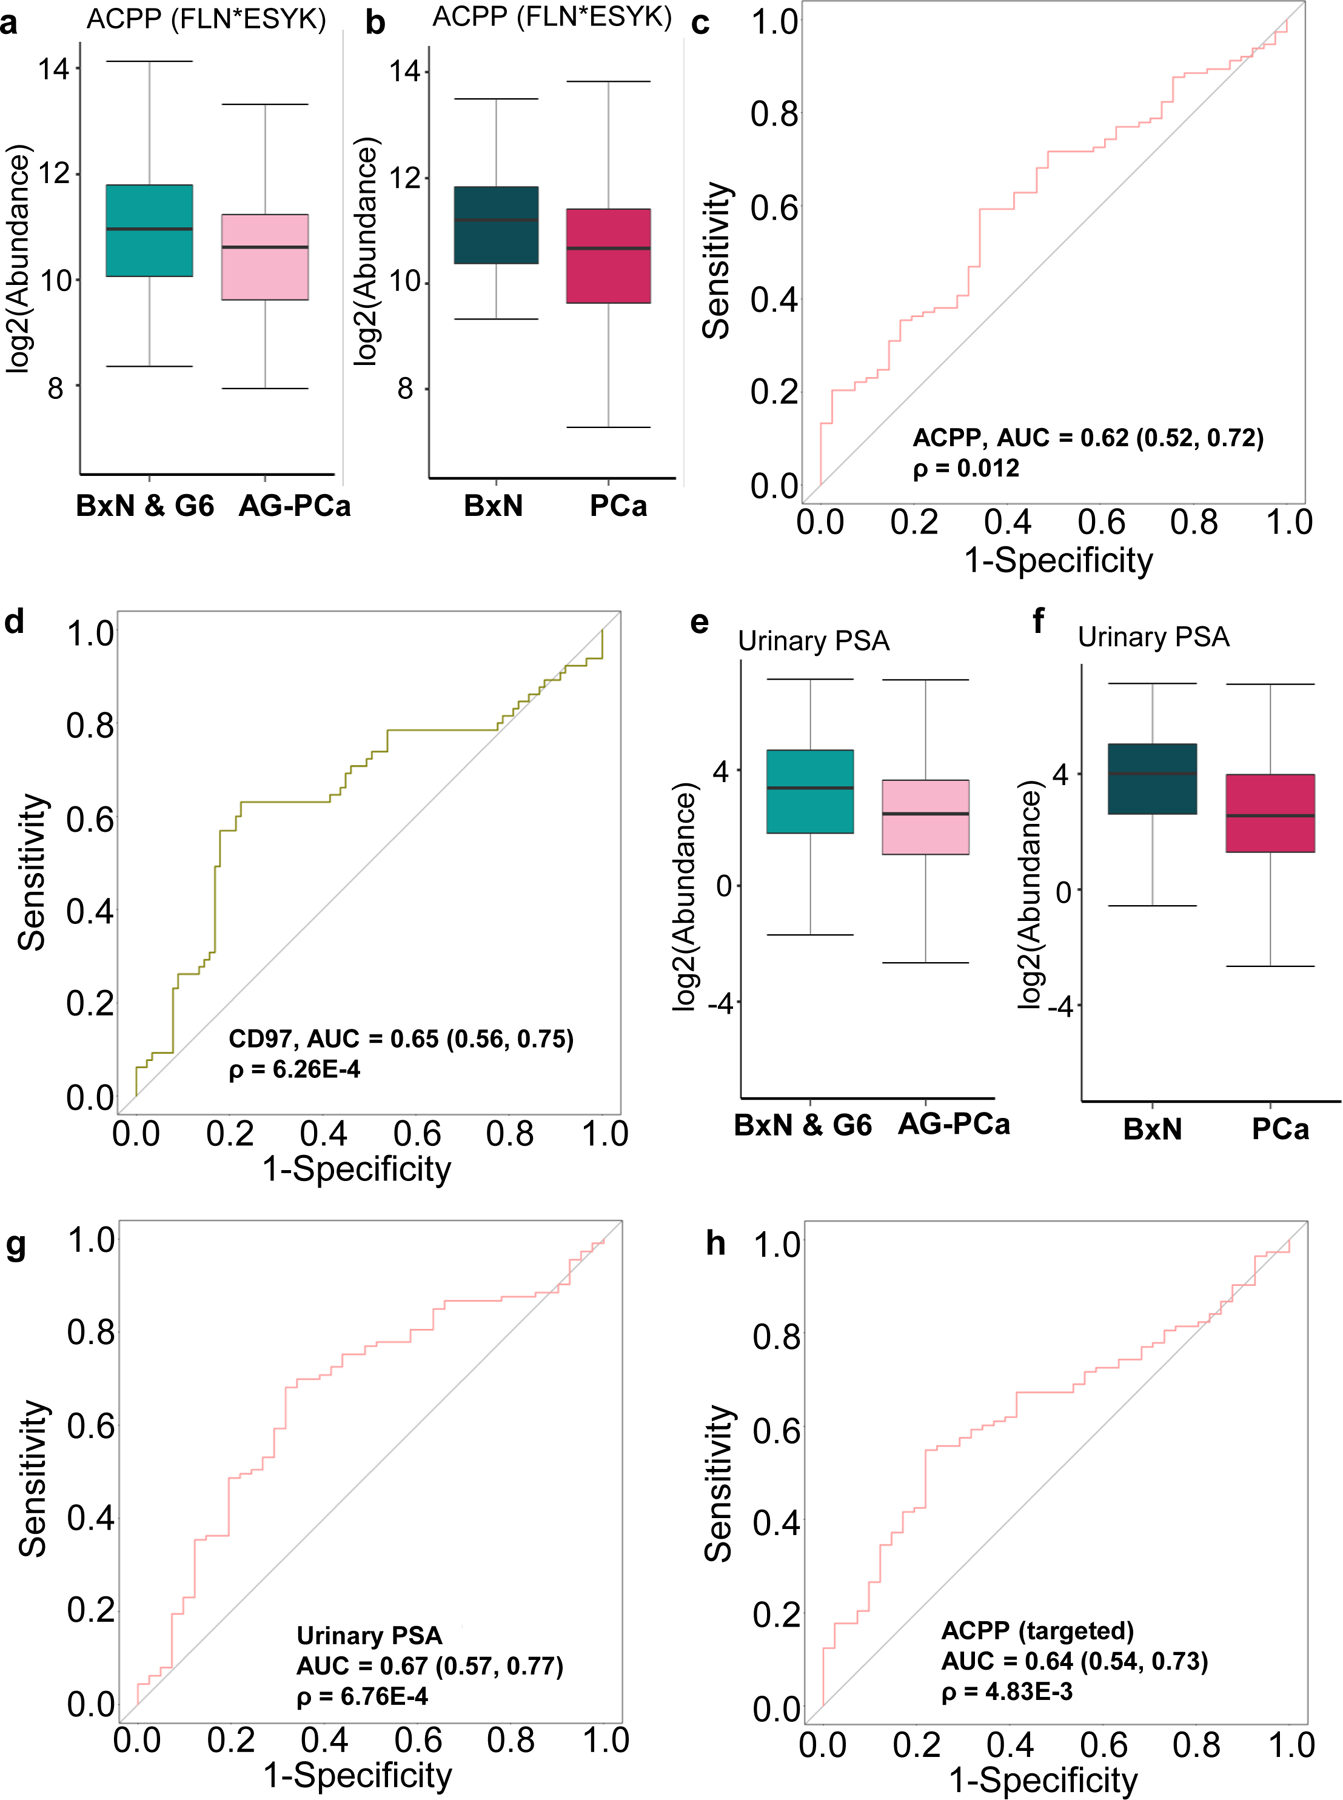
Performance evaluation of the post-DRE AG-PCa associated glyco-marker candidates in pre-DRE urine samples. a. Expression profile of ACPP (FLN*ESYK) between BxN & G6 and AG-PCa in pre-DRE urine samples. b. Expression profile of ACPP (FLN*ESYK) between BxN and PCa in pre-DRE urine samples. c. ROC result of ACPP (FLN*ESYK) in pre-DRE urine for distinguishing BxN and PCa. d. ROC result of CD97 (WCPQNSSCVN*ATACR) in pre-DRE urine for distinguishing AG-PCa and BxN & G6. e Expression profile of urinary PSA between BxN & G6 and AG-PCa in pre-DRE urine samples. f. Expression profile of urinary PSA between BxN and PCa in pre-DRE urine samples. g. ROC result of urinary PSA in pre-DRE urine for distinguishing PCa and BxN. h. ROC result of the targeted assays of ACPP (FLN*ESYK) in pre-DRE urine for distinguishing PCa and BxN. BxN & G6 indicates a combined group of NAG-PCa cases and cancer biopsy negative cases. BxN is cancer biopsy negative cases only. PCa is the combined group of NAG-PCa and AG-PCa. AUC and 95% confidence interval are depicted for each candidate marker.
Moreover, WCPQNSSCVN*ATACR of CD97 (referred to as CD97 for simplicity) was another previously reported post-DRE candidate marker for AG-PCa, which was increased in AG-PCa group (fold change=1.30 and p=0.03, Figure S1b) with a moderate performance in differentiating AG-PCa from BxN & G6 with an AUC of 0.65 (Figure 3d, Table S7) in pre-DRE urine. Moreover, the urinary PSA levels in pre-DRE samples, which was measured by the clinical immunoassay, could also predict AG-PCa biopsy results. As shown in Figure 3e, the urinary PSA intensity was 1.76-fold lower in the AG-PCa group (ρ = 0.018) than in the BxN & G6 group, with an AUC of 0.60 (Figure S1c, Table S8). The urinary PSA intensity was 2.44-fold lower in the PCa group than in the BxN group (ρ < 0.01, Figure 3f), with an AUC of 0.67 (Figure 3g, Table S8). We also analyzed the targeted assay by spiking in stable isotope-labeled heavy peptides for ACPP in the DIA analysis [31], and ACPP showed a good performance in distinguishing PCa from biopsy-negative urine. The targeted assay showed that the ACPP level was 1.73-fold lower in the PCa group than in the BxN group (ρ < 0.01, Figure S1d), with an AUC of 0.64 (Figure 3h, Table S9).
In summary, evaluation of the clinical utility of post-DRE urinary biomarker glycoproteins for detecting AG-PCa using pre-DRE urine samples showed that ACPP, CD97, and urinary PSA, which were identified in post-DRE samples, can also be used in pre-DRE samples, although with a relatively smaller fold-change.
Identification of AG-Pca-associated urinary glycoproteins in pre-DRE urine samples
Next, we investigated the AG-Pca-associated glycoproteins that were detected only in pre-DRE urine samples by analyzing the differences between AG-Pca and BxN & G6. Three glycopeptides from three glycoproteins were associated with AG-Pca in the pre-DRE urine samples. The glycopeptide TAIFAFN*ISHVSNK from fibrillin 1 (FBN1), a large extra-cellular matrix glycoprotein, was increased in AG-Pca relative to BxN & G6 (fold change = 2.37 and p < 0.01, Figure 4a). An AUC of 0.69 was obtained for distinguishing AG-Pca from BxN & G6 (Figure 4b, Table S10).
Fig. 4.
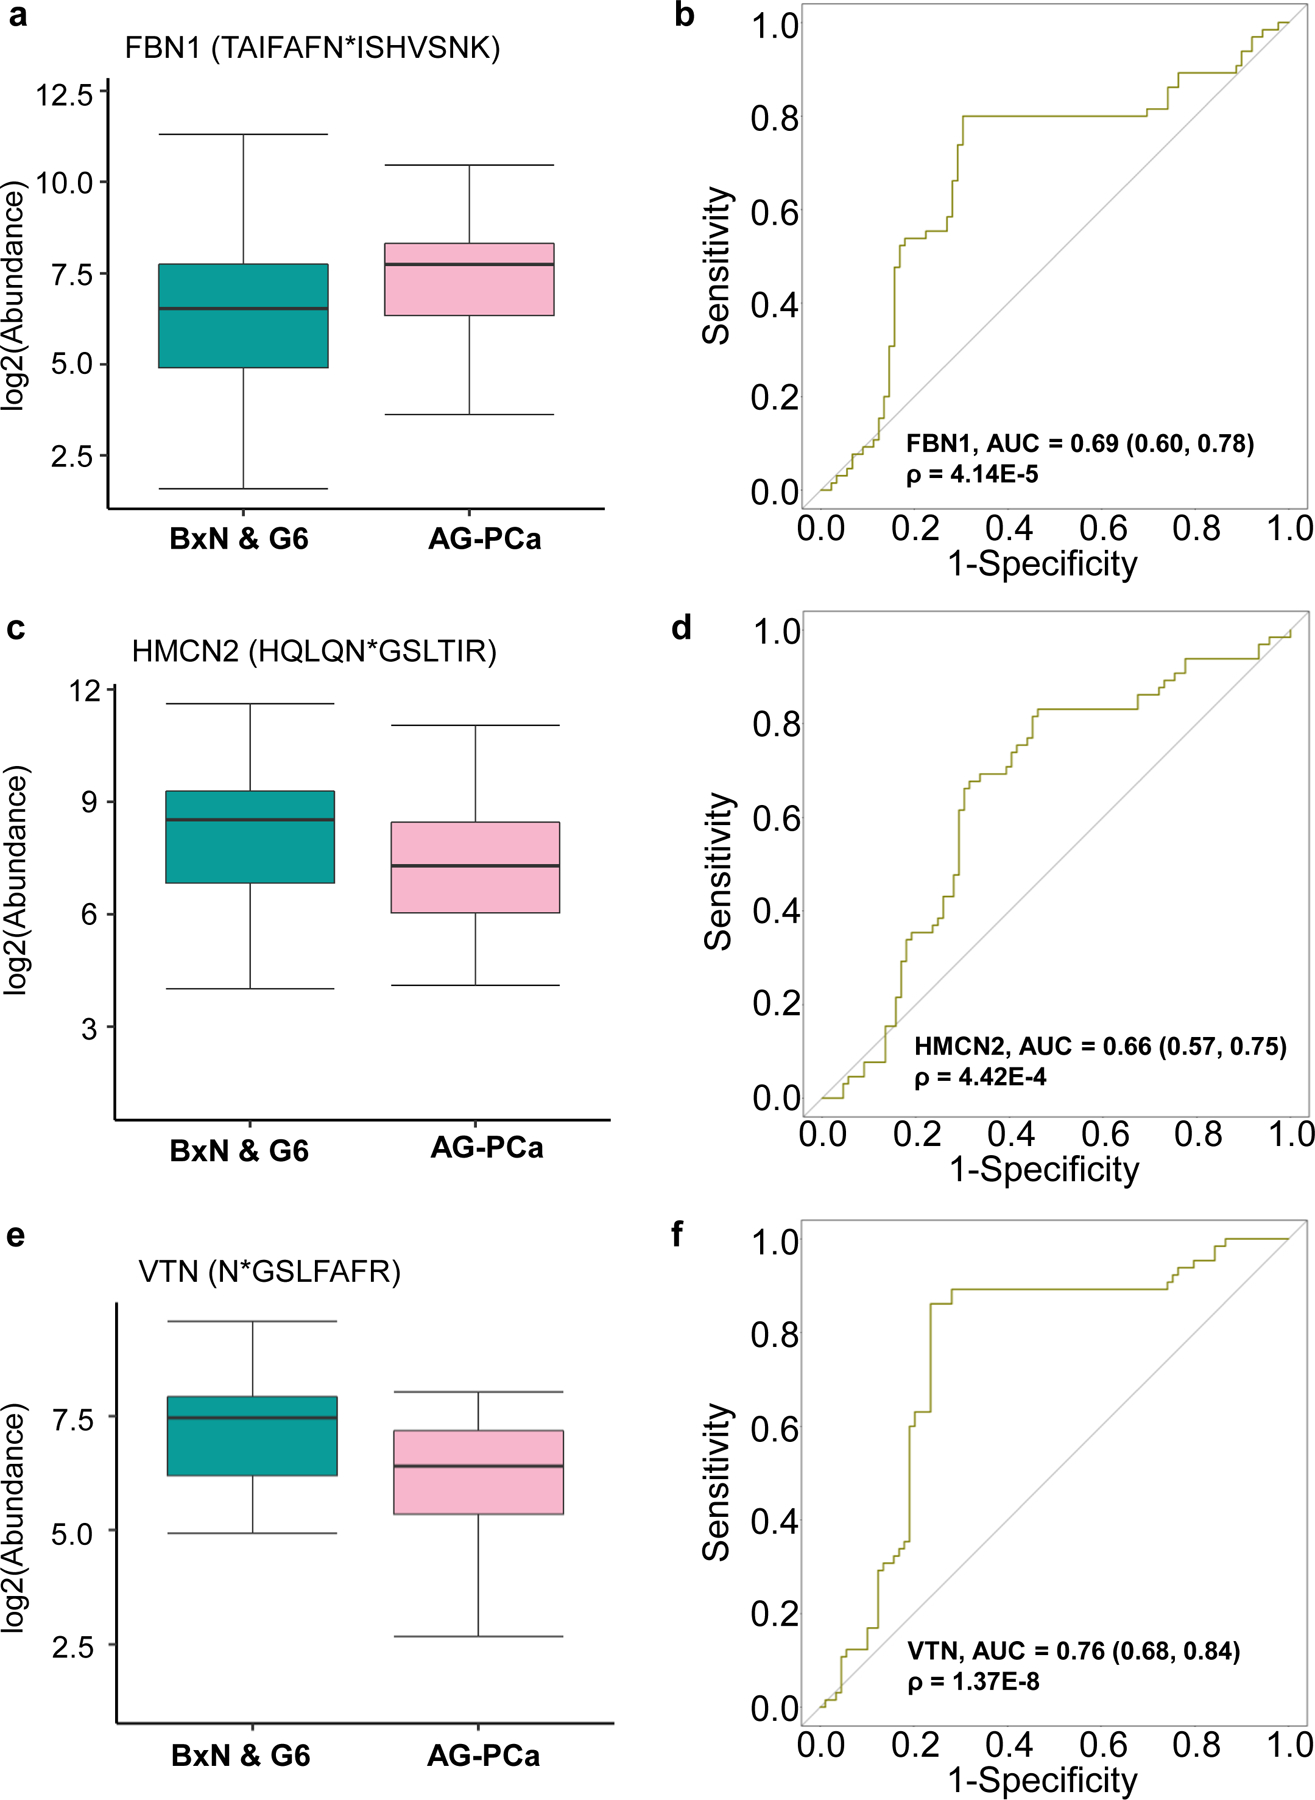
Performance evaluation of the pre-DRE AG-PCa associated glyco-marker candidates. a. Expression profile of FBN1 (TAIFAFN*ISHVSNK) between BxN & G6 and AG-PCa. b ROC result of FBN1 (TAIFAFN*ISHVSNK) for distinguishing BxN & G6 and AG-PCa. c. Expression profile of HMCN2 (HQLQN*GSLTIR) between BxN & G6 and AG-PCa. d. ROC result of HMCN2 (HQLQN*GSLTIR) for distinguishing AG-PCa and BxN & G6. e Expression profile of VTN (N*GSLFAFR) between BxN & G6 and AG-PCa. f. ROC result of VTN (N*GSLFAFR) for distinguishing AG-PCa and BxN & G6. AUC and 95% confidence interval are depicted for each candidate marker.
Hemicentin 2 (HMCN2) and VTN are the other two extracellular matrix glycoproteins which their glycopeptides showed decreased expression profiles in AG-Pca compared to BxN & G6. The level of the glycopeptide HQLQN*GSLTIR from HMCN2 was lower in pre-DRE urine samples from AG-Pca patients relative to BxN & G6 patients (fold change = 2.33 and p < 0.01, Figure 4c). The ROC analysis indicated that this particular glycopeptide of HMCN2 had a discrimination power towards AG-Pca with an AUC of 0.66 (Figure 4d, Table S10). The intensity of the glycopeptide N*GSLFAFR from VTN was 1.89-fold lower (p < 0.01) in AG-Pca-associated urine samples than in samples from BxN & G6 group (Figure 4e). VTN could differentiate AG-Pca and BxN & G6 with an AUC of 0.76 (Figure 4f, Table S10).
Overall, using the ROC analysis, we identified three glycoproteins that were associated with AG-Pca. These findings may facilitate studies on potential biomarkers for AG-Pca in pre-DRE urine specimens.
Performance of multi-urinary marker panels for AG-PCa detection in pre-DRE urine based on quantitative analysis of DIA-MS
In our previous work [24], we explored multi-urinary marker panels using post-DRE urine samples for differentiating NAG- and AG-PCa. The post-DRE-derived multi-urinary marker panels showed promising results, which may serve as a complementary test to the serum PSA test. Herein, the multi-urinary marker panels were examined for pre-DRE urine, which may serve as a home kit panels for the future home test. We evaluated different combinations of the newly discovered pre-DRE marker candidates with our previous reported post-DRE marker as well as with urinary PSA into multi-urinary signature panels.
As shown in Fig. 5a, an AUC of 0.77 was achieved when combining glycopeptides from FBN1, VTN, and CD97 with the urinary PSA into a panel for distinguishing AG-Pca from BxN & G6 (Table S11). By using the bootstrap resampling with label permutation, random models were generated and a well-separation between the random and real models of the multi-marker panel was obtained indicating the performance of the panel was statistically meaningful (Fig. 5b). Another panel composed of glycopeptides from VTN, HMCN2, and CD97 with urinary PSA also demonstrated a moderate improvement (AUC=0.78, Fig. 5c, Table S11) compared to the performance of individual markers, and the result of this multi-marker panel was not a random observation (Fig. 5d).
Fig. 5.
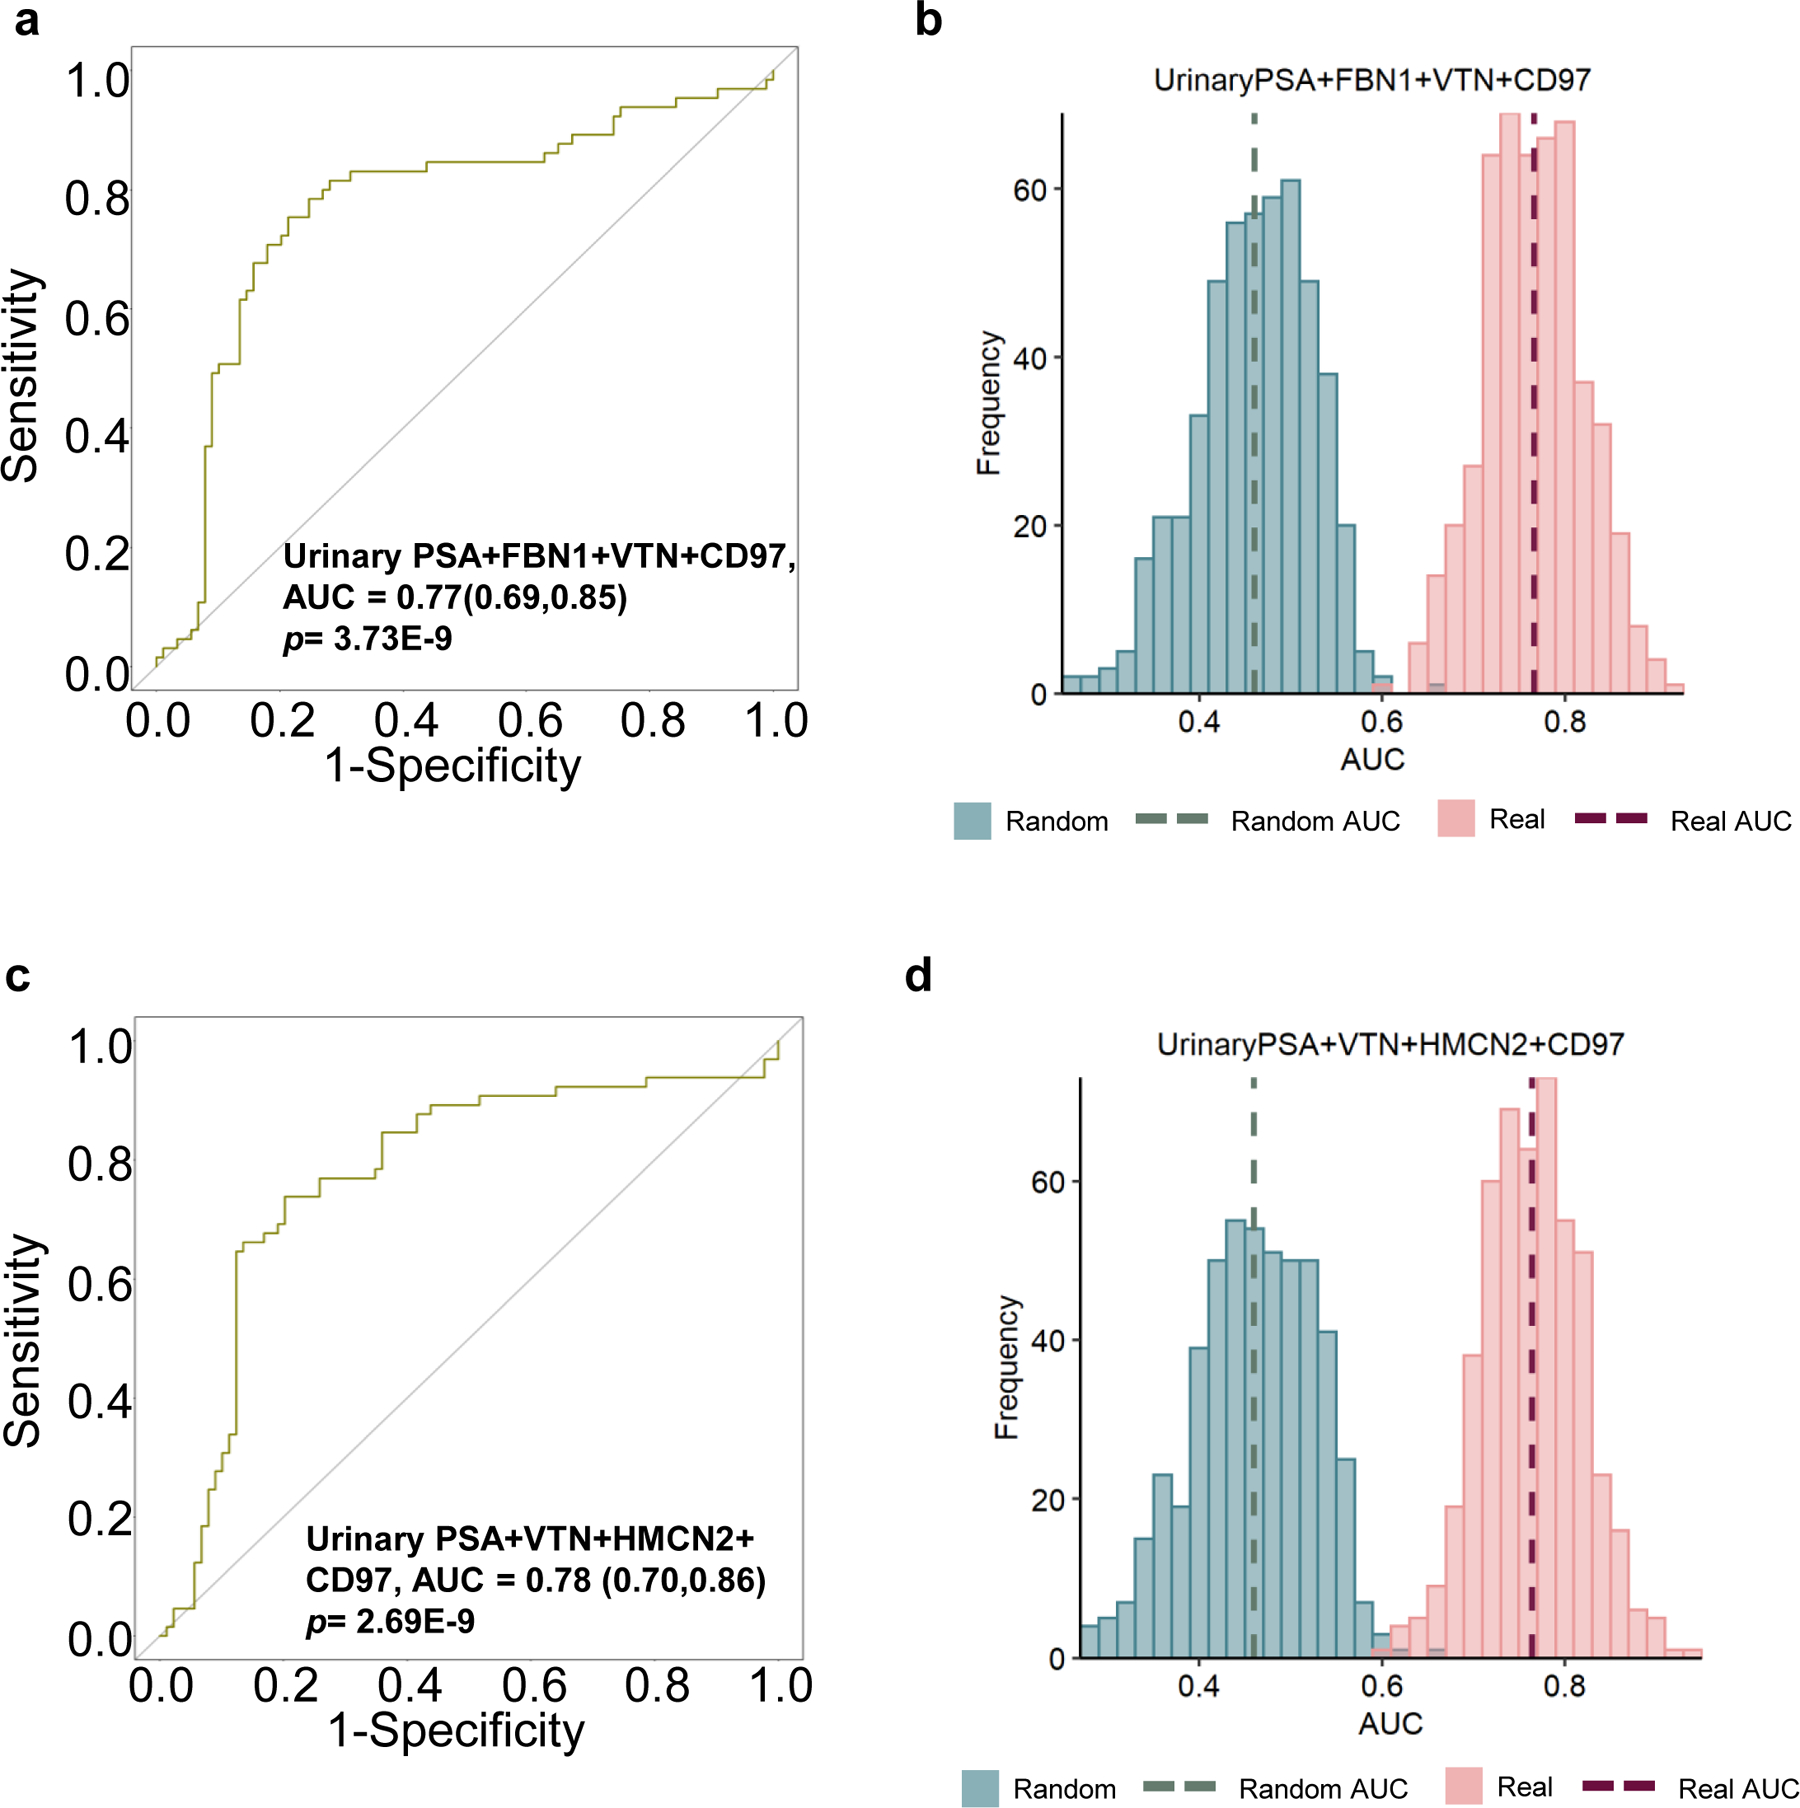
Performance of multi-urinary marker panels for distinguishing BxN & G6 and AG-PCa. a ROC result of a panel composed of urinary PSA+FBN1+VTN+CD97. b Label permutation based on bootstrap resampling comparison between real models and randomly generated models for the panel in Fig. 5a. c. ROC result of a panel composed of urinary PSA+VTN+HMCN2+CD97. d. Label permutation based on bootstrap resampling comparison between real models and randomly generated models for the panel in Fig. 5c.
In summary, urinary marker panels containing different combinations of glycopeptides with urinary PSA showed promising results with robust performance for monitoring disease progression non-invasively in urine, which demonstrated the potential in PCa detection using a home kit in future.
Discussion
Although AG-PCa-associated glycoproteins have been identified in post-DRE urine samples in previous studies [34,35], it is still essential to explore AG-PCa-associated glycoproteins in pre-DRE urine samples for potential home testing. This study compared glycopeptide profiles between pre- and post-DRE urine specimens to determine the clinical utilities of previously identified AG-PCa marker candidates from post-DRE urine samples and to identify novel AG-PCa-associated glycoproteins in pre-DRE urine samples. By utilizing an integrated automation workflow for urinary glycopeptide preparation, in combination with DIA-MS and targeted analyses, we determined the performance of previously reported glycoproteins from post-DRE urine samples and discovered potential AG-PCa-associated glycoproteins in pre-DRE urine specimens.
Based on the analysis of 154 pre-DRE and 292 post-DRE urine specimens, humoral immunity-related proteins and immune cell-related enzymes were enriched in pre-DRE urine and post-DRE urine, respectively. The urinary tract resists microbial infections, which can be attributed to its versatile innate immune system and can explain the presence of abundant humoral immunity-related proteins in pre-DRE urine [36]. Considering that humoral immunity plays a role in infection and cancer, increased levels in pre-DRE may also be attributed to infections [37]. Functional enrichment analysis showed that post-DRE urine contains expressed prostatic secretions that comprise many neutrophil and other immune cell response proteins, consistent with previously reported prostatic secretions [38]. The proteome differences between pre- and post-DRE urine were further supported by using the pre- and post-DRE urine samples from the same patient. Thus, AG-PCa-associated glycoproteins identified from post-DRE urine specimens must be reevaluated in pre-DRE urine specimens to determine their utilities for the detection of AG-PCa or PCa.
Post-DRE AG-PCa-associated urinary glycoproteins were previously evaluated. Several of these urinary glycoproteins, such as PSA, ACPP, and CD97, can still be used to differentiate AG-PCa from NAG-PCa and biopsy-negative cases using pre-DRE urine. More than half of the post-DRE AG-PCa-associated urinary glycoproteins, such as SEPRINA1, LRG1, ORM1, CD63, GRN, ADGRE5, and PTPRN2, are immune cell-related glycoproteins [31]. However, immune cell-related glycoproteins showed weak performance in pre-DRE urine samples. Furthermore, we also identified three glycoproteins in pre-DRE urine samples showing good performance in detecting AG-PCa. FBN1 and CD97 glycoprotein levels increased in AG-PCa comparing to NAG-PCa. These observations might be significant since CD97 were also overexpressed in post-DRE urine of aggressive PCa [24], while FBN1 is elevated in other cancer types and the tumor promoting mechanism have been reported [39–43]. Our study represents the first report of elevated FBN1 in aggressive prostate cancer urine. VTN is a secreted protein that promotes cell adhesion and inhibits the cytolytic complement pathway [44,45], and HMCN2 is a secreted glycoprotein that regulates cell adhesion and migration [46]. These three extracellular secreted glycoproteins that regulate cell adhesion and migration showed good performance as AG-PCa-associated glycoproteins in pre-DRE urine samples and can be considered as potential candidate glycoproteins for home-based testing for AG-PCa, once validated in a large scaled multi-centric clinical study.
Our research reveals differences in glycoprotein profiles between pre- and post-DRE urine sets. For pre-DRE urine specimens, we confirmed three of the previously reported post-DRE urinary glycoproteins and identified three new AG-PCa-associated glycoproteins. Multi-marker panels could achieve AUCs ≥ 0.77. However, the study is limited by the cohort size of the pre-DRE samples and lack of cross validation.
This is the initial investigation of protein differences between pre- and post-DRE and discovery of urinary glycoprotein changes associated with aggressive prostate cancer with limited sample size. For further validation of the identified pre-DRE AG-PCa-associated urinary glycoproteins, a large-scale independent patient cohort is necessary before they can be developed for home-based testing and clinical applications. We plan to conduct the following research in the future: first, glycoprotein profiles will be compared between pre- and post-DRE urine samples from the same patients in large-scale cohort; second, a multicenter validation will be performed in large cohorts; third, we observed a good correlation between ELISA-based and MS-based quantification approaches for urinary PSA (R2=0.79), therefore, orthogonal validation of the candidate urinary glycoproteins for AG-PCa will be performed using ELISA, PRM, and/or other related approaches; and finally, we will investigate the possibility of home based testing for AG-PCa using glycoproteins identified in pre-DRE urine specimens. Thus, systematic evaluation of these pre-DRE urinary glycoproteins may help patients avoid unnecessary biopsies and enable broad testing for AG-PCa at home. We will continue to explore and validate pre-DRE urinary glycoprotein signatures to help detect clinically significant cancer at an early stage of PCa.
Supplementary Material
Significance Statement.
Nonaggressive prostate cancer (NAG-PCa) with Gleason score of 6 is considered as a low-risk disease and does not require clinical interventions. However, current assessment of aggressiveness of PCa is invasive using needle biopsies. Urine is an appealing biospecimen for noninvasive detection of aggressive PCa. Using urine, particularly from easily obtainable pre-digital rectal examination (DRE) urine, to identify AG-PCa-associated molecular markers is critical for clinical risk stratification. Herein, we acquired quantitative mass spectrometry data for glycoproteins from pre-DRE and post-DRE urine specimens from patients underwent PCa diagnosis with biopsies. Compared with urinary glycoproteins identified from post-DRE urine samples, we confirmed that three previously reported AG-PCa-associated glycoproteins identified in post-DRE urine specimens were also found to be significantly associated with AG disease in pre-DRE urine samples. In addition, new AG-PCa-associated glycoproteins were identified in pre-DRE urine specimens. Our study provides a foundation for further studies of AG-PCa biomarkers using pre-DRE urine specimens.
Acknowledgments:
This work was supported by National Institute of Health, National Cancer Institute, the Early Detection Research Network (EDRN, U01CA152813 to H.Z.) and Patrick C. Walsh Prostate Cancer Research Fund (PCW, award to H. Z.). The work was also supported by NCI/EDRN IAA (No. ACN 17005-001-0000011 to G.C.). We thank Mr. Talaibek Borbiev, Senior Research Assistant at CPDR, for inventorying and processing of the pre-DRE urine specimens.
Footnotes
Associated data
Table S1. Sample information of urine specimens.
Table S2. Total of 1044 N-linked glycosite-containing glycopeptides were identified and quantified across pre-DRE (n=154) and post-DRE (n=292) urine samples.
Table S3. The difference of identified glyco-peptide between pre- and post-DRE urine samples.
Table S4. Urinary PSA of 14 pairs of pre- and post-DRE.
Table S5. Total of 582 deglyco-peptides were identified and quantified across 14 pairs of pre- and post- urine samples from the same patients.
Table S6. ROC results of ACPP (FLN*ESYK) for differentiating (1) BxN & G6 (combined biopsy-negative and Gleason score=6) and AG-PCa, and (2) BxN and PCa.
Table S7. ROC result of CD97 (WCPQNSSCVN*ATACR) for differentiating BxN & G6 and AG-PCa.
Table S8. ROC results of urinary PSA for differentiating (1) BxN & G6 (combined biopsy-negative and Gleason score=6) and AG-PCa, and (2) BxN and PCa.
Table S9. ROC result of targeted assay of ACPP (FLN*ESYK) for differentiating BxN and PCa.
Table S10. ROC results of FBN1 (TAIFAFN*ISHVSNK), HMCN2 (HQLQN*GSLTIR), and VTN (N*GSLFAFR) for differentiating BxN & G6 and AG-PCa.
Table S11. ROC results of multi-urinary marker panels for differentiating BxN & G6 and AG-PCa.
Availability of data and materials: The raw data can download from Proteome Xchange with project accession PXD036468.
Conflict of interest and disclaimer: No conflict of interest. The contents of this publication are the sole responsibility of the author(s) and do not necessarily reflect the views, opinions or policies of Uniformed Services University of the Health Sciences (USUHS), The Henry M. Jackson Foundation for the Advancement of Military Medicine, Inc., the Department of Defense (DoD), the Departments of the Army, Navy, or Air Force. Mention of trade names, commercial products, or organizations does not imply endorsement by the U.S. Government.
Fig. S1. Performance of post-DRE AG-PCa associated glyco-marker candidates in pre-DRE urine samples. a. ROC result of ACPP (FLN*ESYK) in pre-DRE urine for distinguishing BxN & G6 and AG-PCa. b. Expression profile of CD97 (WCPQNSSCVN*ATACR) in pre-DRE urine between AG-PCa and BxN & G6. c. ROC result of urinary PSA in pre-DRE urine for distinguishing AG-PCa and BxN & G6. d. Expression profile of the targeted assay of ACPP (FLN*ESYK) between BxN and PCa in pre-DRE urine samples. AUC and 95% confidence interval are depicted for each candidate marker.
References
- 1.Siegel RL; Miller KD; Fuchs HE; Jemal A (2021). Cancer statistics, 2021. CA Cancer J Clin, 71, 7–33. [DOI] [PubMed] [Google Scholar]
- 2.Siegel RL; Miller KD; Jemal A (2020). Cancer statistics, 2020. CA Cancer J Clin, 70, 7–30 [DOI] [PubMed] [Google Scholar]
- 3.Nowinski S et al. (2018). Systematic identification of functionally relevant risk alleles to stratify aggressive versus indolent prostate cancer. Oncotarget, 9, 12812–12824. [DOI] [PMC free article] [PubMed] [Google Scholar]
- 4.Selvadurai ED; Singhera M; Thomas K; Mohammed K; Woode-Amissah R; Horwich A; Huddart RA; Dearnaley DP; Parker CC (2013). Medium-term outcomes of active surveillance for localised prostate cancer. Eur. Urol, 64, 981–987. [DOI] [PubMed] [Google Scholar]
- 5.Tosoian JJ; Carter HB; Lepor A; Loeb S (2016). Active surveillance for prostate cancer: current evidence and contemporary state of practice. Nat. Rev. Urol, 13, 205–215. [DOI] [PMC free article] [PubMed] [Google Scholar]
- 6.Zhang H; Chan DW (2007). Cancer biomarker discovery in plasma using a tissue-targeted proteomic approach. Cancer Epidemiol. Biomarkers Prev, 16, 1915–1917. [DOI] [PubMed] [Google Scholar]
- 7.Zhang H; Liu AY; Loriaux P; Wollscheid B; Zhou Y; Watts; Aebersold R (2007). Mass spectrometric detection of tissue proteins in plasma. Mol. Cell. Proteomics, 6, 64–71. [DOI] [PubMed] [Google Scholar]
- 8.Gahmberg CG; Tolvanen M Why mammalian cell surface proteins are glycoproteins. (1996). Trends Biochem. Sci, 21, 308–311. [PubMed] [Google Scholar]
- 9.Zhang H; Aebersold R (2006). Isolation of glycoproteins and identification of their N-linked glycosylation sites. Methods Mol. Biol, 328, 117–185. [DOI] [PubMed] [Google Scholar]
- 10.Sokoll LJ; Wang Y; Feng Z; Kagan J; Partin AW; Sanda MG; Thompson IM; Chan DW (2008) [−2]proenzyme prostate specific antigen for prostate cancer detection: a national cancer institute early detection research network validation study. J. Urol, 180, 539. [DOI] [PMC free article] [PubMed] [Google Scholar]
- 11.Meany DL; Chan DW (2011). Aberrant glycosylation associated with enzymes as cancer biomarkers. Clin. Proteomics, 8,7. [DOI] [PMC free article] [PubMed] [Google Scholar]
- 12.Zhang H; Li X; Martin DB; Aebersold R (2003). Identification and quantification of N-linked glycoproteins using hydrazide chemistry, stable isotope labeling and mass spectrometry. Nat. Biotechnol, 21, 660–666. [DOI] [PubMed] [Google Scholar]
- 13.Tian Y; Zhou Y; Elliott S; Aebersold R; Zhang H (2007). Solid-phase extraction of N-linked glycopeptides. Nat. Protoc, 2, 334–339. [DOI] [PMC free article] [PubMed] [Google Scholar]
- 14.Li Y; Tao S; Bova GS; Liu A Y; Chan, D. W; Zhu, H.; Zhang, H. (2011). Detection and verification of glycosylation patterns of glycoproteins from clinical specimens using lectin microarrays and lectin-based immunosorbent assays. Anal. Chem, 83, 8509–8516. [DOI] [PMC free article] [PubMed] [Google Scholar]
- 15.Shah P; Yang S; Sun S; Aiyetan P; Yareman KJ; Zhang H (2013). Mass spectrometric analysis of sialylated glycans with use of solid-phase labeling of sialic acids. Alan. Chem, 85, 3606–3613. [DOI] [PMC free article] [PubMed] [Google Scholar]
- 16.Liu Y; Chen J; Sethi A; Li QK; Che L; Collins B; Gillet LCJ; Wollscheid B; Zhang H; Aebersold R (2014). Glycoproteomic analysis of prostate cancer tissues by SWATH mass spectrometry discovers N-acylethanolamine acid amidase and protein tyrosine kinase 7 as signatures for tumor aggressiveness. Mol. Cell. Proteomics, 13, 1753–1768. [DOI] [PMC free article] [PubMed] [Google Scholar]
- 17.Shah P; Wang X; Yang W; Eshghi ST; Sun S; Höti N; Chen L; Yang S; Pasay J; Rubin A; Zhang H (2015). Integrated proteomic and glycoproteomic analyses of prostate cancer cells reveal glycoprotein alteration in protein abundance and glycosylation. Mol. Cell. Proteomics, 14, 2753–2763. [DOI] [PMC free article] [PubMed] [Google Scholar]
- 18.Sun S; Shah P; Eshghi ST; Yang W; Trikannad N; Yang S; Chem L; Aiyetan P; Höti N; Zhang Z; Chan DW; Zhang H (2016). Comprehensive analysis of protein glycosylation by solid-phase extraction of N-linked glycans and glycosite-containing peptides. Nat. Biotechnol, 34, 84–88. [DOI] [PMC free article] [PubMed] [Google Scholar]
- 19.Jia X; Chen J; Sun S; Yang W; Yang S; Shah P; Höti N; Veltri B; Zhang H (2016). Detection of aggressive prostate cancer associated glycoproteins in urine using glycoproteomics and mass spectrometry. Proteomics, 16, 2989–2996. [DOI] [PMC free article] [PubMed] [Google Scholar]
- 20.Kohaar I; Chen Y; Banerjee S; Borbiev T; Kuo H-C; Ali A; Ravindranath L; Kagan J; Srivastava S; Dobi A; Sesterhenn IA; Rosner IL; Cullen J; Srivastava S; Petrovics G (2021). A urine exosome gene expression panel distinguishes between indolent and aggressive prostate cancers at biopsy. J. Urology, 205, 420–425. [DOI] [PubMed] [Google Scholar]
- 21.Eskra JN; Rabizadeh D; Pavlovich CP; Catalona WJ; Luo J (2019). Approaches to urinary detection of prostate cancer. Prostate Cancer Prostatic Dis, 22, 362–381. [DOI] [PMC free article] [PubMed] [Google Scholar]
- 22.Benito-Martin A; Ucero AC; Zubiri I; Posada-Ayala M; Fermandez-Fernandez B; Cannata-Ortiz P; Sanchez-Nino MD; Ruiz-Ortega M; Egido J; Alvarez-Llamas G; Ortiz A (2012). Osteoprotegerin in exosome-like vesicles from human cultured tubular cells and urine. PLoS ONE,3, 8:e72387. [DOI] [PMC free article] [PubMed] [Google Scholar]
- 23.Li QK; Chen J; Hu Y; Höti N; Lih TM; Thomas SN; Chen L; Roy S; Meeker A; Shah P; Chen L; Bova GS; Zhang B; Zhang H (2021). Proteomic characterization of primary and metastatic prostate cancer reveals reduced proteinase activity in aggressive tumors. Sci. Rep, 11, 18936. [DOI] [PMC free article] [PubMed] [Google Scholar]
- 24.Lih TM; Dong M; Mangold L; Partin A; Zhang H (2022). Urinary marker panels for aggressive prostate cancer detection. Sci. Rep, 12,14837. [DOI] [PMC free article] [PubMed] [Google Scholar]
- 25.Dong M; Lih TM; Chen SY; Cho KC; Eguez RV; Hoti N; Zhou Y; Yang W; Mangold L; Chan DW; Zhang Z; Sokoll LJ; Partin A; Zhang H (2020). Urinary glycoproteins associated with aggressive prostate cancer. Theranostics, 10, 11892−11907. [DOI] [PMC free article] [PubMed] [Google Scholar]
- 26.Lechevallier E; Eghazarian C; Ortega JC; Roux F; Coulange C (1999). Effect of digital rectal examination on serum complexed and free prostate-specific antigen and percentage of free prostate-specific antigen. Urology, 54, 857–861. [DOI] [PubMed] [Google Scholar]
- 27.Maccini MA; Westfall NJ; Van Bokhoven A; Lucia MS; Poage W; Maroni PD; Wilson SS; Glode LM; Arangua P; Newmark J; Steiner M; Werahera PN; Crawford ED (2018). The effect of digital rectal exam on the 4Kscore for aggressive prostate cancer. Prostate, 78, 506–511. [DOI] [PMC free article] [PubMed] [Google Scholar]
- 28.Chen S; Dong M; Yang G; Zhou Y; Clark DJ; Lih TM; Schnaubelt M; Liu Z; Zhang H (2020). Glycans, glycosite, and intact glycopeptide analysis of N-linked glycoproteins using liquid handling systems. Anal. Chem, 92, 1680–1686. [DOI] [PMC free article] [PubMed] [Google Scholar]
- 29.Chen S; Clark DJ; Zhang H (2021). High-throughput analyses of glycans, glycosites, and intact glycopeptides using C4-and C18/MAX-tips and liquid handling system. Curr. Protoc, 1, e186. [DOI] [PMC free article] [PubMed] [Google Scholar]
- 30.Loeb S et al. (2013). Prospective multicenter evaluation of the Beckman Coulter Prostate Health Index using WHO calibration. J. Urol, 189, 1702–1706. [DOI] [PMC free article] [PubMed] [Google Scholar]
- 31.Dong M; Lih TM; Höti N; Chen S; Ponce S; Partin A; Zhang H (2021). Development of parallel reaction monitoring assays for the detection of aggressive prostate cancer using urinary glycoproteins. J. Proteome. Res, 20, 3590–3599. [DOI] [PMC free article] [PubMed] [Google Scholar]
- 32.Yang G; Hu Y; Sun S; Ouyang C; Yang W; Wang Q; Betenbaugh M; Zhang H (2018). Comprehensive glycoproteomic analysis of Chinese Hamster Ovary Cells. Anal. Chem, 90, 14294−14302. [DOI] [PMC free article] [PubMed] [Google Scholar]
- 33.Liao Y; Wang J; Jaehnig EJ; Shi Z; Zhang B (2019). WebGestalt 2019: gene set analysis toolkit with revamped UIs and APIs. Nucleic Acids Res, 47, W199–W205. [DOI] [PMC free article] [PubMed] [Google Scholar]
- 34.Gabriele C; Prestagiacomo L E; Cuda, G.; Gaspari, M. Mass spectrometry-based glycoproteomics and prostate cancer. (2021). Int. J. Mol. Sci, 22, 5222. [DOI] [PMC free article] [PubMed] [Google Scholar]
- 35.Kohaar I; Petrovics G; Srivastava S (2019). A rich array of prostate cancer molecular biomarkers: opportunities and challenges. Int. J. Mol. Sci, 20, 1813. [DOI] [PMC free article] [PubMed] [Google Scholar]
- 36.Abraham SN; Miao Y (2015). The nature of immune responses to urinary tract infections. Nat. Rev. Immunol, 15, 655–663. [DOI] [PMC free article] [PubMed] [Google Scholar]
- 37.Sreekumar A; Laxman B; Rhodes DR; Bhagavathula S; Harwood J; Giacherio D; Ghosh D; Sanda MG; Rubin MA; Chinnaiyan AM (2004). Humoral immune response to α-methylacyl-CoA racemase and prostate cancer. J. Natl. Cancer Inst, 96, 834– 843. [DOI] [PubMed] [Google Scholar]
- 38.Drake RR; White KY; Fuller TW; Igwe E; Clements MA; Nyalwidhe JO; Given RW; Lance RS; Semmes OJ (2009). Clinical collection and protein properties of expressed prostatic secretions as a source for biomarkers of prostatic disease. J. Proteomics, 72, 907–917. [DOI] [PMC free article] [PubMed] [Google Scholar]
- 39.Wang Z; Liu Y; Lu L; Yang L; Yin S; Wang Y; Qi Z; Meng J; Zang R; Yang G (2015). Fibrillin-1, induced by Aurora-A but inhibited by BRCA2, promotes ovarian cancer metastasis. Oncotarget, 6, 6670–6683. [DOI] [PMC free article] [PubMed] [Google Scholar]
- 40.Cierna Z; Mego M; Jurisica I; Machalekonv K; Chovanec M; Miskovska V; Svetlovska D; Kalavska K; Rejlekova K; Kajo K; Mardiak J; Babal P (2016). Fibrillin-1 (FBN-1) a new marker of germ cell neoplasia in situ. BMC Cancer, 16,597. [DOI] [PMC free article] [PubMed] [Google Scholar]
- 41.Lien H; Lee Y; Juang Y; Lu Y (2019). Fibrillin-1, a novel TGF-beta-induced factor, is preferentially expressed in metaplastic carcinoma with spindle sarcomatous metaplasia. Pathology, 51, 375–383. [DOI] [PubMed] [Google Scholar]
- 42.van Loon K; Yemelyanenko-Lyalenko J; Margadant C; Griffioen AW; Huijbers EJM (2020). Role of fibrillin-2 in the control of TGF-β activation in tumor angiogenesis and connective tissue disorders. Biochim. Biophys. Acta Rev. Cancer, 1873, 188354. [DOI] [PubMed] [Google Scholar]
- 43.Wang Z; Chen W; Zuo L; Xu M; Wu Y; Huang J; Zhang X; Li Y; Wang J; Chen J; Wang H; Sun H (2022). The Fibrillin-1/VEGFR2/STAT2 signaling axis promotes chemoresistance via modulating glycolysis and angiogenesis in ovarian cancer organoids and cells. Cancer Commun. (Lond.), 42, 245–265. [DOI] [PMC free article] [PubMed] [Google Scholar]
- 44.Yasumitsu H; Seo N; Misugi E; Morita H; Miyazaki K; Umeda M (1993). Vitronectin secretion by hepatic and non-hepatic human cancer cells. In Vitro Cell. Dev. Biol, 29A, 403–407. [DOI] [PubMed] [Google Scholar]
- 45.Preissner KT (1991). Structure and biological role of vitronectin. Annu. Rev. Cell. Biol, 7, 275–310. [DOI] [PubMed] [Google Scholar]
- 46.Welcker D; Stein C; Feitosa NM; Armistead J; Zhang J; Lütke S; Kleinridders A; Brüning JC; Eming SA; Sengle G; Niehoff A; Bloch W; Hammerschmidt M (2021). Hemicentin-1 is an essential extracellular matrix component of the dermal-epidermal and myotendinous junctions. Sci. Rep, 11, 17926. [DOI] [PMC free article] [PubMed] [Google Scholar]
Associated Data
This section collects any data citations, data availability statements, or supplementary materials included in this article.