

Summary
Influenza A virus (IAV) infections are frequent every year and result in a range of disease severity. Here, we wanted to explore the potential contribution of transposable elements (TEs) to the variable human immune response. Transcriptome profiling in monocyte-derived macrophages from 39 individuals following IAV infection revealed significant inter-individual variation in viral load post-infection. Using transposase-accessible chromatin using sequencing (ATAC-seq), we identified a set of TE families with either enhanced or reduced accessibility upon infection. Of the enhanced families, 15 showed high variability between individuals and had distinct epigenetic profiles. Motif analysis showed an association with known immune regulators (e.g., BATFs, FOSs/JUNs, IRFs, STATs, NFkBs, NFYs, and RELs) in stably enriched families and with other factors in variable families, including KRAB-ZNFs. We showed that TEs and host factors regulating TEs were predictive of viral load post-infection. Our findings shed light on the role TEs and KRAB-ZNFs may play in inter-individual variation in immunity.
Keywords: transposable elements, Kruppel-associated box zinc finger proteins (KRAB-ZNFs), influenza infection, variable response, epigenetics, gene regulation
Graphical abstract
Highlights
-
•
Several TE families had enhanced accessibility and variability following infection
-
•
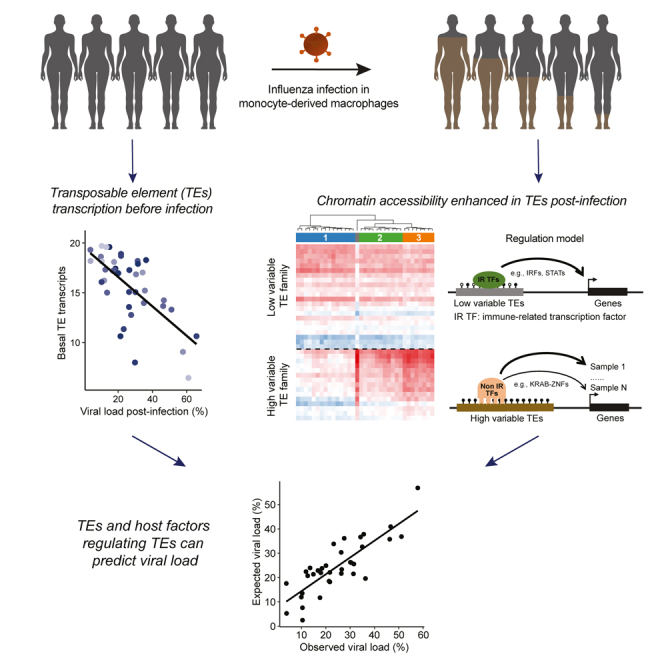
Basal TE transcripts level was inversely correlated with viral load post-infection
-
•
Motif analysis revealed potential host regulatory factors, including KRAB-ZNFs
-
•
TEs and associated host factors were predictive of viral load post-infection
Using multi-omics data from monocyte-derived macrophages before and after influenza infection, Chen et al. characterize transcriptional and epigenetic changes in transposable elements (TEs). They identify epigenetically variable TE families with binding sites for novel host factors. Their findings suggest a role for TEs and KRAB-ZNFs in inter-individual variation in immunity.
Introduction
Influenza A virus (IAV) infection causes seasonal epidemics worldwide and results in a wide range of disease severity between individuals. The underlying reasons for this variability remain largely elusive1,2 but are determined by viral and host factors.3 Indeed, viral determinants alone cannot account for the varied responses observed in individuals challenged by the same virus.1,3,4 The human innate immune system, which involves the modulation of several cellular pathways, is a critical component of the response to infection.5 Upon sensing of a virus such as IAV by recognition receptors, including RIG-I and TLR3, several signal transduction pathways are triggered that further modulate various transcription factors.6,7,8 These regulators, including NF-kB/RELs, IRFs, and STATs, will engage the immune transcriptional network through the alteration of chromatin state, and in turn mediate the differential expression of hundreds of genes involved in the pro-inflammatory and antimicrobial programs to restrict virus replication and transmission.9,10 Host factors involved in this cascade likely contribute to the variable response to IAV infection. Other factors also associated with influenza pathogenesis and that influence the response include pre-existing immunity, age, sex, obesity, and the microbiome.3,11 Yet whether there exist other host factors that are important in determining the response to infection remains unknown.
Transposable elements (TEs), which occupy half of the human genome, play critical roles as cis-regulatory elements in various human biological processes.12,13,14 Notably, a particular subclass of TEs, endogenous retroviruses (ERVs), are derived from ancient retroviruses and retain virus-like features that could stimulate the innate immunity, suggesting a potential association with infection and immunity.15,16,17 Confirming this, an ERV family, MER41, contains regulatory sequences that are repurposed by the host to regulate host genes in the primate innate immune response.18,19 TEs are also drastically upregulated in human immune cells upon extracellular stimuli, including viral infection.20,21,22,23,24 Meanwhile, loss of SETDB1 or SUMO-modified TRIM28, which are associated with histone methylation and Kruppel-associated box domain (KRAB) zinc finger proteins (ZNFs), leads to the de-repression of TEs.23,25 Several studies have also suggested that upregulated TE transcripts may play a role in human innate immunity.26,27 Moreover, given that many TE families have integrated after the divergence of primates from other mammals and are polymorphic in humans,13 they could represent host factors contributing to the variable response to infection. Indeed, TE transcription is linked with aging28,29,30 and microbiota,31 which are associated with the response to infection.3,11
To test whether TEs and associated regulators are important host factors in the variable response to infection, we used data from a multi-omics study that profiled the transcriptome and epigenome before and after IAV infection in monocyte-derived macrophages derived from 39 individuals.32 During the course of IAV infection, the amount of viral transcripts produced is variable and has been associated with disease severity.1,33,34,35 Moreover, the number of viral reads observed in the macrophages post-infection can be used as a surrogate for viral load.36 Indeed, in a similar experimental system this metric was shown to be stable and reproducible across individuals.37 Notably, by studying the infected macrophages from these 39 individuals, we observed extensive variation in the levels of viral reads and discovered a set of TEs displaying high inter-individual variability in chromatin accessibility following infection. By looking for binding motifs in these variable regions we identified novel transcription factors likely contributing to the response to infection. Last, using TEs and these new host factors, we were able to build models that were predictive of the response to infection as measured by the number of viral transcripts.
Results
Many TE families are upregulated following IAV infection, but few are correlated with viral load post-infection
To characterize individual differences in the response to IAV infection, we used RNA sequencing (RNA-seq) data obtained from monocyte-derived macrophages of 39 individuals before and after exposure to IAV for 24 h (Table S1; see STAR Methods and Aracena et al.32). As expected, we observed extensive gene expression changes upon infection (Figure 1A). Even though all samples engaged a strong transcriptional response to infection, we noticed extensive variation in the levels of viral reads (from 3.77% to 65.7%; Figure 1B), suggesting varying capacity for infection and/or to limit viral replication across individuals. Consistent with this hypothesis, viral load was inversely correlated with the expression fold change (FC) of several master regulators of the innate immune response, including transcription factors (TFs; e.g., IRF3, STAT2), adaptor molecules (e.g., MYD88, TICAM1) and interferon-inducible molecules (e.g., IFNAR1, IFNAR2) (Figure S1A). More globally, genes for which the transcriptional response to IAV infection was found to be correlated with viral load (R2 ≥ 0.3, p ≤ 0.05; Figure S1B) were significantly enriched for pathways involved in the viral response. Like protein-coding genes, TE transcription levels were also significantly changed upon infection (Figure 1A). We inspected TE regulation at the level of families and identified 204 upregulated and seven downregulated families (|log2FC| ≥ 1, adjusted p ≤ 0.001), respectively (Figure 1C; Table S2). In line with prior studies, we observed that ERVs (also known as LTRs) were the most commonly upregulated families (179 of 204 [85.5%]) and had the strongest FC (Figure 1C, bottom).
Figure 1.

TEs are upregulated post-infection, but most expression changes are not correlated with viral load
(A) PCA plots of genes (left) and TE families (right) expression of individuals before and after infection. Individuals with African (AF) and European (EU) ancestry are indicated.
(B) Bar plots show viral load (percentage viral reads) across individuals post-infection.
(C) TE upregulation at the family level in human macrophages in response to IAV infection. Up-/downregulated families were detected as families with ≥1 log2 fold change (log2FC) in expression and adjusted p ≤ 0.001 upon infection (top). The highest 20 upregulated families on the basis of fold change are highlighted. The total number of examined families per TE subclass is indicated in parentheses. The vertical line separates the upregulated (left) and downregulated (right) families.
(D) Dot plots of correlation coefficients between TE FC and viral load post-infection. The x axis represents the log2FC of each family computed by DESeq2. The y axis represents the correlation coefficients (R2, computed by linear regression model) between expression FCs and viral load among 39 individuals. The same 20 upregulated families (Figure 1C) are highlighted here. A positively and negatively correlated family (green) is shown as examples in (E) and (F), respectively.
(E) Example of positive correlation between PABL_A-int FCs and viral load.
(F) Example of negative correlation between MER61F FCs and viral load.
Next, we looked at the correlation between TE expression FCs and viral load post-infection. Among the 902 examined families, we only identified 17 and 77 families that were positively and negatively correlated with viral load (R2 ≥ 0.3, p ≤ 0.05), respectively (Figure 1D; Table S3). For example, PABL_A-int was positively correlated with viral load (Figure 1E), while MER61F was negatively correlated with viral load (Figure 1F). Families from the LTR subclass, and ERV1 in particular, were slightly enriched for being positively correlated with viral load (Figure S1C). In contrast, families from the DNA subclass were prone to negatively correlate with viral load. Taken together, we observed significant upregulation of ERVs following IAV infection but the upregulation across individuals was correlated with viral load for only a small number of repeat families.
TEs contribute to dynamic chromatin regions in response to influenza infection
Beyond transcriptional changes, viral infection also induces significant epigenetic changes in immune cells.10 We wanted to explore whether epigenetic profiles at TEs could help explain the inter-individual variability in the response to IAV infection. We used data profiling 35 of the 39 samples before and after infection using transposase-accessible chromatin using sequencing (ATAC-seq) and chromatin immunoprecipitation followed by sequencing (ChIP-seq) technologies characterizing various histone marks (Table S1; see STAR Methods).32 Across these samples, we obtained an average of 137,478 peaks for ATAC-seq, 73,190 for H3K27ac, 230,292 for H3K4me1, 33,700H3K4me3, and 209,119 for H3K27me3 (Figure 2A; Table S4). The number of peaks across all marks was slightly higher in infected compared with non-infected (NI) samples. We observed that on average, 19.5%–47.6% of peaks were in TEs across marks (Figure 2B; Table S4). These proportions were found to be slightly but significantly increased post-infection for H3K4me3 and H3K27me3 (p ≤ 0.05, Student’s t test). To determine which regions were epigenetically variable between individuals, we measured the coefficients of variation (cv) in consensus peak regions32 and identified similar proportions of variable regions in TE and non-TE regions for most marks (0.4%–6.4%, cv ≥ 0.5; Figure 2C; see STAR Methods). Compared with non-TE regions, we observed higher variability of H3K4me3 (an average of 7.3% for TE and 3.6% for non-TE regions) and lower variability of H3K27me3 mark (0.3% for TE and 1.3% for non-TE regions) in TEs, respectively. Given that H3K4me3 is typically associated with transcription, these results suggest variability of TE transcription before and after infection.
Figure 2.

TEs contribute to dynamic chromatin regions in human macrophages in response to influenza infection
(A) Number of peak regions detected in infected and non-infected samples for ATAC-seq and histone marks.
(B) Proportion of ATAC-seq and histone marks peaks that overlap repeat regions. Two-tailed paired Student’s t test was used to compare infected and non-infected samples for each mark.
(C) Number and proportion of variable peak regions overlap TE and non-TE regions. Variable regions were determined with the threshold of coefficient of variation (cv) ≥ 0.5 (see STAR Methods). Bars represent the proportions of peak regions that are variable, while the dotted line represents the corresponding peak counts. Infected (flu) and non-infected (NI) samples are shown separately.
(D and F) Distribution of log2 enrichment levels of families with enhanced (D) and reduced (F) accessibility in infected and non-infected samples. Candidate families were identified using the optimized methodology as we described in Figure S2A. The enrichment level refers to the fold enrichment per sample relative to the corresponding random distribution (see STAR Methods). Families with a high variability of enrichment levels between individuals (SD divided by the mean value, cv ≥ 0.5) are highlighted in blue color (Table S5). The dotted line at “0” represents the random distribution. SDs were computed in non-infected and infected samples separately.
(E and G) Heatmap of log2 fold enrichments (flu/NI) of families with enhanced (E) and reduced (G) accessibility for ATAC-seq and each histone mark (i.e., H3K27ac, H3K4me1, H3K4me3, and H3K27me3). The fold enrichment was computed by dividing the average normalized number of peak-associated instances in infected by non-infected samples. Two-tailed paired Student’s t test was used to compute the p values (∗p ≤ 0.05, ∗∗p ≤ 0.01, and ∗∗∗p ≤ 0.001).
To explore the TE families with accessibility changes upon IAV infection, we compared the normalized number of accessible instances per family as measured by ATAC-seq in infected versus non-infected samples (Figure S2A). We identified 37 families with enhanced accessibility exhibiting 1.5-fold (adjusted p ≤ 0.05) or greater abundance of peak-associated instances in infected relative to non-infected samples (Figure S2B; Table S5). For instance, we observed on average 584.2 peaks overlapping the THE1B repeat family in the flu samples, while only 79.5 were observed in the uninfected samples. The enrichment observed in these families can also be visualized relative to a random genomic background (Figure 2D) and include MER41B that was previously reported in K562, He-La, and CD14+ cell lines.19 Notably, some families displayed a high degree of variation between samples post-infection (e.g., LTR12C, highlighted in blue). A similar analysis revealed that enhanced families were also frequently enriched for histone modifications, especially H3K27ac and H3K4me3 (Figure 2E). For instance, many H3K27ac peaks overlapped with THE1B and MER41B in infected samples (Figure S2C).
One of the advantages of comparing two conditions is that we could also look for TE families showing reduced accessibility upon infection. We identified 39 such “reduced families” (Figures 2F and S2D; Table S5). For instance, although on average 54.3 peaks overlapped L1M4c in non-infected samples, this number dropped to 26.0 in infected samples. Notably, 24 of the 39 (61.5%) reduced accessibility families were LINEs. This contrasts with the fact that only two out of 37 (1.7%) enhanced families were LINEs. Although some families with enhanced accessibility showed high variability between individuals, families with reduced accessibility displayed a uniform profile across most individuals (Figure 2F). Last, by inspecting the enrichments of other histone modifications, we identified seven families with reduced H3K27ac (Figure 2G; Table S5). Taken together, these results highlight many epigenetically changing regions of the human genome upon IAV infection are in TEs.
Several TE families display high inter-individual variability upon infection
Metaplots and heatmaps of chromatin accessibility further supported the high variability observed in some of the enhanced families post-infection. For instance, upon infection, THE1B (Figures 3A and S3A) showed less variation in chromatin accessibility across individuals than LTR12C (Figures 3B and S3A). To better understand why, we performed semi-supervised clustering analysis of the chromatin accessibility of the 37 enhanced families among the 35 infected samples (Figure 3C). This analysis revealed three groups of individuals post-infection. One outlier sample (EU37), was observed to consistently have the lowest fraction of reads in peaks (FRiP) scores among both infected and non-infected samples, suggesting a technical artifact rather than a biologically distinctive response to flu. Using this approach, a total of 15 enhanced families had the highest variability (Figure 3C, bottom), which we defined as “high variable families,” especially between group 1 and group 3 individuals. In contrast, 22 enhanced families showed consistent enrichment patterns between three individual groups and were defined as “low variable families.” A similar analysis in the non-infected samples did not reveal any groupings, suggesting an association specific to IAV infection (Figure S3B). Group 3 individuals tended to be slightly older and present higher viral loads compared with other groups, but the differences were not statistically significant (Figures S3C and S3D).
Figure 3.

Uncovering a set of TE families that display high individual variability in chromatin accessibility post-infection
(A and B) Peak count frequency of ATAC-seq peaks overlapped with THE1B (A) and LTR12C (B). Red and gray lines represent the infected or non-infected samples. Compared with THE1B, LTR12C shows a higher SD between infected samples. Peaks overlapping each TE instance are centered at the median position of peak summits across samples. Upstream and downstream regions (2.5 kb) are shown.
(C) Heatmap of log2 enrichment levels of 37 families with enhanced accessibility in 35 infected samples. Semi-supervised clustering analysis was performed. Three individual groups are shown with an outlier sample. High variable families are highlighted in blue color and have higher enrichment levels in group 3 individuals than group 1 individuals. Enrichment level refers to the abundance of accessible instances in infected samples relative to the background.
(D–H) Comparative analysis of the proportion of flu-specific instances among all accessible instances (D), evolutionary ages (E), proportion of accessible instances among all instances (F), lengths (G), and GC contents (H) of accessible instances between high variable and low variable families. p values, computed using two-tailed Student’s t test, are shown above the dot plots.
Next, we asked what fraction of repeat loci (instances) from the high variable families were contributing to the variability observed between individuals. Unsupervised clustering analysis of these loci revealed that many displayed high variability post-infection (Figure S3E). Among more commonly (≥25% individuals of one group) and rarely (<25%) accessible instances from high variable families, we observed that they were often from group 3 individuals (Figure S4A; STAR Methods). To further identify features that were associated with variability in accessibility in TEs, we performed a comparative analysis between high and low variable families. We focused on flu-specific instances (ATAC-seq peak present in ≥1 infected but not in non-infected samples) and found that high variable families had a significantly higher proportion compared with low variable (p = 2.4 × 10⁻⁶, Student’s t test) (Figures 3D and S4B). In contrast, we did not observe significant differences in the estimated evolutionary age (Figures 3E and S4C). Overall, compared with low variable families, we did find that high variable families had a significantly higher proportion of instances that overlap ATAC-seq peaks, that their repeat consensus length was longer and that they had a higher GC content (Figures 3F–3H and S4D). Taken together, we identified 15 TE families with increased accessibility upon infection and high epigenetic variability between individuals and unique sequence features.
Enhanced and reduced TE families act as cis-regulatory elements in the response to influenza infection
Next, we asked if TE families with enhanced and reduced accessibility acted as cis-regulatory elements regulating nearby genes in response to IAV infection. We found that compared with random genomic regions, upregulated genes were more likely to be located near instances from both low variable and high variable families that become accessible upon infection (flu-specific instances) (Figure 4A). Lower enrichments were observed for high variable compared with low variable families, indicating their weaker association to gene expression. In contrast, we observed a depletion of upregulated genes near non-infected-specific instances (accessible in ≥1 non-infected but not in infected samples) from TE families with reduced accessibility (Figure 4A). Notably, the opposite was observed for downregulated genes (Figure S5A). These effects were stronger for flu-/NI-specific instances compared with instances associated with shared peaks (Figure S5B). Splitting the enrichment at the TE family level, we observed consistent overrepresentation of accessible instances post-infection near upregulated genes within a 100 kb window for most enhanced families (Figure 4B, red color).
Figure 4.

TE families with accessibility changes may play critical regulatory roles in the response to influenza infection
(A) Fractions of upregulated genes near accessible TEs relative to the random distributions. Proportions of upregulated genes are shown within each of the genomic intervals relative to nearby accessible TEs. Flu-specific instances from high variable and low variable families and NI-specific instances from reduced families are considered. The total number of instances are indicated in the figure legend. Expected distributions were computed by randomizing each set of accessible instances 1,000 times (shaded area, 95% confidence intervals), suggesting a statistical significance of p < 0.05 for values outside the distributions. The proportions of upregulated genes are compared with corresponding expected distributions.
(B) Properties of high variable and low variable families overlapped with histone marks and DNA methylation. The number and proportion of accessible instances with nearest significantly upregulated genes within 100 kb (log2FC ≥ 0.5, adjusted p value ≤ 0.05) are shown in red color (first column). The number of CG sites and average DNA methylation levels are shown in blue color (second column). The number and proportion of accessible instances overlapped with each mark are shown in green color (third to seventh columns). The color ranges (proportion of accessible instances) are scaled by the minimum and maximum values for each mark.
(C) Correlation between the accessibility of TE-loci with significant changes of both accessibility (ATAC-seq) and active histone modifications (H3K4me1 and/or H3K27ac) and adjacent gene expression (within 50 kb) post-infection (see STAR Methods). Positively correlated upregulated genes are shown for enhanced families and downregulated genes are shown for reduced families. Strongly correlated immune genes (R2 ≥ 0.3, p ≤ 0.05) are highlighted.
(D) Example genomic view of an accessible LTR12C instance and MER1B instance potentially upregulating adjacent GBP5 gene expression post-infection. LTR12C and MER1B are highlighted as the shaded area with the increased accessibility, expression, H3K27ac, H3K4me1, and H3K4me3 activity. The dark shaded area denotes the distribution of the average reads per million (RPM) values and the light shaded area denotes the SD. Signals of various epigenetic marks are shown in blue color for non-infected samples and red color for infected samples. For RNA-seq, forward and reverse transcripts are shown in blue and green color separately for non-infected samples, while forward and reverse transcripts are shown in red and brown color separately for infected samples.
(E) Positive correlation between the accessibility of LTR12C and MER1B instances with GBP5 expression level post-infection. R2 and p values were computed by the linear regression model.
Next, we investigated the properties of chromatin post-infection more broadly by examining DNA methylation (Figure 4B, blue color) and sets of histone modifications (Figure 4B, green color). Instances from high variable families were highly DNA methylated (an average of 83.8%) and prone to overlap with H3K27me3 (47.3%), meanwhile they had a relatively small fraction of accessible instances overlapped with active marks (e.g., 15.1% for H3K27ac and 31.4% for H3K4me1). In contrast, low variable families were highly enriched for active histone marks (33.2% for H3K27ac and 60.7% for H3K4me1). Overall, low variable and high variable showed distinct chromatin patterns following infection suggesting different activation patterns and potential regulatory impact.
Finally, to further investigate which genes were potentially regulated by these TE-embedded sequences upon infection, we analyzed the list of nearby differentially expressed genes (≤50 kb) and observed an enrichment in various immune-related pathways (Figure S5C). Next, we selected the repeat loci from the enhanced and reduced TE families with significant changes in accessibility and active histone modifications (H3K4me1 and/or H3K27ac). A total of 420 upregulated genes were found in proximity (≤50 kb) to repeat loci from enhanced families and 168 downregulated genes from reduced families (Table S6). Of these, we found 17, 64, and 11 immune-related genes near instances from high variable, low variable, and reduced families, respectively. The correlation between the accessibility of many of these loci and their adjacent genes further supports coordinated regulation (Figure 4C). For example, GBP5 gene is an interferon-induced gene and exhibits antiviral activity against viral infection.38 An LTR12C instance and a MER1B instance with enhanced chromatin accessibility accompanied by an augmentation of H3K27ac and H3K4me1 upon infection can be found near this gene (Figure 4D). The accessibility of the two instances was positively correlated with GBP5 expression level post-infection (Figure 4E). Furthermore, this specific LTR12C instance was previously validated to regulate GBP5 expression in cell lines.39 In a different LTR12C instance near the upregulated immune-related gene IL10RA, transcription was initiated at the open chromatin region within the repeat itself and was flu-specific (Figure S5D). We also confirmed the chromatin change at the LTR12C instance that was shown to be a promoter regulating GBP239 and a MER41 instance that was shown to be an enhancer regulating AIM2 (Figures S5E and S5F).19 Last, we identified several immune-related genes that were potentially regulated by adjacent instances from enhanced families, such as the TE gene pairs of MER52A-GBP1/3, LTR12C-TRIM22, THE1C-IFI44, THE1B-PSMA5, MLT2B3-CLEC4E, and tigger3a-ADAM19 (Figures S5G and S5L). Thus, some of the instances from the enhanced and reduced TE families behave like cis-regulatory elements regulating nearby immune genes.
High variable families contribute transcription factor binding sites for potentially novel host factors in the response to infection
To look for regulatory proteins associated with enhanced and reduced families, we aggregated the reads in open chromatin regions across samples to fine-map the actual peak summit on each TE instance, which was termed a “centroid.” After the removal of instances with inaccurate or inconsistent annotations (Figure S6A), we re-mapped the reads from each TE instance to its TE family consensus sequence. For example, we can visualize the peak centroids identified along the consensus sequences for THE1B, a low variable family (Figure 5A), and LTR12C, a high variable family (Figure 5B). We observed a higher complexity of open chromatin regions for LTR12C compared with THE1B. Centroids were mainly detected at about 180 bp for THE1B and were scattered between 150 and 600 bp for LTR12C. Next, we defined a “TE peak region” as a location on the consensus sequence containing peak centroids from five or more instances, starting with the region with the largest number of instances, named region 1, and so on. For most families, more than 80% of instances were accessible in one of the top 5 TE peak regions (Figure 5C, inset). The location of these TE peak regions can be shown on their consensus sequence and reveals that they are quite dispersed (Figure 5C). For example, 52% MER41B instances were accessible in region 1 located about 380 bp, while another 18% and 11% of them were accessible in region 2 (about 170 bp) and region 3 (about 570 bp) separately. Notably, compared with low variable families, high variable families had significantly more TE peak regions (p = 0.022, Student’s t test) and lower proportions of accessible instances in the top TE peak region (p = 0.0037, Student’s t test) (Figure S6B). This is consistent with the longer length of high variable families (Figure 3G).
Figure 5.

Low variable and high variable families contribute binding sites for distinct sets of potential host factors in the response to infection
(A and B) Distribution of chromatin accessibility along the THE1B (A) and LTR12C (B) consensus sequence. Distribution plots (up) show aggregated (summed) reads per million (RPM) values across accessible instances. Infected and non-infected samples are shown separately. Upstream and downstream regions (±20% of the consensus sequence length) are shown. Heatmaps (bottom) show z-scaled RPM values per accessible instance. In the heatmap, scaled RPM values below zero are shown in white color and the deletions relative to the consensus sequence are shown in gray color. The centroid (blue triangle) refers to the peak summit per instance. The total number of instances are indicated as the y axis.
(C) Distribution of TE peak regions on each enhanced family. A TE peak region was previously defined as a location within a TE that has a peak centroid in ≥5 instances. Here, the locations and proportions (%) of the top-five TE peak regions are shown on each consensus sequence. The number in each dot refers to the proportion among accessible instances (≥10%) in each TE peak region. The y axis shows the family name, consensus name, and the number of accessible instances in TE peak regions. The inset bar plot shows the proportion of instances in each TE peak region. Region 1 represents the TE peak region with the highest proportion, region 2 refers to the second highest, and so on. High variable families are in blue color.
(D) TF binding motifs enriched in enhanced families. Same motifs enriched across TE peak regions are aggregated. TE peak regions with the most number of instances are shown as representatives. Black boxes highlight candidate motifs recognized by known immune regulators enriched in low variable families; brown boxes highlight top candidate motifs recognized by potential novel host factors enriched in high variable families. High variable families are highlighted in blue color. Mean TF activity was obtained from Aracena et al.32 Missing values are in gray color.
To further investigate the molecular mechanism underlying the enhanced families, we examined the TF binding motifs that were enriched in each TE peak region (Figure 5D; Figure S6C). The enrichment of binding sites for STATs and IRFs in MER41B were previously reported.19 Here we found that the STAT related motifs mainly came from MER41B instances that were accessible in region 1, while IRF-related motifs came from region 3. STATs were also observed in various Tigger3 and MER44 families, while IRF-related motifs were also enriched in various MER44 families, LTR8, and Tigger7. Other motifs of interest observed in consensus peak regions included FOSs/JUNs, BATFs, NFkBs/NFYs, and RELs. Notably, this instance-level motif analysis also revealed distinct sets of binding motifs between high variable and low variable families (Figure 5D). Specifically, low variable families were enriched for motifs of known immune regulators (e.g., BATFs, FOSs/JUNs, IRFs, STATs, NFkBs, NFYs, RELs), while high variable families were enriched for other motifs (e.g., ASCLs, CTCFs, EBFs, MAZ, MYOG, PLAGs, TFAP2s, various KRAB-ZNFs).
We speculated that the binding of TFs like KRAB-ZNFs may be associated with the individual epigenetic variability observed in high variable families post-infection. For example, by clustering accessible HERVE-int instances, we found that instances with peaks in regions 3 and 4, which were enriched for TFAP2 and ZNF460 motifs (Figures 5D and S6C), were prone to be accessible in group 3 rather than group 1 individuals (Figures S6D and S6E). Supporting the potential role of KRAB-ZNFs in high variable families, we observed that the binding sites for KAP1 and multiple ZNF TFs40 were enriched in some high variable families (Figure S7A; Table S7); Moreover, the binding regions significantly overlapped the open chromatin regions in some high variable families post-infection (Figure S7B). Because of the limited number of KRAB-ZNF motifs in the JASPAR database, we used another source of KRAB-ZNF motifs41 to identify motifs across the accessible instances from enhanced families. We observed enrichment of KRAB-ZNF motifs in high variable families but not in low variable ones (Figure S7C; Table S7). KRAB-ZNFs are commonly found to interact with the KAP1/TRIM28 machinery to repress TEs through DNA and histone repression,42,43 thus the enrichment of KRAB-ZNF binding sites and motifs in high variable families is also consistent with the high DNA and histone repression observed in these families (Figure 4B).
Finally, we performed a similar analysis to examine the TE peak regions and corresponding motifs enriched in the 39 families with reduced accessibility (Figures S8A and S8B). We identified the enrichment of IRF1, MEF2A/B/C/D and SPI related motifs in these families. Notably, L1MA2, L1MA4, L1MA6, L1MA7, and L1MA8 were significantly enriched for MEF2 related motifs. MEF2 TFs are central developmental regulators,44 which are also required in the immune response that functions as an in vivo immune-metabolic switch.45 Last, by further inspecting TFs with their binding motifs that were enriched in enhanced and reduced TE families, we found that TFs bound to high variable families were mainly enriched in transcription-related pathways while TFs bound to low variable and reduced families were mainly enriched in immune-regulated pathways (Figure S8C). Taken together, we concluded that high variable families have a unique profile and are associated with potentially new host factors, including KRAB-ZNFs.
TE-associated host factors can be used to predict viral load post-infection
Finally, we asked whether TE and TE-associated host factors can be predictive of viral load post-infection. As we previously noted, the expression changes of most TE families were not correlated with viral load (Figure 1D), however, we further inspected the TE expression levels in non-infected and infected samples, respectively. Unlike expression changes, we observed that the basal and post-infection expression levels of many families were correlated with viral load (Figures 6A and S9A; Table S3). Basal expression of most TE families had comparable correlation coefficients, in contrast to post-infection expression levels. Combining reads across families, we found that there was a strong inverse correlation between the total amount of basal TE transcripts and viral load post-infection (R2 = 0.45, p = 2.69 × 10⁻⁶; Figure 6B). Inverse correlations were also observed for each of the four main TE subclasses (Figure S9B). As expected, the basal activation of the immune system (interferon signature) was also inversely correlated with viral load (Figure 6C; R2 = 0.38; see STAR Methods).
Figure 6.

TEs and TE-associated host factors are predictive of viral load post-infection
(A) Distribution of correlation coefficients (R2) between the TE expression level (TPM) in non-infected and infected samples and TE expression fold changes with viral load post-infection. Log2FCs and TPM values were calculated as we previously described. Four TE subclasses are shown separately. Correlation directions are shown in Figure S9A. R2 values were computed using the linear regression model.
(B) Inverse correlation between the amount of basal TE transcripts and viral load. The basal TE transcript refers to the proportion of aggregated normalized read counts in TEs among the global transcripts. The black line represents the regression line. R2 and p values computed using the linear regression model are shown.
(C) Inverse correlation between the basal type I interferon (IFN) signature (score) and viral load. The IFN signature represents the median expression level (TPM value) of genes involved in type I interferon signaling pathways (Table S8).
(D and E) Correlations between the basal expression levels of SETDB1 (D) and TRIM28 (E) and viral load. It shows that SETDB1 (R2 = 0.42) rather than TRIM28 (R2 = 0.03) basal expression is associated with viral load. Basal SETDB1 expression is also positively correlated with the basal TE transcripts and IFN signature before infection (Figure S9I).
(F) Violin plot of the correlation coefficients between the basal expression of KRAB-ZNFs and other genes with viral load post-infection. A list of human KRAB-ZNFs was obtained from Imbeault et al.40 and immune genes were obtained from the InnateDB database.51 The top 10 most correlated KRAB-ZNFs are highlighted.
(G) Violin plot of the correlation coefficients between basal TF expression levels (TPM values) and viral load. Immune and non-immune TFs are compared using the paired Student’s t test, and the p value is also shown. Black bars represent mean values. TF genes were obtained from the JASPAR database as we previously used for the motif analysis and Immune TFs were obtained from the InnateDB database. Only expressed TFs are shown. Colors indicate motifs that are enriched in different categories of families, and asterisk highlights the motifs that are enriched in multiple categories.
(H) Multivariable regression model developed for the prediction of viral load using the expression levels of immune TFs in the basal state. The top six correlated TFs to viral load that are also associated with TEs were used. The model was generated as we described in STAR Methods. The formula and variables and adjusted R2 are shown.
(I) Multivariable regression model developed for the predictive of viral load using the TE-associated non-immune (novel) host factors in the basal state. Using the same approach (see STAR Methods), a subset of features were selected among the age and six non-immune factors, including SETDB1, TE transcripts, TE methylation, ZNF566, ZNF611, and PLAGL1.
(J) Multivariable regression model developed for the predictive of viral load using the TE-associated immune and non-immune host factors in the basal state. We included all the non-immune factors as well as STAT2 to generate the model. STAT2 was selected on the basis of the correlation to viral load.
To explore the role of other factors known to be associated with the regulation of TEs, we inspected both TRIM28 and SETDB1. We first examined the FC and observed a strong correlation to viral load post-infection for SETDB1 but not for TRIM28 (Figure S9C). Similarly, an inverse correlation was observed between SETDB1 basal expression and viral load (R2 = 0.42, p = 7.83 × 10⁻⁶) but not for TRIM28 (R2 = 0.026, p = 0.32) (Figures 6D-6E). We then examined the basal expression levels of all KRAB-ZNFs and observed a significantly higher correlation with viral load compared with immune and non-immune-related genes (Figure 6F; Table S7). Next, looking at the average DNA methylation in TEs pre-infection, we did not observe a correlation with viral load (Figure S7D). Age is another factor that is potentially associated with TEs, even though it was not observed to correlate with viral load in our data (Figure S9E). We noted that the variability of basal TE transcription increased as the age increased (Figure S9E). Actually, the inverse correlation observed between basal TE transcripts and viral load became even stronger (R2 = 0.76, p = 4.6 × 10⁻⁷) with the exclusion of individuals older than 40 years old (Figure S9F).
We continued our analysis of the host factors that are associated with epigenetic variability in high variable families. First, we examined the correlations between basal expression levels of all expressed TFs and viral load (Figure 6G). As expected, known immune-related TFs had higher correlation coefficients with viral load compared with non-immune TFs (p = 3.7 × 10⁻³). Focusing on TFs associated with enhanced and reduced TE families, we found that many were strongly correlated with viral load (Figure 6G). We further found that the expressions of ten KRAB-ZNF genes were strongly correlated with the aggregated accessibility of high variable families post-infection (Table S7; R2 ≥ 0.3, p ≤ 0.05). After integrating these results, we identified PLAGL1 and three KRAB-ZNFs (i.e., ZNF519, ZNF566, and ZNF611) as top candidate host factors (Figure S9G; Table S7). Notably, PLAGL1, which is a family member of PLAG1, also encodes a C2H2 zinc finger protein that could be repressed by SUMOylation.46
Last, we wanted to test our ability to combine all this information into predictive models to estimate the variable responses to IAV infection. We started with IFN related features as variables including the IFN signature and age to achieve a model explaining 36% of the variation (Figure S9H). Next, we included the top six immune factors bound to low variable families that were correlated with viral load as variables and used a stepwise approach to select the final set of features in a generalized linear model (see STAR Methods). Age was also included as an interaction term variable because of its influence on multiple variables. Using this approach, we were able to build a better model (adjusted R2 = 0.625) (Figure 6H). Afterward, we looked at all the TE-related host factors described above in a correlation matrix chart with viral load (Figure S9I). Notably, when we included six non-immune factors associated with TEs and age in our model, we obtained a slightly better fit with a model that includes TE transcripts and the new factors including ZNF566, ZNF611, and PLAGL1 (adjusted R2 = 0.655) (Figure 6I). Adding the top correlated immune TF (i.e., STAT2) further increased the accuracy of the model (adjusted R2 = 0.758) (Figure 6J). As expected, if we used age as an independent variable in these models, the predictive accuracies decreased significantly (Figure S9J). Altogether, we concluded that TEs and TE-related host factors can be used to predict viral load in macrophages post-infection.
Discussion
Inter-individual variability in disease is at the core of precision medicine. By examining TE transcription and epigenetic state in macrophages derived from 39 individuals, we provided new insights into the contribution of TEs to the response to IAV infection. Specifically, we discovered a set of 15 TE families with high inter-individual variability in chromatin accessibility post-infection (Figure 3C). Besides the distinct sequence features and chromatin states they promote, we found that high variable families enrich for TF binding motifs of potentially new host factors in the response to infection (e.g., KRAB-ZNFs); in contrast, other TE families of interest mainly enrich TF binding motifs for known immune regulators (Figures 7, S6, S7). Given that many of the TF binding motifs enriched in high variable families were associated with proteins that are known to interact with the KAP1/TRIM28 machinery suggests that this pathway may contribute to the inter-individual epigenetic variability post-infection. We also speculate that the enhanced accessibility in these families may be because of gradual chromatin de-repression led by the reduced expression of SETDB1 or TRIM28 upon infection.
Figure 7.

Regulatory models of TEs in response to influenza infection in human primary macrophages
(A) Epigenetic states of enhanced and reduced families in macrophages pre-infection. Before infection, high variable and low variable families are not accessible because of the lack of corresponding TFs binding or repression by high DNA methylation or histone methylation. In contrast, families with reduced accessibility, also called reduced families, are accessible and bound by a distinct set of known immune-related (IR) TFs, including MEF2s and SPIs. High variable families are relatively longer and show a higher DNA and histone methylation level compared with other families.
(B) Epigenetic states of enhanced and reduced families in macrophages post-infection. Chromatin accessibility of high variable and low variable families are enhanced post-infection. High variable families are bound mainly by potential novel host factors (non-IR TFs), including multiple KRAB-ZNFs such as ZNF566 and ZNF611; low variable families are bound mainly by known immune-related regulators (IR TFs), including IRFs and STATs. Reduced TEs are prone to be less accessible because of the decreased expression of various TFs (e.g., MEF2s) post-infection. High variable families display a high variability in accessibility post-infection and may differentially regulate nearby genes between individuals.
In this study, multiple chromatin regions were identified for each TE family (Figures 5C and 5D). For example, we observed the top peak region of MER44D to be significantly enriched for FOS/JUN related motifs, while another region was enriched mainly for IRF-related motifs. Thus, the same TE family appears to contribute multiple binding regions recognized by different TFs, suggesting that each family may play complex regulatory roles upon infection. Additionally, by comparing the TE enrichment levels between infected and non-infected monocyte-derived macrophages following IAV infection, we were able to identify families with reduced chromatin accessibility (Figure 2F). These families would have been missed by previous approaches that relied on an expected distribution as control.18,19,47,48 Moreover, although many LINE families were found to have reduced accessibility post-infection, we still observed two LINE families (L1PA12 and L1M2a) with enhanced accessibility. This may be due to the absence in these families of TFBS found enriched in their counterparts with reduced accessibility (e.g., SPIs, MEF2s). On the other hand, the observed epigenetic changes in the LINE families with reduced accessibility may not affect their transcription which were slightly upregulated post-infection.
Our data also revealed a strong inverse correlation between the basal TE transcripts and viral load post-infection. In line with the involvement of TE transcripts in the activation of innate immunity,26,27 we speculate that TE transcription in macrophages before infection may be involved in the activation of the innate immune response to IAV infection. To further support this claim, we combined TE basal expression levels with other factors identified in the analysis of high variable families, such as TE DNA methylation, SETDB1, and PLAGL1 expression levels, and were able to build a model that was predictive of the response to infection (Figures 6H–6J). Some polymorphic TEs were also found to be expression quantitative trait loci (eQTLs) for genes upon infection, such as TRIM25,49 thus we speculate that polymorphic TEs may act as enhancers and further contribute to the variable response to infection.
Altogether, our data depict major epigenetic shifts in TEs in human macrophages upon infection, opening mostly in LTR/ERVs and closing in LINEs. It is intriguing to consider that TEs might not only be an important source of regulatory innovation between species18,19 but also of regulatory variation within a population.
Limitations of the study
The proximity of these variable TE loci to important immune genes suggest that they may contribute to the variable response to influenza infection, although further work will be needed to demonstrate a causal link between variation in TE activity and viral control. Another aspect that would be interesting to dissect is whether the variation observed is consistent over time or a consequence of the fact that we looked at a specific time point. It will also be interesting to expand this analysis and study the contributions of TEs in other immune cells (e.g., CD4+ T cells, pneumocytes, and dendritic cells5,50) and to challenges with other pathogens. More samples will be needed to improve and validate the predictive model we constructed using TEs and TE-associated host factors.
STAR★Methods
Key resources table
| REAGENT or RESOURCE | SOURCE | IDENTIFIER |
|---|---|---|
| Biological samples | ||
| Macrophage | Aracena et al.32 | N/A |
| Deposited data | ||
| RNAseq and ATACseq and ChiP-seq | Aracena et al.32 | EGAD00001008422 |
| WGBS | Aracena et al.32 | EGAD00001008359 |
| KAP1 and KRAB-ZNF ChiP-seq | Imbeault et al.40 | GSE78099 |
| Software and algorithms | ||
| VariabilityInTE | This Study | https://github.com/xunchen85/VariabilityInTEs; Zenodo https://doi.org/10.5281/zenodo.7532781 |
| Trimmomatic version 0.36 | Bolger et al.52 | http://www.usadellab.org/cms/?page=trimmomatic |
| TopHat2 version 2.1.1 | Kim et al.53 | https://ccb.jhu.edu/software/tophat |
| SAMtools version 1.10 | Li et al.54 | https://github.com/samtools/samtools |
| Fastq-pair version 0.3 | Edwards et al.55 | https://github.com/linsalrob/fastq-pair |
| Tetranscripts version 2.1.4 | Jin et al.56 | https://github.com/mhammell-laboratory/Tetranscripts |
| DESeq2 version 1.32.0 | Love et al.57 | https://bioconductor.org/packages/release/bioc/html/DESeq2.html |
| PCAtools version 2.4.0 | N/A | https://github.com/kevinblighe/PCAtools |
| g:Profiler | Raudvere et al.58 | https://biit.cs.ut.ee/gprofiler/gost |
| BEDtools version 2.30.0 | Quinlan et al.59 | https://github.com/arq5x/bedtools2 |
| MEME version 5.0.3 | Bailey et al.60 | https://meme-suite.org/meme/doc/download.html |
| R version 4.1.0 | N/A | https://www.r-project.org |
| Python version 3.7.7 | N/A | https://www.python.org |
| mysql version 5.7 | N/A | https://www.mysql.com |
| ggplot2 version 3.3.5 | N/A | https://ggplot2.tidyverse.org |
| heatmap.2 version 3.1.1 | N/A | https://www.rdocumentation.org/packages/gplots/versions/3.1.1 |
| immuneTE | Bogdan et al.18 | https://github.com/lubogdan/ImmuneTE |
| JASPAR 2020 | Fornes et al.61 | https://jaspar2020.genereg.net/download/data/2020/CORE/JASPAR2020_CORE_non-redundant_pfms_meme.txt |
| KRAB-ZNF motif database | Barazandeh et al.41 | http://kznfmotifs.ccbr.utoronto.ca/data.html |
| InnateDB version 5.4 | Breuer et al.51 | https://www.innatedb.com/ |
Resource availability
Lead contact
Further information and request for resources and reagents should be directed to and will be fulfilled by the lead contact, Guillaume Bourque (guil.bourque@mcgill.ca).
Materials availability
This study did not generate new unique reagents.
Experimental model and subject details
Materials and sequencing data generation
To study the inter-individual variability in TEs following influenza A (IAV) infection, we collected primary macrophage cells from peripheral blood mononuclear cells of 39 healthy female individuals with African American (n = 19) and European-American (n = 20) ancestry between 18 and 54 years old. We then infected macrophages (cultured for 6 days) with IAV for 24-h and collected both non-infected and infected macrophages for multiple sequencing assays. The details were described here.32 Briefly, we conducted the ATAC-seq assay to study chromatin accessibility. Using chromatin immunoprecipitation sequencing (ChIP-seq) technology, we also investigated the genome-wide profiles of H3K27ac, H3K4me1, H3K4me3, and H3K27me3 histone modifications. H3K27ac and H3K4me1 have been widely used to mark enhancers; H3K4me3 mark has been associated with promoters or active transcription; H3K27me3 mark has been associated with chromatin repression. Whole-genome bisulfite sequencing (WGBS) was further used to profile genome-wide DNA methylation. RNA sequencing (RNA-seq) was used to profile the transcriptome. All sequencing assays were performed in both infected and non-infected macrophages of each donor. Samples and generated sequencing datasets were summarized in Table S1.32 Detailed methodologies to profile the genome-wide DNA methylation level and chromatin modifications were also described here.32
Method details
RNA-seq read alignment
Trimmomatic (v0.36) was first used to trim adapter sequences with the parameters PE -phred33 -quiet -validatePairs ILLUMINACLIP:$EBROOTTRIMMOMATIC/adapters/TruSeq3-PE.fa:2:30:15:2:true LEADING:3 TRAILING:30 MINLEN:50.52 After trimming off the adapters and low-quality nucleotides, high-quality paired-end RNA-seq reads were aligned against the human reference genome (hg19, https://hgdownload.soe.ucsc.edu/goldenPath/hg19/bigZips/hg19.fa.gz) using TopHat2 v2.1.1.53 To optimize for the analysis of TE transcription, we kept multi-mapped reads with the recommended parameters -x 100 –no-mixed.56 Gene annotation file “hg19.ensGene.gtf” was obtained from https://hgdownload.soe.ucsc.edu/goldenPath/hg19/bigZips/genes/.
Viral load calculation
To estimate the viral load, we re-aligned high-quality paired-end RNA-seq reads against the human reference genome (hg38, https://hgdownload.soe.ucsc.edu/goldenPath/hg38/bigZips/hg38.fa.gz) using TopHat2 with the default parameters. Paired-end unmapped reads were extracted from the unmapped BAM files and converted to FASTQ format using SAMtools (v1.10) fastq function.54 Obtained FASTQ files were then reformatted using Fastq-pair (v0.3) tool with the parameter -t 1000000.55 Using TopHat2 with the same parameters, paired-end unmapped reads were aligned against the influenza A virus (H1N1) reference genome, which contains eight fragments including NC_002016.1, NC_002017.1, NC_002018.1, NC_002019.1, NC_002020.1, NC_002021.1, NC_002022.1, NC_002023.1. After that, we retrieved the number of reads mapped to influenza. Lastly, viral load was computed as the percentage of reads mapped to the influenza genome versus the total number of reads mapped to both human and influenza reference genomes.
Gene/TE expression levels measurement
TEcount implemented by TEtranscripts (v2.1.4)56 was used to measure the gene and TE expression at the family level using RNA-seq data. Expression of each family represents the total number of reads mapped to all instances from the same family. We ran it with the use of sorted BAM file as the input and following parameters: --sortByPos –TE hg19_rmsk_TE.gtf –GTF hg19.ensGene.gtf –stranded reverse –mode multi. The repeat annotation file “hg19_rmsk_TE.gtf” was downloaded from http://labshare.cshl.edu/shares/mhammelllab/www-data/TEtranscripts/TE_GTF/. After running, we obtained the output file for each sample which contains two columns, one column specifying the names of genes and TE families, and another column specifying corresponding read counts. The output files of all samples were combined into a count matrix for the downstream analysis.
Differential expression and PCA analysis
To perform the differential expression analysis, the obtained count matrix was used as the input to DESeq2 v3.9.57 Non-infected samples were used as the control group and infected samples were used as the case group. After the removal of non-expressed TE families and genes (<2 reads across samples), the count matrix was then standardized following QC steps of DESeqDataSetFromMatrix, estimateSizeFactors, estimateDispersions, and nbinomWaldTest included by DESeq2. Lastly, after we retrieved the output using the results function, we kept the significantly differentially expressed genes and TE families from DNA, LINE, SINE, LTR and SVA subclasses with the thresholds of |log2FC| ≥ 1 and adjusted p value ≤0.001.
To perform the principal component analysis (PCA), we applied a variance stabilizing transformation (vst) to the achieved normalized count matrix. We then used the PCAtools pca function with the parameter removeVar = 0.1 for the PCA analysis and biplot function for the visualization (https://github.com/kevinblighe/PCAtools). Genes and TE families were analyzed separately.
Expression levels normalization
Transcripts per kilobase million (TPM) values were calculated using the raw count matrix for genes and TE families. Specifically, we first computed the reads per kilobase (RPK) for each gene and family. For genes, we divided the read counts by the aggregated total lengths of exons per gene in kilobases; for TE families, we divided the read counts by the aggregated lengths across all instances per family. We next counted up the RPK values of both genes and TE families and divided them by 1,000,000 to obtain the TPM values.
Genes and viral load correlation analysis
We then examined which differentially expressed genes (DEGs) are correlated with viral load. Here, we only considered highly-expressed genes with an average of TPM values ≥1 in either infected or non-infected samples. The expression fold change (log2FC) of each gene was computed using the formula: . FCs were correlated with viral load post-infection using R lm function. DEGs correlated with viral load (R2 ≥ 0.3 and p value ≤0.05) were then submitted to the g:Profiler (https://biit.cs.ut.ee/gprofiler/gost) with the default parameters for the pathway enrichment analysis.58 G:SCS threshold with a minimum p value of 0.05 was used to determine the enriched pathways. Kyoto Encyclopedia of Genes and Genomes (KEGG) database was used to determine the enriched pathways and the top 30 terms were visualized. Key immune regulators involved in the RNA viral signaling pathway were obtained here.8 Similarly, we also correlated the basal gene expression (TPM) with viral load.
TEs and viral load correlation analysis
To measure the variability of TE transcription, we correlated expression fold changes of each family with viral load post-infection. Expression FC of each family per sample was computed with the same formula: . Similarly, R lm function was used for the correlation analyses. Positive and negative correlated (R2 ≥ 0.3 and p value ≤0.05) families were reported.
To study the enrichment of positively or negatively associated families among each TE subclass, we performed the permutation test by comparing the actual proportion of positively/negatively correlated families among each TE subclass or superfamily relative to 10,000 randomized proportions. p value was calculated using the formula in R: .
Using the same approach, we correlated the expression of TE families in infected and non-infected samples with viral load post-infection. Computed TPM values were used for the correlation analysis.
Peaks-associated TEs detection
After profiling the epigenetic state, we obtained ATAC-seq and Chip-seq narrow peaks in BED format. Peak regions were then converted to peak summits (median positions). To identify ATAC-seq peaks-associated instances, peak summits were intersected with the obtained repeat annotation file “hg19_rmsk_TE.gtf” using BEDtools v2.29.2 intersect function59 with the parameters -wa -u. The same analysis was performed for other histone marks.
Epigenetic variability analysis
Unique ATAC-seq consensus peaks were obtained as we previously described.32 To identify consensus peaks in TEs, we first converted peak regions to summits (median positions) and then intersected with the repeat annotation file aforementioned using BEDtools intersect function with the parameters -wa -wb. After that, read counts were normalized to RPM value for the downstream comparative analysis across samples. Specifically, the read count was first divided by the total number of reads and then multiplied 1,000,000. The coefficient of variation (cv) of each peak region was computed using the formula: . Infected and non-infected samples were analyzed separately. Consensus peak regions with a minimum RPM value of “1” were kept. Variable regions were defined as the peak regions with cv values ≥0.5, referring to regions with the standard deviation that is half of the mean. Proportions of variable regions in TEs and non-TEs were compared. Same analysis was performed for other histone marks.
TEs with epigenetic changes detection
We next aimed to identify TE families with enhanced accessibility upon infection. Firstly, we normalized the number of peaks-associated instances per family. Briefly, we divided the number of peaks-associated instances by the total number of peaks per sample, and then multiplied the average number of peaks across samples. Infected and non-infected samples were normalized, separately. Secondly, to identify families with enhanced accessibility during infection, we kept families with significantly more peaks-associated instances (≥1.5-fold, adjusted p value ≤0.05) in infected than non-infected samples. Two-tailed paired Student’s t test was used for the comparison and the resulting p value was adjusted for multiple testing with the Benjamini-Hochberg using the R p.adjust function. Lastly, we kept family candidates from DNA, LINE, SINE, LTR, and SVA subclasses with a minimum of 20 peaks-associated instances on average among either infected or non-infected samples.
Similarly, to identify families with reduced accessibility, we kept families with significantly more peaks-associated instances (≥1.5-fold, adjusted p value ≤0.05) in non-infected than infected samples. Same analysis was applied to each histone mark to identify families with dynamic regulatory (e.g., enhancer or promoter) potentials upon infection.
We also computed the enrichment level of each family by comparing the actual number of peaks-associated instances with its expected distribution.18 Specifically, we first annotated peaks-associated instances using BEDtools intersect function with the parameters -wa -u based on the annotation files (i.e., desert, distal, proximal, 5′ untranslated region (5′UTR), promoter, transcription start site (TSS), exon, and intron regions) obtained from https://github.com/lubogdan/ImmuneTE. We then shuffled the true peaks while keeping the distribution relative to each region using BEDtools shuffle function with the parameters -incl or -excl, for 1000 times. The randomized peaks were intersected with the repeat annotation file to achieve the number of expected peaks-associated instances per family. Lastly, we computed the enrichment level of each family as the actual number of peaks-associated instances relative to the average number of the expected values.
TE clustering analysis
To identify families with high variability, we performed the semi-supervised clustering analysis of enhanced families in 35 infected samples. Here, to rule out the impacts of different genomic distribution between TE families, we used the enrichment level relative to the expected distribution rather than the actual number of instances for the clustering analysis. Briefly, the enrichment levels of enhanced families were gathered into a data matrix followed by the log2 conversion. R heatmap.2 function was used to perform the unsupervised clustering analysis with the default parameters. Based on the obtained enrichment pattern among samples, we re-ordered the families. Families with higher enrichment levels in Group 3 individuals than Group 1 individuals were distinguished. Non-infected samples were analyzed separately.
We then want to understand whether individual instances from high variable families display a high variability in infected samples. Peaks-associated instances from high variable families were collected. Instances with open chromatin were recorded as “1”; instances with closed chromatin were recorded as “0”. We then performed the clustering analysis using R hclust function with the default parameters.
High variable instances analysis
For each accessible instance, we first computed the percentage of samples from each group that were accessible post-infection. Next, we defined commonly accessible instances as the instances that were accessible in 25% or more samples from one individual group; we also defined rarely accessible instances as the instances that were accessible in less than 25% samples from any groups. An instance that was accessible in more than 25% samples for commonly accessible instances and one or more samples for rarely accessible instances was considered as enriched in one individual group. Lastly, we computed the proportion of instances that were prone to be accessible in each group.
TE age estimation
The evolutionary age of each instance was estimated using our previous approach.18,62 In brief, the sequence divergence of each instance relative to the corresponding consensus sequence was obtained from the “.align” file generated by RepeatMasker (https://www.repeatmasker.org/). Hg19 “.align” file was obtained from the UCSC database (https://hgdownload.soe.ucsc.edu/goldenPath/hg19/bigZips/). The divergence rate of each instance was divided by the substitution rate for the human genome (2.2 × 10⁻⁹) to compute the age per instance.63 The average ages across all instances was referred to the age of each TE family.
TE peak centroids detection
We next want to fine-map the peak centroid on each accessible instance. Read depths were extracted from the aligned BAM file using BEDtools genomecov function with the parameter -d and then divided by 1,000,000 to compute the RPM values. We then aggregated (summed) RPM values of each nucleotide across accessible instances. Infected and non-infected samples were analyzed separately. The nucleotide with the highest RPM value was recorded as the peak centroid of each instance. Peak centroids in infected samples were used for families with enhanced accessibility; peak centroids in non-infected samples were used for families with reduced accessibility.
Alignment of instances to consensus sequences
We next wanted to map accessible instances to corresponding consensus sequences. The aforementioned RepeatMasker “.align” file was used to retrieve the consensus positions at single-nucleotide resolution. Instances with consistent start and end positions with the “.out” file were kept for downstream analyses. The inconsistency was potentially due to the defective annotation methodologies for the nested instances, extremely short instances, etc. It was a fact that instances of one TE family may be aligned to different consensus sequences. Thus, we wanted to focus on instances aligned to the most representative consensus sequence for each family. In the end, we pinpointed the peak centroid to the consensus sequence.
We plotted the aggregated RPM values relative to the consensus sequence using R. We also clustered accessible instances using the RPM values relative to the consensus sequence. Specifically, after z-transformation, scaled RPM values ≤0 and consensus regions with deletions were recoded as “0”. R function heatmap.2 with the default parameter was used for the unsupervised clustering analysis. Heatmap was plotted using ggplot2 in R.
TE peak regions detection
We next wanted to identify “TE peak regions”, which referred to the consensus regions that become accessible on multiple instances. We first excluded instances that were only accessible in the outlier sample and then used the sliding window approach to identify TE peak regions. To iterate over the entire consensus sequence, the window size was set at 100 bp with a step size of one base pair. In each step, we counted the total number of peak centroids within each 100 bp window. The 100 bp-window containing the most peak centroids was identified as a TE peak region (≥5 peak centroids). After the exclusion of previously counted peak centroids, the analysis was repeated until all candidate TE peak regions were identified. The proportion of instances in each TE peak region was computed. TE peak regions were identified using peak centroids in infected samples for enhanced families and non-infected samples for reduced families.
Motif enrichment analysis
Firstly, we extracted 100 bp sequence centered at the centroid of each TE instance using BEDtools getfasta function with the -s parameter and then used the MEME fimo function to search the extracted sequences for known motifs from the latest eighth release of JASPAR motif database (http://jaspar.genereg.net/download/CORE/JASPAR2020_CORE_vertebrates_non-redundant_pfms_meme.txt).60,61 Instances uniquely accessible in the outlier sample were excluded. Secondly, instances were categorized into each TE peak region, e.g., TE peak region with the most instances was named as “Region 1” and so on. TE peak regions with less than five instances were excluded. Instances not in TE peak regions were grouped as “No regions”. Thirdly, we computed the proportion of instances (100 bp centered at the centroid) containing each motif for each TE peak region. The top 5 most abundant motifs in each TE peak region were kept as candidates. To obtain enriched motifs per family, we kept motif candidates appearing in more than 20% instances in each TE peak region and more than 50% instances per family. Lastly, the same motifs detected in multiple TE peak regions were aggregated (summed) to recalculate the proportion; motifs enriched in a total of ≥50 instances across families were kept as top candidates. After the analysis, enriched motifs were compared between different TE peak regions and families.
The JASPAR motif database contains a small number (<30) of KRAB-ZNF motifs. To comprehensively search for KRAB-ZNF motifs in TEs, we further screened motifs across the accessible TE instances from enhanced families by using the 242 KRAB-ZNF motifs reported by Barazandeh et al.41
KRAB-ZNF binding site enrichment analysis
To explore whether KRAB-ZNF binding sites are enriched in enhanced families, we achieved the KRAB-ZNF binding sites reported by Imbeault et al.40 We then computed the enrichment level of KAP1 and each KRAB-ZNF across TE families using the same approach as we described above.
We also inspected whether the KAP1 and KRAB-ZNFs are in the open chromatin regions in TEs. To do it, we first extracted 100 bp centered at the ATAC-seq peak centroid of each TE instance in BED format. Then, the extracted 100-bp open chromatin regions in flu samples were intersected with KRAB-ZNF binding sites using BEDtools intersect function with the parameters -wa -wb -f 0.5 -F 0.5 -e -a. Candidate KRAB-ZNFs that are located in the open chromatin regions of a minimum of 5% accessible instances from any enhanced families were kept.
We further looked at the expression of KRAB-ZNFs that are associated with high variable families in infected samples. To do it, we first achieved the number of reads mapped to each accessible instance using BEDtools coverage function with the TE annotation file and parameter “-counts”. After we obtained the RPKM value per instance (reads per kilobase per million mapped reads), all accessible instances from a family were aggregated as the representative of the accessibility of each family. We then performed the correlative analysis between each high variable family and the expression levels of KRAB-ZNFs using R lm function, respectively. Strongly correlated KRAB-ZNFs with any high variable families (R2 ≥ 0.3 and p value ≤0.05) were kept.
TE regulation of neighboring genes
To explore whether TEs regulate neighboring genes, we examined differentially expressed genes (DEGs) nearby flu-specific instances from enhanced families and nearby NI-specific instances from reduced families. After the differential expression analysis, we retrieved corresponding gene names and coordinates through the command line and parameters: mysql --user=genome -N --host=genome-mysql.cse.ucsc.edu -A -D hg19 -e "select ensGene.name, name2, chrom, strand, txStart, txEnd, value from ensGene, ensemblToGeneName where ensGene.name = ensemblToGeneName.name". To compute the distance between genes and TEs, the first nucleotide (5′ end) (TSS) was used to represent each gene and the median position was used to represent each TE instance. Highly expressed genes (average TPM values ≥1 in either infected or non-infected samples) were used for the analysis. BEDtools window function was used to obtain human genes centered at each accessible instance within an 1-Mb window. We then computed the proportion of significantly upregulated and downregulated genes among inspected genes, respectively, within each interval of 0-50 kb, 50–100 kb, 100–200 kb, 200–300 kb and so on. Each gene was counted once within each interval.
We also compared the proportions of significantly up/down regulated genes with the expected distribution to compute the statistical significance. Accessible instances were randomly shuffled for high variable, low variable families, and reduced families for 1000 times separately. After the detection of genes near accessible instances, the proportions of significantly up/down regulated genes were computed as the expected values. The binomial distribution of the proportions of up/down regulated genes within each genomic interval was plotted with the 95% confidence interval, suggesting a statistical significance of p < 0.05 for any observed values outside the distribution. We then compared the proportions of significantly up/down regulated genes near accessible instances from high variable families, low variable families, and families with reduced accessibility.
We also compared the proportion of up/down regulated genes between flu-specific, NI-specific instances and instances overlapped with shared peaks (instances that were accessible in both infected and non-infected samples).
To identify genes that are potentially regulated by nearby TE-loci, we first picked TE instances overlapped with ATAC-seq peak centroids. We then intersected these instances with the consensus peak regions of ATAC-seq, H3K27ac and H3K4me1 peaks32 using BEDtools2 intersect function with the parameters -wa -wb -f 0.5 -F 0.5 -e -a. Candidate TE-loci with significant changes of both ATAC-seq and active marks (H3K27ac and/or H3K4me1) were kept. We lastly obtained significantly up-regulated genes near (≤50 kb) repeat loci from enhanced families and downregulated genes near reduced families. Correlation analysis was also performed using R lm function between the TE accessibility and nearby gene expression level post infection.
Profile of DNA methylation and histone marks
Focusing on enhanced families, we calculated the number and proportion of accessible instances overlapped with each mark post-infection. Specifically, we used BEDtools intersect function to identify accessible instances overlapped with each histone mark in infected samples. The median position of each peak was used for the analysis. We further identified instances overlapped with both H3K27ac and H3K4me1 marks in infected samples, suggesting the active or strong enhancer potential. We also computed the number and proportion of nearby DEGs within 100 kb (log2FC ≥ 0.5, adjusted p value ≤0.05). Additionally, we computed the average DNA methylation level of each instance and then we used the mean value across instances to represent the DNA methylation level of the family. DNA methylation level was calculated as the number of methylated cytosines divided by the sum of methylated and unmethylated cytosines at each locus.
Pathway enrichment analysis
The list of significantly up/down regulated genes near each accessible instance was obtained using BEDtools window function with the parameters -l 100000 -r 100000. The transcription start site was used to represent each gene. We focused on the significantly upregulated genes near accessible instances (within 50 kb) for high variable and low variable families, and significantly downregulated genes near accessible instances for reduced families. The obtained gene lists were submitted to the g:profiler tool with the same settings for the pathway enrichment analysis. We visualized the enriched pathways using ggplot2 in R.
Global TE transcripts calculation
The amount of global TE transcripts was computed as the proportion of aggregated (summed) read counts normalized by DEseq2 in TEs among the total RNA-seq read counts in both TEs and genes. The linear regression model was used to evaluate the correlation between the basal TE transcripts and viral load post-infection. R lm function was used for the analysis and the corresponding p value and R2 were reported. Using the same approach, we further analyzed each of the four main TE subclasses, i.e., DNA, LINE, SINE and LTR.
Average DNA methylation levels calculation
We computed the average DNA methylation levels among examined CpG sites across all annotated TE regions (TE methylation) in non-infected samples. TE families from the four main subclasses were considered.
Predictive models construction
Multiple regression analysis was used to build the predictive models. Viral load post-infection was used as the outcome of the models. The baseline of IFN signature (score) was computed as the median TPM value amongst 39 expressed genes from type I IFN signaling pathways (Table S8). We first included the baseline of IFN signature and age as predictive variables. We then chose the top six correlated immune TFs of which basal expression levels are also associated with TEs as variables, including STAT2, IRF1, IRF7, IRF9, STAT5A, and REL. We also picked non-immune factors that were associated with TEs as predictive variables, including age, the basal amount of TE transcripts, the average DNA methylation levels in TEs (TE methylation), and the basal expression levels (TPM) of TRIM28, SETDB1, PLAGL1, ZNF519, ZNF566, and ZNF611. To determine top candidate KRAB-ZNF host factors, we gathered evidence of the correlation between KRAB-ZNF expression and TE accessibility post-infection, the correlation between basal KRAB-ZNF expression and viral load, and the KRAB-ZNF binding sites and motifs found in high variable families (Table S7). Here, we kept KRAB-ZNF motifs that are found in ≥50 accessible instances and ≥50% of all instances in TE peak regions per family. The family with the highest percentage was kept as the top-associated TE.
R glm function with the parameter family = Gaussian() was first used to include all variables in the generalized linear model. R stepAIC function was then used to choose a subset of main features for the final model. R summary function was used to report the R2, adjusted R2 and p value. Lastly, we used the R predict function with the parameter type = “response” for the expected viral load with each predictive model.
Quantification and statistical analysis
Statistical details can be found in the corresponding section of “method details”. All statistical analyses were performed in R.
Additional resources
The study did not generate any additional resources.
Acknowledgments
This work was supported by a Canadian Institutes of Health Research (CIHR) program grant (CEE-151618) for the McGill Epigenomics Mapping Center, which is part of the Canadian Epigenetics, Environment and Health Research Consortium (CEEHRC) Network. G.B. is supported by a Canada Research Chair Tier 1 award, a FRQ-S, Distinguished Research Scholar award, and by the World Premier International Research Center Initiative (WPI), MEXT, Japan. The Canadian Center for Computational Genomics (C3G) is supported by a Genome Canada Genome Technology Platform grant. We would like to acknowledge Calcul Québec and the Digital Research Alliance of Canada for access to computing resources. We thank Drs. Taka Inoue and Erwin Schurr for the helpful discussion and constructive comments.
Author contributions
G.B., L.B., and T.M.P. planned the project and designed the experiments. R.H.M.S., V.Y., A.P., and M.-M.S. performed all experiments in the lab. T.K. provided logistical support. A.S.P. and K.A.A. performed primary data analysis and quality control. S.G., C.G., and Y.L.L. performed some complementary data analyses. X.C. and G.B. designed all analyses presented in this study. X.C. performed the analyses and prepared all figures. X.C. and G.B. wrote the manuscript with the help of L.B. All authors reviewed the final text.
Declaration of interests
The authors declare no competing interests.
Published: April 7, 2023
Footnotes
Supplemental information can be found online at https://doi.org/10.1016/j.xgen.2023.100292.
Supplemental information
Computed viral load post-infection, ages, and ancestry information were also included.
Average and standard deviation of the normalized number of peaks-associated instances in infected and non-infected samples were included. Average, standard deviation and coefficient of variation of enrichment levels relative to the background were also included. Average fold enrichment and adjusted p values (two-tailed paired student t-test, ∗ p ≤ 0.05, ∗∗ p ≤ 0.01, ∗∗∗ p ≤ 0.001) between infected and non-infected samples were also included..
KRAB-ZNFs were obtained from Imbeault et al.40 It included the KRAB-ZNF differential expression changes, correlation with TE accessibility post-infection, correlation of their basal expression with viral load, enrichment of binding sites and motifs in high variable families. Correlation analysis was performed using the linear regression model.
Data and code availability
-
•
All datasets used in this study have been deposited,32 and are available at the European Genome-phenome Archive (EGA) as follows: RNA-seq & ATAC-seq & ChIP-seq – EGA: EGAD00001008422; and WGBS – EGA: EGAD00001008359.
-
•
We also constructed a versatile browser (https://computationalgenomics.ca/tools/epivar), which allows users to explore genomic tracks for gene expression, chromatin accessibility, histone modifications, DNA methylation.
-
•
Scripts for main analyses are available at https://github.com/xunchen85/VariabilityInTEs and Zenodo with the linked https://doi.org/10.5281/zenodo.7532781.
-
•
Any additional information required to reanalyze the data reported in this paper is available from the lead contact upon request.
References
- 1.Clohisey S., Baillie J.K. Host susceptibility to severe influenza A virus infection. Crit. Care. 2019;23:303. doi: 10.1186/s13054-019-2566-7. [DOI] [PMC free article] [PubMed] [Google Scholar]
- 2.Fukuyama S., Kawaoka Y. The pathogenesis of influenza virus infections: the contributions of virus and host factors. Curr. Opin. Immunol. 2011;23:481–486. doi: 10.1016/j.coi.2011.07.016. [DOI] [PMC free article] [PubMed] [Google Scholar]
- 3.Gounder A.P., Boon A.C.M. Influenza pathogenesis: the effect of host factors on severity of disease. J. Immunol. 2019;202:341–350. doi: 10.4049/jimmunol.1801010. [DOI] [PMC free article] [PubMed] [Google Scholar]
- 4.Ciancanelli M.J., Abel L., Zhang S.-Y., Casanova J.-L. Host genetics of severe influenza: from mouse Mx1 to human IRF7. Curr. Opin. Immunol. 2016;38:109–120. doi: 10.1016/j.coi.2015.12.002. [DOI] [PMC free article] [PubMed] [Google Scholar]
- 5.Iwasaki A. A virological view of innate immune recognition. Annu. Rev. Microbiol. 2012;66:177–196. doi: 10.1146/annurev-micro-092611-150203. [DOI] [PMC free article] [PubMed] [Google Scholar]
- 6.Bierne H., Hamon M., Cossart P. Epigenetics and bacterial infections. Cold Spring Harb. Perspect. Med. 2012;2:a010272. doi: 10.1101/cshperspect.a010272. [DOI] [PMC free article] [PubMed] [Google Scholar]
- 7.Paschos K., Allday M.J. Epigenetic reprogramming of host genes in viral and microbial pathogenesis. Trends Microbiol. 2010;18:439–447. doi: 10.1016/j.tim.2010.07.003. [DOI] [PMC free article] [PubMed] [Google Scholar]
- 8.Xu Q., Tang Y., Huang G. Innate immune responses in RNA viral infection. Front. Med. 2021;15:333–346. doi: 10.1007/s11684-020-0776-7. [DOI] [PMC free article] [PubMed] [Google Scholar]
- 9.Smale S.T. Transcriptional regulation in the innate immune system. Curr. Opin. Immunol. 2012;24:51–57. doi: 10.1016/j.coi.2011.12.008. [DOI] [PMC free article] [PubMed] [Google Scholar]
- 10.Zhang Q., Cao X. Epigenetic remodeling in innate immunity and inflammation. Annu. Rev. Immunol. 2021;39:279–311. doi: 10.1146/annurev-immunol-093019-123619. [DOI] [PubMed] [Google Scholar]
- 11.Keenan C.R., Allan R.S. Epigenomic drivers of immune dysfunction in aging. Aging Cell. 2019;18 doi: 10.1111/acel.12878. [DOI] [PMC free article] [PubMed] [Google Scholar]
- 12.Bourque G. Transposable elements in gene regulation and in the evolution of vertebrate genomes. Curr. Opin. Genet. Dev. 2009;19:607–612. doi: 10.1016/j.gde.2009.10.013. [DOI] [PubMed] [Google Scholar]
- 13.Bourque G., Burns K.H., Gehring M., Gorbunova V., Seluanov A., Hammell M., Imbeault M., Izsvák Z., Levin H.L., Macfarlan T.S., et al. Ten things you should know about transposable elements. Genome Biol. 2018;19:199. doi: 10.1186/s13059-018-1577-z. [DOI] [PMC free article] [PubMed] [Google Scholar]
- 14.Chuong E.B., Elde N.C., Feschotte C. Regulatory activities of transposable elements: from conflicts to benefits. Nat. Rev. Genet. 2017;18:71–86. doi: 10.1038/nrg.2016.139. [DOI] [PMC free article] [PubMed] [Google Scholar]
- 15.Buttler C.A., Chuong E.B. Emerging roles for endogenous retroviruses in immune epigenetic regulation. Immunol. Rev. 2022;305:165–178. doi: 10.1111/imr.13042. [DOI] [PMC free article] [PubMed] [Google Scholar]
- 16.Kassiotis G., Stoye J.P. Immune responses to endogenous retroelements: taking the bad with the good. Nat. Rev. Immunol. 2016;16:207–219. doi: 10.1038/nri.2016.27. [DOI] [PubMed] [Google Scholar]
- 17.Srinivasachar Badarinarayan S., Sauter D. Switching sides: how endogenous retroviruses protect us from viral infections. J. Virol. 2021;95:e02299-20. doi: 10.1128/JVI.02299-20. [DOI] [PMC free article] [PubMed] [Google Scholar]
- 18.Bogdan L., Barreiro L., Bourque G. Transposable elements have contributed human regulatory regions that are activated upon bacterial infection. Philos. Trans. R. Soc. Lond. B Biol. Sci. 2020;375 doi: 10.1098/rstb.2019.0332. [DOI] [PMC free article] [PubMed] [Google Scholar]
- 19.Chuong E.B., Elde N.C., Feschotte C. Regulatory evolution of innate immunity through co-option of endogenous retroviruses. Science. 2016;351:1083–1087. doi: 10.1126/science.aad5497. [DOI] [PMC free article] [PubMed] [Google Scholar]
- 20.Macchietto M.G., Langlois R.A., Shen S.S. Virus-induced transposable element expression up-regulation in human and mouse host cells. Life Sci. Alliance. 2020;3 doi: 10.26508/lsa.201900536. [DOI] [PMC free article] [PubMed] [Google Scholar]
- 21.Mikhalkevich N., O’Carroll I.P., Tkavc R., Lund K., Sukumar G., Dalgard C.L., Johnson K.R., Li W., Wang T., Nath A., Iordanskiy S. Response of human macrophages to gamma radiation is mediated via expression of endogenous retroviruses. PLoS Pathog. 2021;17 doi: 10.1371/journal.ppat.1009305. [DOI] [PMC free article] [PubMed] [Google Scholar]
- 22.Nellåker C., Yao Y., Jones-Brando L., Mallet F., Yolken R.H., Karlsson H. Transactivation of elements in the human endogenous retrovirus W family by viral infection. Retrovirology. 2006;3:44. doi: 10.1186/1742-4690-3-44. [DOI] [PMC free article] [PubMed] [Google Scholar]
- 23.Schmidt N., Domingues P., Golebiowski F., Patzina C., Tatham M.H., Hay R.T., Hale B.G. An influenza virus-triggered SUMO switch orchestrates co-opted endogenous retroviruses to stimulate host antiviral immunity. Proc. Natl. Acad. Sci. USA. 2019;116:17399–17408. doi: 10.1073/pnas.1907031116. [DOI] [PMC free article] [PubMed] [Google Scholar]
- 24.Wang M., Qiu Y., Liu H., Liang B., Fan B., Zhou X., Liu D. Transcription profile of human endogenous retroviruses in response to dengue virus serotype 2 infection. Virology. 2020;544:21–30. doi: 10.1016/j.virol.2020.01.014. [DOI] [PubMed] [Google Scholar]
- 25.Cuellar T.L., Herzner A.-M., Zhang X., Goyal Y., Watanabe C., Friedman B.A., Janakiraman V., Durinck S., Stinson J., Arnott D., et al. Silencing of retrotransposons by SETDB1 inhibits the interferon response in acute myeloid leukemia. J. Cell Biol. 2017;216:3535–3549. doi: 10.1083/jcb.201612160. [DOI] [PMC free article] [PubMed] [Google Scholar]
- 26.Gázquez-Gutiérrez A., Witteveldt J., R Heras S., Macias S. Sensing of transposable elements by the antiviral innate immune system. RNA. 2021;27:735–752. doi: 10.1261/rna.078721.121. [DOI] [PMC free article] [PubMed] [Google Scholar]
- 27.Hale B.G. Antiviral immunity triggered by infection-induced host transposable elements. Curr. Opin. Virol. 2022;52:211–216. doi: 10.1016/j.coviro.2021.12.006. [DOI] [PubMed] [Google Scholar]
- 28.Bogu G.K., Reverter F., Marti-Renom M.A., Snyder M.P., Guigó R. Atlas of transcriptionally active transposable elements in human adult tissues. bioRxiv. 2019 doi: 10.1101/714212. Preprint at. [DOI] [Google Scholar]
- 29.Gorbunova V., Seluanov A., Mita P., McKerrow W., Fenyö D., Boeke J.D., Linker S.B., Gage F.H., Kreiling J.A., Petrashen A.P., et al. The role of retrotransposable elements in ageing and age-associated diseases. Nature. 2021;596:43–53. doi: 10.1038/s41586-021-03542-y. [DOI] [PMC free article] [PubMed] [Google Scholar]
- 30.LaRocca T.J., Cavalier A.N., Wahl D. Repetitive elements as a transcriptomic marker of aging: evidence in multiple datasets and models. Aging Cell. 2020;19 doi: 10.1111/acel.13167. [DOI] [PMC free article] [PubMed] [Google Scholar]
- 31.Lima-Junior D.S., Krishnamurthy S.R., Bouladoux N., Collins N., Han S.-J., Chen E.Y., Constantinides M.G., Link V.M., Lim A.I., Enamorado M., et al. Endogenous retroviruses promote homeostatic and inflammatory responses to the microbiota. Cell. 2021;184:3794–3811.e19. doi: 10.1016/j.cell.2021.05.020. [DOI] [PMC free article] [PubMed] [Google Scholar]
- 32.Aracena K.A., Lin Y.-L., Luo K., Pacis A., Gona S., Mu Z., Yotova V., Sindeaux R., Pramatarova A., Simon M.-M., et al. Epigenetic variation impacts ancestry-associated differences in the transcriptional response to influenza infection. bioRxiv. 2022 doi: 10.1101/2022.05.10.491413. Preprint at. [DOI] [PubMed] [Google Scholar]
- 33.Granados A., Peci A., McGeer A., Gubbay J.B. Influenza and rhinovirus viral load and disease severity in upper respiratory tract infections. J. Clin. Virol. 2017;86:14–19. doi: 10.1016/j.jcv.2016.11.008. [DOI] [PubMed] [Google Scholar]
- 34.de Jong M.D., Simmons C.P., Thanh T.T., Hien V.M., Smith G.J.D., Chau T.N.B., Hoang D.M., Chau N.V.V., Khanh T.H., Dong V.C., et al. Fatal outcome of human influenza A (H5N1) is associated with high viral load and hypercytokinemia. Nat. Med. 2006;12:1203–1207. doi: 10.1038/nm1477. [DOI] [PMC free article] [PubMed] [Google Scholar]
- 35.Li C.-C., Wang L., Eng H.-L., You H.-L., Chang L.-S., Tang K.-S., Lin Y.-J., Kuo H.-C., Lee I.-K., Liu J.-W., et al. Correlation of pandemic (H1N1) 2009 viral load with disease severity and prolonged viral shedding in children - volume 16, number 8—august 2010 - emerging infectious diseases. Emerg. Infect. Dis. 2010;16:1265–1272. doi: 10.3201/eid1608.091918. [DOI] [PMC free article] [PubMed] [Google Scholar]
- 36.Thorburn F., Bennett S., Modha S., Murdoch D., Gunson R., Murcia P.R. The use of next generation sequencing in the diagnosis and typing of respiratory infections. J. Clin. Virol. 2015;69:96–100. doi: 10.1016/j.jcv.2015.06.082. [DOI] [PMC free article] [PubMed] [Google Scholar]
- 37.O’Neill M.B., Quach H., Pothlichet J., Aquino Y., Bisiaux A., Zidane N., Deschamps M., Libri V., Hasan M., Zhang S.-Y., et al. Single-cell and bulk RNA-sequencing reveal differences in monocyte susceptibility to influenza A virus infection between africans and Europeans. Front. Immunol. 2021;12:768189. doi: 10.3389/fimmu.2021.768189. [DOI] [PMC free article] [PubMed] [Google Scholar]
- 38.Tretina K., Park E.-S., Maminska A., MacMicking J.D. Interferon-induced guanylate-binding proteins: guardians of host defense in health and disease. J. Exp. Med. 2019;216:482–500. doi: 10.1084/jem.20182031. [DOI] [PMC free article] [PubMed] [Google Scholar]
- 39.Srinivasachar Badarinarayan S., Shcherbakova I., Langer S., Koepke L., Preising A., Hotter D., Kirchhoff F., Sparrer K.M.J., Schotta G., Sauter D. HIV-1 infection activates endogenous retroviral promoters regulating antiviral gene expression. Nucleic Acids Res. 2020;48:10890–10908. doi: 10.1093/nar/gkaa832. [DOI] [PMC free article] [PubMed] [Google Scholar]
- 40.Imbeault M., Helleboid P.-Y., Trono D. KRAB zinc-finger proteins contribute to the evolution of gene regulatory networks. Nature. 2017;543:550–554. doi: 10.1038/nature21683. [DOI] [PubMed] [Google Scholar]
- 41.Barazandeh M., Lambert S.A., Albu M., Hughes T.R. Comparison of ChIP-seq data and a reference motif set for human KRAB C2H2 zinc finger proteins. G3. 2018;8:219–229. doi: 10.1534/g3.117.300296. [DOI] [PMC free article] [PubMed] [Google Scholar]
- 42.Helleboid P.-Y., Heusel M., Duc J., Piot C., Thorball C.W., Coluccio A., Pontis J., Imbeault M., Turelli P., Aebersold R., Trono D. The interactome of KRAB zinc finger proteins reveals the evolutionary history of their functional diversification. EMBO J. 2019;38 doi: 10.15252/embj.2018101220. [DOI] [PMC free article] [PubMed] [Google Scholar]
- 43.Iyengar S., Farnham P.J. KAP1 protein: an enigmatic master regulator of the genome. J. Biol. Chem. 2011;286:26267–26276. doi: 10.1074/jbc.R111.252569. [DOI] [PMC free article] [PubMed] [Google Scholar]
- 44.Potthoff M.J., Olson E.N. MEF2: a central regulator of diverse developmental programs. Development. 2007;134:4131–4140. doi: 10.1242/dev.008367. [DOI] [PubMed] [Google Scholar]
- 45.Clark R.I., Tan S.W.S., Péan C.B., Roostalu U., Vivancos V., Bronda K., Pilátová M., Fu J., Walker D.W., Berdeaux R., et al. MEF2 is an in vivo immune-metabolic switch. Cell. 2013;155:435–447. doi: 10.1016/j.cell.2013.09.007. [DOI] [PMC free article] [PubMed] [Google Scholar]
- 46.Van Dyck F., Delvaux E.L.D., Van de Ven W.J.M., Chavez M.V. Repression of the transactivating capacity of the oncoprotein PLAG1 by SUMOylation. J. Biol. Chem. 2004;279:36121–36131. doi: 10.1074/jbc.M401753200. [DOI] [PubMed] [Google Scholar]
- 47.Ito J., Sugimoto R., Nakaoka H., Yamada S., Kimura T., Hayano T., Inoue I. Systematic identification and characterization of regulatory elements derived from human endogenous retroviruses. PLoS Genet. 2017;13 doi: 10.1371/journal.pgen.1006883. [DOI] [PMC free article] [PubMed] [Google Scholar]
- 48.Sakashita A., Maezawa S., Takahashi K., Alavattam K.G., Yukawa M., Hu Y.-C., Kojima S., Parrish N.F., Barski A., Pavlicev M., Namekawa S.H. Endogenous retroviruses drive species-specific germline transcriptomes in mammals. Nat. Struct. Mol. Biol. 2020;27:967–977. doi: 10.1038/s41594-020-0487-4. [DOI] [PMC free article] [PubMed] [Google Scholar]
- 49.Groza C., Chen X., Pacis A., Simon M.-M., Pramatarova A., Aracena K.A., Pastinen T., Barreiro L.B., Bourque G. Genome graphs detect human polymorphisms in active epigenomic states during influenza infection. bioRxiv. 2021 doi: 10.1101/2021.09.29.462206. Preprint at. [DOI] [PMC free article] [PubMed] [Google Scholar]
- 50.Marasca F., Sinha S., Vadalà R., Polimeni B., Ranzani V., Paraboschi E.M., Burattin F.V., Ghilotti M., Crosti M., Negri M.L., et al. LINE1 are spliced in non-canonical transcript variants to regulate T cell quiescence and exhaustion. Nat. Genet. 2022;54:180–193. doi: 10.1038/s41588-021-00989-7. [DOI] [PubMed] [Google Scholar]
- 51.Breuer K., Foroushani A.K., Laird M.R., Chen C., Sribnaia A., Lo R., Winsor G.L., Hancock R.E.W., Brinkman F.S.L., Lynn D.J. InnateDB: systems biology of innate immunity and beyond—recent updates and continuing curation. Nucleic Acids Res. 2013;41:D1228–D1233. doi: 10.1093/nar/gks1147. [DOI] [PMC free article] [PubMed] [Google Scholar]
- 52.Bolger A.M., Lohse M., Usadel B. Trimmomatic: a flexible trimmer for Illumina sequence data. Bioinformatics. 2014;30:2114–2120. doi: 10.1093/bioinformatics/btu170. [DOI] [PMC free article] [PubMed] [Google Scholar]
- 53.Kim D., Pertea G., Trapnell C., Pimentel H., Kelley R., Salzberg S.L. TopHat2: accurate alignment of transcriptomes in the presence of insertions, deletions and gene fusions. Genome Biol. 2013;14:R36. doi: 10.1186/gb-2013-14-4-r36. [DOI] [PMC free article] [PubMed] [Google Scholar]
- 54.Li H., Handsaker B., Wysoker A., Fennell T., Ruan J., Homer N., Marth G., Abecasis G., Durbin R., 1000 Genome Project Data Processing Subgroup The sequence alignment/map format and SAMtools. Bioinformatics. 2009;25:2078–2079. doi: 10.1093/bioinformatics/btp352. [DOI] [PMC free article] [PubMed] [Google Scholar]
- 55.Edwards J.A., Edwards R.A. Fastq-pair: efficient synchronization of paired-end fastq files. bioRxiv. 2019 doi: 10.1101/552885. Preprint at. [DOI] [Google Scholar]
- 56.Jin Y., Tam O.H., Paniagua E., Hammell M. TEtranscripts: a package for including transposable elements in differential expression analysis of RNA-seq datasets. Bioinformatics. 2015;31:3593–3599. doi: 10.1093/bioinformatics/btv422. [DOI] [PMC free article] [PubMed] [Google Scholar]
- 57.Love M.I., Huber W., Anders S. Moderated estimation of fold change and dispersion for RNA-seq data with DESeq2. Genome Biol. 2014;15:550. doi: 10.1186/s13059-014-0550-8. [DOI] [PMC free article] [PubMed] [Google Scholar]
- 58.Raudvere U., Kolberg L., Kuzmin I., Arak T., Adler P., Peterson H., Vilo J. g:Profiler: a web server for functional enrichment analysis and conversions of gene lists (2019 update) Nucleic Acids Res. 2019;47:W191–W198. doi: 10.1093/nar/gkz369. [DOI] [PMC free article] [PubMed] [Google Scholar]
- 59.Quinlan A.R., Hall I.M. BEDTools: a flexible suite of utilities for comparing genomic features. Bioinformatics. 2010;26:841–842. doi: 10.1093/bioinformatics/btq033. [DOI] [PMC free article] [PubMed] [Google Scholar]
- 60.Bailey T.L., Boden M., Buske F.A., Frith M., Grant C.E., Clementi L., Ren J., Li W.W., Noble W.S. MEME Suite: tools for motif discovery and searching. Nucleic Acids Res. 2009;37:W202–W208. doi: 10.1093/nar/gkp335. [DOI] [PMC free article] [PubMed] [Google Scholar]
- 61.Fornes O., Castro-Mondragon J.A., Khan A., van der Lee R., Zhang X., Richmond P.A., Modi B.P., Correard S., Gheorghe M., Baranašić D., et al. Jaspar 2020: update of the open-access database of transcription factor binding profiles. Nucleic Acids Res. 2020;48:D87–D92. doi: 10.1093/nar/gkz1001. [DOI] [PMC free article] [PubMed] [Google Scholar]
- 62.Bourque G., Leong B., Vega V.B., Chen X., Lee Y.L., Srinivasan K.G., Chew J.-L., Ruan Y., Wei C.-L., Ng H.H., Liu E.T. Evolution of the mammalian transcription factor binding repertoire via transposable elements. Genome Res. 2008;18:1752–1762. doi: 10.1101/gr.080663.108. [DOI] [PMC free article] [PubMed] [Google Scholar]
- 63.Lander E.S., Linton L.M., Birren B., Nusbaum C., Zody M.C., Baldwin J., Devon K., Dewar K., Doyle M., FitzHugh W., et al. Initial sequencing and analysis of the human genome. Nature. 2001;409:860–921. doi: 10.1038/35057062. [DOI] [PubMed] [Google Scholar]
Associated Data
This section collects any data citations, data availability statements, or supplementary materials included in this article.
Supplementary Materials
Computed viral load post-infection, ages, and ancestry information were also included.
Average and standard deviation of the normalized number of peaks-associated instances in infected and non-infected samples were included. Average, standard deviation and coefficient of variation of enrichment levels relative to the background were also included. Average fold enrichment and adjusted p values (two-tailed paired student t-test, ∗ p ≤ 0.05, ∗∗ p ≤ 0.01, ∗∗∗ p ≤ 0.001) between infected and non-infected samples were also included..
KRAB-ZNFs were obtained from Imbeault et al.40 It included the KRAB-ZNF differential expression changes, correlation with TE accessibility post-infection, correlation of their basal expression with viral load, enrichment of binding sites and motifs in high variable families. Correlation analysis was performed using the linear regression model.
Data Availability Statement
-
•
All datasets used in this study have been deposited,32 and are available at the European Genome-phenome Archive (EGA) as follows: RNA-seq & ATAC-seq & ChIP-seq – EGA: EGAD00001008422; and WGBS – EGA: EGAD00001008359.
-
•
We also constructed a versatile browser (https://computationalgenomics.ca/tools/epivar), which allows users to explore genomic tracks for gene expression, chromatin accessibility, histone modifications, DNA methylation.
-
•
Scripts for main analyses are available at https://github.com/xunchen85/VariabilityInTEs and Zenodo with the linked https://doi.org/10.5281/zenodo.7532781.
-
•
Any additional information required to reanalyze the data reported in this paper is available from the lead contact upon request.