Abstract
Plentiful sunlight and high temperatures in desert climates cause burn injuries from contact with sun-exposed surfaces. The peak temperature, times, and surfaces of greatest risk are not well described. This work recorded temperature measurements of six materials in a desert climate. Surface temperatures of asphalt, brick, concrete, sand, porous rock, and galvanized metal were measured throughout the summer, along with ambient temperature, and sunlight intensity. Samples were placed in both shade and direct sunlight for evaluation of sunlight effect. Seventy-five thousand individual measurements were obtained from March to August 2020. Maximum recorded temperatures for sunlight-exposed porous rock were 170°F, asphalt 166°F, brick 152°F, concrete 144°F, metal 144°F, and sand 143°F, measured on August 6, 2020 at 2:10 pm, when ambient temperature was 120°F and solar irradiation 940 W/m2. Sunlight-exposed materials ranged 36 to 56°F higher than shaded materials measured at the same time. The highest daily temperatures were achieved between 2:00 and 4:00 pm due to maximum solar irradiance. Contour plots of surface temperature as a function of both solar irradiation and time of day were created for all materials tested. A computational fluid dynamics model was created to validate the data and serve as a predictive model based upon temperature and sunlight inputs. This information is useful to inform the public of the risks of contact burn due to sunlight-exposed surfaces in a desert climate.
Worldwide, the majority of burn injuries are caused by flame or scald mechanisms.1 However, in a desert climate, patients also can sustain burn injuries from contact with hot, sun-exposed surfaces. These burn injuries can be deep, full-thickness burns which require extensive hospitalization and consumption of healthcare resources during the summer months.2,3 While uncommon in most parts of the country, a pavement burn is a unique type of contact burn resulting from prolonged contact with a surface exposed to the sun during a period of high-ambient temperature. These surfaces include asphalt, concrete, brick, metal, or any other ground surface with exposure to continuous direct sunlight. Desert atmospheric conditions of nearly continuous daily sunlight combined with high ambient summer temperatures can cause pavement to reach high enough temperatures to cause burns upon contact. Individuals at highest risk include children who are unaware of the hot pavement, diabetics with peripheral neuropathy unable to sense the high temperature, patients who become unconscious due to medical reasons such as seizures, strokes, intoxication, or trauma.4,5
Previous work has shown that pavement burns can cause significant morbidity compared to similarly sized burns from other mechanisms.5,6 Pavement burn patients incur increased length of stay, higher total hospital costs, and are more likely to need operative management when compared to patients with other thermal burn etiologies. The first report of hot pavement reaching sufficient temperatures to cause burns appeared in 1970.7 Since then, others have taken intermittent surface temperature measurements at different time intervals during hot summer climates, which confirms that these surfaces can reach high temperatures.8–10 However, no study has sought to determine the maximum temperature reached throughout an extended time period, or to compare different surfaces in experimentally similar conditions.
This investigation was undertaken to accomplish four specific objectives related to pavement burn risk in a desert southwest environment: 1) To determine which pavement surfaces achieve the highest surface temperature in a hot desert climate, 2) To measure the peak temperature achieved for the most common sun-exposed surfaces with which patients come in contact, 3) To determine the time of day posing the highest risk for pavement burns, 4) To quantify the relationship between sunlight and ambient temperature as a cause for high-surface temperatures in sun-exposed surfaces.
METHODS
Materials
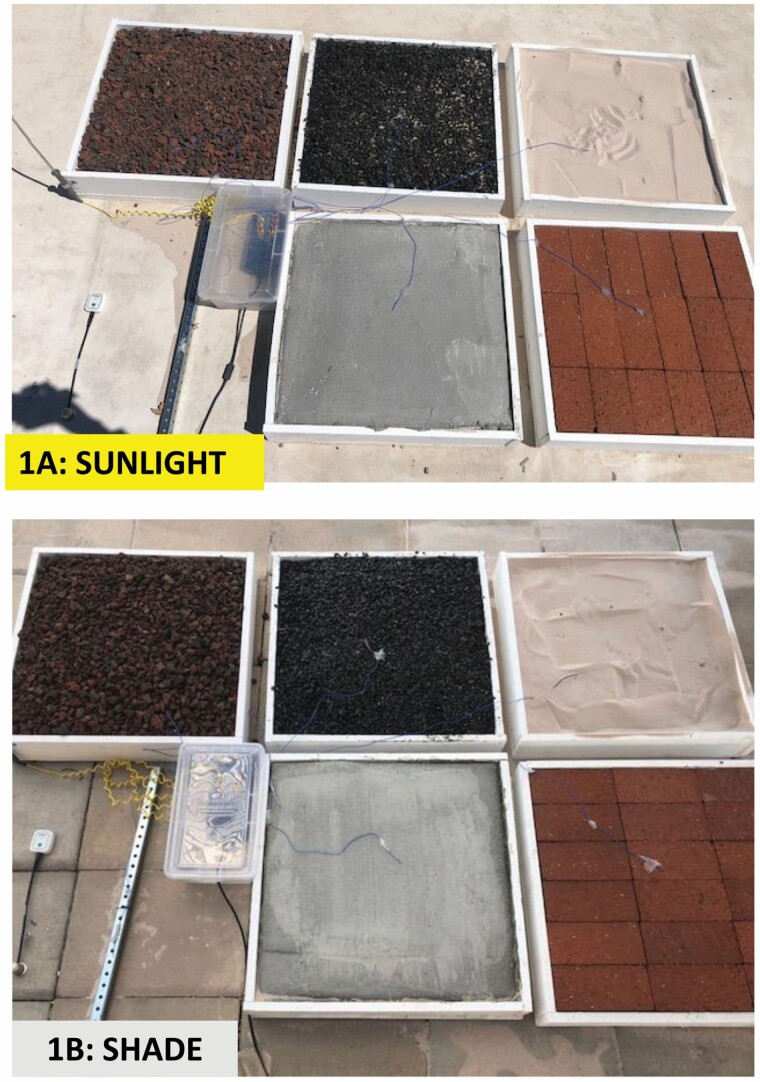
An experimental design was developed consisting of several common surfaces encountered in urban and suburban environments in both shade and direct sunlight. These surfaces included asphalt, brick, concrete, sand, porous lava rock, and galvanized metal. All materials were purchased from a local home improvement store. The galvanized metal sample was placed directly on the ground, while the remaining materials were placed in a constructed wooden form measuring two feet square and 3.5 inches deep. The materials were placed on the roof of the four-story Thomas T. Beam Engineering Complex on the main campus of University of Nevada, Las Vegas in Las Vegas, Nevada. Each surface prototype was placed in two locations, one exposed to continuous direct sunlight, and another in continuous shade (Figure 1). The shaded area was directly underneath an independent structure which offered several feet of surface coverage but with open sides to allow ambient light and cross-ventilation. This location was chosen because it was exposed to constant sunlight and was sufficiently protected from tampering. Some sites at ground level were investigated and considered, but no locations could be found which were sufficiently protected from public tampering and also subject to continuous sunlight.
Figure 1.
Photographs of experimental data collection set up in direct sunlight (top) and in shade (bottom). This arrangement was placed on the roof of the Thomas T. Beam Engineering Complex on the campus of University of Nevada Las Vegas. Six different material samples were arranged including porous rock (top left), asphalt (top middle), sand (top right), galvanized metal (bottom left), concrete (bottom middle), and brick (bottom right). All but the galvanized metal were placed in a wooden form measuring 2′ × 2′ and 3.5 inches high. Thermocouples were placed on the surface of each material and held in place with adhesive. Sunlight intensity was measured using a pyranometer which is seen in the lower left corner to the left of the galvanized metal.
Temperature and Sunlight Measurements
Temperature measurements of each surface were obtained using Type-K thermocouples (Reed Instruments, Wilmington, NC) which were attached to each surface. The sand thermocouple was attached using a single metal staple, while the remaining surfaces were attached using clear adhesive. One ambient probe thermocouple (Omega Engineering, Norwalk, CT) was used to record ambient temperature. Sunlight intensity was measured using a pyranometer (Apogee Instruments, Logan, UT). Data were recorded using an acquisition module (TC-08, Omega Engineering, Norwalk, CT) which was attached to a laptop computer by USB cable. Thermocouple calibration was performed using temperature verification with warm water at 104°F. Pyranometers were calibrated and accuracy was verified by the manufacturer. Data measurements were recorded every 3 minutes from all inputs. Data collection progressed from April 1, 2020 to August 31, 2020.
After completion of data collection, data were reviewed, and temperature maximum and minimums were recorded for each sample. Measurements were averaged by hour of the day and plotted over 24 hours to determine the time period of maximum temperature, which was defined as the time frame during which the average temperature was the highest.
Contour Plots
Contour plots of surface temperature of each tested material were plotted against the solar irradiance and ambient temperature. Additional plots were created of surface temperature against irradiance and hour of the day, demonstrating the temperature profile achieved throughout the day. Plots were created using Minitab™ software (Minitab LLC, State College, PA). In Minitab, plots such as time-dependent contour plots, time-dependent radiation contour plots, and burn risk analysis plots were created for a 7-day period using the experimental data.
Mathematical Approximation and Computational Fluid Dynamics Model
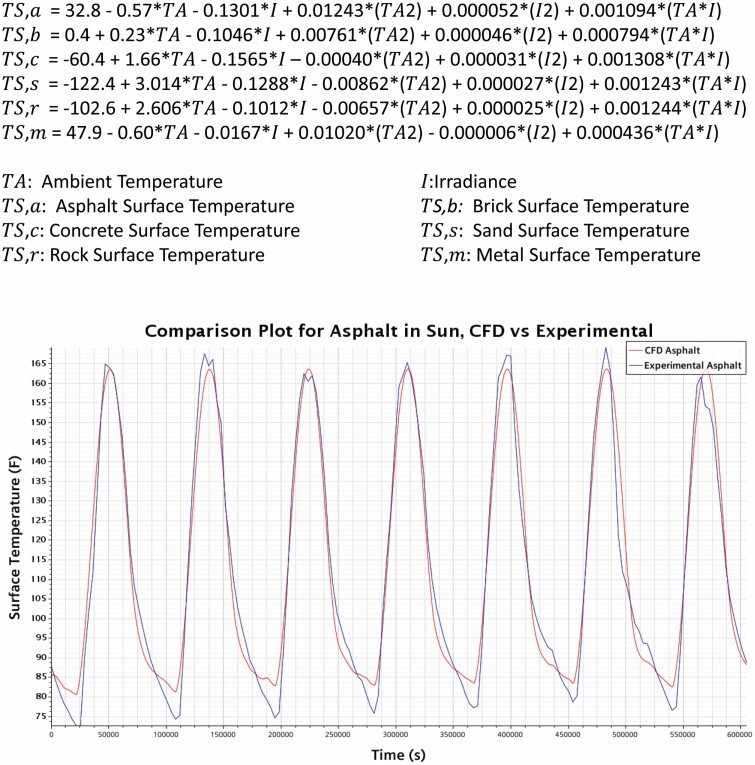
Acquired data were used to create a Computational Fluid Dynamics (CFD) model for each surface using Simcenter STAR-CCM+™ (Siemens Digital Industries, Plano, TX). An equation for prediction of surface temperature was generated for each surface tested, then verified against acquisitional data for each sample. The CFD analysis was conducted in a two-dimensional method in which the bottom side of all the materials tested were held at a constant user-defined temperature of 80°F. For this study, convection and radiation were the two modes of heat transfer analyzed. The thermodynamic properties were defined for each material, including absorptivity, emissivity, thermal conductivity, specific heat, and density (Table 1).11 A field function using experimental irradiance data was created with the software, whereby these values were applied as a heat flux to the top side of the samples. The CFD model was validated by plotting the numerical surface temperature against the experimental surface temperature. Nearly identical surface temperature values between the two validates the CFD model.
Table 1.
Specific Heat and Density properties of all tested materials.
| Material Properties | ||
|---|---|---|
| Material | Specific Heat (J/kg K) | Density (kg/m^3) |
| Asphalt | 1000 | 2100 |
| Brick | 850 | 3010 |
| Concrete | 900 | 2300 |
| Sand | 900 | 1515 |
| Rock | 950 | 1600 |
| Metal | 500 | 7800 |
RESULTS
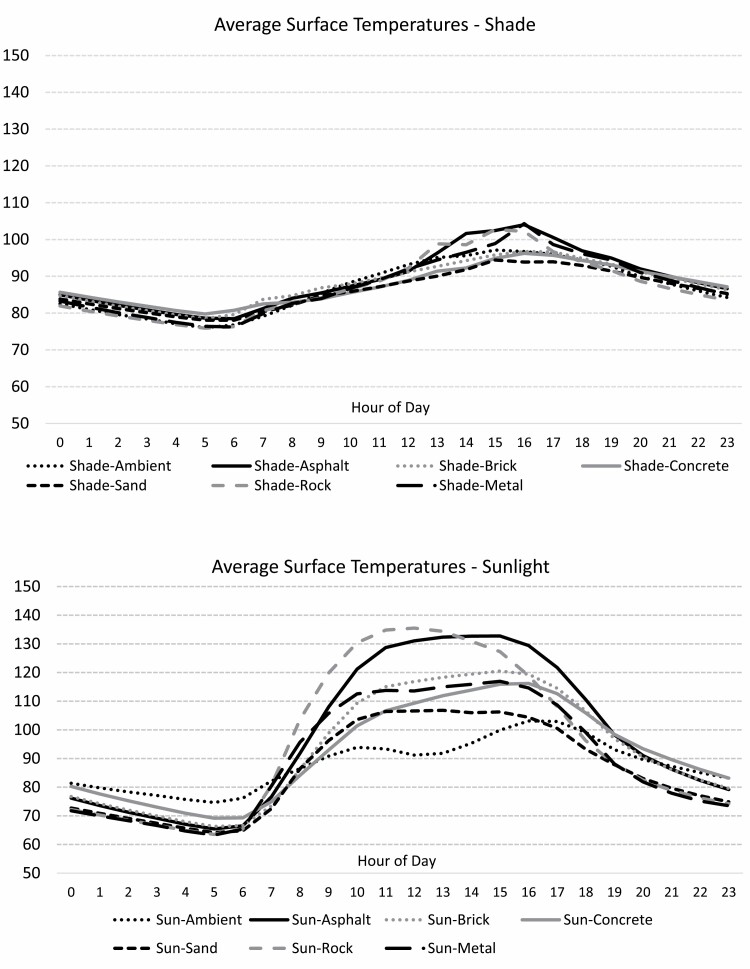
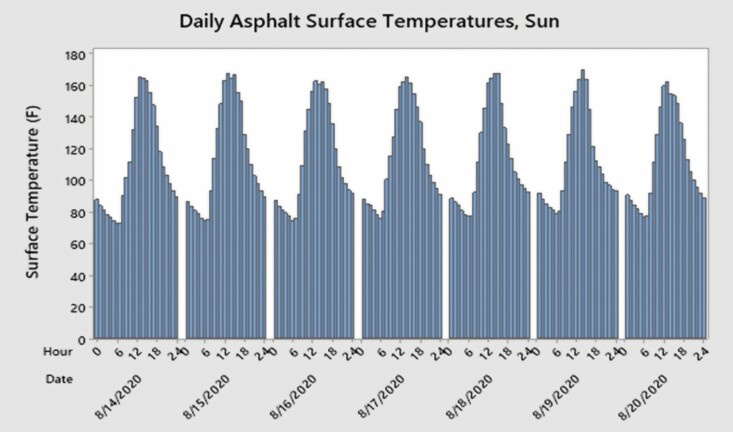
Approximately 72,000 temperature and irradiance measurements were obtained from each source sample during the study period. Maximum recorded temperatures of each surface material are shown in Table 2. A maximum temperature of 170°F was recorded on porous rock, followed by 166°F on asphalt, 152°F on brick, 144°F on concrete, 144°F on metal; and 143°F from the sand sample. From the baseline temperature, it took 13 to 14 hours to reach maximum temperature on all samples. Within a 24-hour interval, the time period during which maximum temperature was reached was mid-afternoon, from 1:00 to 4:00 pm on sand, porous rock, and metal, and from 2:00 to 4:00 pm for asphalt, brick, and metal. Maximum temperatures recorded in the shade were much lower, ranging from 104 to 108°F, and it took 14 to 15 hours to reach maximum temperature. Peak temperatures in the shade were reached in the middle to late afternoon, either 2:00 to 4:00 pm or 3:00 to 5:00 pm. Average hourly temperatures throughout the day of both shaded and sunlight samples are shown in Figure 2. Hourly asphalt temperatures recorded over a 1-week period are shown in Figure 3, illustrating the rise and fall between maximum and minimum temperatures on a daily basis.
Table 2.
Summary of maximum temperature readings for sunlight and shaded materials and times to return to baseline temperature.
| Material | Max Surface Temp (°F) | Time to Max Temp (h) | Time Period at Max Temp (h) | Time to Baseline Temp (h) | Max Surface Temp (°F) | Time to Max Temp (h) | Time Period at Max Temp (h) | Time to Baseline Temp (h) |
|---|---|---|---|---|---|---|---|---|
| Sunlight | Shade | |||||||
| Asphalt | 166 | 14 | 2:00–4:00 pm | 10 | 108 | 15 | 3:00–5:00 pm | 7 |
| Brick | 152 | 14 | 2:00–4:00 pm | 11 | 107 | 15 | 3:00–5:00 pm | 6 |
| Concrete | 144 | 14 | 2:00–4:00 pm | 9 | 105 | 14 | 2:00–4:00 pm | 7 |
| Sand | 143 | 13 | 1:00–4:00 pm | 11 | 104 | 14 | 2:00–4:00 pm | 8 |
| Rock | 170 | 13 | 1:00–4:00 pm | 10 | 106 | 15 | 3:00–5:00 pm | 6 |
| Metal | 144 | 13 | 1:00–4:00 pm | 9 | 108 | 14 | 2:00–4:00 pm | 7 |
Figure 2.
Twenty-four hours Average surface temperatures of each surface recorded throughout the study period in shade and direct sunlight.
Figure 3.
Daily measurement of asphalt surface temperature (F) and hour of each day for a 1-week period from August 14 to August 20, 2020.
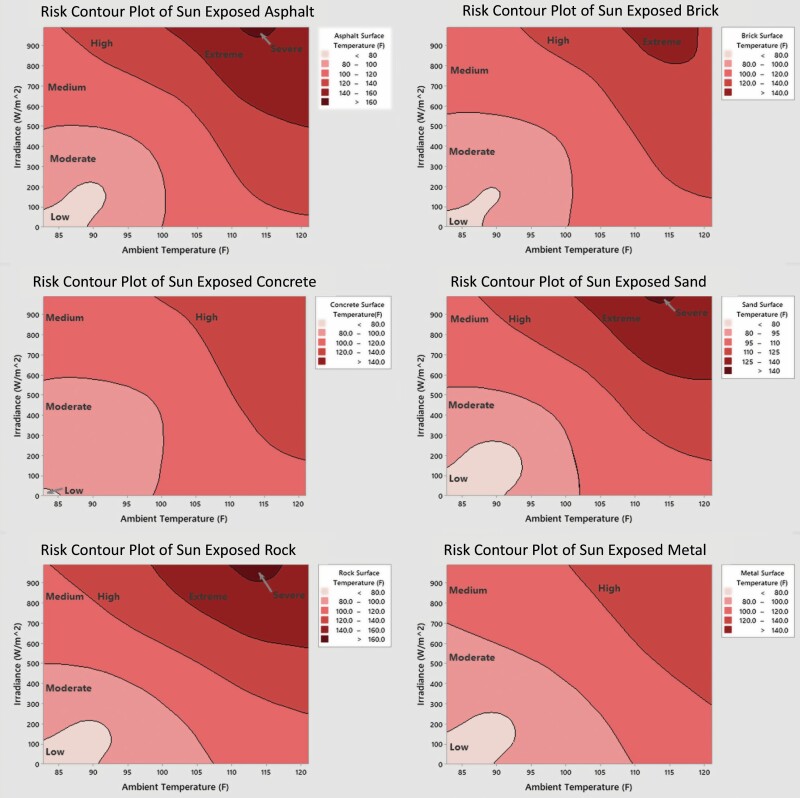
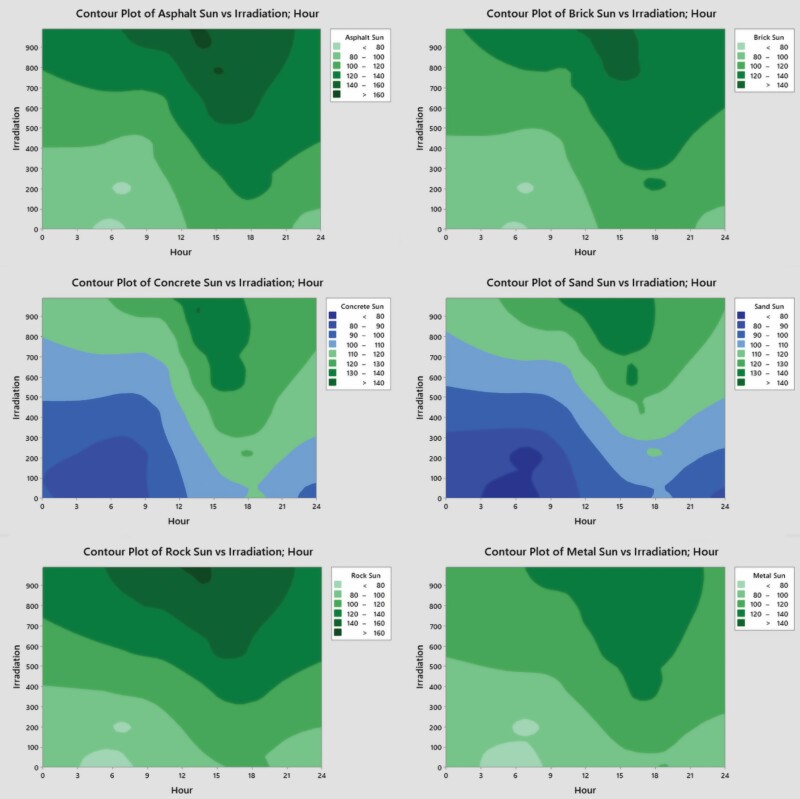
Risk contour plots of sun-exposed surfaces compared with solar irradiance and ambient temperature are shown in Figure 4. There is an association between increasing solar irradiance and increased surface temperature. A similar contour plot showing surface temperature compared with solar irradiation and time of day is shown in Figure 5, and demonstrates the heat absorptive capacity of the materials tested. Earlier in the day, higher solar irradiance does not reach the same temperatures as later in the day. As the surface temperature climbs and the material stores the sun’s energy the temperature remains high even after the sun passes its zenith and solar irradiation decreases.
Figure 4.
Risk contour plots showing surface temperature (F) of each material measured based upon solar irradiance (W/m2) and ambient temperature (F).
Figure 5.
Risk contour plots showing surface temperature (F) of each material measured compared with solar irradiance (W/m2) and hour of the day.
The CFD model results are shown in Figure 6. Equations are shown to predict the surface temperature of each surface based upon the ambient temperature and sun irradiance. The CFD plot compared with collected data for asphalt are shown as a representative sample. All surfaces tested showed good correlation between predicted values and the CFD model.
Figure 6.
Computational fluid dynamics model equations for all six surfaces and temperature prediction equations based upon ambient Temperature (TA) and Irradiance (I). Representative comparison plot of Asphalt data compared with CFD model predicted data.
DISCUSSION
Sun-exposed surfaces in a hot climate can lead to contact burn injuries, but similar surfaces in ambient heat do not rise to dangerously high temperatures without exposure to sunlight. This is evidenced by the lack of pavement burns during winter months despite adequate sunlight exposure.2,3 Thus, the ability of a surface to rise to dangerous temperatures results from a combination of direct sunlight and high-ambient temperatures. The reason for the high temperatures found on asphalt are due to the high emissivity of asphalt of 0.93, which is very close to the ideal value of 1.0 for black body radiation. True black body radiation will generate the highest surface temperature when compared with any other body with lower emissivity.
Multiple other authors have reported on the high temperatures achieved in sunny, hot climates. Berens et al. recorded temperatures on several days in Phoenix, AZ in 1966–1967 and measured asphalt as high as 172°F, and concrete up to 156°F. Harrington et al. recorded temperatures in Phoenix, AZ over a 24-hour period in 1992 in sunlight and shade on several different surfaces including dirt, steel, cement, lawn, sand, and asphalt. They recorded peak temperatures of 68°C (equivalent to 154°F) for asphalt and sand, and 58 to 60°C (137–140°F) for dirt, cement, and metal.7 Internationally, Clifton et al. recorded temperatures in Adelaide, Australia on several different surfaces from multiple days in January 2014.9 In direct sunlight, they measured ambient temperatures up to 43.9°C (111°F), and surface temperatures of 71.5°C (160.7°F) for metal, 69.5°C (157.1°F) for sand, 68.5°C (155.3°F) for slate, brick, and bitumen (asphalt); and 64°C (147.2°F) for cement.
This study determined the maximum temperature reached by six different surfaces measured in [City, State] throughout the summer of 2020. Porous rock achieved the highest temperature at 170°F, followed by asphalt at 166°F, brick at 152°F, metal and concrete at 144°F, and sand at 143°F. In shade, none of the materials reached the threshold temperature of 110°F to cause injury, confirming that radiant energy from direct sunlight is necessary to increase the temperature to levels high enough to cause contact burns.
Contour plots shown in Figure 4 show the relationship between sunlight intensity, ambient temperature, and surface temperature for each surface. All surfaces could cause second- or third-degree burns (depending on time of exposure), with high-ambient temperature or intensity of sun irradiance, but the combination of the two causes elevated surface temperatures sufficiently high enough to cause contact burns. In Figure 5, contour plots showing sun intensity and hour of the day are shown. In later hours of the day, lower sun intensity results in higher surface temperatures. This is related to the heat absorptive capacity of the surface materials, as they store radiant energy throughout the day, resulting in higher temperatures later in the day even without sun exposure. In a desert climate, this can be appreciated by feeling heat radiating from ground and hard surfaces after the sun has gone down. Sun-exposed surfaces did not return to baseline temperature for 9 to 11 hours after peak, indicating that danger still exists for hours after the peak temperature.
To put in perspective, human exposure to hot water at 140°F can lead to a serious burn within 3 seconds and contact at 120°F can result in a serious burn in 10 minutes.12 Our work demonstrates that the pavement warms up higher than 140°F during the summer and depending on the time of day will remain very warm for several hours. Therefore, under the right circumstances, a person walking barefoot in the driveway, or backyard can sustain a second degree burn on the feet in a matter of seconds. Moreover, people can develop third degree burns if they fall and/or have a syncopal event and remain on the pavement for several minutes.
CFD models show that surface temperature is a predictable risk factor based on known environmental inputs. Surface temperatures can be extrapolated from sunlight intensity and ambient temperatures based upon data collected for this study. For desert communities in the southwest United States which manage a high number of thermal injuries sustained after contact with hot surfaces, our data have potential as an important, inexpensive, and straightforward burn prevention tool, in the form of a simple warning alerting the public of the danger of hot surfaces in the community. Furthermore, in other regions of the world where high-seasonal temperatures are less common, it could still indicate that, when conditions are right, pavement surfaces could cause burns to an unsuspecting public.
This study has some limitations. While every attempt was made to create an experiment to mimic the real-world environment, this is impossible to replicate completely. Ground surfaces are highly variable, with different compositions, and it is impossible to account for all anomalies and differences. The surface samples were uniformly constructed at 3.5 inches deep, however, this may have limited the energy absorptive capacity of the sample materials. Materials in the environment with greater depth may yield different measurements. The experiment location on the top of a four-story building may be different than results on the ground, given higher temperature losses from convective wind forces. This study also only focuses on six samples total, although the number of materials in the environment is nearly infinite. Despite these limitations, the study was able to achieve its stated objectives. Future work may include the testing of different coatings being used by different municipalities to decrease the absorption of heat by street materials. Also, we would like to develop and test the effectiveness of a public awareness campaign.
CONCLUSION
Sun-exposed surfaces in a desert climate reach high temperatures resulting in contact burns. High-surface temperatures are predictable from sunlight irradiance and ambient temperature. This creates an opportunity for burn injury prevention in regions and patient populations where pavement burns are high risk.
ACKNOWLEDGEMENTS
The authors wish to acknowledge the grant support of the Mountain West Region of the Clinical Translational Research Infrastructure Network (CTR-IN) a NIH Funded U54 Grant. Development Translational Team Grant (DTTG) U54GM104944.
Poster Presented at the American Burn Association 2021 Annual Meeting, April 2021.
Funded by Mountain West Region Clinical Translational Research Infrastructure Network (CTR-IN) a NIH Funded U54 Grant. Development Translational Team Grant (DTTG) U54GM104944.
Contributor Information
Paul J Chestovich, Department of Surgery, Division of Acute Care Surgery, UNLV School of Medicine, Las Vegas, Nevada, USA.
Richard Z Saroukhanoff, UNLV School of Mechanical Engineering, Las Vegas, Nevada, USA.
Samir F Moujaes, UNLV School of Mechanical Engineering, Las Vegas, Nevada, USA.
Carmen E Flores, Department of Surgery, Division of Acute Care Surgery, UNLV School of Medicine, Las Vegas, Nevada, USA.
Joseph T Carroll, Department of Surgery, Division of Acute Care Surgery, UNLV School of Medicine, Las Vegas, Nevada, USA.
Syed F Saquib, Department of Surgery, Division of Acute Care Surgery, UNLV School of Medicine, Las Vegas, Nevada, USA.
REFERENCES
- 1. Pruitt BA, Wolf SE, Mason, JrAD. Epidemiological, demographic, and outcome characteristics of burn injury. Total Burn Care, 4th ed. 2012. p. 15–45. Elsevier, New York. [Google Scholar]
- 2. Saquib SF, Carroll JT, Chestovich PJ. Seasonal impact in admissions and burn profiles in a desert burn unit. Burns Open 2021;5:45–49. [Google Scholar]
- 3. Vega J, Chestovich P, Saquib S, Fraser D. A 5-year review of pavement burns from a desert burn center. J Burn Care Res 2019;40:422–6. [DOI] [PubMed] [Google Scholar]
- 4. Sinha M, Salness R, Foster Ket al. Accidental foot burns in children from contact with naturally heated surfaces during summer months: experience from a regional burn center. J Trauma 2006;61:975–8. [DOI] [PubMed] [Google Scholar]
- 5. Eisenberg MT, Saquib SF, Chestovich P. Pavement burns treated at a Desert Burn Center: analysis of mechanisms and outcomes. J Burn Care Res 2020;41:951–5. [DOI] [PubMed] [Google Scholar]
- 6. Silver AG, Dunford GM, Zamboni WA, Baynosa RC. Acute pavement burns: a unique subset of burn injuries: a five-year review of resource use and cost impact. J Burn Care Res 2015;36:e7–e11. [DOI] [PubMed] [Google Scholar]
- 7. Berens J. Thermal contact burns from streets and highways. JAMA 1970;214:2025–7. [PubMed] [Google Scholar]
- 8. Harrington WZ, Strohschein BL, Reedy D, Harrington JE, Schiller WR. Pavement temperature and burns: streets of fire. Ann Emerg Med 1995;26:563–8. [DOI] [PubMed] [Google Scholar]
- 9. Clifton T, Khoo T, Andrawos Aet al. Variation of surface temperatures of different ground materials on hot days: burn risk for the neuropathic foot. Burns J Int Soc Burn Inj. 2016;42:453–6. [DOI] [PubMed] [Google Scholar]
- 10. Kowal-Vern A, Matthews MR, Richey KNet al. “Streets of Fire” revisited: contact burns. Burns & Trauma 2019;7:32. [DOI] [PMC free article] [PubMed] [Google Scholar]
- 11. Cengel, Yunus A. Thermodynamics: an engineering approach. Boston (MA): McGraw-Hill Higher Education, 2008. [Google Scholar]
- 12. Moritz AR, Henriques FC. Studies of thermal injury, II: the relative importance of time and surface temperature in the causation of cutaneous burns. Am J Pathol 1947;23:695–720. [PMC free article] [PubMed] [Google Scholar]


