Summary
Emerging studies indicate that cooperation between neurons and immune cells regulates anti-microbial immunity, inflammation, and tissue homeostasis. For example, a neuronal rheostat can provide excitatory or inhibitory signals that control tissue-resident group 2 innate lymphoid cell (ILC2) functions at mucosal barrier surfaces1–4. ILC2s express NMUR1, a receptor for neuromedin U (NMU), a prominent cholinergic neuropeptide that promotes ILC2 responses5–7. However, as many functions of ILC2s are shared with adaptive lymphocytes, including production of type 2 cytokines8,9 and release of tissue-protective amphiregulin (AREG)10–12, this has provoked controversy as to whether ILCs and adaptive lymphocytes perform redundant versus non-redundant functions13–15. In this report, we generate a new genetic tool to target ILC2s for depletion or gene deletion in the presence of an intact adaptive immune system. Transgenic expression of iCre recombinase under the control of the murine Nmur1 promoter enabled ILC2-specific deletion of AREG, revealing that ILC2-derived AREG promotes non-redundant functions in the context of anti-parasite immunity and tissue protection following intestinal damage and inflammation. Notably, NMU expression levels were increased in inflamed intestinal tissues from both mice and humans, and NMU induced AREG production in murine and human ILC2s, indicating that neuropeptide-mediated regulation of non-redundant functions of ILC2s is an evolutionarily conserved mechanism that integrates immunity and tissue protection.
Innate lymphoid cells (ILCs) are tissue-resident lymphocytes that share multiple features with adaptive lymphocytes, including developmental origin from common lymphoid cell progenitors, expression of lineage-specifying transcription factors, and production of multiple effector cytokines that promote immunity, inflammation, and tissue homeostasis9,13,15–17. For example, both group 2 ILCs (ILC2s) and adaptive lymphocytes play essential roles in promoting immunity to helminth parasites, allergic inflammation, metabolic homeostasis, and tissue protection via the production of type 2 effector cytokines9,13,14,17, including IL-5 and IL-13, and the tissue repair factor, amphiregulin (AREG)10–12. Although they lack antigen-specific receptors, ILC2s respond rapidly to various stimuli at barrier surfaces, including the cytokines and alarmins interleukin (IL)-25, IL-33, and thymic stromal lymphopoietin9,14. ILC2s also directly respond to neurotransmitters and neuropeptides4, including acetylcholine18, norepinephrine19, calcitonin gene-related peptide20–22, and neuromedin U (NMU)5–7, which are produced by neurons at barrier surfaces. NMU is produced by a subset of cholinergic neurons and can directly stimulate ILC2s through NMUR1 to proliferate and produce type 2 cytokines, thereby promoting anti-helminth immunity and allergic inflammation5–7. However, many ILC2 effector molecules are also produced by adaptive lymphocytes15,17, provoking controversy as to whether ILC2s perform redundant versus non-redundant functions in vivo13–15,23–25. Here, we exploit the selective expression of NMUR1 on ILC2s to develop a new genetic tool enabling specific targeting of ILC2s in the presence of a functioning adaptive immune system and demonstrate non-redundant functional distinctions between ILC2s and their adaptive counterparts in the context of immunity and inflammation.
A new genetic tool for targeting of ILC2s in vivo
To delineate the distinct functions of ILC2s versus adaptive lymphocytes, we developed a new genetic tool to target ILC2 responses in vivo based on the expression pattern of NMUR1 on ILC2s (Fig. 1a, b, Extended Data Fig. 1a)5–7. Nmur1-BAC-transgenic mice that express iCre (improved Cre26) recombinase and eGFP (enhanced GFP27) from the regulatory elements of Nmur1 were generated (Nmur1iCre-eGFP) (Extended Data Fig. 1b). Comprehensive analysis of Nmur1iCre-eGFP mice confirmed that Nmur1 is highly expressed in ILC2s as determined by the enriched expression of the eGFP reporter in ILC2s (Fig. 1c) but not in other immune cell populations (Fig. 1d), including ILC subsets (Fig. 1c, Extended Data Fig. 1c, d), adaptive lymphocytes (Extended Data Fig. 1e, f), or myeloid cells and granulocytes (Extended Data Fig. 1g, h). In addition, Nmur1-eGFP expression was limited almost exclusively to ILC2s in both non-lymphoid (Fig. 1d, Extended Data Fig. 1i) and lymphoid tissues (Extended Data Fig. 1j, k). Further, the expression of Nmur1-eGFP reporter in the bone marrow lymphoid progenitors emerges only within ILC2 precursors (ILC2P) (Extended Data Fig. 2a–d). Consistent with these findings, when we generated fate mapping R26-RFPNmur1 mice by crossing Nmur1iCre-eGFP and Rosa26LSL-RFP (R26-RFP28) mice, iCre-induced RFP expression was observed in almost all ILC2s and ILC2P in the examined tissues (Fig. 1e–g, Extended Data Fig. 2e) with minimal induction in the other tested immune cell types (Extended Data Fig. 2f–m). Fluorescent microscopy analysis of colons isolated from R26-RFPNmur1 mice also showed an enriched induction of the RFP expression within the hematopoietic compartment (Fig. 1h). To directly test the efficiency and specificity of iCre-mediated recombination, Nmur1iCre-eGFP mice were crossed to Rosa26LSL-DTR (R26-DTR) mice to generate R26-DTRNmur1 mice, which allows Nmur1-induced constitutive expression of human diphtheria toxin receptor (DTR). Following intraperitoneal (i.p.) injection with diphtheria toxin (DT), R26-DTRNmur1 mice (but not littermate control R26-DTR mice) exhibited near-complete depletion of ILC2s in the SI, colon, mesenteric lymph nodes (MLN), and spleen (Fig. 1i, j). In contrast, we observed minimal impact on other immune cell populations, including other ILCs (Extended Data Fig. 3a), adaptive lymphocytes (Extended Data Fig. 3b), or myeloid cells and granulocytes (Extended Data Fig. 3c). Of note, we observed a modest reduction in the frequency of eosinophils in the small intestine (Extended Data Fig. 3c), which is consistent with the known regulation of eosinophil responses by ILC2s5,29,30.
Figure 1 |. Novel mouse strain for efficient targeting of group 2 innate lymphoid cells.
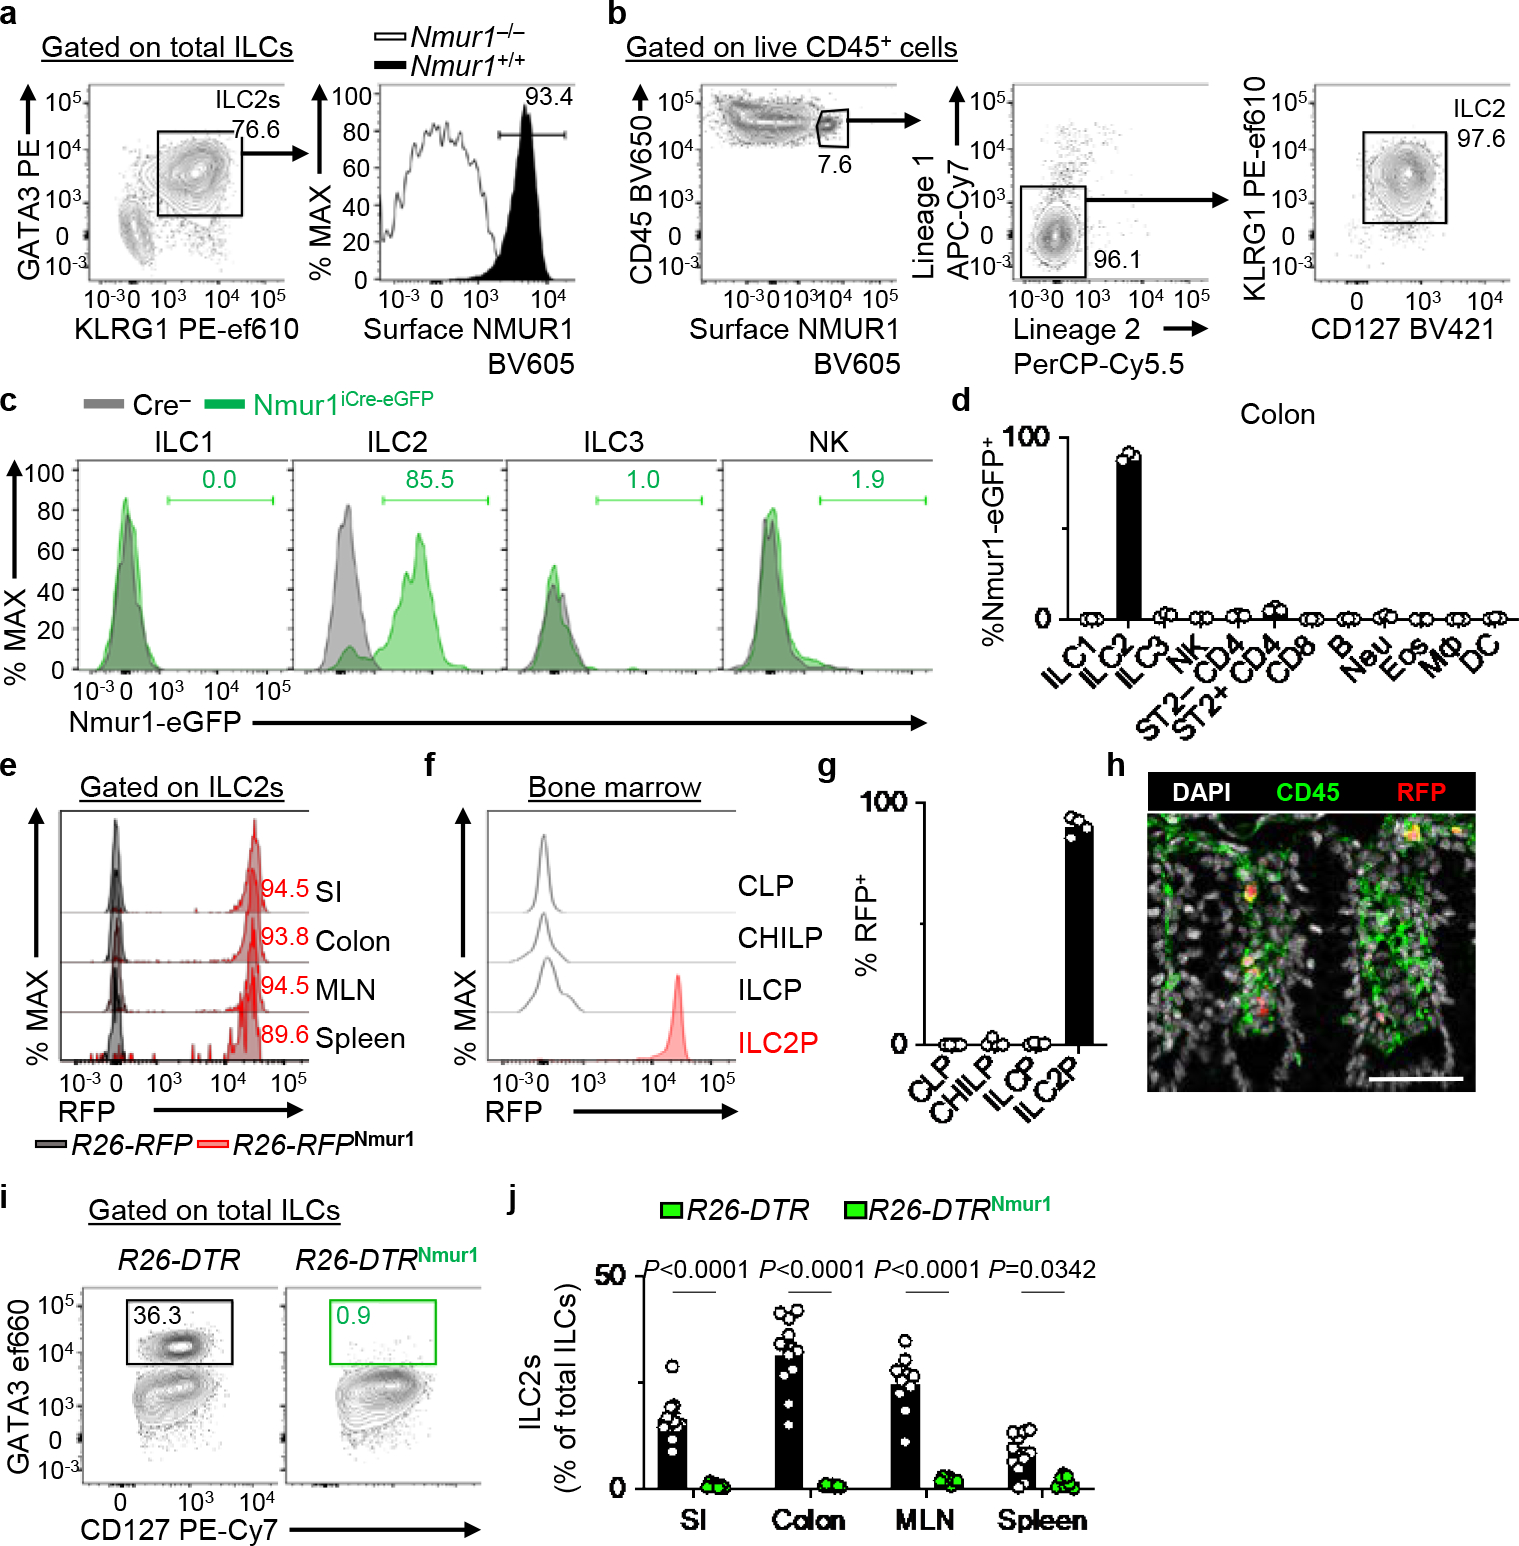
a, Representative flow cytometry and histogram showing NMUR1 protein expression in colon ILC2s from Nmur1+/+ and Nmur1−/− mice. Total ILCs gated as live CD45+Lin−CD90+CD127+ events (Lin: CD3ε, CD5, CD11b, CD11c, FcεRI, B220). b, Representative flow cytometry analysis of NMUR1+ cells within colonic lamina propria lymphocytes (LPL) isolated from naïve WT mice as measured by surface protein staining (Lineage 1: CD11b, CD11c, FcεRI, B220. Lineage 2: CD3ε, CD5). c, d, Nmur1-eGFP expression in ILCs from Nmur1iCre-eGFP mice (n=3 mice). Representative overlaid histograms depicting Nmur1-eGFP expression in ILCs (c) and percentages of Nmur1-eGFP+ cells within the indicated immune cell subsets isolated from the colon (d). e, Representative overlaid histograms showing iCre (RFP) expression in ILC2s from the indicated tissues of R26-RFPNmur1 mice. Histograms are representative of two independent experiments. f, g, Expression of iCre (RFP) in the indicated progenitor cells isolated from the bone marrow of R26-RFPNmur1 mice (n=4 mice). Representative histograms (f) and percentages of RFP+ cells within indicated progenitor cells (g). h, Representative image of colon from R26-RFPNmur1 mice (two independent experiments). DAPI (white), CD45 (green), RFP (red) (bar=50 μm). i, j, R26-DTR (n=11 mice) and R26-DTRNmur1 (n=7 mice) received 2 daily injections of diphtheria toxin followed by 2 days of rest. Representative flow cytometry analysis of ILC2s in the colon pre-gated on total ILCs (i) and percentages of ILC2s in the indicated tissues (j). Data in d are representative of two independent experiments. Data in g are pooled from two independent experiments. Data in j are pooled from three independent experiments. Two-way ANOVA with Šídák multiple comparisons test (j). P values are presented where appropriate. Data are represented as means ± S.E.M. Neu=neutrophils, Eos=eosinophils, MΦ=macrophages, DC=dendritic cells.
While other mouse models have been used to target ILC2s, including Il7rCre31 and ICOS-DTR32 mice, they inherently target relatively large proportions of T cells expressing IL-7R (CD127) or ICOS, respectively. Although the T cell compartment can be rescued by crossing ICOS-DTR to CD4Cre transgenic mouse, resulting in the ICOS-T line32, the presence of Cre recombinase prohibits further gene editing in ILC2s and limits the use of this strain in vivo. Thus, we next compared Nmur1iCre-eGFP to the previously described Red5 (Il5Cre-tdTomato) mouse, which expresses Cre recombinase under the control of the Il5 promoter and has been shown to target ILC2s with its impact on CD4+ T cells limited to the IL-5+ fraction30. We found that following the same DT treatment, R26-DTRRed5 mice exhibited only a modest depletion of ILC2s in the colon and MLN and no significant depletion in the small intestine (SI) or spleen (Extended Data Fig. 3d, e), with minimal impact on other immune cell populations in R26-DTRRed5 mice (Extended Data Fig. 3f, g). Together, these data demonstrate that Nmur1iCre-eGFP mice provide a new tool for reporting Nmur1 expression and efficient ILC2-specific ablation in multiple tissues in vivo.
Targeted and efficient deletion of tissue-protective ILC2-intrinsic amphiregulin
ILC2s are enriched at barrier surfaces, including the intestine, and mediate tissue repair and homeostasis partly through the production of AREG, a ligand of the epidermal growth factor receptor11,12. To investigate the potential non-redundant role for ILC2-derived AREG, we first characterized the pattern of AREG production by ILC2s in the SI, colon, MLN, and spleen of naïve wild-type mice. While ILC2s express AREG in all these tissues, AREG+ ILC2s are particularly enriched in the colon and draining MLN (Fig. 2a, b). In previous single-cell analyses of ILC2 populations, we reported heterogeneity in the co-expression of genes encoding effector molecules, including Il5 and Areg12,20. Notably, while a small fraction of AREG+ ILC2s co-expressed IL-5, most AREG+ ILC2s co-expressed NMUR1 (Fig. 2c, d). In contrast, there was minimal overlap in AREG and NMUR1 expression in ST2+ (T helper type 2, TH2) and ST2− CD4+ T cells (Extended Data Fig. 4a–c). Therefore, we hypothesized that Nmur1iCre-eGFP mice would enable more targeted and efficient deletion of Areg in ILC2s compared to Red5 mice without significantly impacting adaptive lymphocytes. To directly test this hypothesis, we generated new Areg-floxed mice (Aregfl) (Extended Data Fig. 4d) and crossed them to Red5 or Nmur1iCre-eGFP mice to produce AregΔRed5 or AregΔILC2 mice, respectively. Strikingly, while there was no significant decrease in AREG expression in ILC2s from AregΔRed5 mice, we observed an almost complete loss of AREG expression in ILC2s isolated from AregΔILC2 mice (Fig. 2e, f). Furthermore, AREG production in TH2 cells was unaffected in AregΔILC2 mice (Extended Data Fig. 4e, f). Loss of ILC2-intrinsic AREG expression did not alter frequencies or cell numbers of ILC2s (Fig. 2g–i, Extended Data Fig. 4g, h) except in the MLN, where there was a moderate reduction in ILC2 numbers (Extended Data Fig. 4i, j). Further, we did not observe a significant impact on the production of effector cytokines, including IL-5 and IL-13 (Fig. 2j, k, Extended Data Fig. 4k, l). Collectively, these data demonstrate that Nmur1iCre-eGFP mice allow targeted and efficient in vivo ILC2-specific gene editing in the presence of functional innate and adaptive lymphocyte populations.
Figure 2 |. Nmur1Cre deletes amphiregulin within ILC2s with high efficiency.
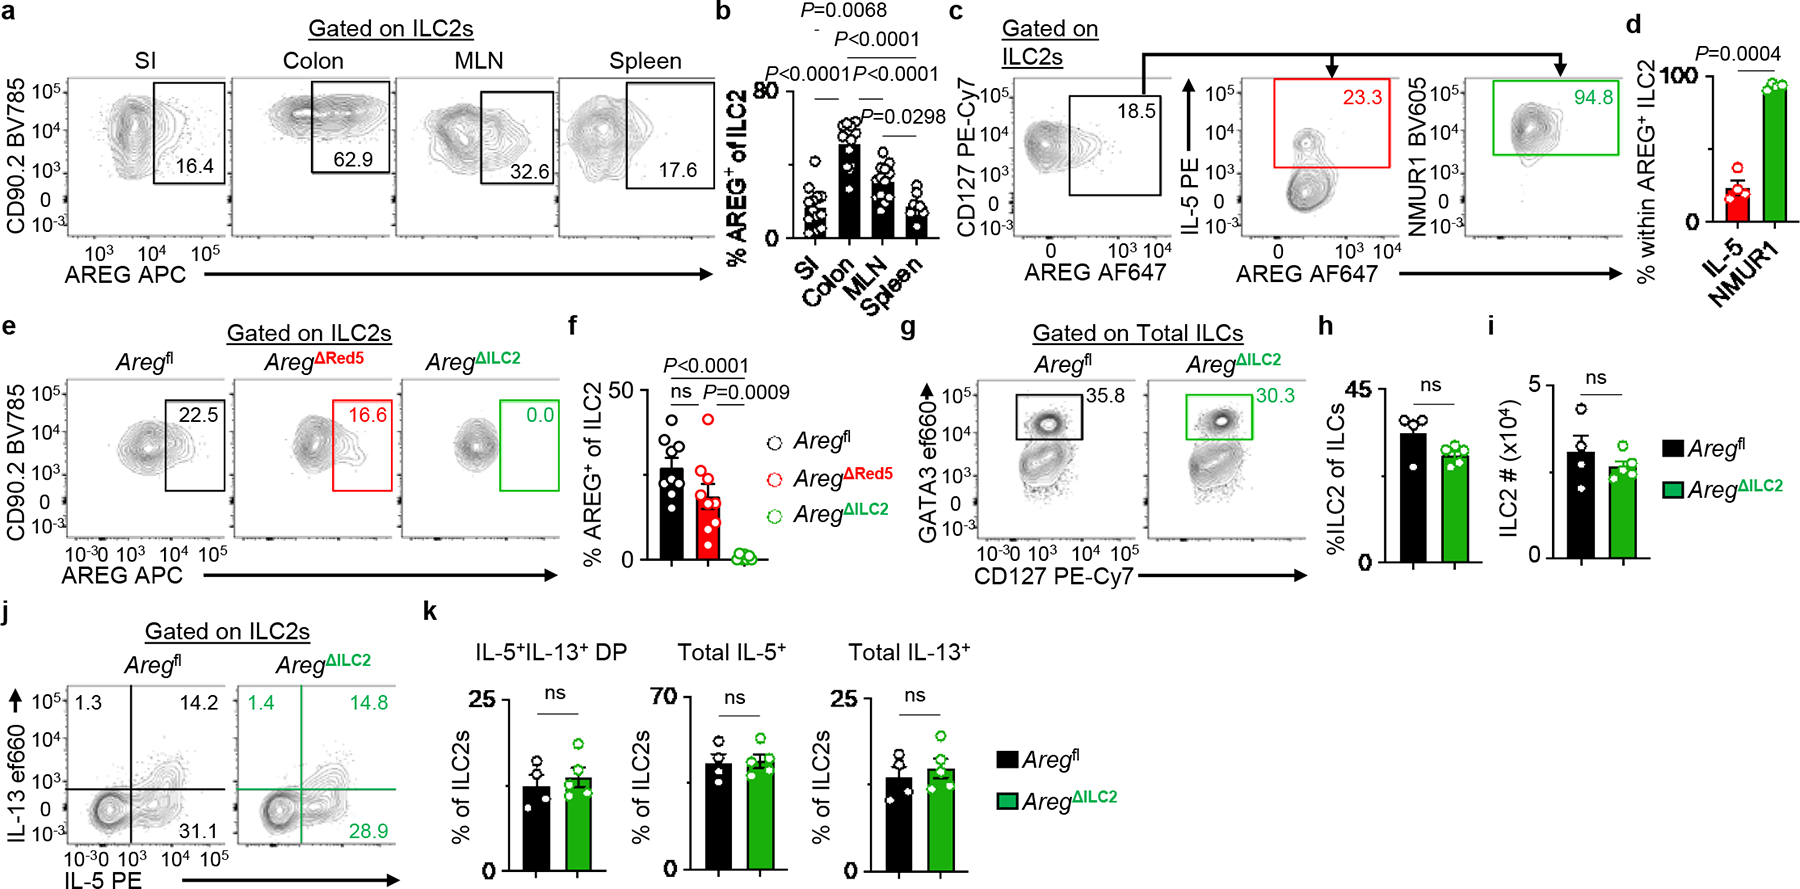
a, b, Representative flow cytometry analysis of AREG expression in WT ILC2s (a) and percentages of AREG+ ILC2s isolated from SI (n=13 mice), colon (n=13 mice), MLN (n=13 mice), and spleen (n=8 mice) (b). c, d, Representative flow cytometry analysis of AREG+ ILC2s (c) and percentages of IL-5+ or NMUR1+ cells within AREG+ ILC2s in MLN isolated from WT mice (n=4 mice) (d). e, f, Representative flow cytometry analysis of ILC2s (e) and percentages of AREG+ ILC2s in MLN isolated from Aregfl (n=9 mice), AregΔRed5 (n=9 mice) and AregΔILC2 (n=7 mice) (f). g-i, Representative flow cytometry analysis of ILC2s (g), percentages of ILC2s within total ILCs (h), and absolute numbers of ILC2s (i) in the colons of Aregfl (n=4 mice) and AregΔILC2 (n=5 mice). j, k, Representative flow cytometry analysis of IL-5 and IL-13 production in ILC2s (j) and percentages of IL-5+IL-13+ DP, total IL-5+ and total IL-13+ cells within ILC2s (k) in the colons of Aregfl (n=4 mice) and AregΔILC2 (n=5 mice). Data in b are pooled from three independent experiments. Data in d, h, i, and k are representative of two independent experiments. Data from f are pooled from two independent experiments. One-way ANOVA with Tukey multiple comparisons test (b, f). Unpaired two-sided t-test (h, i, and k). Paired two-sided t-test (d). P values are presented where appropriate. ns, not significant. Data are represented as means ± S.E.M. DP – double positive.
The non-redundant functions of ILC2-derived AREG in anti-helminth immunity and intestinal tissue protection
Next, we utilized murine models of intestinal infection and inflammation to test whether ILC2-derived AREG performs redundant versus non-redundant functions in the presence of an otherwise functional immune system in vivo. The helminth parasite Trichuris muris primarily invades the cecum and proximal colon and is a model of parasitic infection-induced immunity and inflammation in the large intestine33. While a previous study suggested a role for AREG in promoting worm expulsion34, the critical cellular source of AREG in the context of Trichuris infection has not been clearly defined. Here, we observed increased production of AREG by cecal ILC2s following Trichuris infection (Fig. 3a, b), suggesting that ILC2-derived AREG might play a crucial role in promoting anti-parasite host responses. Following exposure to Trichuris infection, AregΔILC2 mice exhibited minimal expression of AREG in ILC2s (Fig. 3c, d). However, Aregfl and AregΔILC2 mice exhibited comparable priming of adaptive immune responses, including induction of CD4+ T helper cell responses (Extended Data Fig. 5a–c) and antigen-specific cytokine production (Extended Data Fig. 5d, e) following infection. Further, these mice showed comparable Trichuris-induced total IgE production (Fig. 3e) and antigen-specific immunoglobulins in the serum (Extended Data Fig. 5f). However, in the presence of intact priming of adaptive immunity, infected AregΔILC2 mice exhibited a significant reduction in the magnitude of goblet cell responses compared to Aregfl controls (Fig. 3f, g). This observation is consistent with previous studies in which AREG modulates epithelial cell responses, including differentiation into mucus-secreting goblet cells10,35,36. Associated with defective ILC2-derived AREG production and impaired goblet cell hyperplasia, AregΔILC2 mice exhibited significantly increased parasite numbers compared to Aregfl controls (Fig. 3h).
Figure 3 |. ILC2-derived AREG is critical for clearance of the gut-dwelling helminth Trichuris muris and tissue protection following intestinal injury.
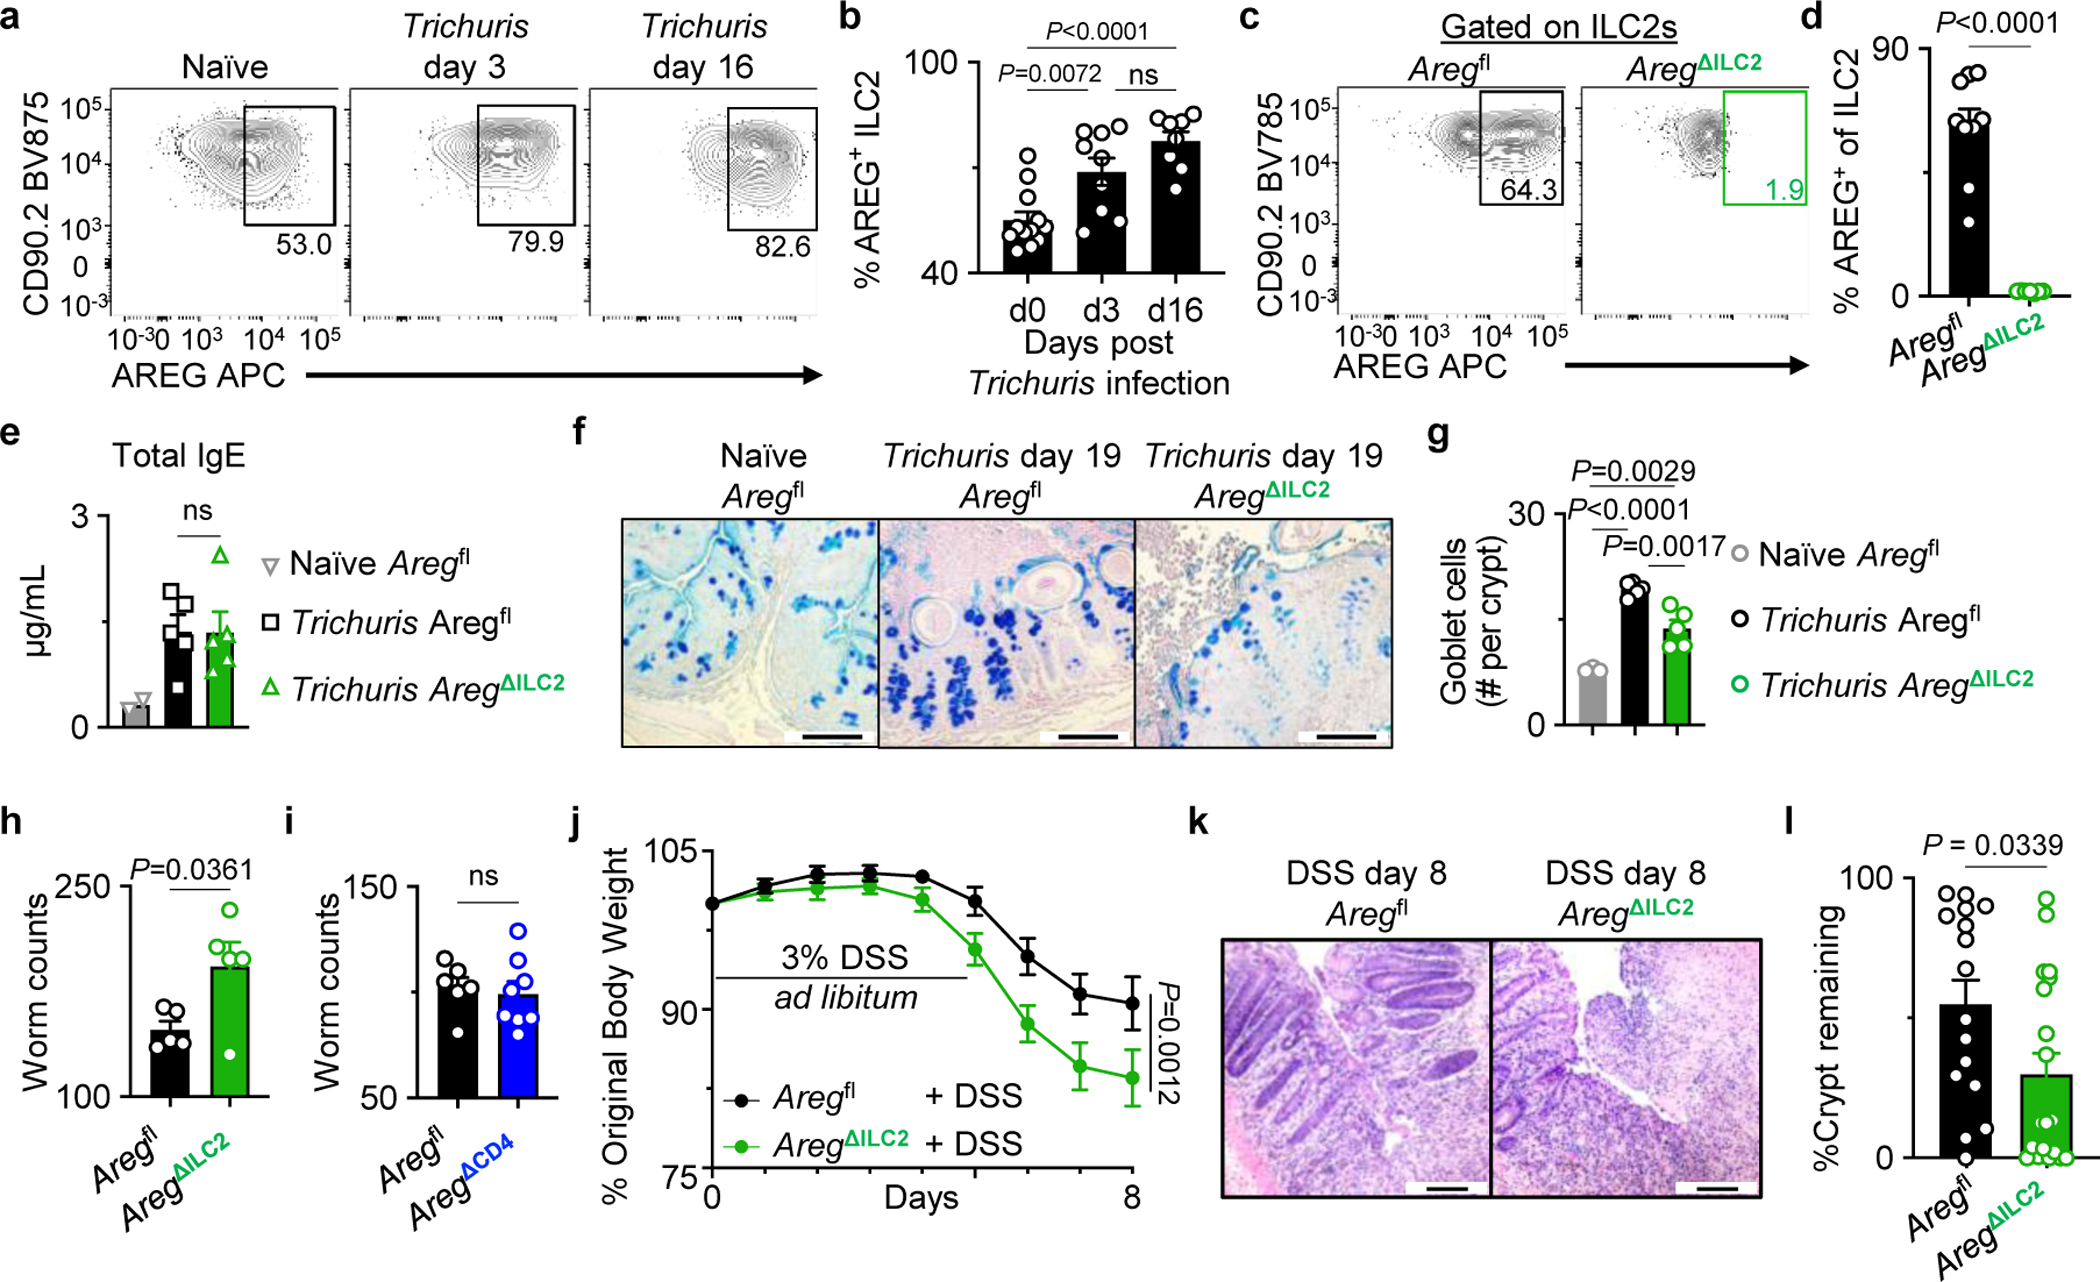
a, b, Representative flow cytometry analysis of ILC2s (a) and percentages of AREG+ ILC2s isolated from WT mice at day 0 (n=12 mice), day 3 (n=9 mice), and day 16 (n=8 mice) post-Trichuris infection (b). c, d, Representative flow cytometry analysis of ILC2s (c) and percentages of AREG+ ILC2s in the colons of Aregfl (n=9 mice) or AregΔILC2 (n=7 mice) (d). e, Total serum IgE levels from naïve Aregfl (n=2 mice) and Trichuris-infected Aregfl (n=5 mice) or AregΔILC2 (n=5 mice) analyzed at day 19 post-infection. f, g, Goblet cells in the proximal colon of naïve Aregfl (n=3 mice) and Trichuris-infected Aregfl (n=5 mice) or AregΔILC2 (n=5 mice) analyzed at day 19 post-infection by AB-PAS staining (bars=100 μm) (f). Enumerated goblet cells per crypt (g). h, i, Trichuris worm counts from Aregfl (n=5 mice) and AregΔILC2 (n=5 mice) (h) or Aregfl (n=6 mice) and AregΔCD4 (n=8 mice) (i) on day 19 post infection. j-l, Measurements of disease severity of DSS-exposed Aregfl (n=16 mice) and AregΔILC2 (n=19 mice) as determined by weight loss (j) and colon epithelial crypt architecture analyzed by H&E staining (bars=100 μm) (k, l). Data in b and d are pooled from two independent experiments. Data in e, g, h are representative of three independent experiments. Data in i are representative of two independent experiments. Data in j and l are pooled from four independent experiments. One-way ANOVA with Tukey multiple comparisons test (b, e, g). Unpaired two-sided t-test (d, h, i, l). Two-way ANOVA with Šídák multiple comparisons test (j). P values are presented where appropriate. ns, not significant. Data are represented as means ± S.E.M.
Further, as Nmur1 has been reported to be expressed by small fractions of neurons in the central nervous system37, we utilized Aregfl and AregΔILC2 mice as donors to generate bone marrow (BM) chimeric mice (Aregfl BM and AregΔILC2 BM mice) to examine a potential role for Nmur1 in non-hematopoietic cells (Extended Data Fig. 6a–d). Consistently, AregΔILC2 BM chimeric mice exhibited a reduction in goblet cell hyperplasia and associated delayed worm expulsion (Extended Data Fig. 6e–h), confirming the role of ILC2-derived anti-parasitic host responses is not impacted by the non-hematopoietic cell compartment. Moreover, despite the comparable priming of the adaptive immune responses in the periphery, further analyses of Trichuris-infected mice revealed that the absence of ILC2-derived AREG led to type 1-skewed intestinal inflammation measured by reduced expansion of eosinophils (Extended Data Fig. 6i–k), moderate but not significant decrease in type 2 cytokine production in CD4+ T cells (Extended Data Fig. 6l), and induction of type 1 inflammatory gene expression (Extended Data Fig. 6m–o), which have been associated with delayed parasite expulsion33,38. These observations suggest that ILC2-derived AREG is critical in promoting intestinal type 2 immune responses following intestinal helminth infection.
Given that TH2 cells and Foxp3+ Tregs have also been shown to produce AREG in some settings39–41, we sought to examine the kinetics of AREG production in cecal ILC2s, Tregs, and effector CD4+ T cells following Trichuris infection. We observed that while ILC2s and Tregs are numerically the dominant sources of AREG at a steady-state and during infection, AREG+ conventional CD4+ T cells represent a relatively minor population (Extended Data Fig. 7a). To test the role of T cell-derived AREG during Trichuris infection, we generated AregΔCD4 mice, which lack AREG expression in the entire CD4+ T cell compartment, by crossing CD4Cre mice to Aregfl mice (Extended Data Fig. 7b–e). AregΔCD4 and Aregfl littermate control mice exhibited comparable worm burdens after infection with Trichuris (Fig. 3i). These observations suggest that ILC2-derived AREG plays an essential and non-redundant role in anti-helminth immunity by modulating intestinal epithelial cell responses.
In addition to promoting anti-helminth immunity, ILC2s have also been shown to play a critical role in tissue protection following intestinal injury12,42. However, it remains unknown whether ILC2-intrinsic AREG production is required to promote tissue-protective mechanisms in this context. To directly test whether ILC2-derived AREG performs a non-redundant function in intestinal tissue protection, AregΔILC2 mice were exposed to dextran sodium sulfate (DSS) to induce intestinal damage and inflammation. DSS-exposed AregΔILC2 mice exhibited increased disease severity as measured by more significant weight loss (Fig. 3j) and intestinal epithelial damage (Fig. 3k, l) than Aregfl controls. Further, consistent with what we observed in the Trichuris model, DSS-exposed AregΔILC2 BM chimeric mice (Extended Data Fig. 8a–d) also exhibited exacerbated disease severity compared to Aregfl BM chimeric mice (Extended Data Fig. 8e–g). These findings indicate that tissue-protective responses were significantly impaired in the absence of ILC2-derived AREG and that AREG produced by other cellular sources could not compensate for ILC2-derived AREG. These findings support a non-redundant role for ILC2-derived AREG in mediating tissue protection in non-infectious intestinal damage and inflammation.
NMU activates ILC2s to promote AREG-dependent non-redundant tissue-protective functions
Recent studies identified multiple neuropeptides that positively or negatively regulate ILC2 functions at barrier surfaces1,3,4,43. For instance, NMU is known to promote ILC2-derived type 2 cytokine responses5–7. Further, in vitro NMU stimulation or pulmonary inflammation induced by Nippostrongylus brasiliensis infection have been shown to promote AREG production in ILC2s6. However, whether NMU regulates the non-redundant tissue-protective functions of ILC2-derived AREG in intestinal damage and inflammation remains unknown. To address the potential neuro-immune regulation of the tissue-protective functions of ILC2s, we first examined whether Nmu expression is altered in response to intestinal inflammation. We observed significantly elevated Nmu expression in the colons of both DSS-exposed and Trichuris-infected mice (Fig. 4a, Extended Data Fig. 9a), consistent with a previous report demonstrating that Nmu expression in enteric neurosphere-derived neurons is regulated in a Myd88-dependent manner6. Imaging of the muscularis propria of NmuCre.Ai14 (Ai14Nmu) reporter mice revealed that Nmu expression within the colon is restricted to a subset of enteric neurons both at the steady-state and after DSS-induced intestinal inflammation (Fig. 4b), suggesting the enteric neuronal contribution to the increased colonic Nmu expression. Indeed, staining of NMU peptide in the muscularis propria demonstrated markedly increased NMU production in intrinsic enteric neurons after DSS exposure (Extended Data Fig. 9b, c). Further, we observed heightened intensity of NMU staining in nerve processes in the colon of DSS-exposed mice compared to controls (Extended Data Fig. 9d–g). Administration of NMU to naïve or DSS-exposed mice resulted in marked upregulation of AREG production in ILC2s (Fig. 4c, d, Extended Data Fig. 10a–c) but not in CD4+ T cells (Extended Data Fig. 10c–e). Consistent with this observation, delivery of NMU to DSS-exposed mice significantly attenuated disease severity as determined by markedly improved epithelial crypt architecture compared to PBS-injected controls (Fig. 4e, f). The tissue-protective effect of NMU was dependent on ILC2-derived AREG since AregΔILC2 mice did not exhibit improvement in their intestinal epithelial architecture upon treatment with NMU (Fig. 4g, h). Collectively, these data indicate a link between inflammation-induced neuronally-derived NMU production and ILC2-mediated tissue protection through AREG-induced intestinal epithelial cell responses10,35.
Figure 4 |. NMU mediates the non-redundant tissue-protective functions of ILC2-derived AREG.
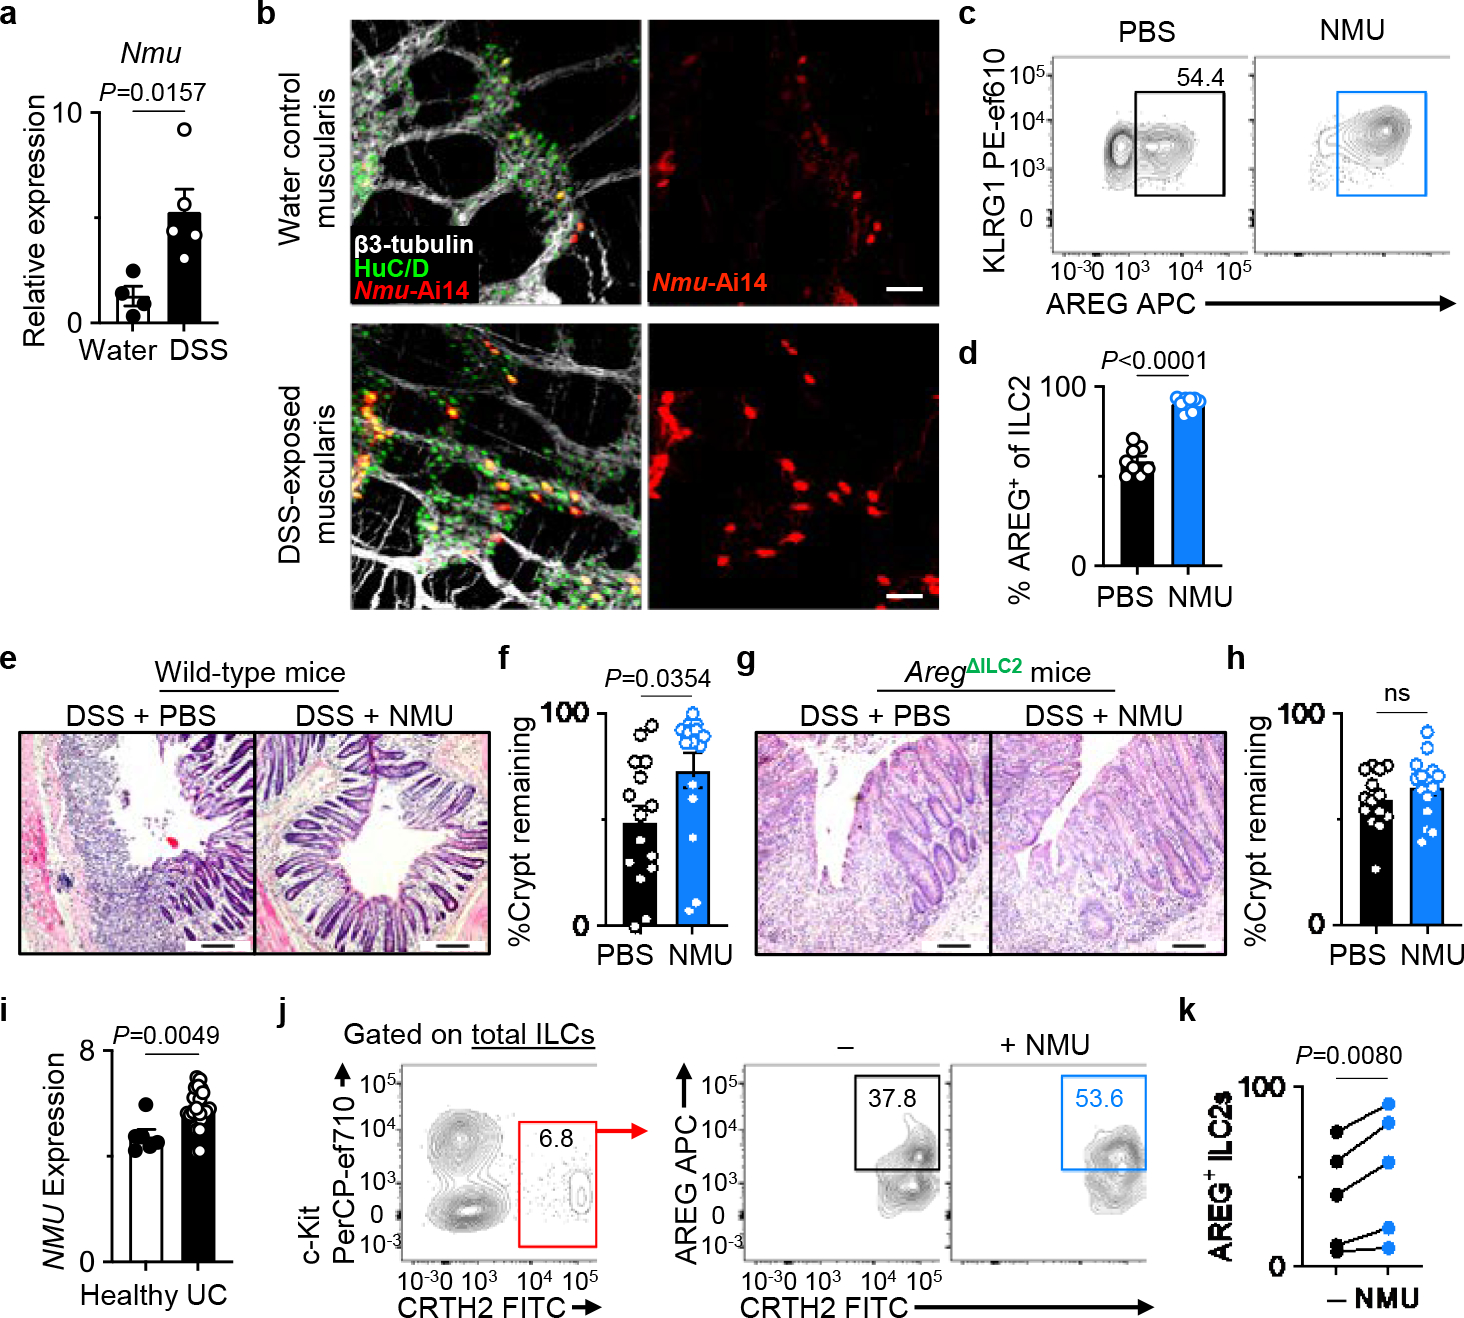
a, Nmu expression in the naïve (n=4 mice) and DSS-exposed (n=5 mice) distal colons determined by qRT-PCR. Normalized to Actb housekeeping gene. b, Representative images of the muscularis propria of naïve (n=3 mice) or DSS-exposed (n=3 mice) inflamed colons of Ai14Nmu mice (bars=50 μm). β3-tubulin (white), HuC/D (green). c, d, Induction of AREG+ ILC2s with NMU in vivo. Representative flow cytometry analysis of ILC2s (c) and percentages of AREG+ ILC2s (d) in the colons of WT mice injected with PBS (n=8 mice) or NMU (n=9 mice) analyzed 18 hours post-injection. e-h, Colonic epithelial crypt architecture analyzed by H&E staining (bars=100 μm). DSS-exposed wild-type mice treated with PBS (n=15 mice) or NMU (n=15 mice) (e, f). DSS-exposed AregΔILC2 mice treated with PBS (n=14 mice) or NMU (n=15 mice) (g, h). i, NMU expression in the human intestinal biopsies (E-GEOD-14580) from healthy (n=6 donors) or UC patients (n=24 donors) as determined by microarray analysis. j, k, Representative flow cytometry analysis of human ILC2s (j) and percentages of AREG+ human ILC2s (k) after stimulation of LPLs isolated from freshly collected surgical colonic and ileal biopsies from IBD patients with or without NMU in vitro (n=5 donors). Each dot represents individual donors assessed in independent experiments. Gating strategy is shown in Extended Data Fig. 10f. Data in a are representative of two independent experiments. Data in d are pooled from two independent experiments. Data in f and h are pooled from three independent experiments. Data in k contain 5 independent human samples, with each dot representing an individual donor. Unpaired two-sided t-test (a, d, f, h, i). Paired two-sided t-test (k). P values are presented where appropriate. ns, not significant. Data are represented as means ± S.E.M. IBD – inflammatory bowel diseases.
NMU-mediated induction of ILC2-derived AREG is evolutionarily conserved
We sought to address whether there is a link between NMU and the ILC2–AREG axis in the context of intestinal inflammation in humans. Consistent with our observations in a murine model of intestinal inflammation (Fig. 4a), NMU expression was elevated in intestinal biopsies from ulcerative colitis patients compared to healthy controls (Fig. 4i)44. Notably, in vitro NMU stimulation resulted in the upregulation of AREG production in human ILC2s isolated from intestinal biopsies from patients with inflammatory bowel diseases (IBD; Supplementary Table 1) (Fig. 4j, k, Extended Data Fig. 10f) but not in CD4+ T cells (Extended Data Fig. 10g, h), which is consistent with our observations in mice (Fig. 4c, d, Extended Data Fig. 10c–e). A recent study also demonstrated that human ILC2s could upregulate type 2 inflammatory cytokines in response to in vitro NMU stimulation45. Together, these data indicate that the NMU-regulated ILC2–AREG response is an evolutionarily conserved tissue-protective mechanism activated during intestinal injury and inflammation.
Discussion
We establish a model in which infectious or inflammatory perturbations at mucosal surfaces induce neuropeptide responses that promote non-redundant anti-microbial and tissue-protective ILC2 responses. Specifically, we demonstrate that in the presence of a functioning adaptive immune response, loss of intestinal mucosal barrier integrity results in the upregulation of NMU in enteric neurons and that NMU stimulates colonic ILC2s to produce AREG. Through this NMU-regulated ILC2–AREG pathway, ILC2s perform essential functions in promoting immunity to infection and facilitating tissue protection. Other sources of AREG, including non-hematopoietic and CD4+ T cells, could not compensate for the loss of ILC2-derived AREG in AregΔILC2 mice following exposure to either helminth infection or in a model of intestinal damage and inflammation. These observations indicate that neuronal-immune cell interactions and ILC2-derived AREG play non-redundant tissue-protective functions in vivo. Further elucidation of where and how the sensory apparatus of the nervous system and immune system are integrated could offer new insights into the pathophysiology and treatment of multiple infectious and inflammatory conditions.
Methods
Data Reporting
No statistical methods were used to predetermine sample size. The experiments were not randomized. The investigators were not blinded to allocation during experiments and outcome assessment.
Mice
All mice were maintained under specific pathogen-free (SPF) conditions. All mice used were between 6 and 15 weeks of age, age- and sex-matched for each experiment, maintained on a 12-hour light-dark cycle with an average ambient temperature of 21 °C and an average humidity of 48%, and provided food and water ad libitum. All mouse experiments were approved by and performed in accordance with the Institutional Animal Care and Use Committee guidelines at Weill Cornell Medicine.
C57BL/6 (Jax 000664), CD45.1 B6 (B6.SJL-Ptprca Pepcb/BoyJ; Jax 002014), R26-DTR (ROSA26iDTR; Jax 007900)46, Ai14 (Jax 007914)47, Red5 (Il5Cre-tdtomato; Jax 030926)30, and CD4Cre (Jax 022071)48 mice were purchased from the Jackson Laboratories. Nmur1−/− mice were generated as described previously5. R26-RFP (Rosa26-stop-DsRed) reporter mice were described previously28 and were bred and maintained at Charité in accordance with the local animal care committees. NmuCre transgenic mice (Tg(Nmu-cre)RJ32Gsat/Mmucd) were originally generated by GENSTAT, provided by the MMRRC Repository and backcrossed to the B6 background. Conditional Areg-deletion mice were generated by and obtained from S. Lira (Icahn School of Medicine at Mount Sinai) and maintained as Aregfl/− (denoted as Aregfl). Briefly, loxP sequences were inserted into intron 2 and intron 4, flanking exons 3 and 4 of the Areg gene49, by utilizing CRISPR/Cas9n technology as described before50. Two plasmids were prepared for injection into the pronucleus of a fertilized one-cell B6D2 mouse egg. Plasmid #1 encoded four sgRNAs to target the Areg gene locus for nicking by Cas9n. Plasmid #2 encoded Cas9n and the repair template: ca 7.5 kb of Areg genomic sequence with introduced loxP sites flanking exons 3 and 4. The insertions of loxP sequences into the correct loci were verified using primers located inside the cassette and outside of the 3’ and 5’ homology regions, respectively. A transgenic Nmur1iCre-eGFP reporter mouse was generated by Cyagen. Briefly, a BAC transgenic vector in the backbone clone RP23–403I3 was generated by replacing the region of the Nmur1 gene containing exons 2 and 3 with a P2A–iCre–T2A–EGFP–Frt–Kanamycin–Frt cassette by homologous recombination. The kanamycin-resistance cassette flanked by Frt sequences in the resulting construct was then removed by FLP-mediated recombination. A loxP and a loxP511 site were also removed from the vector backbone via homologous recombination, producing the final Nmur1iCre-eGFP BAC construct used to generate the Nmur1iCre-eGFP mouse on a C57BL/6 background.
Acquisition and processing of human samples
Human surgically resected intestinal specimens from patients with active inflammatory bowel disease were obtained following Institutional Review Board-approved protocols from the JRI IBD Live Cell Bank Consortium at Weill Cornell Medicine. Informed consent was obtained from all participants. No protected health information was provided to the research group in this study.
Human intestinal lamina propria lymphocytes (LPL) were collected and processed as previously described23,51. Briefly, fat tissues and mucus were removed from the resection specimens, and the epithelial layer was removed by incubating for 30 min at 37°C with shaking in stripping buffer (1 mM EDTA, 1 mM DTT and 5% FBS). Supernatants were then discarded, and the lamina propria fraction was obtained by mechanically mincing, followed by incubation in digestion solution (1 mg/mL collagenase D and 20 μg/mL DNase I in DMEM with 5% FBS) for 60 min at 37°C with shaking. Remaining tissues were then mechanically dissociated and filtered through a 70 μm cell strainer. Cells were washed in DMEM and used for analyses.
Systemic ILC2 depletion in mice
R26-DTRNmur1, R26-DTRRed5, and littermate control R26-DTR mice were treated with two daily intraperitoneal (i.p.) injections of PBS or 1.25 μg diphtheria toxin (DT) and euthanized after an additional two days to collect tissues for analysis.
Isolation of cells from mouse intestinal lamina propria, MLN, spleen, and bone marrow
Mouse colons were removed, cleaned of remaining fat tissues, opened longitudinally, gently rinsed in ice-cold PBS (Sigma-Aldrich), and cut into 0.5 cm pieces. Epithelial cell dissociation was then performed by shaking at 200 rpm and 37 °C in HBSS (Sigma-Aldrich) containing 1 mM DTT (Sigma-Aldrich) and 25 mM EDTA (Thermo Scientific) two times for 15 min each. After each step, tissues were vortexed vigorously and transferred to fresh media to remove the epithelial fraction. After dissociation, enzymatic digestion was performed using collagenase III (1mg/ml; Worthington), dispase (0.4 U/ml; Thermo Scientific), and DNase I (10 μg/ml; Sigma-Aldrich) supplemented with 5% FBS (Peak Serum) and 10 mM HEPES (Corning) in pre-warmed RPMI 1640 medium (Corning) for 60 min on a shaker at 200 rpm and 37°C. After vigorously vortexed, the single-cell suspensions were then filtered through a 70 μm cell strainer and centrifuged, followed by a Percoll (GE Healthcare) gradient (40% single layer) centrifugation and washed with ice-cold RPMI 1640 medium with 5% FBS. Cecal tissues were processed similarly to the colon after removing the cecal patch and residual fat tissues. Cecal patches were mechanically dissociated by using 3 mL syringe plunger through 70 μm cell strainer to obtain the single cell suspension.
Mouse small intestines were harvested and cut into four to five pieces after removing residual fat tissues and Peyer’s patches. Small intestine pieces were then opened longitudinally, and mucus and fecal contents were scraped off gently with a pair of thick forceps and washed with ice-cold PBS. Epithelial dissociation was performed similarly to colon using HBSS containing 1% FBS, 1 mM DTT (Sigma-Aldrich), and 5 mM EDTA (Thermo Scientific). After dissociation, remaining tissues were minced with dissection scissors, and enzymatic digestion was performed similarly to colon using collagenase III (1mg/ml), dispase (0.4 U/ml), and DNase I (20 μg/ml; Sigma-Aldrich) supplemented with 10% FBS in pre-warmed RPMI 1640 medium for 45 min, followed by Percoll gradient centrifugation.
Mesenteric lymph nodes and spleen were cleaned of residual fat tissues, minced with dissection scissors, and incubated in RPMI 1640 medium supplemented with Collagenase II (1 mg/ml; Sigma-Aldrich), DNase I (20 μg/ml), and 1% bovine serum albumin (BSA; Sigma-Aldrich) for 30 min on a shaker at 37°C and 200 rpm. Cells were then further dissociated using a Pasteur pipette and filtered through a 70 μm cell strainer. Red blood cells in the splenocyte suspensions were lysed with ACK lysing buffer (Lonza) and washed with RPMI 1640 medium.
Bone marrow was harvested from the femur and tibia of the hind limbs. Briefly, hind limbs were removed, cleaned free of muscles and connective tissues, and femurs and tibias were disconnected at their joints. The marrow tissues were exposed by cutting both ends of the bones and flushed out using a 25G needle and ice-cold RPMI 1640 medium supplemented with 5% FBS. Collected bone marrow was then processed through a 40μm cell strainer with gentle agitation with a syringe plunger. Red blood cells were lysed with ACK lysing buffer (Lonza) and washed with ice-cold RPMI 1640 medium supplemented with 5% FBS.
Generation of bone marrow chimeras
Recipient CD45.1 mice were preconditioned with the Sulfatrim diet (containing 200 mg trimethoprim and 40 mg sulfamethoxazole) for a week and then irradiated with 11 Gy in an X-ray irradiator (Rad Source Technologies) in two rounds of 5.5 Gy each with a 2-hour break between the two doses. Full bone marrow (BM) cells were collected from the femur and tibia bones of CD45.2 Aregfl or AregΔILC2 mice by flushing. After treating with ACK Lysis Buffer (Lonza), 2×10⁶ BM cells were transferred intravenously to each recipient after a minimum of 2–4 hours of resting post-irradiation. The recipient mice were reconstituted for at least 8 weeks before analysis. During the reconstitution, the recipient mice were maintained on the Sulfatrim diet for two weeks, followed by 6 weeks on the regular diet.
Flow cytometry and cell sorting
Mouse single-cell suspensions were pre-treated with TruStain FcX™ (1:100) (anti-mouse CD16/32) (Biolegend) and 2% normal mouse serum (Jackson ImmunoResearch) and then incubated on ice with conjugated antibodies in PBS or flow cytometry staining buffer (FACS buffer; 1% fatty acid-free BSA (Gold Biotechnology), 25mM HEPES, 2.5mM EDTA, and 0.05% sodium azide (Sigma-Aldrich) in PBS). Dead cells were routinely excluded with Fixable Aqua Dead Cell Stain (Thermo Scientific). For mouse samples, lineage (Lin) markers used were as follows: CD19 (1D3), B220 (RA3–6B2), FcεRIα (MAR-1), CD11b (M1/70) and CD11c (N418), CD3ε (145–2C11) and CD5 (53–7.3). For surface staining, CD45 (30-F11), CD4 (GK1.5 or RM4–5), CD8α (53–6.7), CD127 (A7R34), CD90.2 (30-H12), KLRG1 (2F1), and ST2 (RMST2–33 or DIH9) were also used routinely. Other surface markers used include NK1.1 (PK136), Siglec-F (E50–2440), F4/80 (BM8), Ly6G (1A8), MHC-II (M5/114.15.2), CCR6 (29–2L17), NKp46 (29A1.4), c-Kit (ACK2), α4β7 (DATK32), Sca1 (D7), Flt3 (A2F10), PD-1 (RMP1–30), and CD45.2 (104). Transcription factors were stained using Foxp3 (FJK-16s), GATA3 (TWAJ), T-bet (4B10), and RORγT (B2D) after fixation and permeabilization using the eBioscience Foxp3/Transcription Factor Staining Buffer Set (Thermo Scientific).
To detect intracellular AREG and/or other cytokines, isolated cells were stimulated with 100 ng/ml Phorbol 12-myristate 13-acetate (PMA) (Sigma-Aldrich) and 1 μg/ml ionomycin (Sigma-Aldrich) for 3–4 hours in the presence of 10 μg/ml brefeldin A (Sigma-Aldrich) in complete RPMI-1640 medium (containing 10% FBS, 55 μM 2-mercaptoethanol, 5mM HEPES, 2 mM L-glutamine (GIBCO), 1mM sodium pyruvate (GIBCO), 100μM non-essential amino acids (GIBCO), 100 U/ml penicillin and 100 μg/ml streptomycin (Corning)), followed by surface marker staining on ice in FACS buffer supplemented with 2% normal mouse serum (Jackson ImmunoResearch). Intracellular AREG staining was performed using the BD Cytofix/Cytoperm Fixation and Permeabilization kit (BD Biosciences) or the eBioscience Foxp3/Transcription Factor Staining Buffer Set (Thermo Scientific) when staining simultaneously for other cytokines or with transcription factors, respectively. Intracellular AREG was then detected by staining with biotinylated goat polyclonal anti-mouse AREG antibody (1:400) (BAF989; R&D Systems) and APC-conjugated streptavidin (1:500) (Thermo Scientific) or BV605-conjugated streptavidin (1:500) (Thermo Scientific). Alternatively, purified goat polyclonal anti-mouse AREG (AF989; R&D Systems) was conjugated with AF647 using the Lightning-Link Alexa Fluor 647 Conjugation Kit (Fast) (Abcam) for direct detection in some experiments (1:400). Cytokines were detected by staining for IL-4 (11B11), IL-5 (TRFK5), IL-13 (eBio13A), IFNγ (XMG1.2), TNFα (MP6-XT22), and IL-17A (TC11–18H10.1).
Human colonic LPL cells were stimulated with 100 ng/ml recombinant human IL-2 and 100 ng/ml recombinant human IL-7 with or without 1 μg/ml murine NMU-23 (Phoenix Pharmaceuticals) for 3.5 hours in the presence of 10 μg/ml brefeldin A in complete DMEM medium (Corning) (containing 10% FBS, 5 mM HEPES, 1 mM L-glutamine (GIBCO), 1 mM sodium pyruvate (GIBCO), 1x MEM non-essential amino acid solution (GIBCO), 100 U/ml penicillin and 100 μg/ml streptomycin). Dead cells were excluded with Fixable Aqua Dead Cell Stain (Thermo Scientific). After blocking with 2% normal mouse serum in FACS buffer, human ILC2s52 (CD45+CD3−CD5−CD19−CD14−CD16−FCER1A−CD56−CD11B−CD11C−CD94−CD127+CRTH2+) were identified by using CD45 (HI30), FCERIA (AER-37), CD14 (61D3), CD16 (eBioCB16), CD4 (OKT4), CD11B (ICRF44), CD11C (3.9), CD56 (5.1H11), c-KIT/CD117 (104D2), NKP44 (P44–8), CD19 (HIB19), CD3Ε (UCHT1), CD5 (L17F12), CD127 (A019D5), CD94 (DX22), CRTH2 (BM16), and AF488 anti-FITC. Intracellular AREG expression was detected with biotinylated goat polyclonal anti-human AREG antibody (1:400) (BAF262; R&D Systems) and APC-conjugated streptavidin (1:500) using the eBioscience Foxp3/Transcription Factor Staining Buffer Set.
All antibodies listed above were purchased from Thermo Scientific, Biolegend, or BD Biosciences.
Stained cells were then analyzed on a 5 laser, 18 color custom-configuration BD LSRFortessa (BD) or sorted on a 5 laser, 18 color custom-configuration FACSAria III. The data were acquired using DIVA software (version 9.0). Exported fcs3.0 data files were further analyzed on FlowJo software (version 10.7.1, 10.8.0, or 10.8.1; Tree Star, BD).
Antibodies for FACS or immunofluorescence microscopy analyses
For mouse samples:
α4β7 APC (DATK32; Biolegend 120607, lot# B308508; dilution factor 1:100), AREG Biotinylated (Goat polyclonal; R&D Systems BAF989, lot# IPO0721041; dilution factor 1:400), AREG (Goat polyclonal; R&D Systems AF989, lot# IKG0521021; dilution factor 1:400), B220 APC-ef780 (RA3–6B2; Thermo Scientific 47–0452-82, lot# 2316627; dilution factor 1:200), CCR6 BV421 (29–2L17; Biolegend 129817, lot# B301881; dilution factor 1:100), CD11b APC-ef780 (M1/70; Thermo Scientific 47–0112-82, lot# 2272759; dilution factor 1:200), CD11b AF700 (M1/70; Thermo Scientific 56–0112-82, lot# 4319576; dilution factor 1:300), CD11c APC-ef780 (N418; Thermo Scientific 47–0114-82, lot# 2340825; dilution factor 1:200), CD11c APC (N418; Thermo Scientific 17–0114-82, lot# 4283617; dilution factor 1:300), CD127 PE-Cy7 (A7R34; Thermo Scientific 25–1271-82, lot# 2233920; dilution factor 1:50), CD127 BV421 (A7R34; Biolegend 135024, lot# B267416; dilution factor 1:50), CD19 APC-ef780 (1D3; Thermo Scientific 47–0193-82, lot# 2227589; dilution factor 1:200), CD19 PerCP-Cy5.5 (1D3; Thermo Scientific 45–0193-82, lot# 2133250; dilution factor 1:200), CD3ε PerCP-Cy5.5 (145–2C11; Thermo Scientific 45–0031-82, lot# 2074540; dilution factor 1:300), CD3ε APC-ef780 (17A2; Thermo Scientific 47–0032-82, lot# 2138814; dilution factor 1:300), CD4 BV605 (GK1.5; Biolegend 100451, lot# B307549; dilution factor 1:300), CD4 BV605 (RM4–5; Biolegend 100548, lot# B332799; dilution factor 1:300), CD4 BUV395 (GK1.5; BD Biosciences 563790, lot# 1097734; dilution factor 1:200), CD45 BV785 (30-F11; Biolegend 103149, lot# B325340; dilution factor 1:300), CD45 BV650 (30-F11; Biolegend 103151, lot# B325965; dilution factor 1:400), CD45.2 AF700 (104; Biolegend 109822, lot# B202497; dilution factor 1:200), CD45.2 FITC (104; Thermo Scientific 11–0454-82, lot# 2331997; dilution factor 1:200), CD5 PerCP-Cy5.5 (53–7.3; Thermo Scientific 45–0051-82, lot# 2114151; dilution factor 1:300), CD5 APC-ef780 5 (53–7.3; Thermo Scientific 47–0051-82, lot# 1960149; dilution factor 1:300), CD8α PE (53–6.7, BD Biosciences 553033, lot# 9204340; dilution factor 1:300), CD90.2 AF700 (30-H12, Biolegend 105320, lot# B260794; dilution factor 1:300), CD90.2 BV785 (30-H12, Biolegend 105331, lot# B289707; dilution factor 1:300), c-Kit PE-ef610 (ACK2; Thermo Scientific 61–1172-82, lot# 237813; dilution factor 1:150), F4/80 PE-Cy7 (BM; Thermo Scientific 25–4801-82, lot# 2198632; dilution factor 1:200), FcεRIα APC-ef780 (MAR-1; Thermo Scientific 47–5898-82, lot# 2282699; dilution factor 1:200), FcεRIα AF700 (MAR-1; Biolegend 134324, lot# B307696; dilution factor 1:200), Flt3 PerCP-ef710 (A2F10; Thermo Scientific 46–1351-80, lot# 4272732; dilution factor 1:100), FoxP3 ef450 (FJK-16s; Thermo Scientific 48–5773-82, lot# 2195599; dilution factor 1:150), FoxP3 AF488 (FJK-16s; Thermo Scientific 53–5773-82, lot# 2199652; dilution factor 1:150), GATA3 ef660 (TWAJ; Thermo Scientific 50–9966-42, lot# 2265210; dilution factor 1:100), GATA3 PE (TWAJ; Thermo Scientific 12–9966-42, lot# E11692–1634; dilution factor 1:100), IFNγ PE-Cy7 (XMG1.2; Thermo Scientific 25–7311-82, lot# 2098090, dilution factor 1:200), IL-4 APC (11B11; Thermo Scientific 17–7041-82, lot# 2213135; dilution factor 1:100), IL-5 PE (TRFK5; BD Biosciences 554395, lot# 8130811; dilution factor 1:100), IL-13 AF488 (eBio13A; Thermo Scientific 53–7133-82, lot# 2347810; dilution factor 1:100), IL-13 PE (eBio13A; Thermo Scientific 12–7133-82, lot# 2433457; dilution factor 1:100), IL-13 ef660 (eBio13A; Thermo Scientific 50–7133-82, lot# 2040688; dilution factor 1:50), IL-17A AF700 (TC11–18H10.1; Biolegend 506914, lot# B284192; dilution factor 1:100), KLRG1 APC (2F1; Thermo Scientific 17–5893-82, lot# 1994133; dilution factor 1:300), KLRG1 PE-eF610 (2F1; Thermo Scientific 61–5893-82, lot# 2185477; dilution factor 1:300), Ly6G BUV395 (1A8; BD Biosciences 563978, lot# 0300815; dilution factor 1:300), Ly6G AF700 (RB6–8C5; Thermo Scientific 56–5931-82, lot# 4290648; dilution factor 1:200), MHC-II APC-ef780 (M5/114.15.2; Thermo Scientific 47–5321-80, lot# 2178339; dilution factor 1:400), NK1.1 BUV395 (PK136; BD Biosciences 564144, lot# 0021134; dilution factor 1:300), NKp46 PE-eF610 (29A1.4; Thermo Scientific 61–3351-82, lot# 4288914; dilution factor 1:200), NMUR1 Biotinylated (AlivaMab mouse anti-mouse NMUR1 clone 12-A03; Tri-Institutional Therapeutics Discovery Institute at Weill Cornell Medicine; dilution factor 1:66), RORγT PE-ef610 (B2D; Thermo Scientific 61–6981-82, lot# 2297317; dilution factor 1:200), PD-1 PE-Cy7 (RMP1–30; Biolegend 109110, lot# B1722533, dilution factor 1:150), Sca1 BUV395 (D7; BD Biosciences 563990, lot# 0342575; dilution factor 1:150), Siglec-F BV421 (E50–2440; BD Biosciences 562681, lot# 0269846; dilution factor 1:200), Siglec-F PE (E50–2440; BD Biosciences 532126, lot# 9108977; dilution factor 1:200), ST2 Biotin (RMST2–2; Thermo Scientific 13–9335-82, lot# 2274333; dilution factor 1:200), ST2 PE (RMST2–2; Thermo Scientific 12–9335-82, lot# 2363864; dilution factor 1:50), ST2 BV421 (DIH9; Biolegend 145309, lot# B348614, dilution factor 1:25), Streptavidin APC (Thermo Scientific 17–4317-82, lot# 2281539; dilution factor 1:500), Streptavidin BV605 (Biolegend 405229, lot# B267737; dilution factor 1:250 or 1:500), T-bet BV605 (4B10; Biolegend 644817, lot# B319971; dilution factor 1:100), T-bet BV421 (4B10; Biolegend 644816, lot# B326244; dilution factor 1:100), TNFα ef450 (MP6-XT22; Thermo Scientific 48–7321-82, lot# 2011695, dilution factor 1:200), TruStain FcX™ (anti-mouse CD16/32) (93; Biolegend 101320, lot#B360655, dilution factor 1:100), β3-tubulin AF488 (2G10-TB3; Thermo Scientific 53–4510-82, lot# 2305713; dilution factor 1:100 or 1:250), CD45 Purified (30-F11; BD Biosciences 550539, lot# 2004510; dilution factor 1:100), EpCAM Purified (G8.8; Biolegend 118201, lot# B318703, dilution factor 1:250), HuC/D AF488 (EPR19098; abcam ab237234, lot# GR3409310–1; dilution factor 1:250), KLRG1 Purified (2F1; Thermo Scientific 16–5893-85, lot# 2297438; dilution factor 1:50), NMU purified (Rabbit polyclonal; Santa Cruz sc-368069, lot# A0314; dilution factor 1:100), Donkey Anti-Rat IgG AF647 (Donkey polyclonal; Jackson ImmunoResearch 712–605-153, lot# 000000120620; dilution factor 1:250), Donkey anti-rabbit IgG AF594 (Jackson ImmunoResearch 711–585-152, lot# 000000152901; dilution factor 1:400), Goat anti-Rat IgG AF647 (Goat polyclonal; Thermo Scientific A-21247, lot# 2251195; dilution factor 1:400), Goat anti-Hamster IgG AF647 (Goat polyclonal; Thermo Scientific A-21451, lot# 1752235; dilution factor 1:500), Goat anti-Hamster IgG AF546 (Goat polyclonal; Thermo Scientific A-21111, lot# 2087700; dilution factor 1:500), Goat anti-rabbit IgG AF405 (Thermo Scientific A-31556, lot# 1885959; dilution factor 1:250).
For human samples:
AREG Biotinylated (Goat polyclonal; R&D Systems BAF262, lot# BER1020101; dilution factor 1:400), CD11B BV650 (ICRF44; Biolegend 301336, lot# B252692; dilution factor 1:200), CD11C BV650 (3.9; Biolegend 301638, lot# B240603; dilution factor 1:200), CD14 ef450 (61D3; Thermo Scientific 48–0149-42, lot# E08492–1636; dilution factor 1:200), CD16 ef450 (eBioCB16; Thermo Scientific 48–0168-42, lot# E0896–1634; dilution factor 1:200), CD19 AF700 (HIB19; Thermo Scientific 56–0199-42, lot# E11304–1632; dilution factor 1:200), CD4 BV605 (OKT4; Biolegend 317438, lot# B278010; dilution factor 1:200), CD56 BV785 (5.1H11; Biolegend 362550, lot# B236897; dilution factor 1:100), CD127 APC/Fire750 (A019D5; Biolegend 351350, lot# B326988; dilution factor 1:10), CD3E AF700 (UCHT1; Biolegend 300424, lot# B238915; dilution factor 1:200), CD45 BUV395 (HI30; BD Biosciences 563792, lot# 9004778; dilution factor 1:200), CD5 AF700 (L17F12; Biolegend 364026, lot# B222024; dilution factor 1:200), CD94 PE (DX22; Biolegend 305506, lot# B224156; dilution factor 1:100), c-KIT PerCP-ef710 (104D2; Thermo Scientific 46–1178-42, lot# 2025775; dilution factor 1:200), CRTH2 FITC (BM16; BD Biosciences 561659, lot# 1238469; dilution factor 1:20), FcεRIα BV421 (AER-37 (CRA-1); Biolegend 334624, lot# B300091; dilution factor 1:200), GATA3 PE (TWAJ; Thermo Scientific 12–9966-42, lot# 2202293; dilution factor 1:100), NKP44 PerCP-Cy5.5 (P44–8; Biolegend 325113, lot# B302614; dilution factor 1:200), Anti-FITC AF488 (Monoclonal mouse IgG; Jackson ImmunoResearch, lot# 000000158071; dilution factor 1:150), Streptavidin APC (Thermo Scientific 17–4317-82, lot# 2281539; dilution factor 1:500).
Detection of cell surface NMUR1 protein expression
For surface staining of NMUR1, the intestinal tissues were processed similarly as for other experimental purposes; however, enzymatic digestion of the epithelial-stripped tissues was performed using collagenase III (1mg/ml; Worthington), dispase (0.1 U/ml; Thermo Scientific), and DNase I (10 μg/ml; Sigma-Aldrich) supplemented with 5% FBS (Peak Serum) and 10mM HEPES (Corning) in pre-warmed RPMI 1640 medium (Corning) to minimize enzymatic cleavage of surface NMUR1 during digestion. The single-cell suspensions were then stained with biotinylated AlivaMab mouse anti-mouse NMUR1 (clone 12-A03 developed by Tri-Institutional Therapeutics Discovery Institute at Weill Cornell Medicine) together with other surface antibodies, followed by BV605-conjugated streptavidin (Biolegend).
Helminth infection
Mice were infected with 200 embryonated Trichuris muris eggs in 200 μL of water via oral gavage. Tissues were collected on days 3, 16, or 19 post-infection. To quantify Trichuris worm burden, the cecum and proximal colon were harvested from infected mice 19 days post-infection and frozen at −30°C for a minimum of 2 days after removing residual fat tissues. Each frozen tissue was thawed at room temperature, opened longitudinally, and gently rinsed in a gridded-square petri dish (Fisher Scientific) containing distilled water. The epithelial layer was removed by gently scraping with a pair of fine curved forceps in a separate gridded petri dish with fresh distilled water. Epithelial scraping was repeated in another fresh petri dish to ensure the removal of Trichuris worms. Released worms were then counted using a dissecting microscope.
Trichuris worms were maintained as previously described53. Trichuris embryonated eggs and excretory/secretory (E/S) antigens were generated as previously described53. Embryonated eggs and E/S antigens were stored at 4°C and −80°C, respectively.
Dextran sulfate sodium (DSS) administration for chemically induced colitis
Colitis-grade DSS salt with an average molecular weight of 36,000–50,000 Da (MP Biomedicals) was added to drinking water on day 0 at 3% and provided to mice ad libitum for 5–8 days. In some experiments, mice were returned to regular drinking water for an additional 3–5 days. Mice were monitored daily for morbidity (piloerection, lethargy), weight loss, and rectal bleeding. Where indicated, DSS-exposed mice were also treated with i.p. injections of PBS or 20 μg NMU-23 (Phoenix Pharmaceuticals) every other day starting on day 1 post-DSS administration until the termination of the experiment.
Histological analysis
Cecal tip or proximal colon from Trichuris muris infected mice as well as distal colon from DSS-exposed mice were gently flushed with ice-cold PBS and fixed in 4% paraformaldehyde, followed by embedding in paraffin. Then, 5–6 μm sections were used for staining with hematoxylin and eosin (H&E) or Alcian blue and periodic acid Schiff (AB-PAS) by IDEXX BioResearch. Histological scoring of H&E-stained colon tissues from DSS-exposed mice was performed based on the percentage of remaining intact crypts. For quantification of goblet cells (GCs), the number of AB-PAS+ GCs in each crypt was counted for at least 10 crypts per tissue, and then the average number of GCs per crypt for each mouse tissue section was used for statistical analysis.
In vivo ILC2 activation in mice
C57BL/6 mice were treated with a single i.p. injection of PBS or 20 μg NMU-23. The following day, mice were euthanized to assess the AREG expression levels in colonic ILC2s and CD4+ T cells by flow cytometry.
CUBIC imaging
Colons were collected from PBS or 3% DSS-treated C57BL/6J mice and cleared by following the CUBIC (clear, unobstructed brain imaging cocktails and computational analysis) protocol as previously described54. Briefly, colons were fixed in 4% paraformaldehyde (BioWorld) in PBS for 2 hours at 4°C. Fixed tissues were then incubated in CUBIC reagent 1 at room temperature for 1 day until tissues were significantly cleared. Cleared tissues were washed with room temperature PBS 3 times with gentle shaking. After washing, tissues were dehydrated in 30% (w/v) sucrose in PBS at 4°C overnight. Dehydrated tissues were then frozen in OCT medium (Tissue-Tek, Sakura) and stored at −80°C. Frozen tissues were thawed and washed with room temperature PBS 3 times before immunostaining. For immunostaining, tissues were stained with the following primary antibodies diluted in blocking buffer for 3 days at room temperature on a shaker: rabbit anti-NMU (Santa Cruz; Rabbit polyclonal M-76; sc-368069) at 1:100 and anti-β3-tubulin AF488 (Thermo Scientific) at 1:100. Tissues were washed 3 times with PBS and then incubated with secondary antibody (Goat anti-rabbit IgG AF405; Thermo Scientific) diluted at 1:250 in blocking buffer for 3 days at room temperature on a shaker. After immunostaining, tissues were immersed in CUBIC-2 reagent overnight. Cleared and stained tissues were then mounted onto slides with glycerol. Z-stack images of identical depth were obtained using an Olympus FV1000 laser-scanning confocal microscope. Using Image-J, single-channel z-stack images of NMU antibody-stained neurons were compressed into a maximum intensity projection before converting to a binary image using the RenyiEntropy thresholding preset. Total NMU+ pixel density was then calculated using the measure area function.
Imaging of colonic muscularis propria
The distal-most 2 cm portion of the colon was isolated and cleaned of fecal material before dissection. The muscularis layer was isolated using a dissecting microscope. The isolated muscularis was briefly fixed with 4% PFA, permeabilized, blocked, and then stained overnight with the indicated antibodies. Tissues were washed 3X in PBS after primary and secondary incubations and then mounted onto glass slides using Prolong Gold antifade reagent (Invitrogen) and imaged using a 20X air objective using a Zeiss LSM 980 confocal laser scanning microscope. Antibodies used include anti-HuC/D AF488 (EPR19098; abcam) at 1:250, rabbit anti-NMU (Santa Cruz; sc-368069) at 1:100 and donkey anti-rabbit IgG AF594 (Jackson ImmunoResearch) at 1:250, and anti-β3-tubulin AF488 (Thermo Scientific) at 1:100.
Immunofluorescent imaging of colonic swiss rolls
Mouse colon tissues were rolled into swiss rolls and fixed in 1% paraformaldehyde (PFA) at 4°C overnight or 4% PFA at 4°C for 4 hours, washed three times in PBS, and dehydrated in 30% sucrose in PBS overnight or until the tissues have sunk to the bottom of the containers. Tissues were then frozen in Tissue-Tek OCT (Sakura) and stored at −80 °C until sectioned in a Cryostat (Leica) at 7–10μm thickness. Immobilized tissues were then stored at −20°C until immunostaining. Slides were brought to room temperature and washed with PBS three times to remove OCT. Tissue sections were then permeabilized with 0.5% Triton-X in PBS and blocked with 2% FCS in PBS or 5% donkey and goat serum (both Jackson ImmunoResearch) in 0.5% Triton-X in PBS for 30 mins and stained for analysis. Antibodies used include CD45 (30-F11; BD Biosciences) at 1:100 and secondary goat anti-rat IgG AF647 (Thermo Scientific) at 1:400, KLRG1 (2F1; Thermo Scientific) at 1:50 and secondary goat anti-hamster IgG AF647 (Thermo Scientific) at 1:500 or goat anti-hamster AF568 (Thermo Scientific) at 1:500, EpCAM (G8.8; Biolegend) at 1:250 and secondary donkey anti-rat AF647 (Jackson ImmunoResearch) at 1:250, β3-tubulin AF488 (2G10-TB3; Thermo Scientific) at 1:250, rabbit anti-NMU (Santa Cruz) at 1:100 and donkey anti-rabbit IgG AF594 (Jackson ImmunoResearch) at 1:400. Tissue sections were then washed 3 times in PBS, incubated with DAPI (Invitrogen) for 5 minutes prior to a final wash in PBS, and mounted with Prolong Gold antifade reagent (Thermo Scientific). Images were acquired on a Zeiss LSM 780 confocal microscope or a Zeiss LSM 980 confocal laser scanning microscope and analyzed with ZEN 3.1 (blue edition) (Zeiss) or Fiji (ImageJ version 2.3.0/1.53q).
Detection of antigen-specific cytokine response
Bulk single-cell suspensions of MLN isolated from naïve or Trichuris muris infected mice were stimulated with 50 μg/ml of E/S Trichuris antigen at 4×10⁶ cells/ml density in complete RPMI-1640 medium for 72 hours at 37°C. Antigen-activated MLN cells were then stimulated with PMA, ionomycin, and Brefeldin A for 4 hours at 37°C and analyzed for cytokine production by flow cytometry.
Detection of immunoglobulins in serum by ELISA
Sera were collected from naïve or Trichuris muris infected mice at 19 days post-infection and stored at −30°C for side-by-side analysis. Total circulating IgE concentration was determined using the Mouse IgE ELISA Set (BD Biosciences) by following the manufacturer’s protocol. Serially diluted sera at 1:5, 1:25, and 1:125 were used for IgE detection. Trichuris antigen-specific IgG1 and IgG2c concentrations were measured via antigen-specific ELISA. Briefly, Immulon 4HBX Extra High Binding plates (Thermo Scientific) were coated with E/S Trichuris antigen in ELISA coating buffer (PBS supplemented with 0.1 M sodium carbonate (Sigma-Aldrich), 0.1M sodium bicarbonate (Sigma-Aldrich), and 1mM sodium Azide (Sigma-Aldrich) at pH 9.6). Sera were serially diluted two-fold from 1:20 to 1:2560 and incubated in the antigen-coated Immulon 4HBX plates. Antigen-specific IgG1 or IgG2c bound to the immobilized Trichuris antigen was then detected with HRP-conjugated goat anti-mouse IgG1 (Thermo Scientific) or HRP-conjugated goat anti-mouse IgG2c (Thermo Scientific). For IgE, the plates were developed with TMB substrate (Thermo Scientific) and KPL TMB Stop Solution (SeraCare), and optical density (OD) was measured at 450 nm. For IgG1 and IgG2c, the plates were developed with 1-Step™ ABTS Substrate Solution (Thermo Scientific), and OD was measured at 405nm.
Analysis of human NMU gene expression in colon biopsy samples from publicly available microarray data
We first identified the dataset via the NCBI Gene Expression Omnibus (GEO) (accession code GSE1458044). The microarray data for the analysis were then downloaded from the EMBL-EBI Expression Atlas repository55 using the accession number E-GEOD-14580.
RNA sequencing of ILC2s and CD4+ T cells
Nmur1-eGFP+ ILC2s, Nmur1-eGFP+ CD4+ T cells and Nmur1-eGFP− CD4+ T cells were purified by fluorescence-activated cell sorting (ILC2: CD45+Lin−CD90.2+CD127+KLRG1+, CD4+ T cells: CD45+CD3+CD5+CD4+) from Nmur1iCre-eGFP mice exposed to 3% DSS. RNA was extracted using the RNeasy Micro Kit (Qiagen). RNA libraries were prepared using the NEBNext Single Cell/Low Input RNA Library Prep Kit for Illumina (New England Biolabs). Pooled libraries were combined and sequenced with a 75 cycle NextSeq High Output Kit (Illumina). Raw sequence reads were mapped to the mm10 genome assembly using STAR aligner version 2.5.356 with default parameters. Read counts per gene were determined using the Rsubread R package57 using R 3.6.3. Read count normalization was performed using DESeq2 version 1.30.158. The normalized read counts were then further analyzed on Graphpad Prism (version 8.4.3 and 9.2.0) for data visualization and statistical analysis.
Tissue gene expression analysis by qRT-PCR
RNA was extracted from various tissues with Trizol (Thermo Scientific) or the RNeasy Plus Mini kit (Qiagen) by following the manufacturers’ protocols. cDNA was synthesized by using the High-Capacity cDNA Reverse Transcription Kit (Thermo Scientific) or Maxima First Strand cDNA Synthesis Kit for RT-qPCR (Thermo Scientific). Gene expression was analyzed on a QuantStudio 6 Flex Real-Time PCR System (Thermo Scientific) using Power SYBR Green Master Mix (Thermo Scientific) and primers purchased via QuantiTect Primer Assay system (Qiagen). The expression level for each gene was internally normalized to Actb housekeeping gene.
For extracting RNA from DSS-exposed colon tissues, the RNeasy Plus Mini kit (Qiagen) was used with some modifications to the protocol to ensure complete removal of residual DSS. Briefly, RNA-bound columns were extensively washed three times with RW1 buffer and six times with RPE buffer supplemented with ethanol. Prior to gene expression analysis, the quality of the RNA extracted from DSS-exposed colons was checked by measuring the spectra on a NanoDrop spectrophotometer (Thermo Scientific) and by comparing the Actb transcript level in RNA extracted from DSS-exposed versus naïve colons.
Statistical analysis
Statistical tests were performed with GraphPad Prism (version 8.4.3 and 9.2.0) or R 3.6.3. Error bars represent standard error of the mean (S.E.M.), and bars represent means. P values of data sets were determined by either unpaired or paired two-tailed Student’s t-test with 95% confidence interval, one-way ANOVA with Tukey’s multiple comparisons test, or two-way ANOVA with Šídák’s multiple comparisons test, unless specified otherwise. Significance levels in each figure are represented with exact P valuses or with ns, indicating not significant.
Reporting summary
Further information on research design is available in the Nature Research Reporting Summary linked to this paper.
Extended Data
Extended Data Figure 1 |. Nmur1-eGFP is highly expressed and enriched in ILC2s in lymphoid and non-lymphoid tissues.
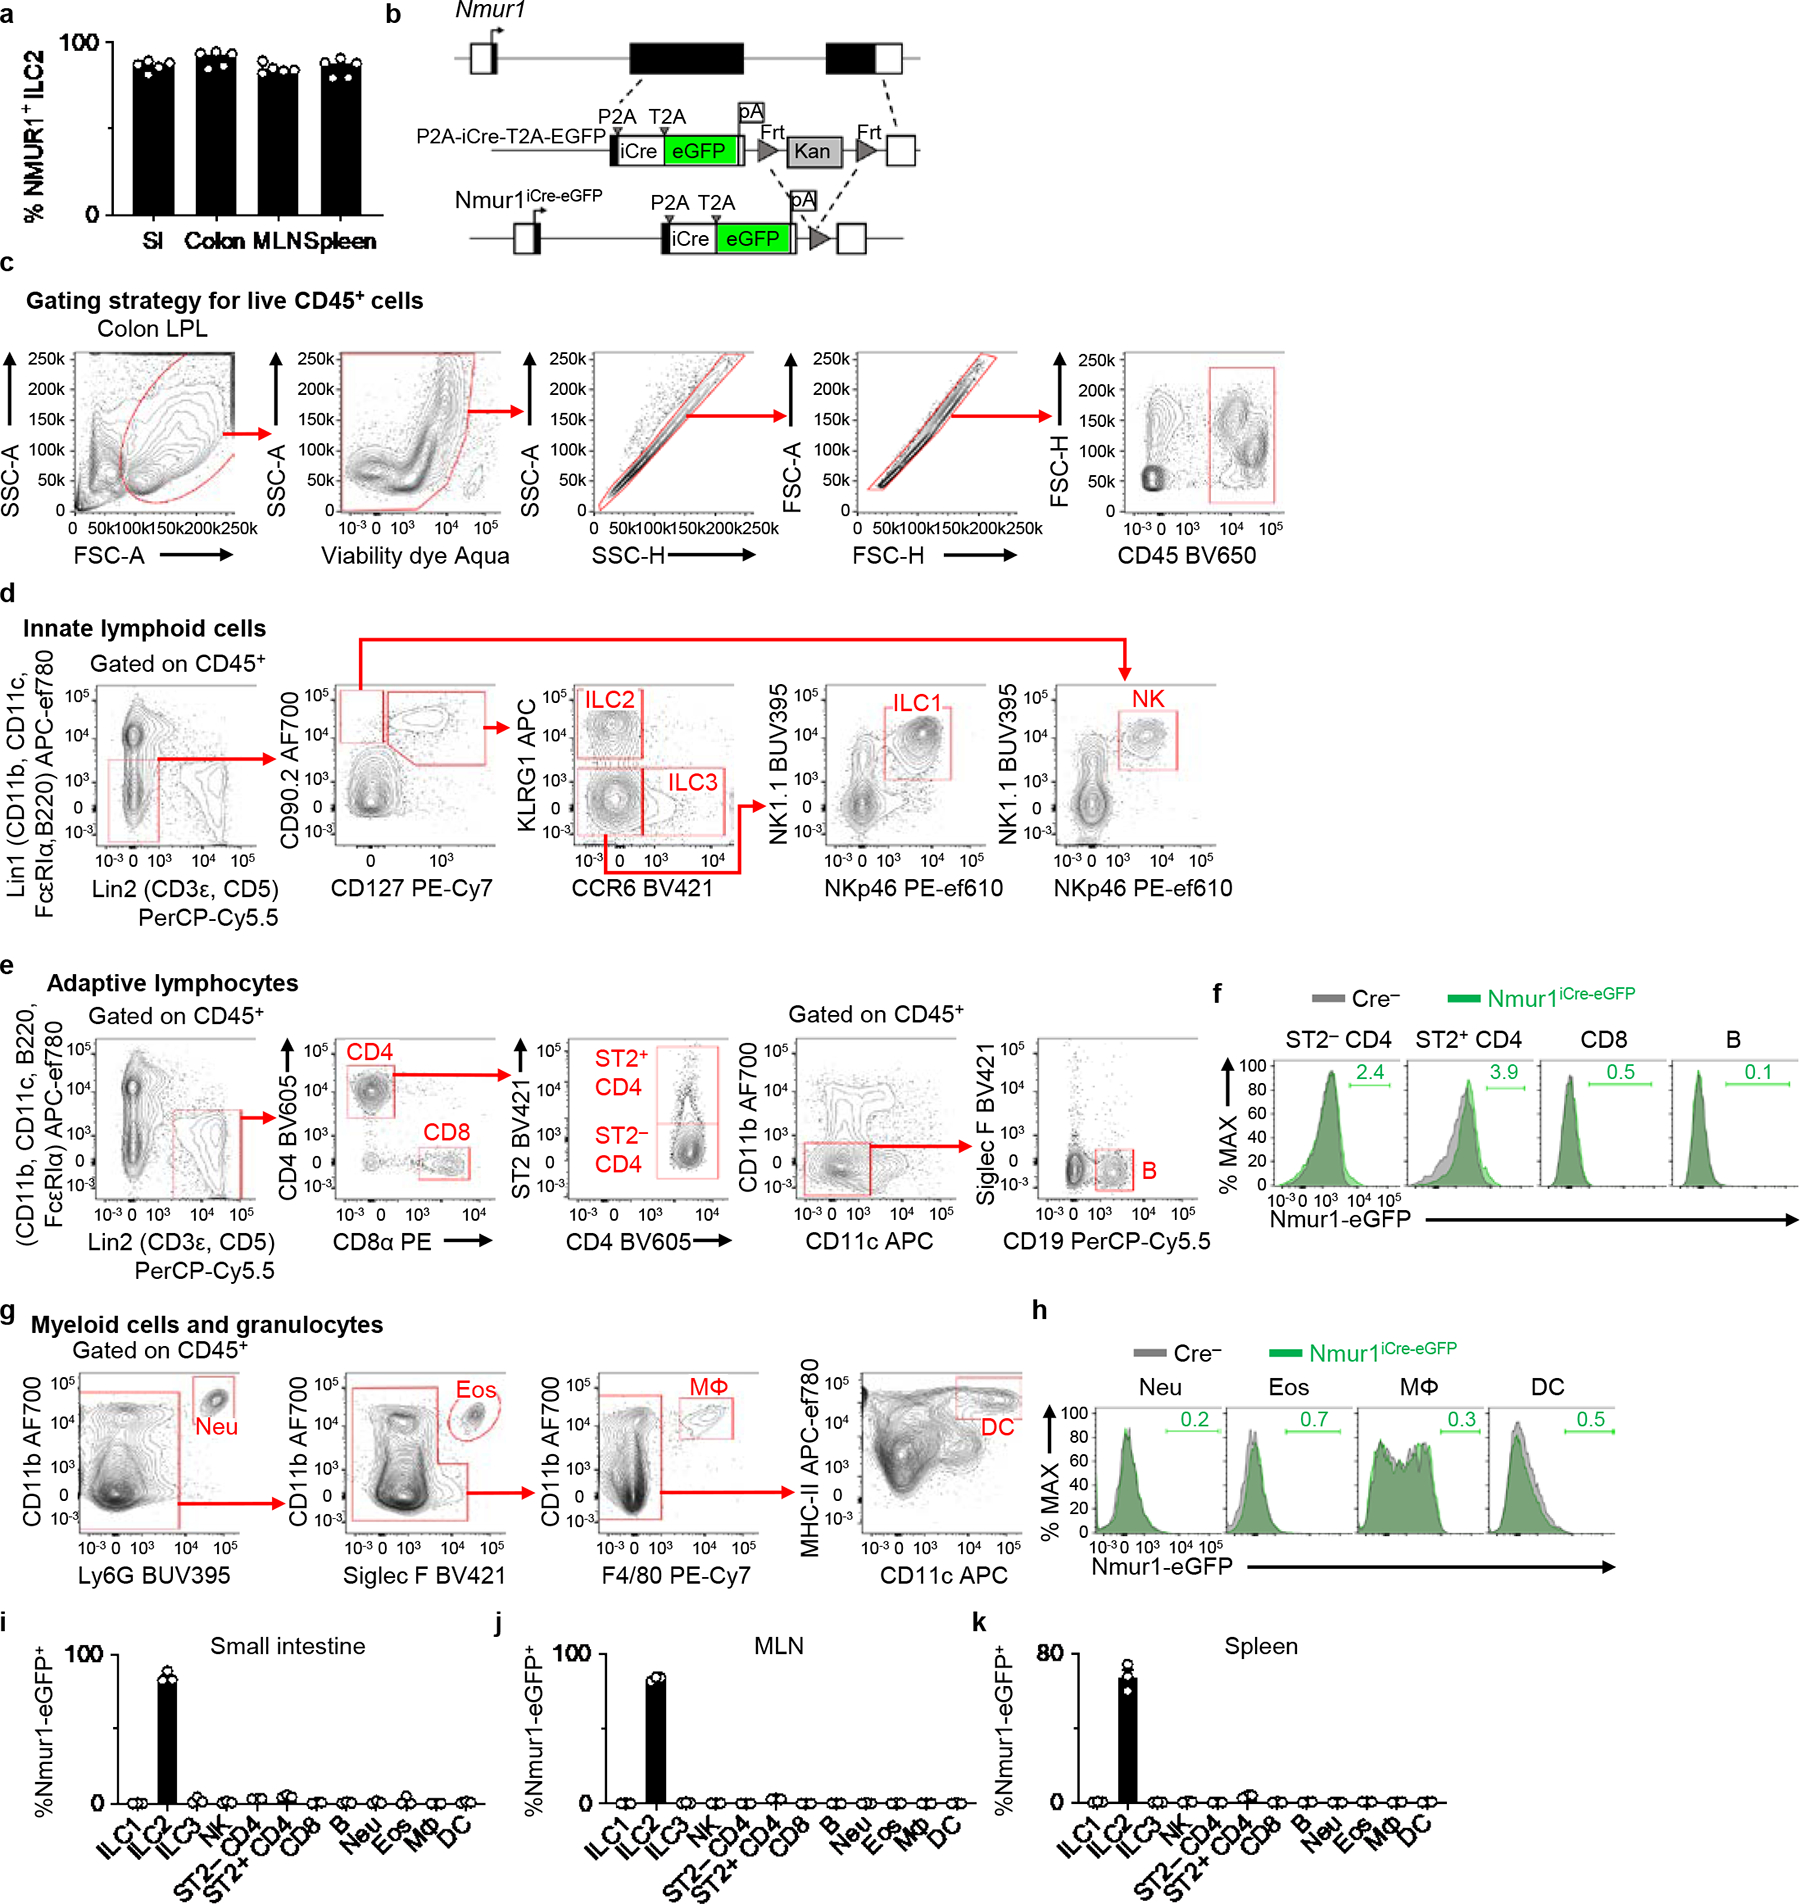
a, Percentages of surface NMUR1+ ILC2s isolated from the indicated tissues from Nmur1+/+ WT mice (n=5 mice). b, Schematic of targeting construct for generating Nmur1iCre-eGFP mice. c-k, Comprehensive analysis of Nmur1-eGFP expression in Nmur1iCre-eGFP mice. Representative gating strategy for live CD45+ cells (c), innate lymphoid cell (ILC) subsets (d), adaptive lymphocytes (e), and myeloid cells and granulocytes (g). Representative overlaid histograms depicting Nmur1-eGFP expression in adaptive lymphocytes (f) and myeloid cells and granulocytes (h) from Nmur1iCre-eGFP mice and Cre-negative littermate controls. Percentages of Nmur1-eGFP+ cells within the indicated immune cell subsets isolated from small intestines (i), mesenteric lymph nodes (MLN) (j), and spleens (k) of Nmur1iCre-eGFP mice (n=3 mice). Data in a and i-k are representative of two independent experiments. Data are represented as means ± S.E.M.
Extended Data Figure 2 |. ILC2-enriched eGFP expression and iCre-mediated induction of R26-RFP expression.
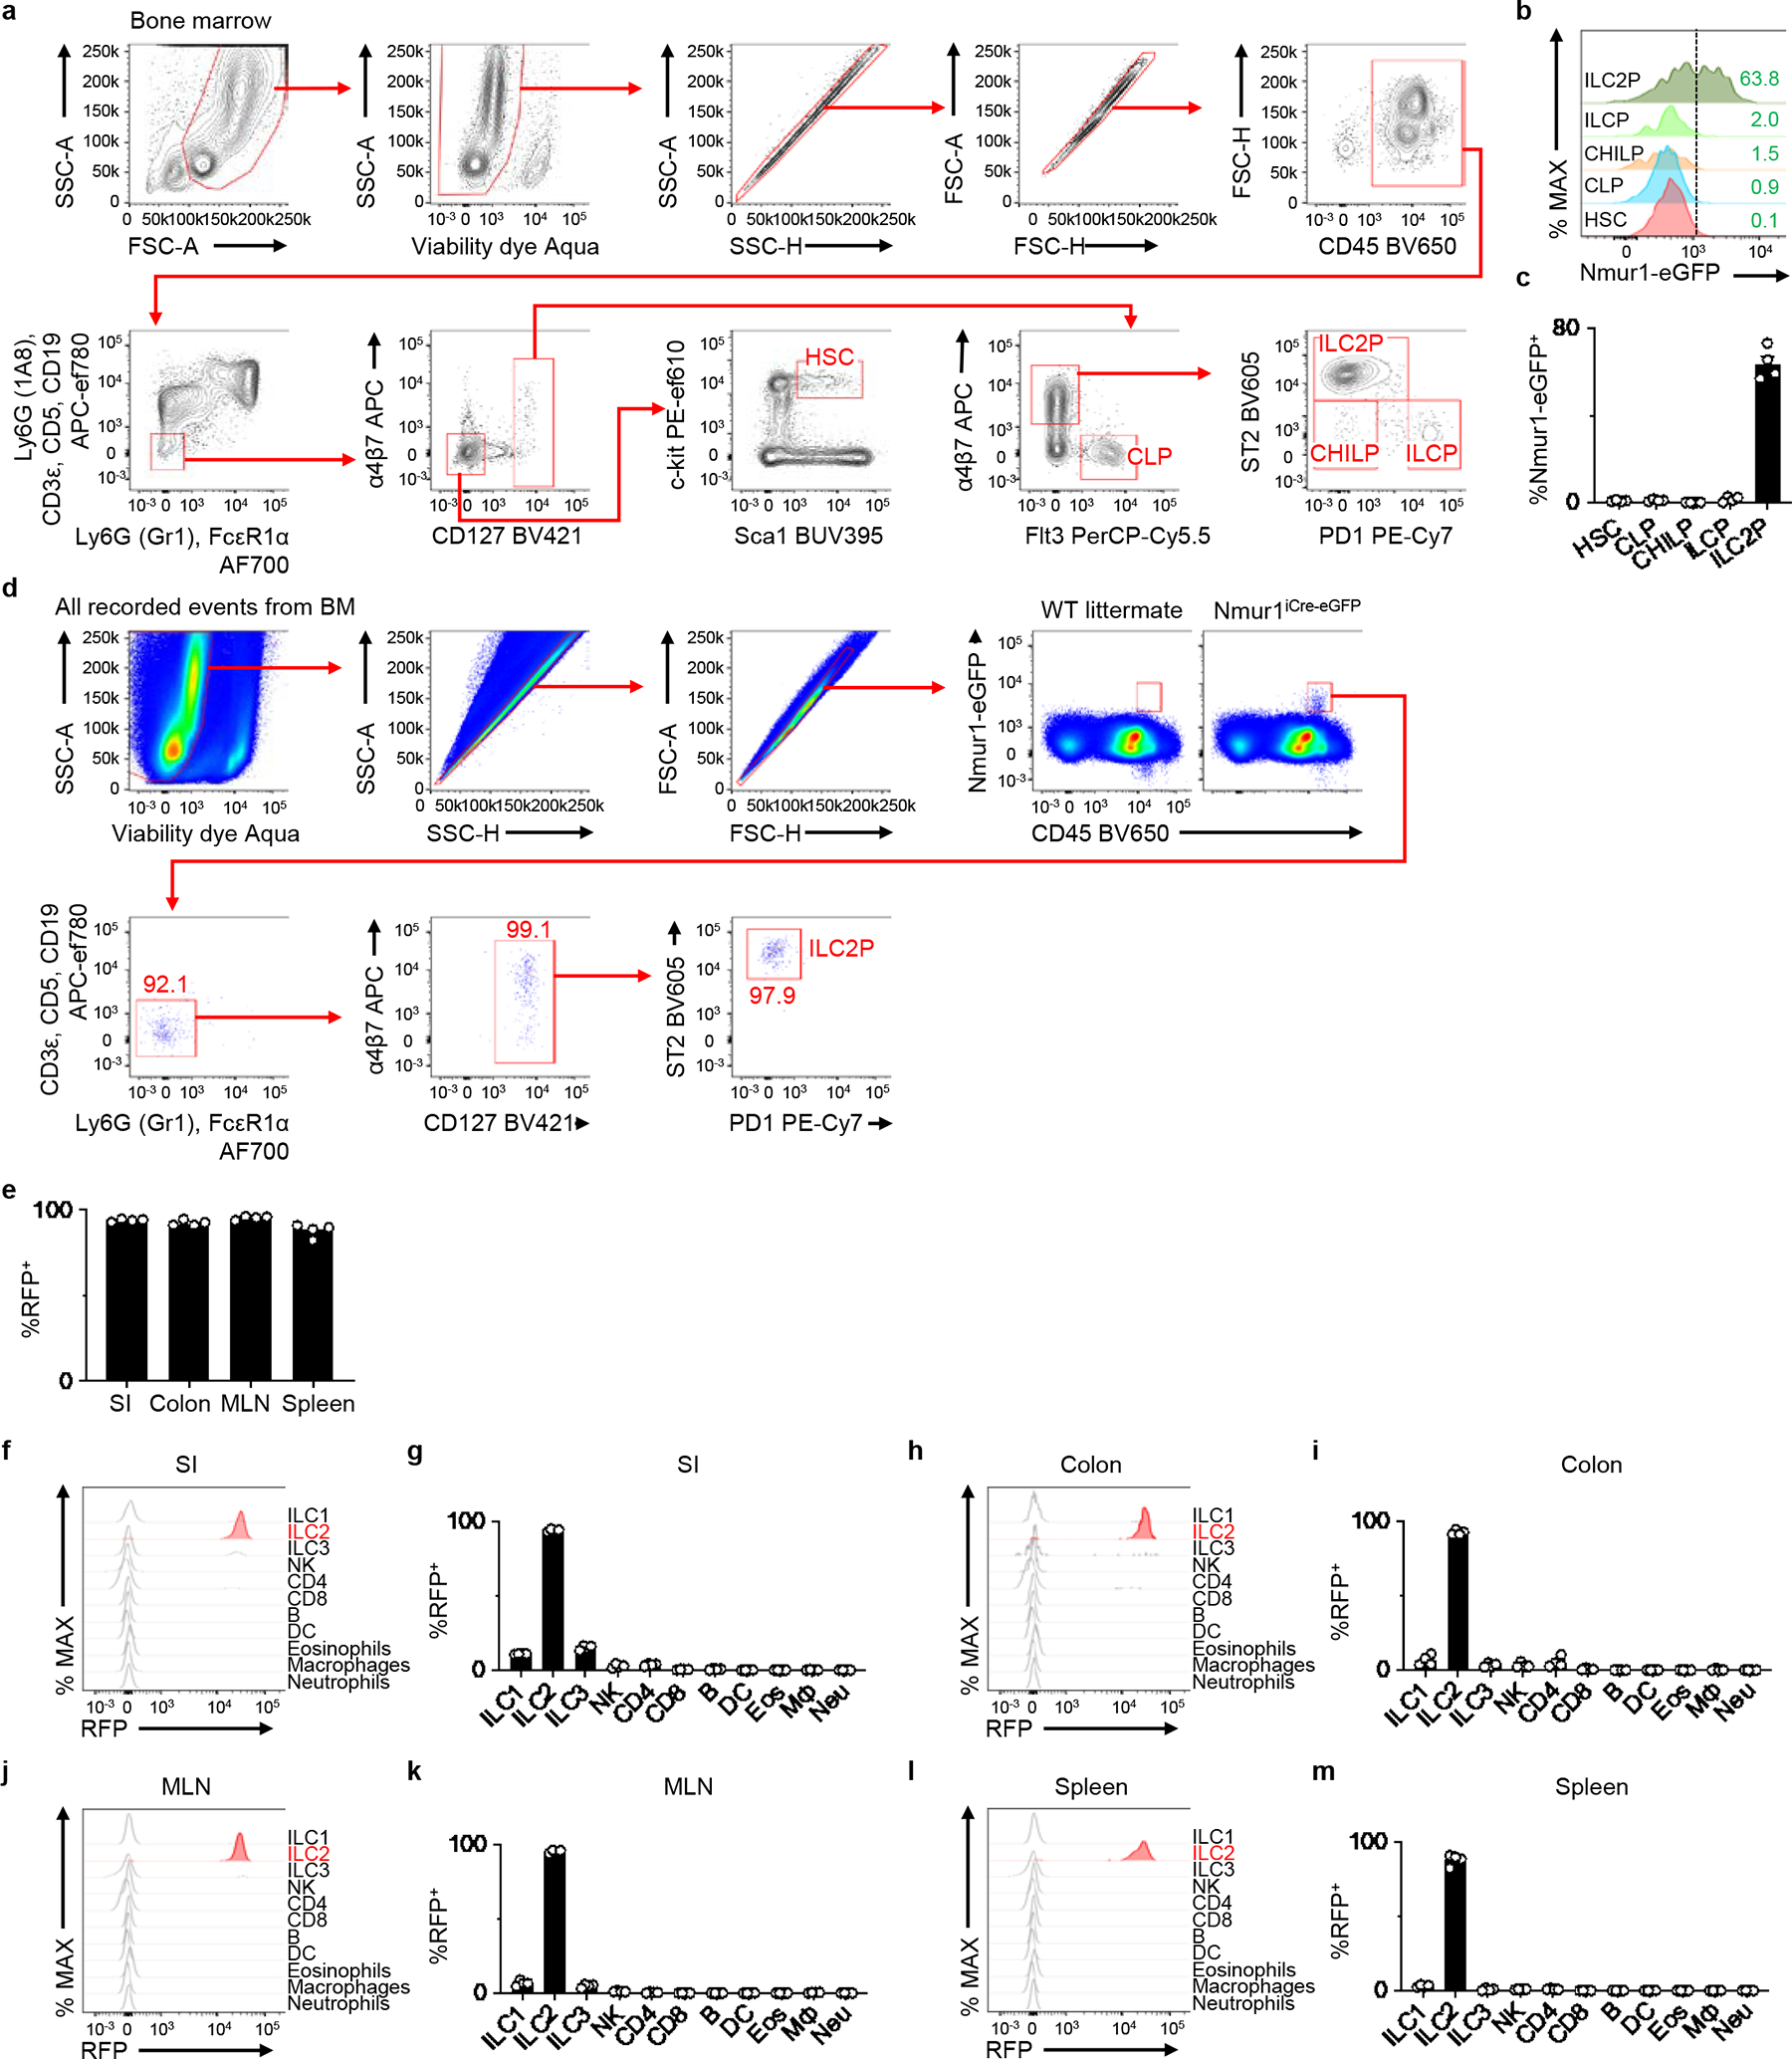
a, Representative gating strategy. b, Representative histograms depicting Nmur1-eGFP expression in the indicated progenitor immune cell subsets in the bone marrow. c, Percentages of Nmur1-eGFP+ cells within the indicated progenitor cells isolated from Nmur1iCre-eGFP mice (n=4 mice). d, Unbiased analysis of Nmur1-eGFP+ cells in the bone marrow by flow cytometry, depicting a representative of two independent experiments. e, Percentages of RFP+ ILC2s in indicated tissues from R26-RFPNmur1 mice (n=4 mice). f-m, Representative histograms showing iCre (RFP) expression in the indicated immune cell subsets isolated from the SI (f), colon (h), MLN (j), and spleen (l) of R26-RFPNmur1 mice (n=4 mice). Percentage of iCre (RFP)+ cells within the indicated immune cell subsets isolated from the SI (g), colon (i), MLN (k), and spleen (m). Data in c, e, g, i, k, m are pooled from of 2 independent experiments. Data are represented as means ± S.E.M. SI - small intestine, MLN - mesenteric lymph node, Neu – neutrophils, Eos – eosinophils, MΦ- macrophages, DC – dendritic cells.
Extended Data Figure 3 |. Comparison of efficiency of ILC2-depletion and its impact on other immune cells in R26-DTRNmur1 and R26-DTRRed5 mice.
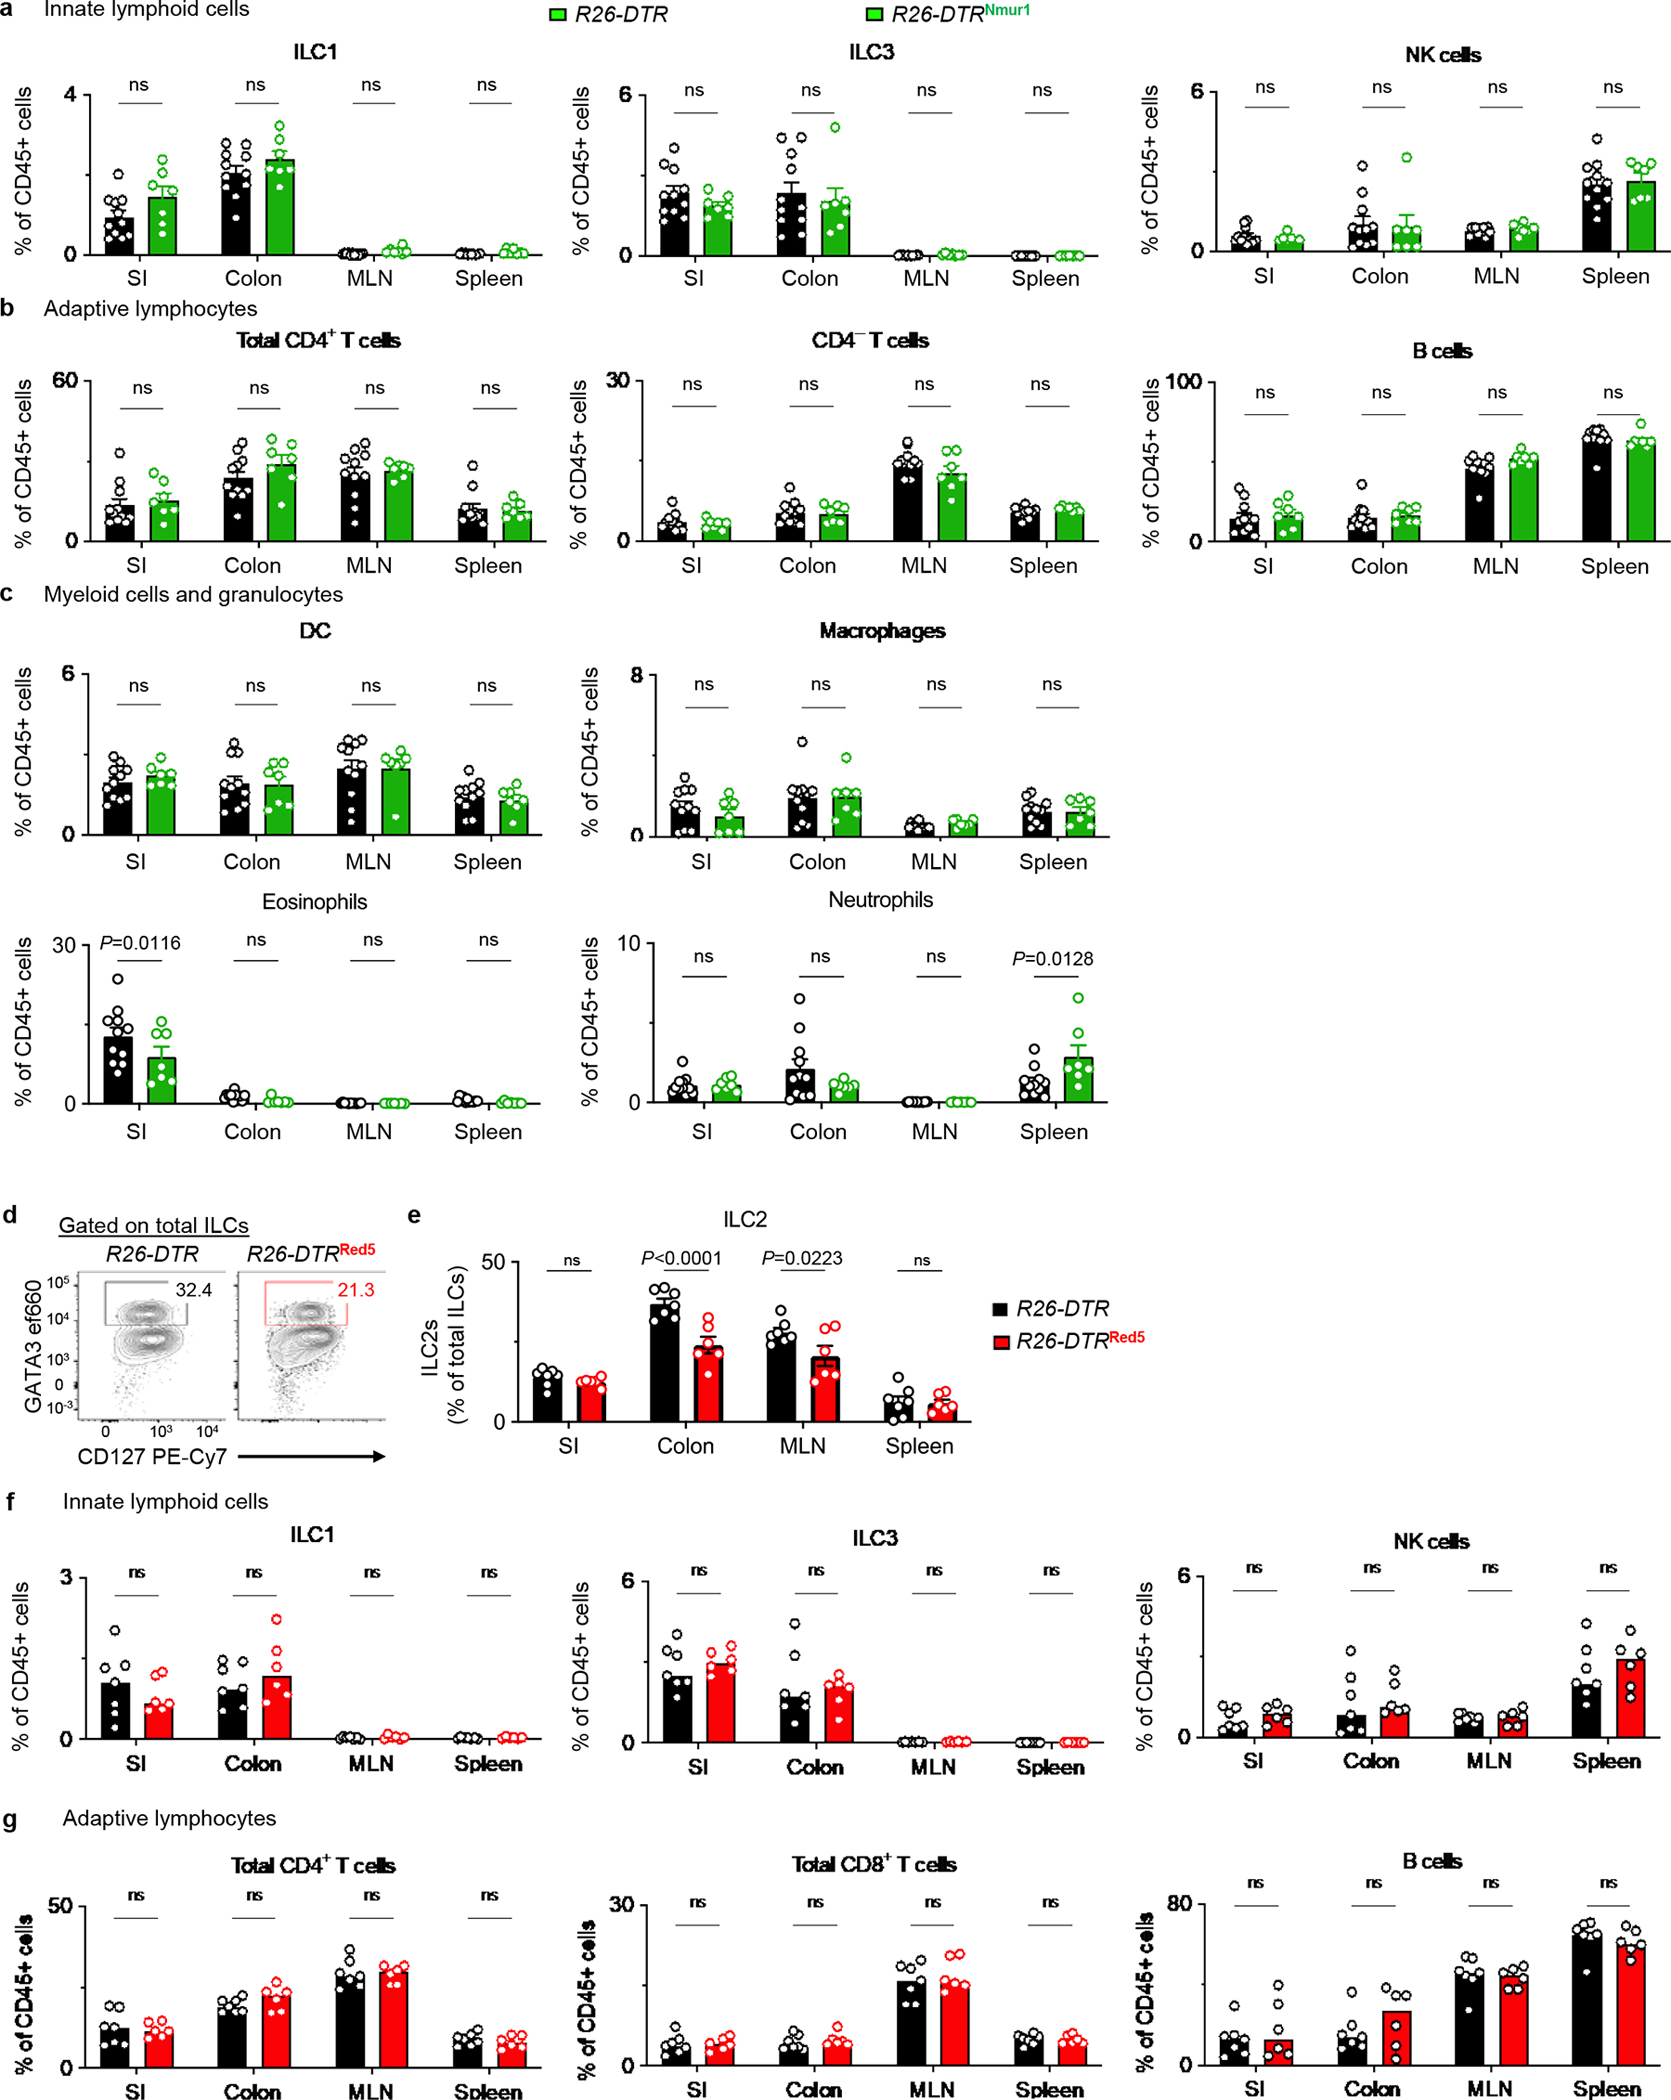
a-c, R26-DTR (n=11 mice) and R26-DTRNmur1 (n=7 mice) were treated with 2 daily injections of DT. The small intestine (SI), colon, mesenteric lymph nodes (MLN), and spleen were harvested for analysis after resting the mice for 2 days. Abundances of non-ILC2 innate lymphoid cell subsets (a), adaptive lymphocytes (b) or myeloid cells and granulocytes (c) within the indicated tissues. d-g, R26-DTR (n=7 mice) and R26-DTRRed5 (n=6 mice) were treated with 2 daily injections of DT and rested for 2 days. Representative flow cytometry analysis of ILC2s in the colon, pre-gated on total ILCs (d) (Total ILCs gated as live CD45+Lin−CD90+CD127+ events. Lin: CD3ε, CD5, CD11b, CD11c, FcεRI, B220). Percentages of ILC2s out of total ILCs in the SI, colon, MLN, and spleen (e). Abundances of innate lymphoid cell subsets (f), adaptive lymphocytes (g). Data in a-c and e-g are pooled from two independent experiments. Two-way ANOVA with Šídák multiple comparisons test (a-c, e-g). P values are presented where appropriate. ns, not significant. Data are represented as means ± S.E.M.
Extended Data Figure 4 |. Nmur1iCre-eGFP-mediated AREG deletion does not impact AREG production in CD4+ T cells or intrinsic ILC2 homeostasis.
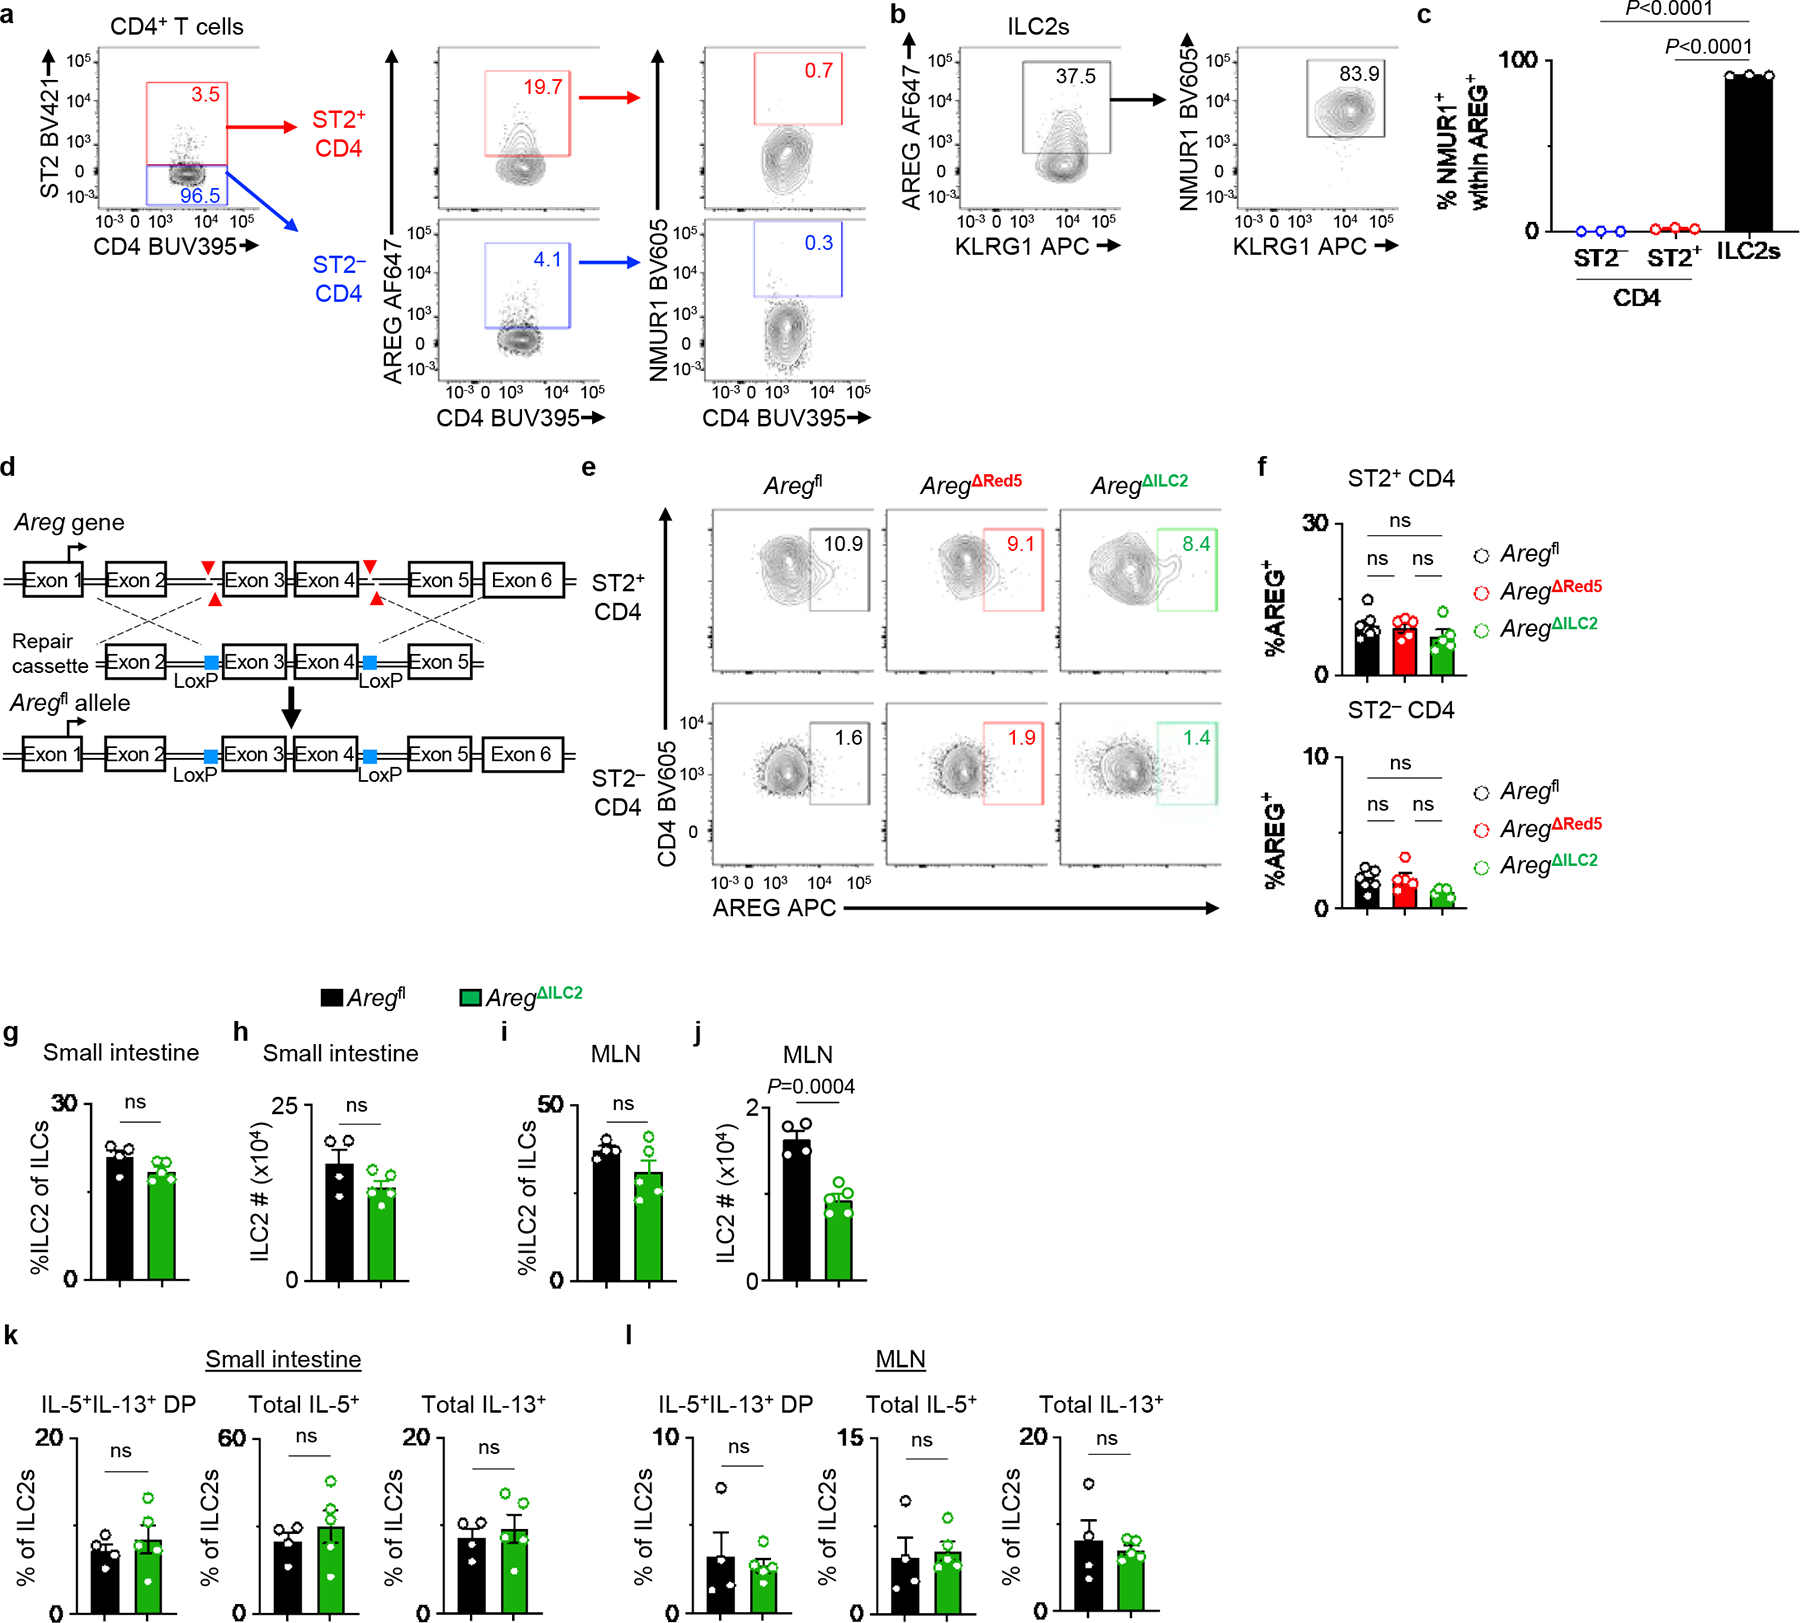
a-c, Representative flow cytometry analysis of AREG and NMUR1 co-expression within ST2− and ST2+ CD4+ T cells (a) and ILC2s (b) at steady state in the MLN of WT mice. Percentages of NMUR1+ cells within AREG-producing cells isolated from WT mice (n=3 mice) (c). d, Schematic of Aregfl mouse generation using CRISPR/Cas9n. e, f, Representative flow cytometry analysis of ST2− and ST2+ CD4+ T cells (e) and percentages of AREG-producing cells (f) in the MLN of Aregfl (n=7 mice), AregΔRed5 (n=5 mice), and AregΔILC2 (n=5 mice). g-l, Small intestine and MLN from Aregfl (n=4 mice) and AregΔILC2 (n=5 mice) were analyzed at steady state for ILC2 abundance and their cytokine production capacity. Percentages of ILC2s within total ILCs in the small intestine (g) and MLN (i). Absolute cell numbers of ILC2s in the small intestine (h) and MLN (j). Percentages of IL-5+IL-13+ DP, total IL-5+ and total IL-13+ ILC2s isolated from the small intestine (k) and MLN (l). Data in c, f, g-l are representative of two independent experiments. One-way ANOVA with Tukey multiple comparisons test (c, f). Unpaired two-sided t-test (g-l). P values are presented where appropriate. ns, not significant. Data are represented as means ± S.E.M. MLN – mesenteric lymph node. DP – double positive.
Extended Data Figure 5 |. Deletion of ILC2-derived AREG does not impact the priming of adaptive immune responses.
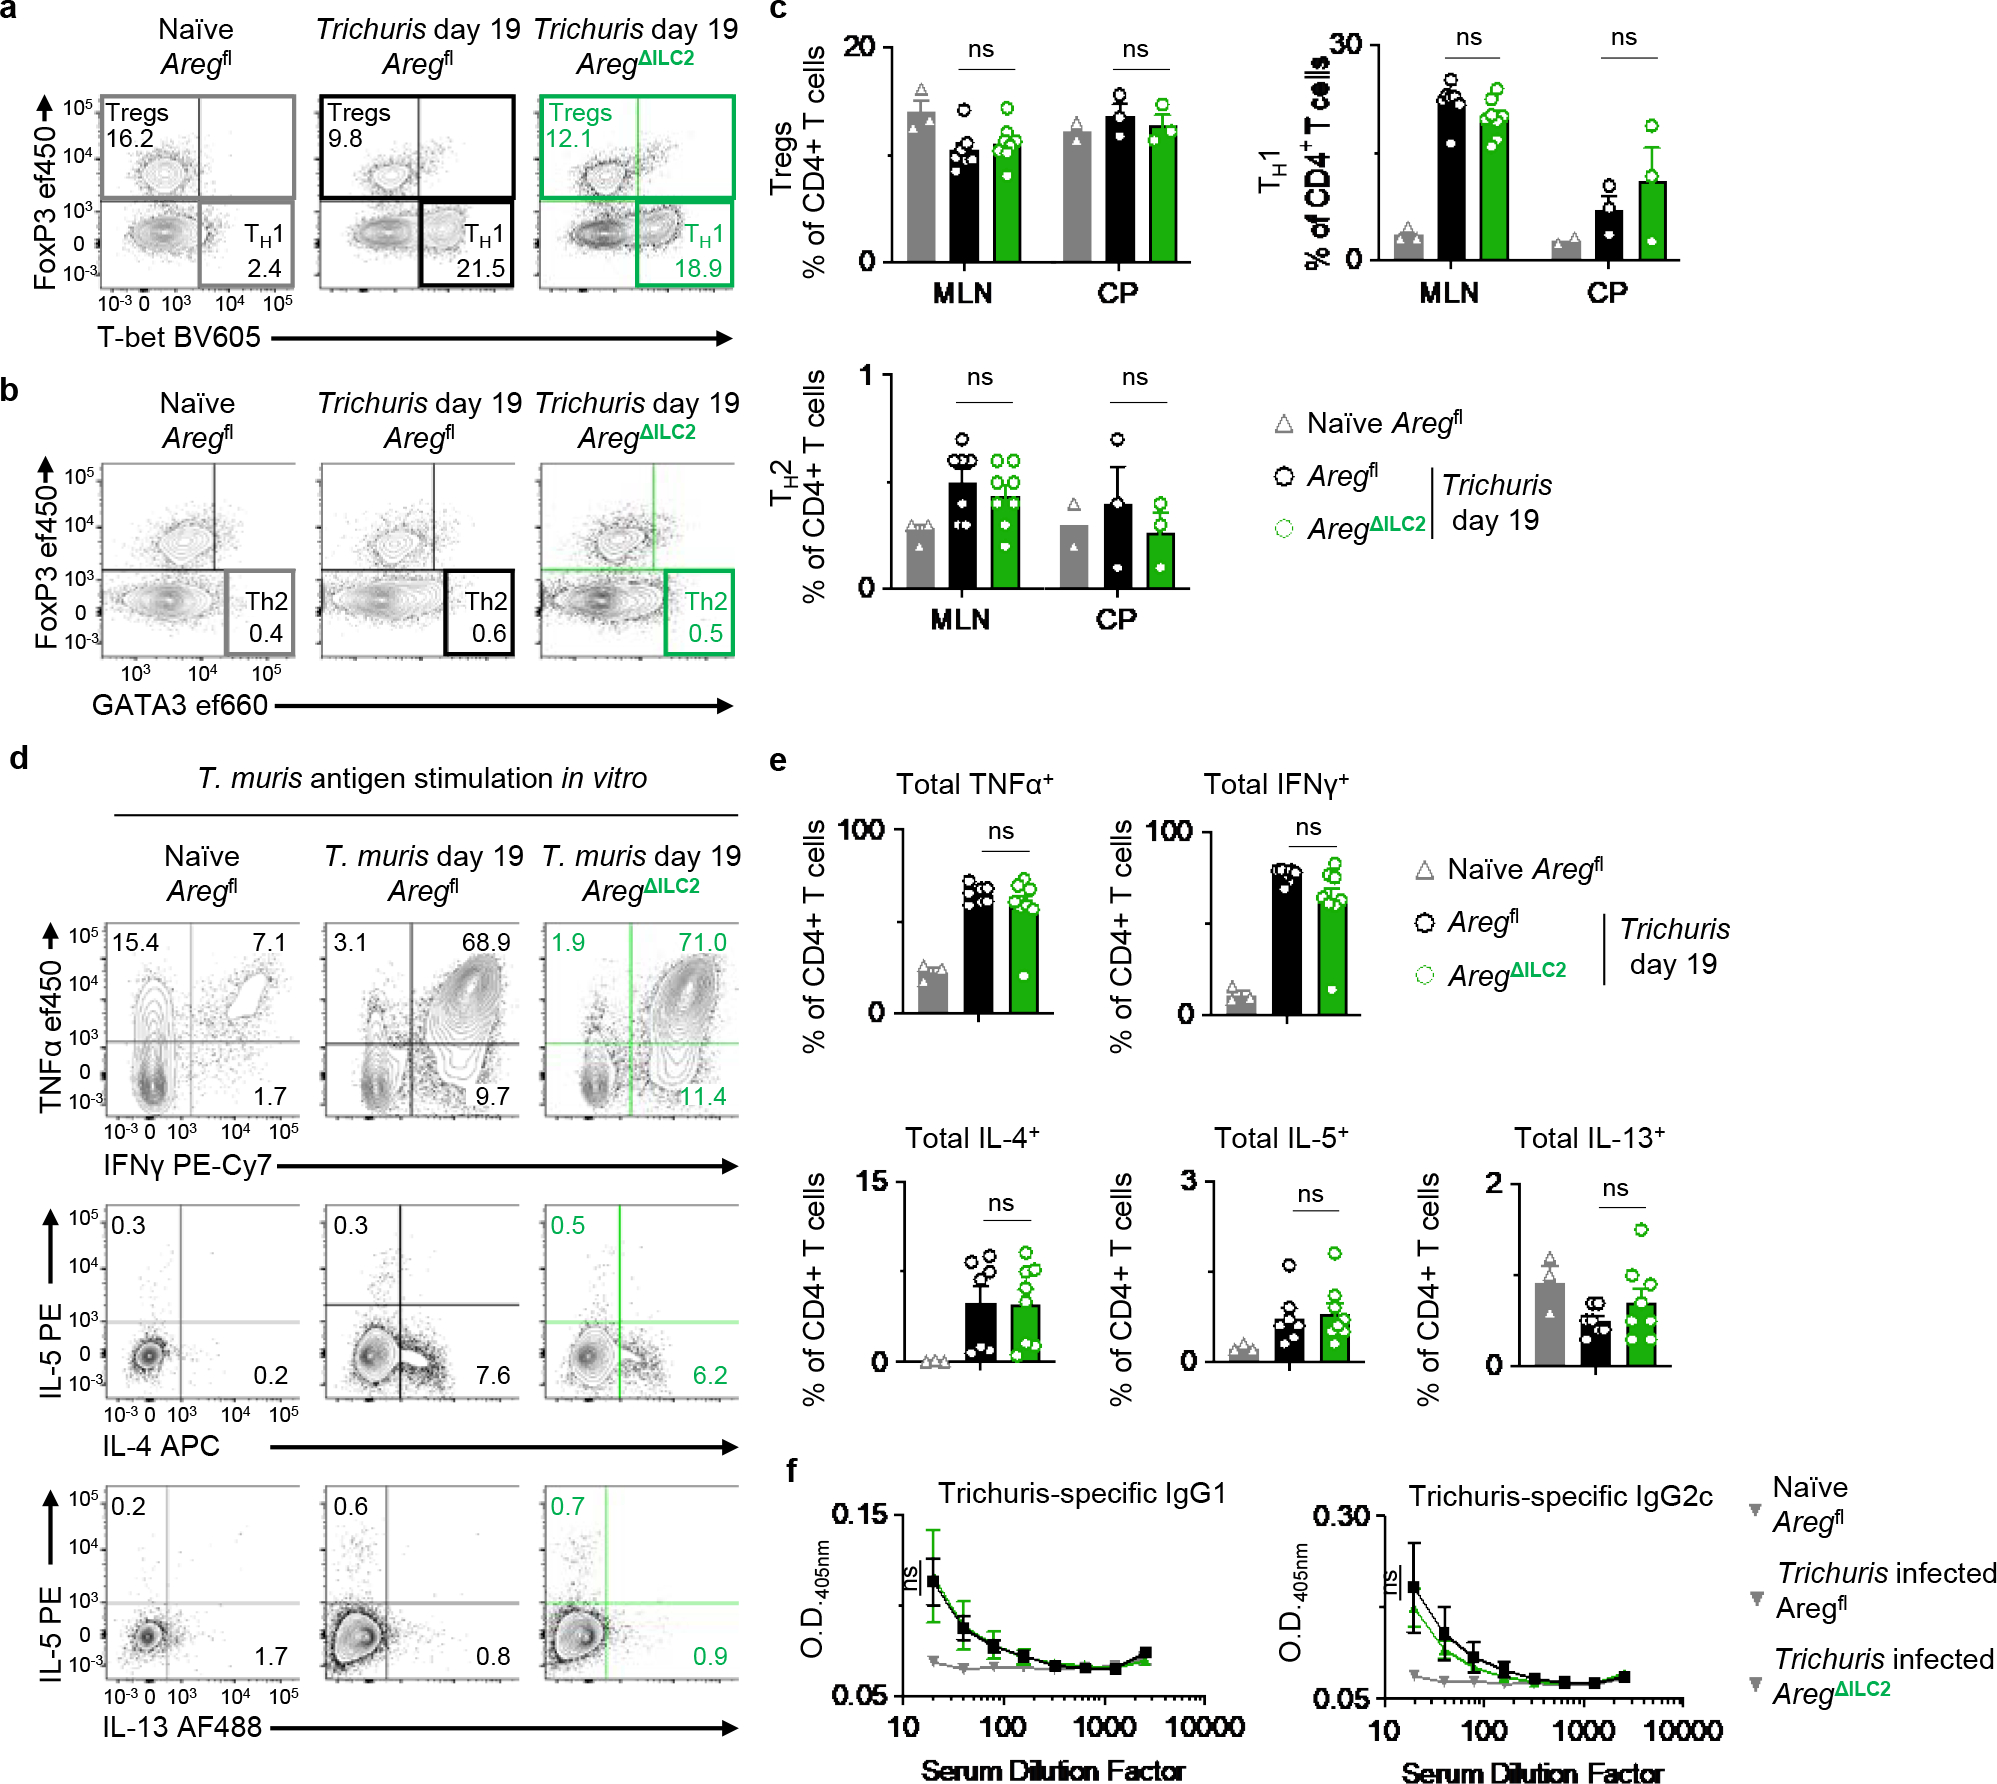
a-e, Analysis of MLN isolated from naïve Aregfl (n=3 mice) and Trichuris-infected Aregfl (n=7 mice) and AregΔILC2 (n=8 mice) at day 19 post-infection. Cecal patches (CP) were pooled as one sample when necessary due to cell yield for flow cytometry analysis (Aregfl (n=2 pooled CP) and Trichuris-infected Aregfl (n=3 pooled CP) and AregΔILC2 (n=3 pooled CP)). Representative flow cytometry analysis of CD4+ T cell subsets (a, b) and percentages of Foxp3+ Tregs, T-bet+ Th1 and GATA3+ Th2 CD4+ T cells (c). Representative flow cytometry analysis of pathogen-specific cytokine production in MLN CD4+ T cells after stimulation with Trichuris antigen for 3 days ex vivo (d). Percentage of CD4+ T cells producing TNFα, IFNγ, IL-4, IL-5, and IL-13 (e). f, Detection of Trichuris antigen-specific IgG1 and IgG2c in serum from naïve Aregfl (n=4 mice) and Trichuris-infected Aregfl (n=12 mice) and AregΔILC2 (n=13 mice) at day 19 post-infection by serial dilution ELISA. Data in c and e are pooled from two independent experiments. Data in f are pooled from three independent experiments. One-way ANOVA with Tukey multiple comparisons test (c, e). Two-way ANOVA with Šídák multiple comparisons test (f). ns, not significant. Data are represented as means ± S.E.M.
Extended Data Figure 6 |. Bone marrow chimera mice recapitulated the phenotype of AregΔILC2 mice during Trichuris muris infection.
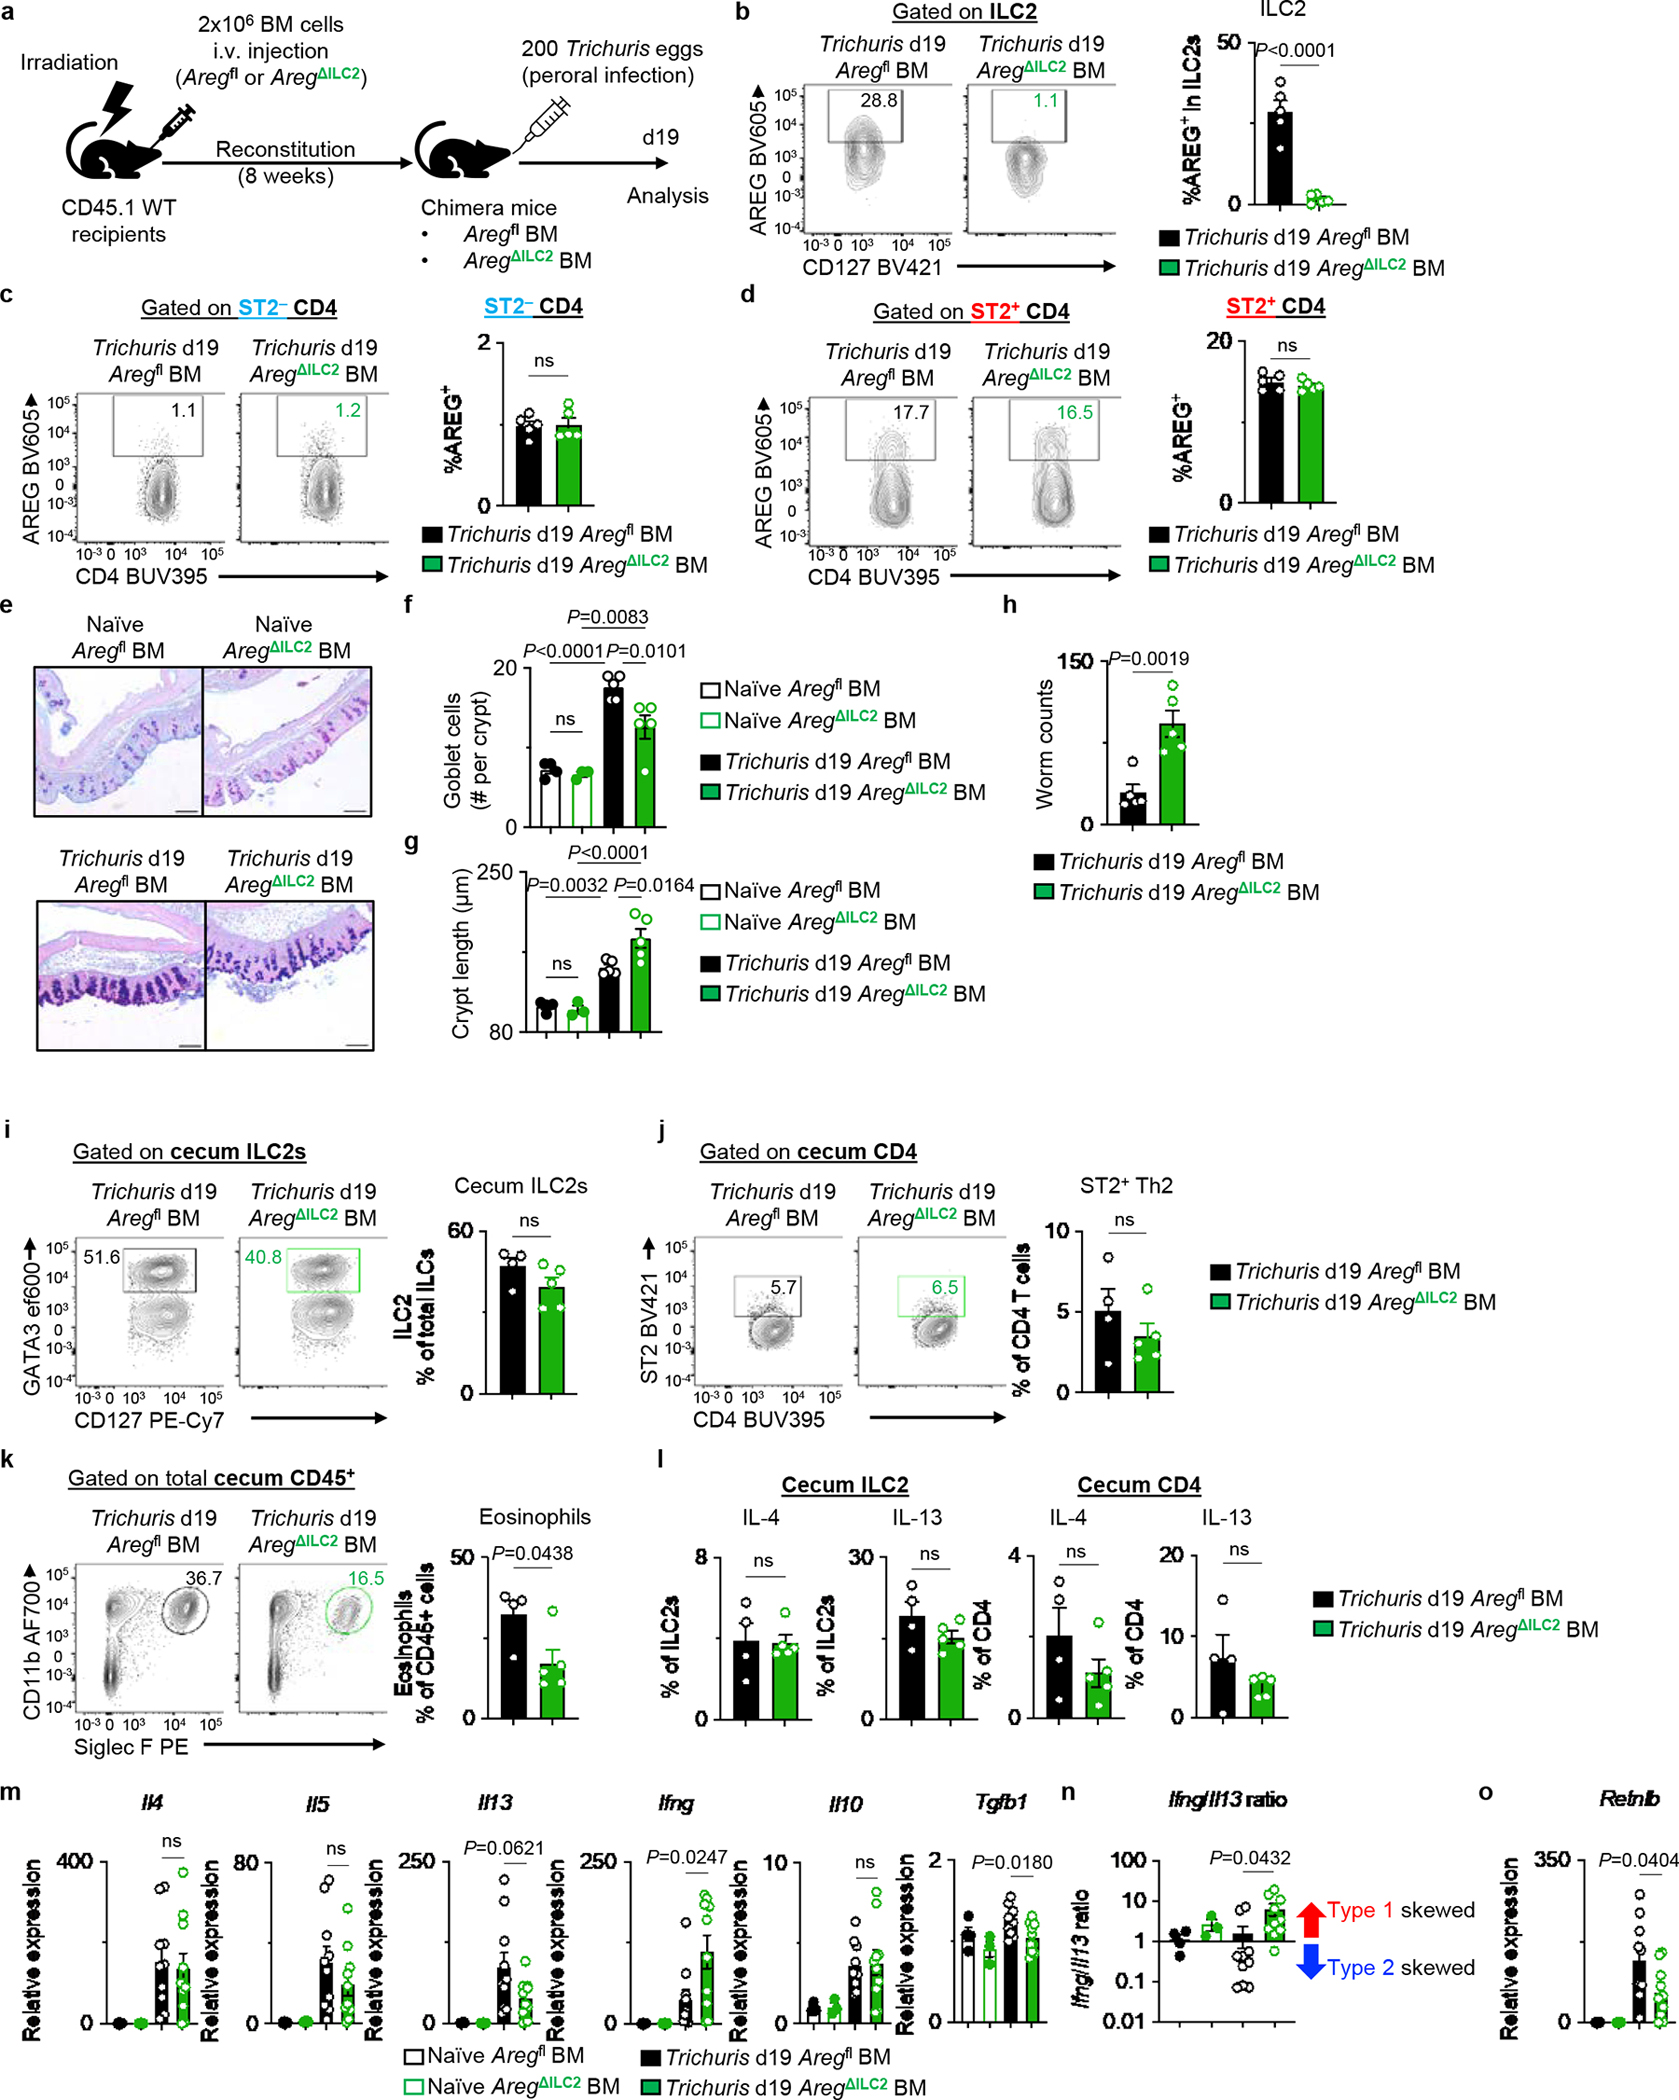
Irradiated CD45.1 WT mice received BM from Aregfl or AregΔILC2 donor mice. After 8 weeks, chimera mice were infected with 200 Trichuris eggs by oral gavage and analyzed 19 days post-infection. a, Experimental schematic. b-d, AREG deletion in ILC2 (b), ST2− CD4+ T cells (c), and ST2+ CD4+ T cells (d) in Trichuris-infected Aregfl BM (n=5 mice) and AregΔILC2 BM (n=5 mice). e-g, Representative AB-PAS-stained images of cecal tips (bars=100 μm) (e). Enumeration of cecal tip goblet cells (f) and crypt length (g) of naïve Aregfl BM (n=4 mice) or AregΔILC2 BM (n=3 mice) and Trichuris-infected Aregfl BM (n=5 mice) or AregΔILC2 BM (n=5 mice). h, Worm burden in Aregfl BM (n=5 mice) or AregΔILC2 BM (n=5 mice). i-l, Intestinal immune responses in cecum of Trichuris-infected Aregfl BM (n=4 mice) and AregΔILC2 BM (n=5 mice). Frequencies of ILC2s (i), ST2+ Th2 cells (j), and eosinophils (k), and percentages of IL-4+ and IL-13+ cecal ILC2s and CD4+ T cells (l). m-o, Gene expression analysis of proximal colons isolated from naïve Aregfl BM (n=4 mice) and AregΔILC2 BM (n=3 mice) and Trichuris-infected Aregfl BM (n=10 mice) and AregΔILC2 BM (n=10 mice). Normalized to Actb. Relative expression levels of pro-inflammatory genes (Il4, Il5, Il13, Ifng) and immunoregulatory responses (Il10 and Tgfb1) (m). Ratio of type 1 gene (Ifng) over type 2 gene (Il13) (n). Expression levels of goblet cell functional marker gene Retnlb (o). Data in b-d, f-h, i-l are representative of two independent experiments. Data in m-o are pooled from two independent experiments. Unpaired two-sided t-test (b-d, h-l). One-way ANOVA with Tukey multiple comparisons test (f, g, m-o). P values are presented where appropriate. ns, not significant. Data are represented as means ± S.E.M.
Extended Data Figure 7 |. Specific and efficient deletion of Areg within T cells in AregΔCD4 mice.
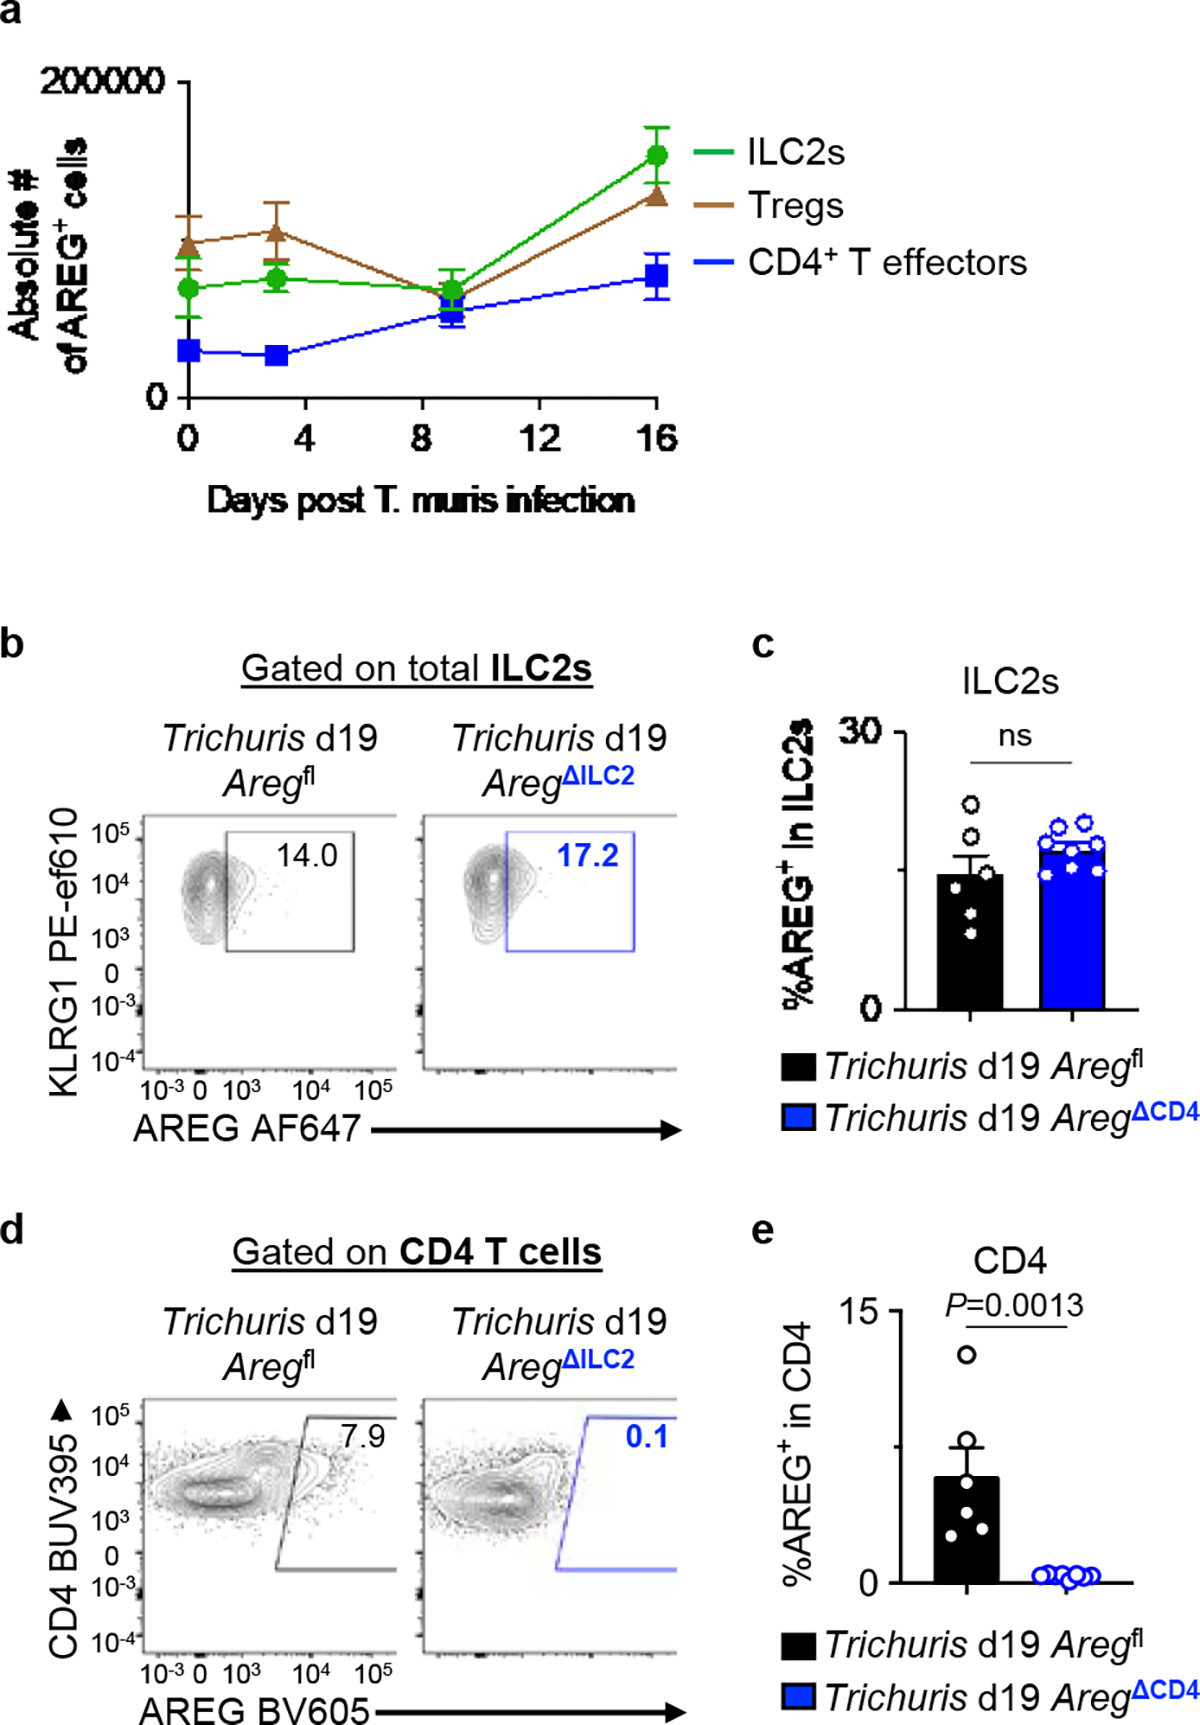
a, WT mice were infected with 200 Trichuris eggs by oral gavage, and the cecum was analyzed by flow cytometry for AREG+ cells among ILC2s, Foxp3+ Tregs and Foxp3− CD4+ T effectors at day 0 (n=6 mice), day 3 (n=9 mice), day 9 (n=5 mice), and day 16 (n=4 mice) post-infection. b-e, Aregfl (n=6 mice) and AregΔCD4 (n=8 mice) were infected with 200 Trichuris eggs by oral gavage and analyzed 19 days post-infection. Representative flow cytometry analysis of ILC2s (b) and CD4+ T cells (d) for AREG+ cells. Percentage of AREG-producing cells within ILC2s (c) and CD4+ T cells (e). Data in a are pooled from two independent experiments. Data in c and e are representative of two independent experiments. Unpaired two-sided t-test (c, e). P values are presented where appropriate. ns, not significant. Data are represented as means ± S.E.M.
Extended Data Figure 8 |. Bone marrow chimera mice recapitulated the phenotype of AregΔILC2 mice in the context of DSS-induced intestinal damage and inflammation.
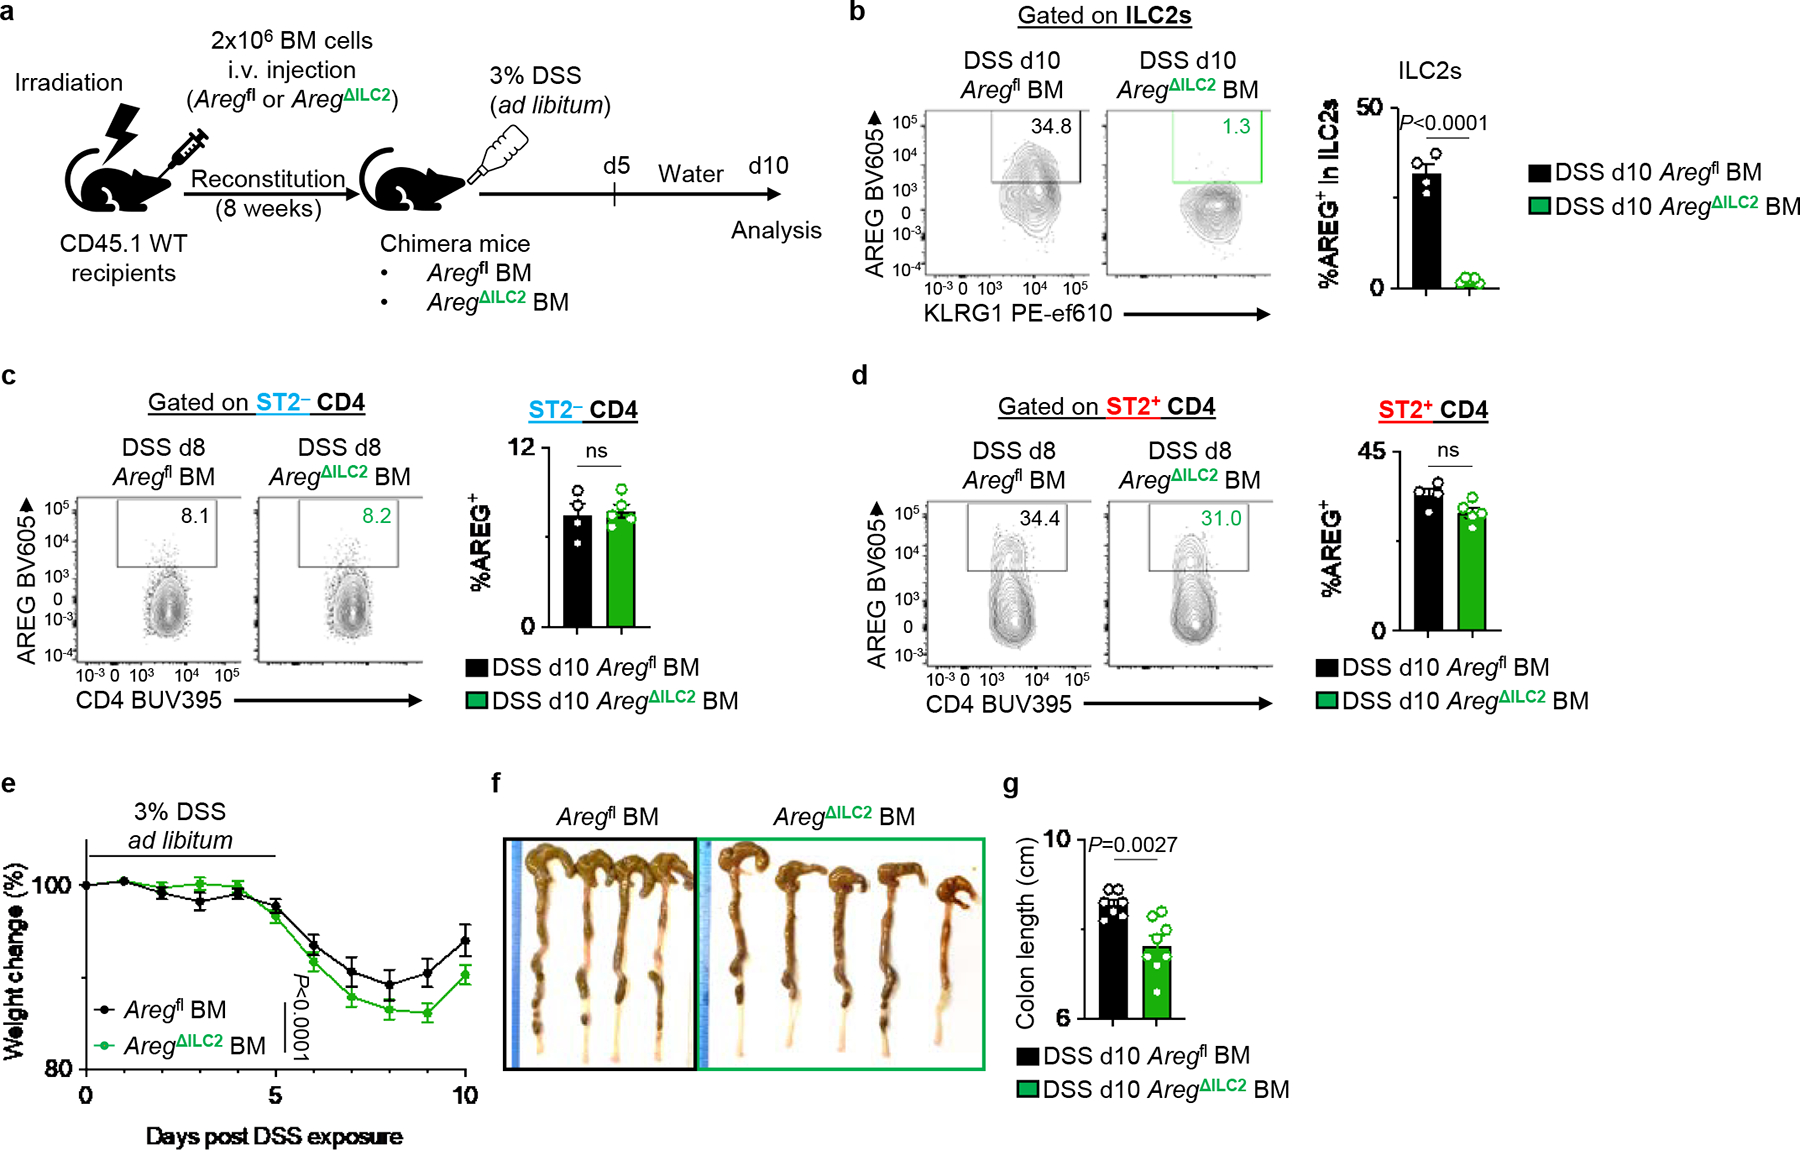
Irradiated CD45.1 WT mice received BM from Aregfl or AregΔILC2 donor mice. After 8 weeks, chimera mice were exposed to 3% DSS for 5 days and then allowed to recover for 5 days on regular drinking water. a, Experimental schematic. b-d, Examination of AREG deletion in ILC2 (b), ST2− CD4+ T cells (c), and ST2+ CD4+ T cells (d) in DSS-exposed Aregfl BM (n=4 mice) and AregΔILC2 BM (n=5 mice) by flow cytometry. e-g, Disease severity of DSS-exposed Aregfl BM (n=7 mice) or AregΔILC2 BM (n=8 mice) as determined by weight loss (e) and colon length (f, g). Data in b-d are representative of three independent experiments. Data in e and g are pooled from 2 independent experiments. Unpaired two-sided t-test (b-d and g). Two-way ANOVA with Šídák multiple comparisons test (e). P values are presented where appropriate. ns, not significant. Data are represented as means ± S.E.M.
Extended Data Figure 9 |. Neuronal production of NMU is upregulated in the context of intestinal inflammation.
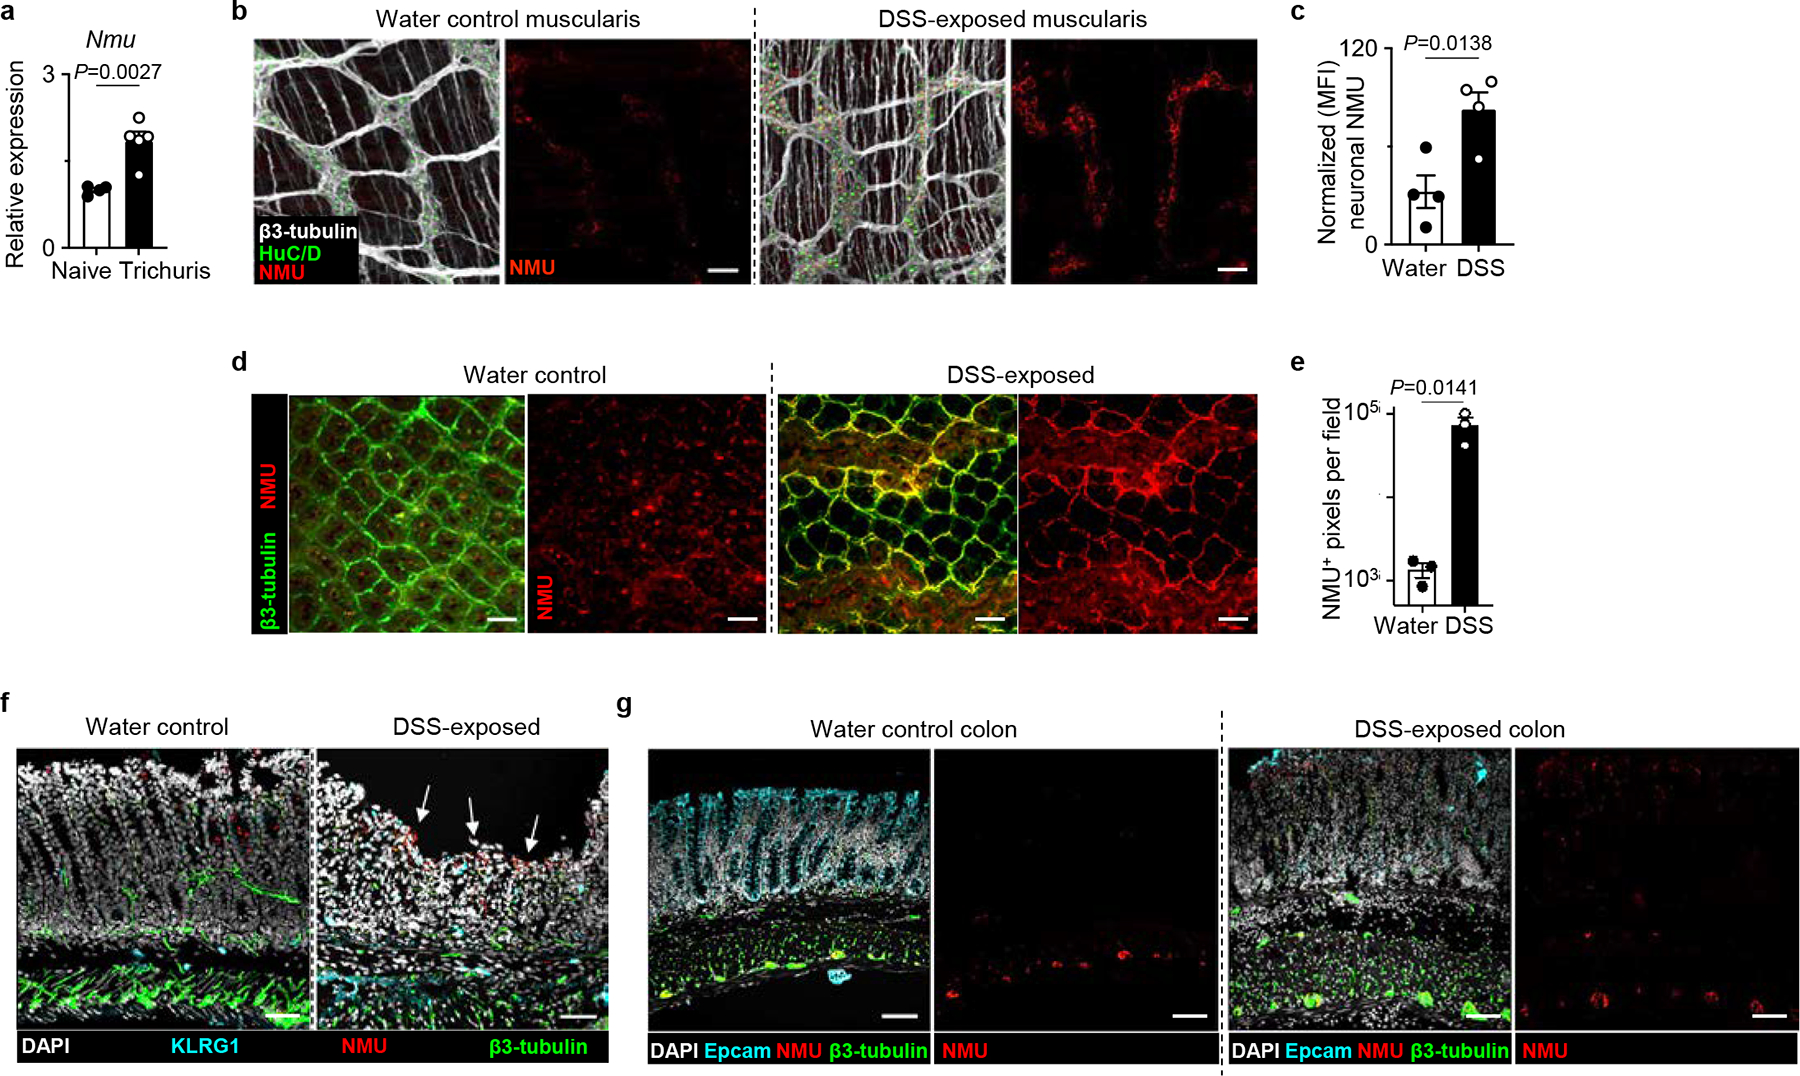
a, Nmu expression in the proximal colon of naïve (n=4 mice) or Trichuris-infected (n=5 mice) determined by qRT-PCR. Normalized to Actb housekeeping gene. b, c Muscularis propria of naïve water control (n=4 mice) or DSS-exposed inflamed colons (n=4) mice from WT mice were stained for β3-tubulin (white), HuC/D (green), and NMU protein (red). Representative images (bars=50 μm) (b). Neuronal NMU intensity was quantified by normalizing fluorescent intensity of NMU staining to the number of HuC/D+ nuclei in two fields per sample (c). d, e, CUBIC imaging of naïve water control (n=3 mice) or DSS-exposed (n=3 mice) colon from WT mice stained for β3-tubulin (green) and NMU protein (red). Representative images (bars=50 μm) (d) and quantification of NMU+ pixels (e). f, Representative images of swiss rolls of naïve water or DSS-exposed colons stained for DAPI (white), KLRG1 (cyan), NMU (red) and β3-tubulin (green) (bars=50 μm). Arrows depicting increased NMU staining in DSS-exposed colons. Images are representative of two independent experiments. g, Representative images of swiss rolls of naïve water or DSS-exposed condition colons stained for DAPI (white), Epcam (cyan), NMU (red) and β3-tubulin (green) (bars=50 μm). Images are representative of two independent experiments. Data in a and e are representative of two independent experiments. Data in c are pooled from two independent experiments. Unpaired two-sided t-test (a, c, e). P values are presented where appropriate. Data are represented as means ± S.E.M.
Extended Data Figure 10 |. NMU promotes AREG expression in ILC2s in both mice and humans.
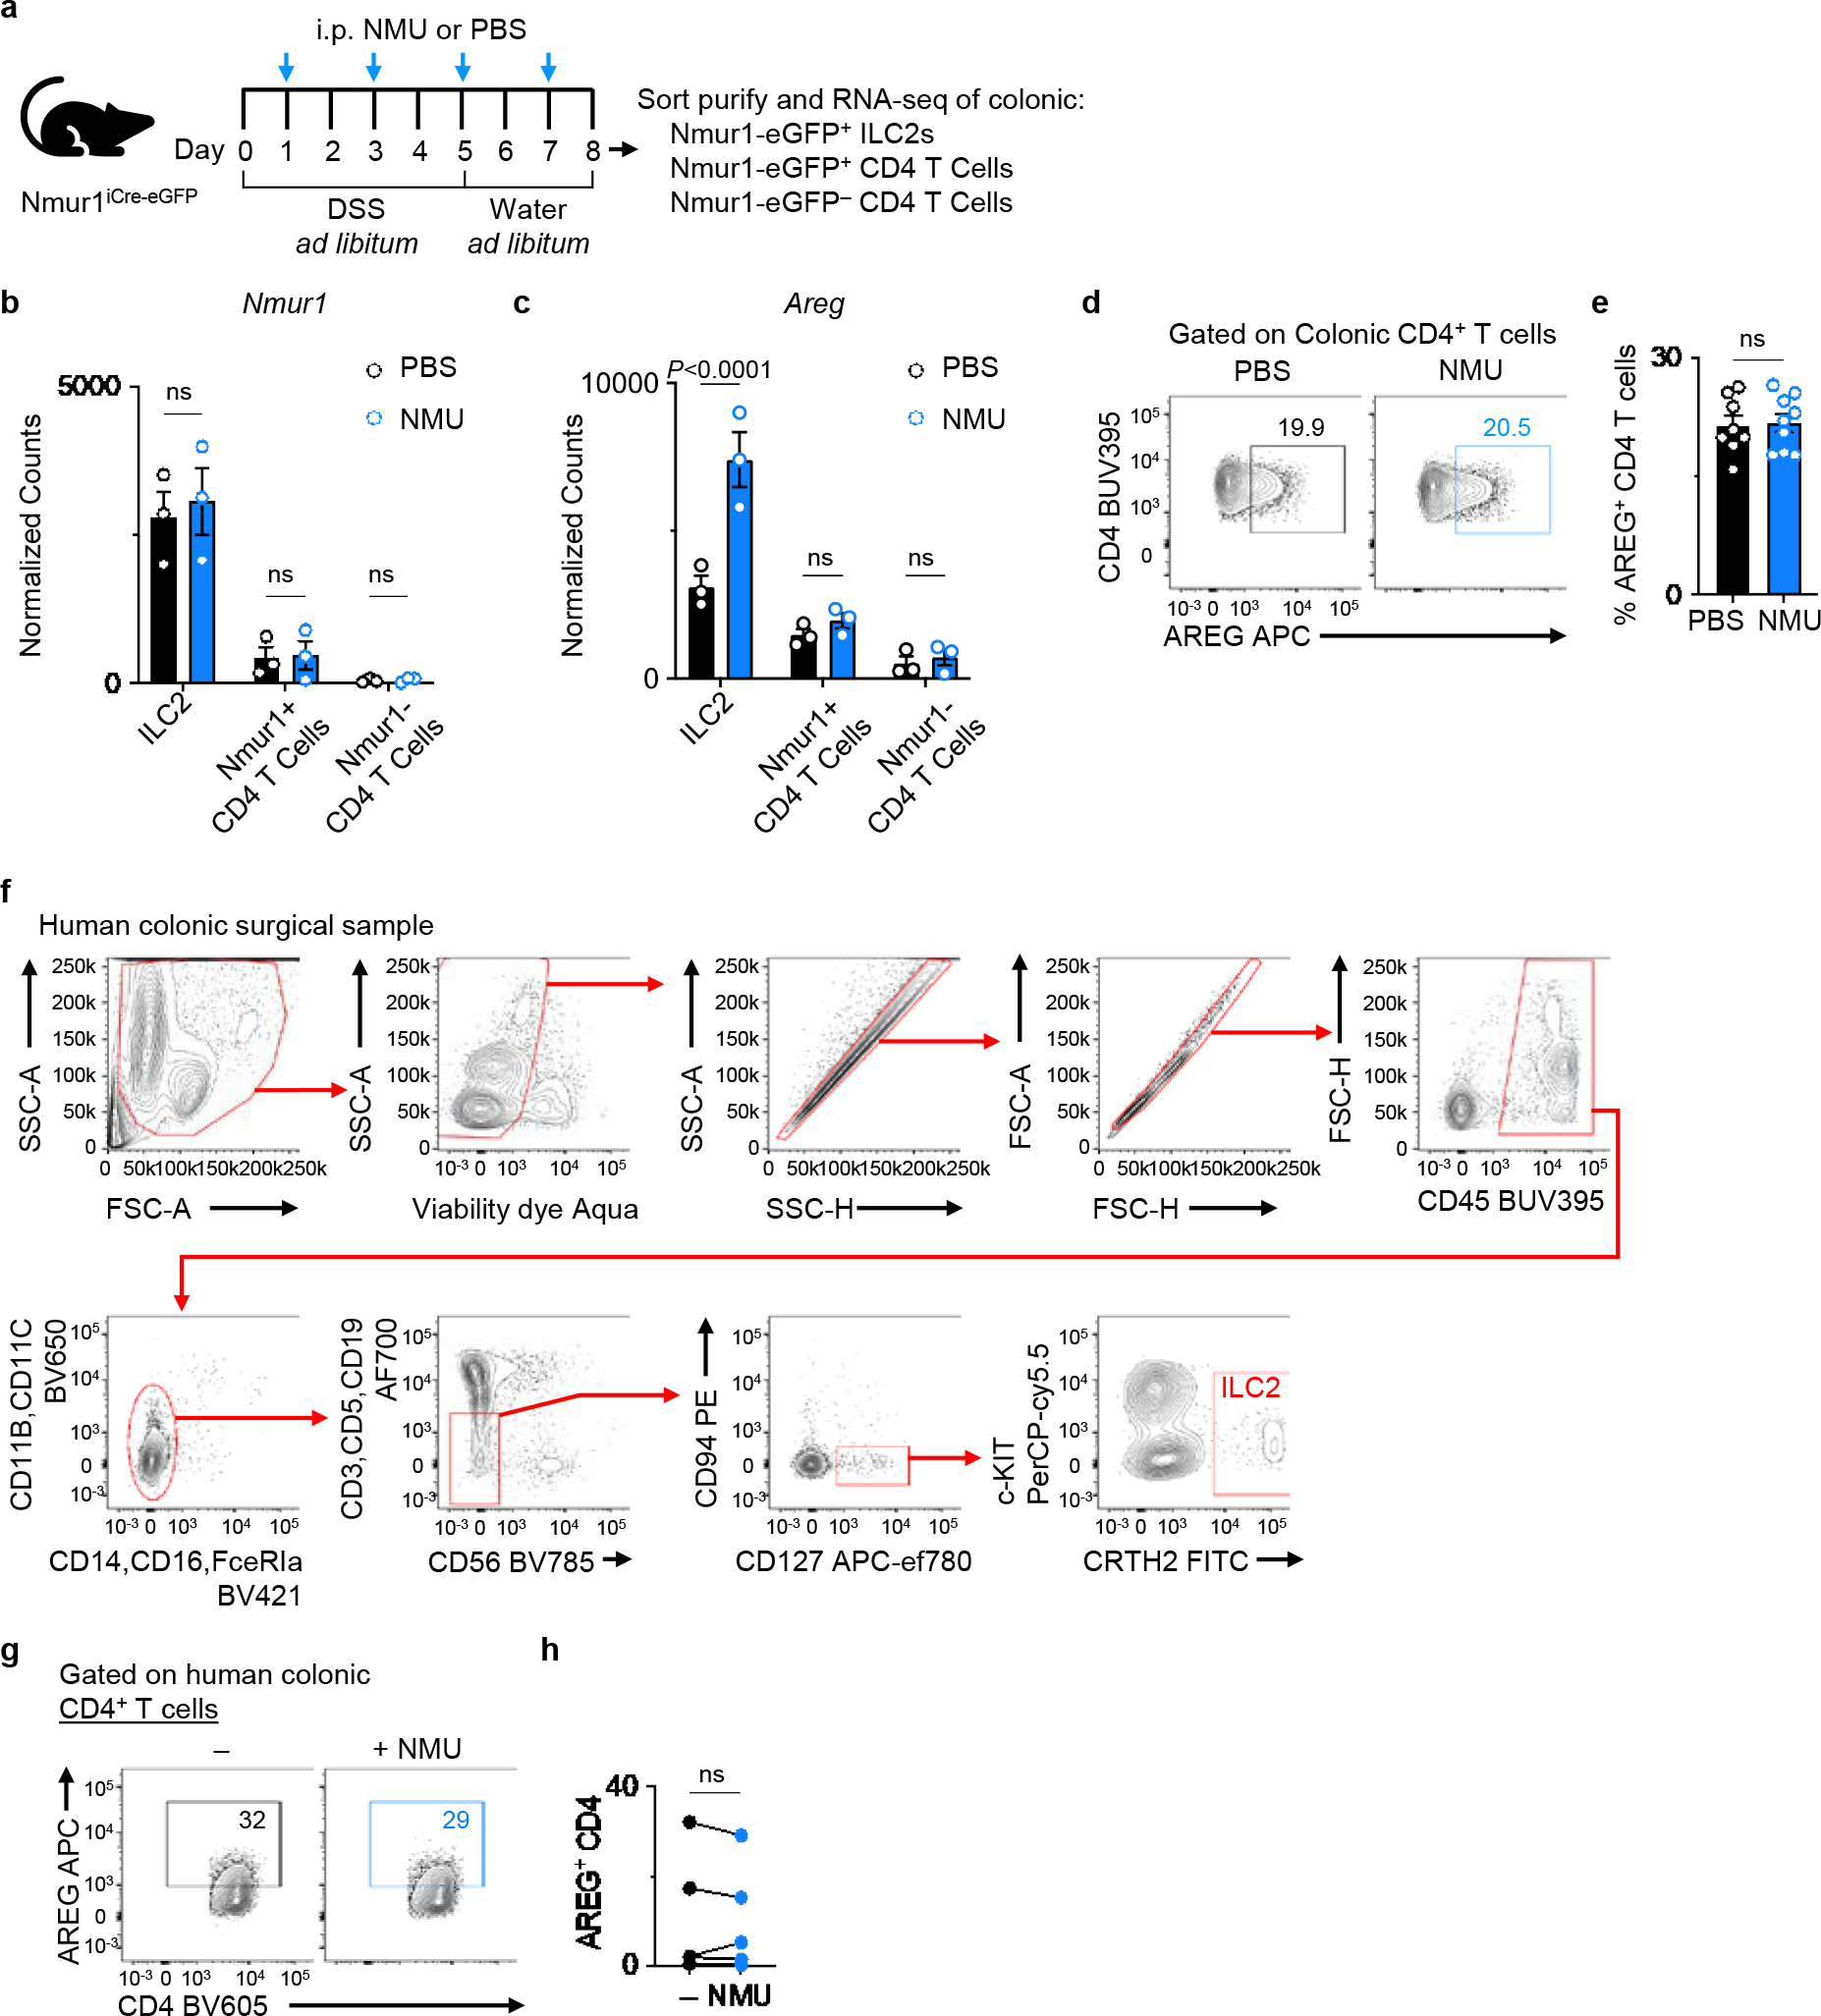
a, Experimental schematic of RNA sequencing (RNA-seq) analysis of ILC2s and CD4+ T cells in the context of intestinal inflammation. Nmur1-eGFP+ ILC2s, Nmur1-eGFP+ CD4+ T cells and Nmur1-eGFP− CD4+ T cells were sort-purified from colonic LPLs (n=3 three independent cohorts) and subjected to bulk RNA-seq. b, c, mRNA expression levels of Nmur1 (b) and Areg (c) as determined by comparing the normalized read counts of each gene. d, e, Representative flow cytometry analysis of AREG+ CD4+ T cells (d) and percentage of AREG+ CD4+ T cells (e) in the colons of WT mice injected with PBS (n=8 mice) or NMU (n=9 mice). f, Gating strategy for analyzing human colonic LPLs isolated from surgical biopsy samples from ulcerative colitis (UC) patients. g, h, AREG production by human CD4+ T cells after stimulation of human colonic LPLs from UC patients with or without NMU in vitro overnight. Representative flow cytometry analysis of human CD4+ T cells (g). Percentage of AREG+ CD4+ T cells (n=5 donors) (h). Data in b, c represent sequenced data from three independent biological replicates. Data in e are pooled from two independent experiments. Data in h contain 5 independent human samples, with each dot representing an individual donor. Two-way ANOVA with Šídák multiple comparisons test (b, c). Unpaired two-sided t-test (e). Paired two-sided t-test (h). P values are presented where appropriate. ns, not significant. Data are represented as means ± S.E.M.
Supplementary Material
Acknowledgments
We thank members of the Artis Laboratory for discussions and critical reading of the manuscript. We thank members of Alejandro Chavez’s laboratory at Columbia University for providing expertise in the RNA-seq process. NmuCre mice were generated by GENSAT and provided by the MMRRC Repository at UC Davis. We also thank members of the JRI IBD Live Cell Bank Consortium for patient recruitment and collection of human samples as well as processing of specimens for cryopreservation.
Funding
This work was supported by the Crohn’s and Colitis Foundation Research Fellowship Award (Award #901000) (to W.Z.), the Crohn’s and Colitis Foundation Research Fellowship Award (Award #527125), the Sackler Brain and Spine Institute Research (to C.C.), WCM Department of Pediatrics Junior Faculty Pilot Award, and The Jill Roberts Center Pilot Award for Research in IBD (all to A.M.T.); the National Heart, Lung, and Blood Institute (5T32HL134629) and Thomas C. King Pulmonary Fellowship (all to C.N.P.); a Crohn’s and Colitis Foundation Research Fellowship Award (Award #481087 to T.M.); and the National Institutes of Health (DK126871, AI151599, AI095466, AI095608, AI142213, AR070116, AI172027, DK132244 to D.A.; DK121009 and DK110352 to S.A.L.); LEO foundation, Cure for IBD, Jill Roberts Institute, the Sanders Family, the Rosanne H. Silbermann Foundation (all to D.A.). Work in the Klose lab is supported by grants from the European Research Council Starting Grant (ERCEA; 803087), the German Research Foundation (DFG; Project-ID 259373024 – CRC/TRR 167, FOR2599 project 5 - KL 2963/5–2, SPP1937 - KL 2963/2–1 and KL 2963/3–1) to C.S.N.K.
Footnotes
Competing interests
D.A. has contributed to scientific advisory boards at Pfizer, Takeda, FARE, and the KRF. The other authors declare no competing interests.
Consortia
The members of the JRI Live Cell Bank consortium are: David Artis1,6,§, Randy Longman1,7,8, Gregory Sonnenberg1,7,8, Ellen Scherl1,7, Dana Lukin1,7, Robert Battat1,7, Robbyn Sockolow2, Thomas Ciecierega2, Aliza Solomon2, Elaine Barfield2, Kimberley Chien2, Johanna Ferriera2, Jasmin Williams1, Shaira Khan1, Peik Sean Chong1, Samah Mozumder1, Lance Chou1, Connie Zhong1,§, Wenqing Zhou1,7,8, Anees Ahmed1,7,8, Ann M Joseph1,7,8
Consortium member affiliations
7Joan and Sanford I. Weill Department of Medicine, Division of Gastroenterology and Hepatology, Weill Cornell Medicine, Cornell University, New York, NY, USA
8Department of Microbiology and Immunology, Weill Cornell Medicine, Cornell University, New York, NY, USA
§Those consortium members are also authors of the manuscript: David Artis and Connie Zhong
Data availability
Bulk RNAseq data generated for this study have been deposited at the NCBI Gene Expression Omnibus (GEO) (GSE211735). The sequenced data were aligned against NCBI GRCm38/mm10 mouse genome information. The microarray data downloaded from E-GEOD-14580 were used for human intestinal NMU expression levels. Source data are provided with this manuscript.
References
- 1.Chu C, Artis D & Chiu IM Neuro-immune Interactions in the Tissues. Immunity 52, 464–474 (2020). 10.1016/j.immuni.2020.02.017 [DOI] [PMC free article] [PubMed] [Google Scholar]
- 2.Huh JR & Veiga-Fernandes H Neuroimmune circuits in inter-organ communication. Nat Rev Immunol 20, 217–228 (2020). 10.1038/s41577-019-0247-z [DOI] [PubMed] [Google Scholar]
- 3.Veiga-Fernandes H & Artis D Neuronal-immune system cross-talk in homeostasis. Science 359, 1465–1466 (2018). 10.1126/science.aap9598 [DOI] [PubMed] [Google Scholar]
- 4.Yano H & Artis D Neuronal regulation of innate lymphoid cell responses. Curr Opin Immunol 76, 102205 (2022). 10.1016/j.coi.2022.102205 [DOI] [PubMed] [Google Scholar]
- 5.Klose CSN et al. The neuropeptide neuromedin U stimulates innate lymphoid cells and type 2 inflammation. Nature 549, 282–286 (2017). 10.1038/nature23676 [DOI] [PMC free article] [PubMed] [Google Scholar]
- 6.Cardoso V et al. Neuronal regulation of type 2 innate lymphoid cells via neuromedin U. Nature 549, 277–281 (2017). 10.1038/nature23469 [DOI] [PMC free article] [PubMed] [Google Scholar]
- 7.Wallrapp A et al. The neuropeptide NMU amplifies ILC2-driven allergic lung inflammation. Nature 549, 351–356 (2017). 10.1038/nature24029 [DOI] [PMC free article] [PubMed] [Google Scholar]
- 8.Brestoff JR & Artis D Immune regulation of metabolic homeostasis in health and disease. Cell 161, 146–160 (2015). 10.1016/j.cell.2015.02.022 [DOI] [PMC free article] [PubMed] [Google Scholar]
- 9.Klose CS & Artis D Innate lymphoid cells as regulators of immunity, inflammation and tissue homeostasis. Nat Immunol 17, 765–774 (2016). 10.1038/ni.3489 [DOI] [PubMed] [Google Scholar]
- 10.Zaiss DMW, Gause WC, Osborne LC & Artis D Emerging functions of amphiregulin in orchestrating immunity, inflammation, and tissue repair. Immunity 42, 216–226 (2015). 10.1016/j.immuni.2015.01.020 [DOI] [PMC free article] [PubMed] [Google Scholar]
- 11.Monticelli LA et al. Innate lymphoid cells promote lung-tissue homeostasis after infection with influenza virus. Nat Immunol 12, 1045–1054 (2011). 10.1031/ni.2131 [DOI] [PMC free article] [PubMed] [Google Scholar]
- 12.Monticelli LA et al. IL-33 promotes an innate immune pathway of intestinal tissue protection dependent on amphiregulin-EGFR interactions. Proc Natl Acad Sci U S A 112, 10762–10767 (2015). 10.1073/pnas.1509070112 [DOI] [PMC free article] [PubMed] [Google Scholar]
- 13.Colonna M Innate Lymphoid Cells: Diversity, Plasticity, and Unique Functions in Immunity. Immunity 48, 1104–1117 (2018). 10.1016/j.immuni.2018.05.013 [DOI] [PMC free article] [PubMed] [Google Scholar]
- 14.Sonnenberg GF & Hepworth MR Functional interactions between innate lymphoid cells and adaptive immunity. Nat Rev Immunol 19, 599–613 (2019). 10.1038/s41577-019-0194-8 [DOI] [PMC free article] [PubMed] [Google Scholar]
- 15.Vivier E et al. Innate Lymphoid Cells: 10 Years On. Cell 174, 1054–1066 (2018). 10.1016/j.cell.2018.07.017 [DOI] [PubMed] [Google Scholar]
- 16.Guia S & Narni-Mancinelli E Helper-like Innate Lymphoid Cells in Humans and Mice. Trends Immunol 41, 436–452 (2020). 10.1016/j.it.2020.03.002 [DOI] [PubMed] [Google Scholar]
- 17.Ebbo M, Crinier A, Vély F & Vivier E Innate lymphoid cells: major players in inflammatory diseases. Nat Rev Immunol 17, 665–678 (2017). 10.1038/nri.2017.86 [DOI] [PubMed] [Google Scholar]
- 18.Chu C et al. The ChAT-acetylcholine pathway promotes group 2 innate lymphoid cell responses and anti-helminth immunity. Sci Immunol 6 (2021). 10.1126/sciimmunol.abe3218 [DOI] [PMC free article] [PubMed] [Google Scholar]
- 19.Moriyama S et al. β(2)-adrenergic receptor-mediated negative regulation of group 2 innate lymphoid cell responses. Science 359, 1056–1061 (2018). 10.1126/science.aan4829 [DOI] [PubMed] [Google Scholar]
- 20.Nagashima H et al. Neuropeptide CGRP Limits Group 2 Innate Lymphoid Cell Responses and Constrains Type 2 Inflammation. Immunity 51, 682–695.e686 (2019). 10.1016/j.immuni.2019.06.009 [DOI] [PMC free article] [PubMed] [Google Scholar]
- 21.Wallrapp A et al. Calcitonin Gene-Related Peptide Negatively Regulates Alarmin-Driven Type 2 Innate Lymphoid Cell Responses. Immunity 51, 709–723.e706 (2019). 10.1016/j.immuni.2019.09.005 [DOI] [PMC free article] [PubMed] [Google Scholar]
- 22.Xu H et al. Transcriptional Atlas of Intestinal Immune Cells Reveals that Neuropeptide α-CGRP Modulates Group 2 Innate Lymphoid Cell Responses. Immunity 51, 696–708.e699 (2019). 10.1016/j.immuni.2019.09.004 [DOI] [PMC free article] [PubMed] [Google Scholar]
- 23.Hepworth MR et al. Immune tolerance. Group 3 innate lymphoid cells mediate intestinal selection of commensal bacteria-specific CD4⁺ T cells. Science 348, 1031–1035 (2015). 10.1126/science.aaa4812 [DOI] [PMC free article] [PubMed] [Google Scholar]
- 24.Zhou L et al. Innate lymphoid cells support regulatory T cells in the intestine through interleukin-2. Nature 568, 405–409 (2019). 10.1038/s41586-019-1082-x [DOI] [PMC free article] [PubMed] [Google Scholar]
- 25.Vély F et al. Evidence of innate lymphoid cell redundancy in humans. Nat Immunol 17, 1291–1299 (2016). 10.1038/ni.3553 [DOI] [PMC free article] [PubMed] [Google Scholar]
- 26.Shimshek DR et al. Codon-improved Cre recombinase (iCre) expression in the mouse. Genesis 32, 19–26 (2002). 10.1002/gene.10023 [DOI] [PubMed] [Google Scholar]
- 27.Cormack BP, Valdivia RH & Falkow S FACS-optimized mutants of the green fluorescent protein (GFP). Gene 173, 33–38 (1996). 10.1016/0378-1119(95)00685-0 [DOI] [PubMed] [Google Scholar]
- 28.Luche H, Weber O, Nageswara Rao T, Blum C & Fehling HJ Faithful activation of an extra-bright red fluorescent protein in “knock-in” Cre-reporter mice ideally suited for lineage tracing studies. Eur J Immunol 37, 43–53 (2007). 10.1002/eji.200636745 [DOI] [PubMed] [Google Scholar]
- 29.Brestoff JR et al. Group 2 innate lymphoid cells promote beiging of white adipose tissue and limit obesity. Nature 519, 242–246 (2015). 10.1038/nature14115 [DOI] [PMC free article] [PubMed] [Google Scholar]
- 30.Nussbaum JC et al. Type 2 innate lymphoid cells control eosinophil homeostasis. Nature 502, 245–248 (2013). 10.1038/nature12526 [DOI] [PMC free article] [PubMed] [Google Scholar]
- 31.Schlenner SM et al. Fate mapping reveals separate origins of T cells and myeloid lineages in the thymus. Immunity 32, 426–436 (2010). 10.1016/j.immuni.2010.03.005 [DOI] [PubMed] [Google Scholar]
- 32.Oliphant CJ et al. MHCII-mediated dialog between group 2 innate lymphoid cells and CD4(+) T cells potentiates type 2 immunity and promotes parasitic helminth expulsion. Immunity 41, 283–295 (2014). 10.1016/j.immuni.2014.06.016 [DOI] [PMC free article] [PubMed] [Google Scholar]
- 33.Klementowicz JE, Travis MA & Grencis RK Trichuris muris: a model of gastrointestinal parasite infection. Semin Immunopathol 34, 815–828 (2012). 10.1007/s00281-012-0348-2 [DOI] [PMC free article] [PubMed] [Google Scholar]
- 34.Zaiss DM et al. Amphiregulin, a TH2 cytokine enhancing resistance to nematodes. Science 314, 1746 (2006). 10.1126/science.1133715 [DOI] [PubMed] [Google Scholar]
- 35.Shao J & Sheng H Amphiregulin promotes intestinal epithelial regeneration: roles of intestinal subepithelial myofibroblasts. Endocrinology 151, 3728–3737 (2010). 10.1210/en.2010-0319 [DOI] [PMC free article] [PubMed] [Google Scholar]
- 36.Manzo ND, Foster WM & Stripp BR Amphiregulin-dependent mucous cell metaplasia in a model of nonallergic lung injury. Am J Respir Cell Mol Biol 47, 349–357 (2012). 10.1165/rcmb.2011-0257OC [DOI] [PMC free article] [PubMed] [Google Scholar]
- 37.Zeisel A et al. Molecular Architecture of the Mouse Nervous System. Cell 174, 999–1014.e1022 (2018). 10.1016/j.cell.2018.06.021 [DOI] [PMC free article] [PubMed] [Google Scholar]
- 38.Antignano F, Mullaly SC, Burrows K & Zaph C Trichuris muris infection: a model of type 2 immunity and inflammation in the gut. J Vis Exp (2011). 10.3791/2774 [DOI] [PMC free article] [PubMed] [Google Scholar]
- 39.Arpaia N et al. A Distinct Function of Regulatory T Cells in Tissue Protection. Cell 162, 1078–1089 (2015). 10.1016/j.cell.2015.08.021 [DOI] [PMC free article] [PubMed] [Google Scholar]
- 40.Burzyn D et al. A special population of regulatory T cells potentiates muscle repair. Cell 155, 1282–1295 (2013). 10.1016/j.cell.2013.10.054 [DOI] [PMC free article] [PubMed] [Google Scholar]
- 41.Minutti CM et al. Epidermal Growth Factor Receptor Expression Licenses Type-2 Helper T Cells to Function in a T Cell Receptor-Independent Fashion. Immunity 47, 710–722.e716 (2017). 10.1016/j.immuni.2017.09.013 [DOI] [PMC free article] [PubMed] [Google Scholar]
- 42.De Salvo C et al. NOD2 drives early IL-33-dependent expansion of group 2 innate lymphoid cells during Crohn’s disease-like ileitis. J Clin Invest 131 (2021). 10.1172/jci140624 [DOI] [PMC free article] [PubMed] [Google Scholar]
- 43.Inclan-Rico JM et al. Basophils prime group 2 innate lymphoid cells for neuropeptide-mediated inhibition. Nat Immunol 21, 1181–1193 (2020). 10.1038/s41590-020-0753-y [DOI] [PMC free article] [PubMed] [Google Scholar]
- 44.Arijs I et al. Mucosal gene signatures to predict response to infliximab in patients with ulcerative colitis. Gut 58, 1612–1619 (2009). 10.1136/gut.2009.178665 [DOI] [PubMed] [Google Scholar]
- 45.Ye Y et al. Neuromedin U promotes human type 2 immune responses. Mucosal Immunol (2022). 10.1038/s41385-022-00543-6 [DOI] [PMC free article] [PubMed] [Google Scholar]
Online Methods References
- 46.Buch T et al. A Cre-inducible diphtheria toxin receptor mediates cell lineage ablation after toxin administration. Nat Methods 2, 419–426 (2005). 10.1038/nmeth762 [DOI] [PubMed] [Google Scholar]
- 47.Madisen L et al. A robust and high-throughput Cre reporting and characterization system for the whole mouse brain. Nat Neurosci 13, 133–140 (2010). 10.1038/nn.2467 [DOI] [PMC free article] [PubMed] [Google Scholar]
- 48.Lee PP et al. A critical role for Dnmt1 and DNA methylation in T cell development, function, and survival. Immunity 15, 763–774 (2001). 10.1016/s1074-7613(01)00227-8 [DOI] [PubMed] [Google Scholar]
- 49.Luetteke NC et al. Targeted inactivation of the EGF and amphiregulin genes reveals distinct roles for EGF receptor ligands in mouse mammary gland development. Development 126, 2739–2750 (1999). [DOI] [PubMed] [Google Scholar]
- 50.He Z et al. Epithelial-derived IL-33 promotes intestinal tumorigenesis in Apc (Min/+) mice. Sci Rep 7, 5520 (2017). 10.1038/s41598-017-05716-z [DOI] [PMC free article] [PubMed] [Google Scholar]
- 51.Longman RS et al. CX3CR1⁺ mononuclear phagocytes support colitis-associated innate lymphoid cell production of IL-22. J Exp Med 211, 1571–1583 (2014). 10.1084/jem.20140678 [DOI] [PMC free article] [PubMed] [Google Scholar]
- 52.Simoni Y et al. Human Innate Lymphoid Cell Subsets Possess Tissue-Type Based Heterogeneity in Phenotype and Frequency. Immunity 46, 148–161 (2017). 10.1016/j.immuni.2016.11.005 [DOI] [PMC free article] [PubMed] [Google Scholar]
- 53.Artis D et al. The IL-27 receptor (WSX-1) is an inhibitor of innate and adaptive elements of type 2 immunity. J Immunol 173, 5626–5634 (2004). 10.4049/jimmunol.173.9.5626 [DOI] [PubMed] [Google Scholar]
- 54.Susaki EA et al. Whole-brain imaging with single-cell resolution using chemical cocktails and computational analysis. Cell 157, 726–739 (2014). 10.1016/j.cell.2014.03.042 [DOI] [PubMed] [Google Scholar]
- 55.MacDonald JW (2022).
- 56.Dobin A et al. STAR: ultrafast universal RNA-seq aligner. Bioinformatics 29, 15–21 (2013). 10.1093/bioinformatics/bts635 [DOI] [PMC free article] [PubMed] [Google Scholar]
- 57.Liao Y, Smyth GK & Shi W The R package Rsubread is easier, faster, cheaper and better for alignment and quantification of RNA sequencing reads. Nucleic Acids Res 47, e47 (2019). 10.1093/nar/gkz114 [DOI] [PMC free article] [PubMed] [Google Scholar]
- 58.Love MI, Huber W & Anders S Moderated estimation of fold change and dispersion for RNA-seq data with DESeq2. Genome Biol 15, 550 (2014). 10.1186/s13059-014-0550-8 [DOI] [PMC free article] [PubMed] [Google Scholar]
Associated Data
This section collects any data citations, data availability statements, or supplementary materials included in this article.
Supplementary Materials
Data Availability Statement
Bulk RNAseq data generated for this study have been deposited at the NCBI Gene Expression Omnibus (GEO) (GSE211735). The sequenced data were aligned against NCBI GRCm38/mm10 mouse genome information. The microarray data downloaded from E-GEOD-14580 were used for human intestinal NMU expression levels. Source data are provided with this manuscript.


