Abstract
In this paper, a 3D-printed multi-modal device was designed and fabricated to simultaneously detect nitric oxide (NO) and adenosine triphosphate (ATP) in red blood cell suspensions prepared from whole blood. Once a sample was injected into the device, NO was first detected (via amperometry) using a three-electrode, dual-opposed, electrode configuration with a platinum-black/Nafion coated gold working electrode. After in-line amperometric detection of NO, ATP was detected via a chemiluminescence reaction, with a luciferin/luciferase solution continuously pumped into an integrated mixing T and the resulting light being measured with a PMT underneath the channel. The device was optimized for mixing/reaction conditions, limits of detection (40 nM for NO and 30 nM for ATP), and sensitivity. This device was used to determine the basal (normoxic) levels of NO and ATP in red blood cells, as well as an increase in concentration of both analytes under hypoxic conditions. Finally, the effect of storing red blood cells in a commonly used storage solution was also investigated by monitoring the production of NO and ATP over a three-week storage time.
Graphical Abstract
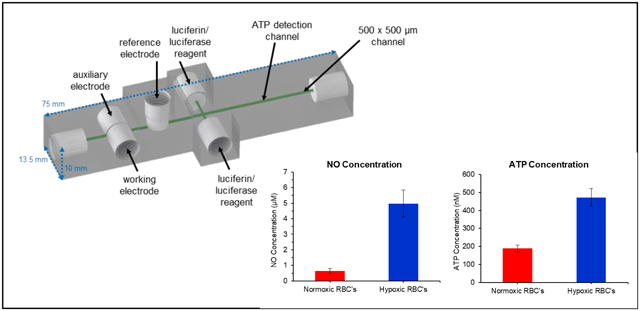
A 3D-printed multi-modal device was developed to simultaneously detect nitric oxide (NO) and adenosine triphosphate (ATP) in red blood cell suspensions.
Introduction
Red blood cells (RBCs) are the most common cell type found in the human body; however, because of their small size (~7–8 μm diameter) and mean corpuscular volume (85–95 fL), they only make up a small percentage of the cell mass.1 RBCs lack organelles and a nucleus. Hemoglobin, the molecule responsible for transporting oxygen, makes up 97% of the dry mass of the cell.2 While initially thought to just be an oxygen transporter, the past few decades have revealed that RBCs are intricately involved in vascular processes. RBCs act as oxygen sensors in the vasculature.3,4 Upon entering an area that is low in oxygen (hypoxia), they respond by releasing small molecules, such as nitric oxide (NO) and adenosine triphosphate (ATP), to start a communication pathway that results in recruiting more oxygen-rich blood to the demanding tissue.4–6
ATP plays a major role in the control of blood flow, with its production in RBCs being stimulated by shear stress and/or deformability of the cells.7,8 In 1992, Bergfeld and Forrester showed that ATP release can also be induced by hypoxia and hypercapnia.5 Ellsworth et al. exposed hamster RBCs to low oxygen levels and constant carbon dioxide levels to show that low oxygen gradients independently lead to the ATP response, with the RBC matching the microvascular oxygen supply with local tissue oxygen demand.9 Other work has shown that RBC-derived ATP, once released, can bind to purinergic receptors on the surrounding endothelium, acting as a vasodilator resulting in increased blood flow (and therefore increased oxygen supply).3,10
Red blood cells contain millimolar quantities of ATP while extracellular quantities vary across the hundreds of nanomolar range.7,11,12 ATP has been detected via anion exchange chromatography with conductance,13 HPLC with absorbance,14 LC/MS,15 fluorescent probes,16 and electrochemical detection.17 A common method to selectively quantify ATP is the chemiluminescent luciferin/luciferase reaction. In the presence of magnesium and oxygen, the luciferase enzyme catalyzes a chemiluminescent reaction using ATP to oxidize its substrate luciferin into an excited oxyluciferin that produces light with maximum emission between 550–570 nm. The luciferin/luciferase reaction has been used to measure ATP in such applications as RBC solutions via a cuvette and luminometer,18,19 to determine ATP content on RBC surfaces,20 and in capillaries or microfluidic chips that mimic the size of blood vessels.8,21,22
Nitric oxide is another key molecule involved in the vasodilation process. Long before the molecule was identified, NO was known as the “endothelium-derived relaxing factor” (EDRF).23–25 When ATP binds to the purinergic receptors on the surface of the vascular endothelial cells, NO synthases are activated and NO is produced.26 The endothelium-derived NO diffuses into the surrounding smooth muscle resulting in relaxation and dilation of the blood vessel. RBCs themselves can also contribute to vascular NO production.27,28 Much research has shown that NO synthases are present and active in RBCs.28–30 Although there is and has been much debate regarding the mechanism of NO production, it is clear that RBCs release NO in response to hypoxia.6,31,32 In general, NO is a difficult molecule to detect, as it is produced in low quantities (nM to μM) and has a half-life of a few seconds, readily oxidizing into nitrite in the presence of oxygen and water.33 NO can be detected indirectly by measuring nitrite via the colorimetric Griess assay,34,35 the chemiluminescent reaction between gaseous NO and ozone,36,37 and with fluorescent probes.38,39 Amperometry has been used extensively in various applications to measure NO.40,41 Park et al. published in vivo amperometric detection of NO and oxygen in the brains of rats.42 They showed that increases in NO were always preceded by a decrease in oxygen. The Schoenfisch lab described the amperometric determination of NO in whole blood using a microfluidic amperometric detector.43 Microfluidic systems can provide a biomimetic model by flowing RBCs through channels and measuring diffused NO. Previous work from Halpin and Spence quantified NO release in normoxic and hypoxic RBCs in a fluidically connected well using the florescent probe DAF-FM, while Selimovic et al. used parallel channels to measure NO at an electrode separated from the flow of RBCs by a planar membrane.44,45
While NO and ATP release from RBCs have been measured independently, there are a lack of measurement schemes that can simultaneously measure both analytes. Here we use a 3D-printed multi-modal device to simultaneously detect NO and ATP in RBC suspensions (7% hematocrit). NO is detected amperometrically using a three-electrode, dual-opposed, electrode configuration with a Pt-black/Nafion coated gold working electrode. After in-line amperometric detection of NO, ATP is detected via a chemiluminescence reaction, with a luciferin/luciferase solution being continuously pumped into an integrated mixing T and the resulting light being measured with a PMT underneath the channel. The basal levels of NO and ATP in RBC suspensions were determined, as well as an increase in the concentration of both analytes under hypoxic conditions. Finally, the effect of storing RBCs in an FDA-approved additive solution (AS-1) was also investigated by monitoring the release of NO and ATP from the stored cells at various time points during a three-week storage period.
Experimental
Materials
3D-printer materials for the Stratasys J750 PolyJet printer were obtained directly from Stratasys (Eden Prairie, MN). Fluorescein, ATP, crude firefly lanterns, tris(hydroxymethyl)-aminomethane, CaCl2, NaCl, MgSO4, glucose, chloroplatinic acid, lead (II) acetate, Nafion, glybenclamide, L-NAME (N-Nitro-L-arginine methyl ester), D-mannitol, adenine, and phosphate buffered saline (10x) were obtained from Sigma-Aldrich (St. Louis, MO). Luciferin was obtained from Gold Biotechnology (St. Louis, MO). KCl was obtained from Fisher Scientific (Fair Lawn, NJ). Bovine serum albumin was obtained from MP Biomedical (Irvine, CA). Argon and NO gas were supplied by AirGas (Radnor, PA). The platinum and gold electrode materials were obtained from Alfa Aesar (Haverhill, MA). Oxyrase came from Oxyrase, Inc. (Mansfield, OH).
Microfluidic Device
The multi-modal detector (Figure 1) used for the study of NO and ATP release from RBCs was based upon a previous design for ATP and norepinephrine detection, with some notable differences to optimize NO and ATP detection.46 All channels were designed with a 500 × 500 μm cross-section and fluidic connections were made with printed threads designed to accommodate commercial fittings (Idex P-202, IDEX Health & Science, Oak Harbor, WA) for adapters to tubing for reagents (508 μm i.d. Tygon tubing, 06419–01, Cole-Parmer, Vernon Hills, IL) or capillary for sample plugs (150 μm i.d., Polymicro, Phoenix, AZ). Figure S1 provides a graphical representation of key dimensions. The amperometric part of the device was designed with open threaded sections enabling all three electrodes to screw into the device and form the channel wall sealing the channel (Figure 2A). The design includes a channel support (see Figure 2A) that forms the top and bottom of the channel and acts as a stop for the threaded electrodes.46 The working and auxiliary electrodes screw into the device from opposite sides, and the commercially available reference electrode screws in from the top. The final, optimized chemiluminescent part of the device consists of two inlets for introducing the luciferin/luciferase solution, followed by a straight reaction channel. The optimized design resulted in reagent streams that converge with the sample channel to form a double mixing T, and the light-producing reaction occurs as the solutions mix via diffusion in the ATP detection channel. The device was designed in Autodesk Inventor Professional (SI contains .STL file of device) and printed on a Stratasys J750 PolyJet printer with Vero UltraClear model material.47,48 The printed device was manually cleaned of support material and rinsed with isopropanol and water before use. Small ridges on the bottom of the device, which remain from the support material printed as a carpet layer, were removed by wet polishing until the device was smooth and transparent. For all studies, phosphate-buffered saline (PBS) at a pH of 7.4 was used as the carrier buffer and pumped through the device at 15 μL/min from a syringe pump. Injections were performed using a 4-port injector fitted with a 1 μL volume rotor (Valco Instruments, Houston, TX) except for the calibration interference study, which used a 500 nL rotor.
Figure 1.
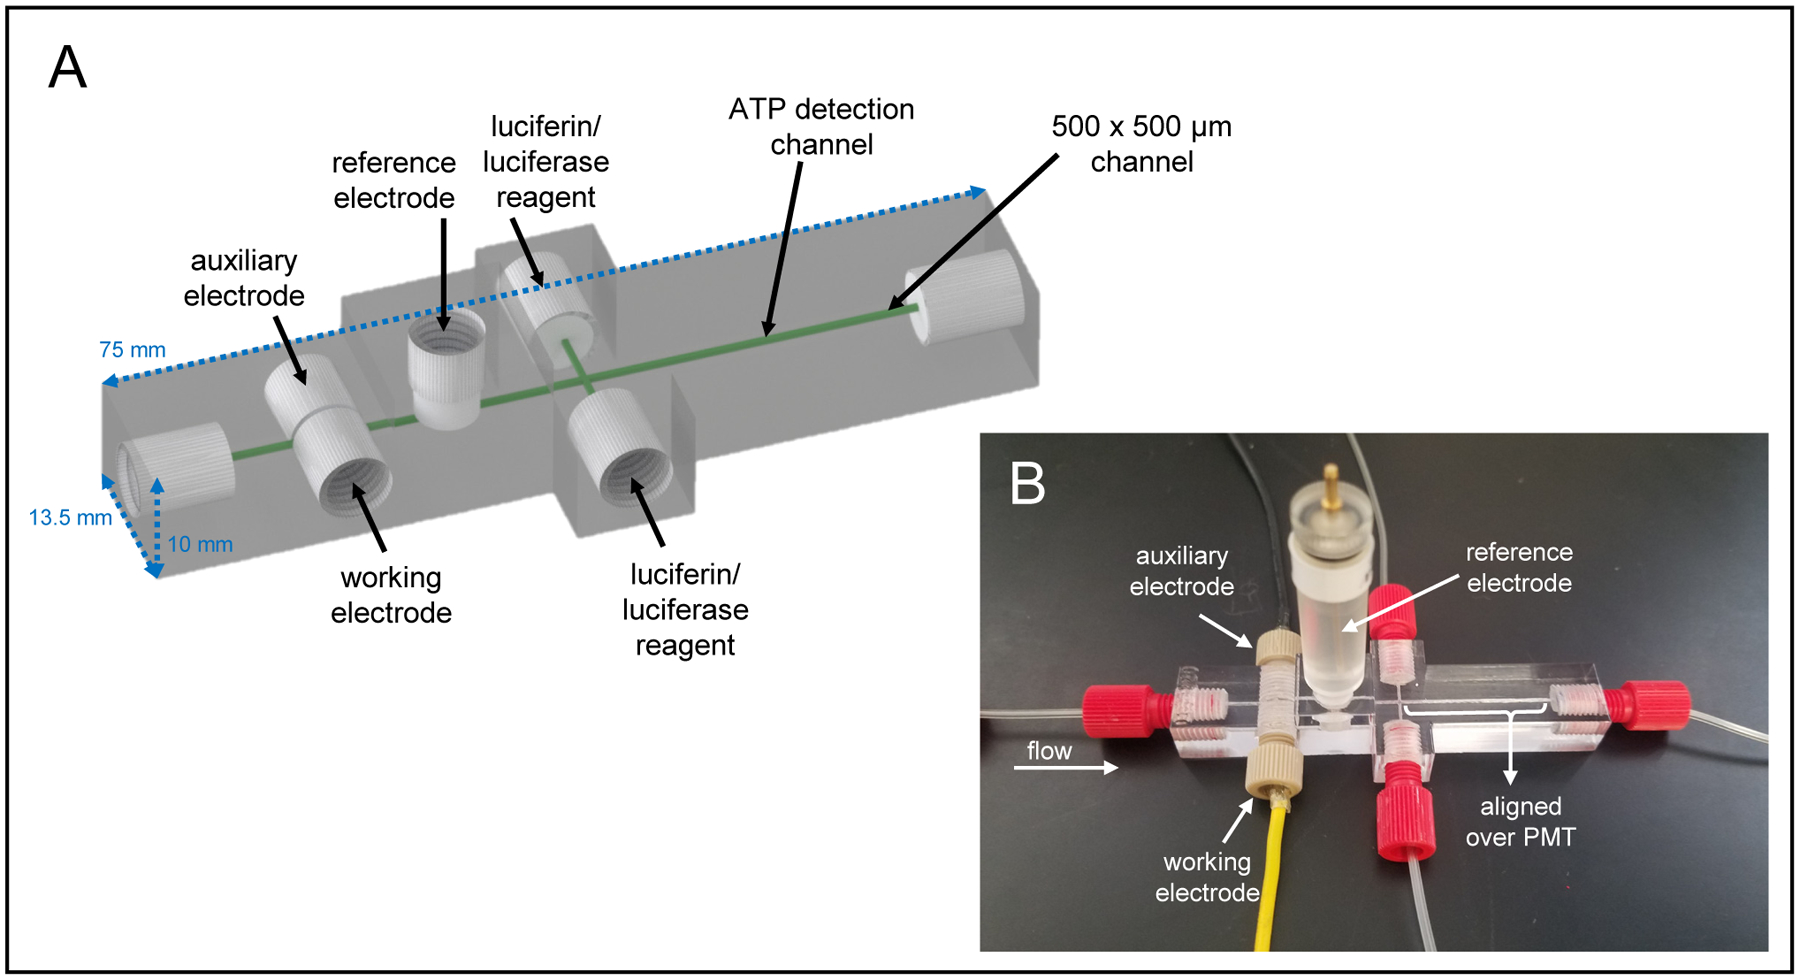
A) CAD rendering of the 3D-printed multi-modal device used in these studies. The device contains threaded ports for fluidic fittings and electrodes. B) The assembled device with threaded working and auxiliary electrodes, a commercially available threaded reference electrode, and threaded fluidic connections. The ATP mixing channel is aligned directly on top of a PMT window for chemiluminescence detection.
Figure 2.
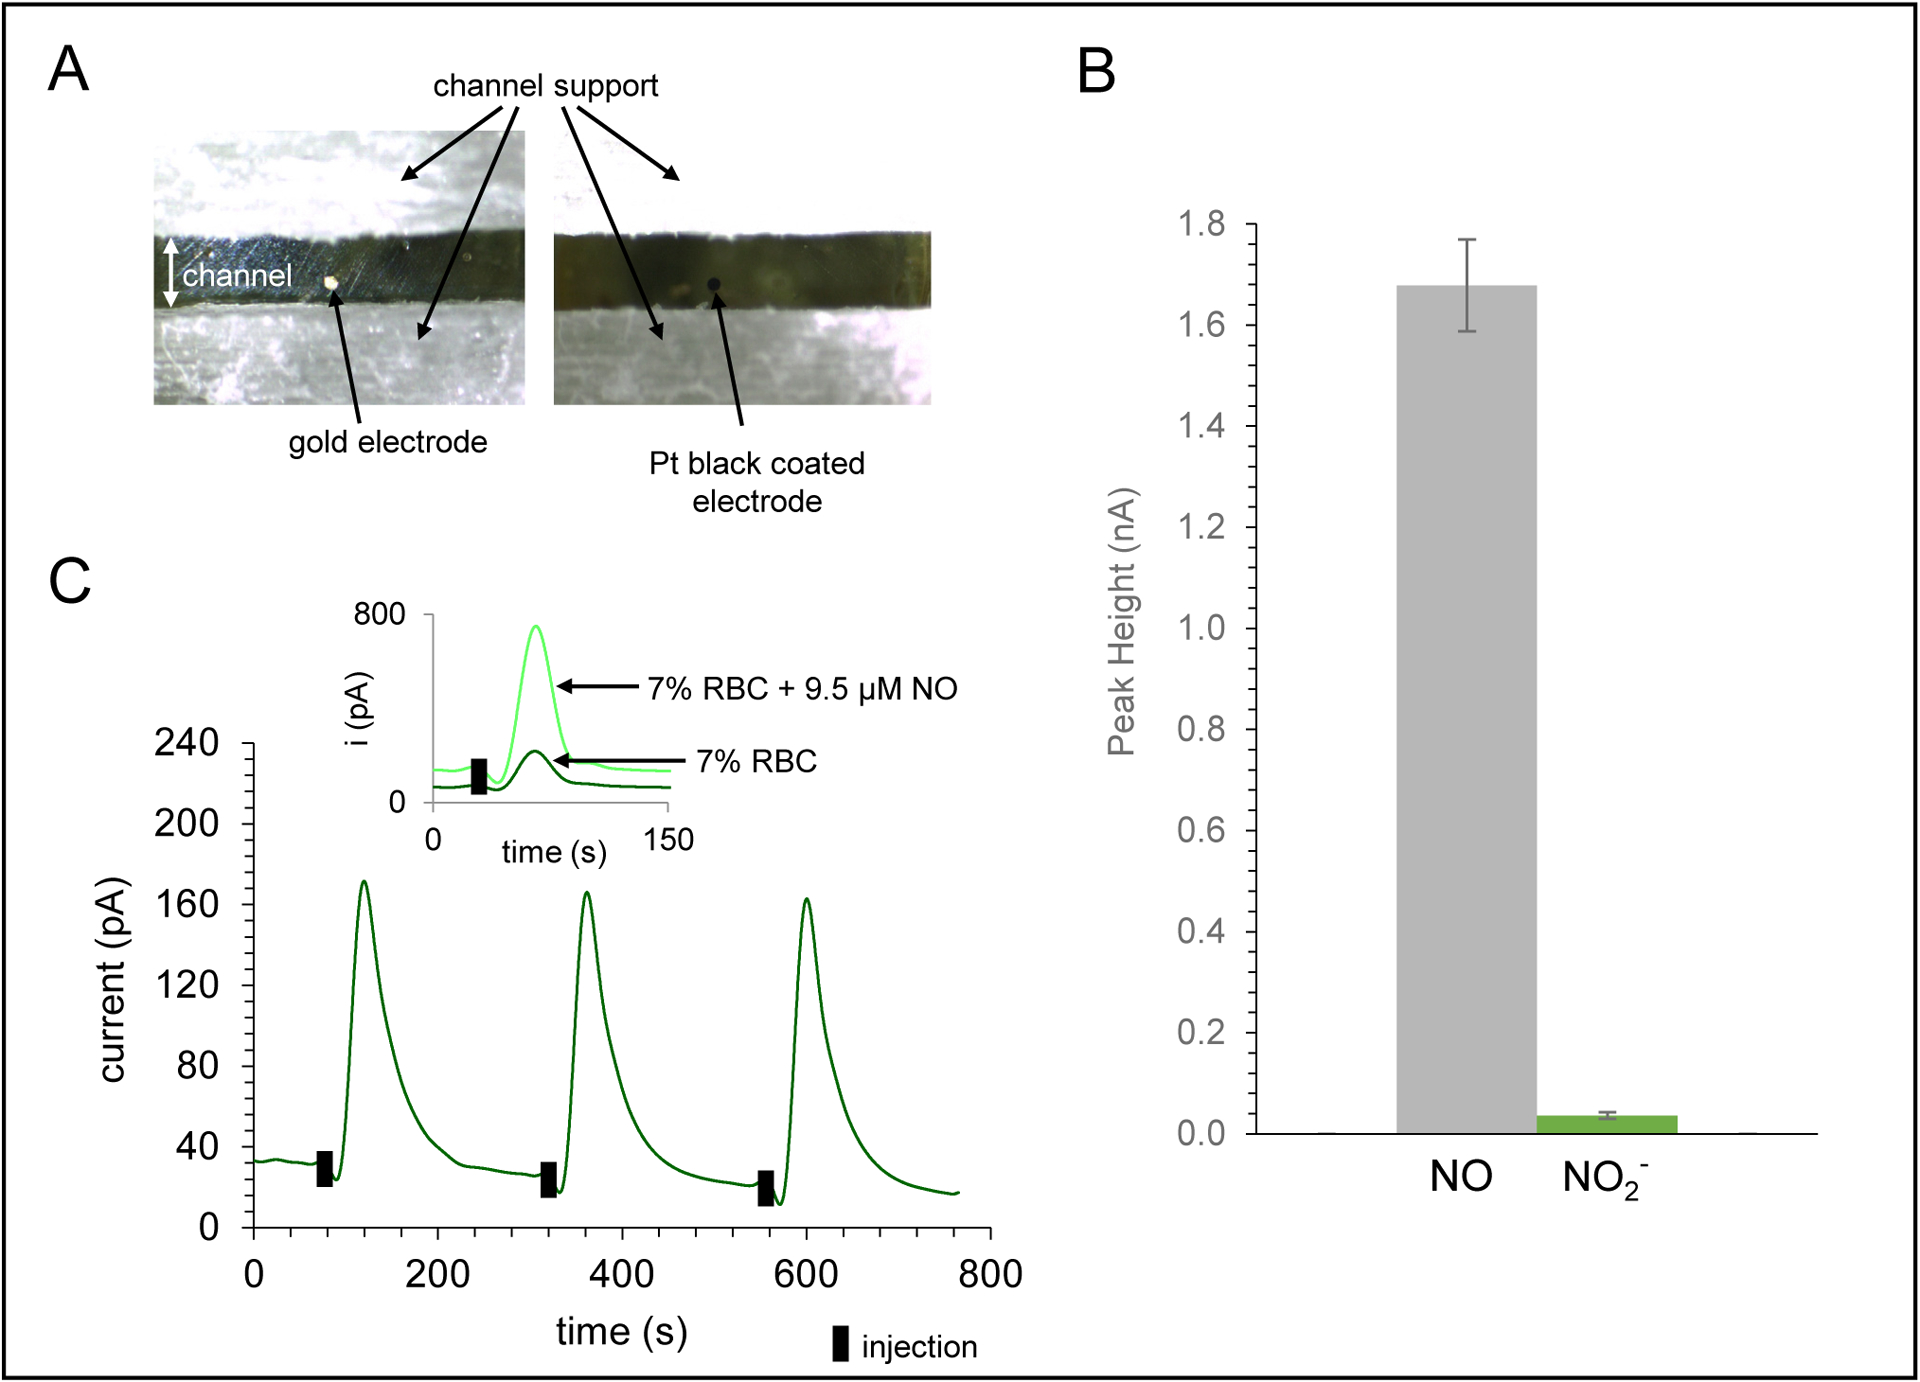
Characterization of amperometric detection portion of the device for NO detection. A) Micrograph of 100 μm gold working electrode in the printed channel and the same electrode modified with Pt-black and Nafion for selective NO detection. B) Bar graph demonstrating the exclusion of nitrite compared to equimolar injections of NO (95 μM) using the Pt-black/Nafion modified electrode. C) Amperometric trace for NO detection of a 7% RBC sample (triplicate injections, +0.85 V vs. Ag/AgCl). Inset shows trace for injection of 7% RBC sample and an overlay of a 7% RBC sample spiked with 9.5 μM NO.
NO detection occurred in the amperometric portion of the multi-modal device using a potentiostat (810B, CH Instruments, Austin, TX). The working and auxiliary electrodes were fabricated as previously reported.46,49 A 500 μm platinum wire was used as the auxiliary electrode and a commercially available threaded Ag/AgCl electrode (RE-3VT, CH Instruments) was used as the reference. A 100 μm diameter gold working electrode was modified with Pt-black and Nafion to increase selectivity for NO detection.45 Pt-black was electrodeposited by placing the bare polished electrode in a solution of 3.5% chloroplatinic acid and 0.0005% lead(II) acetate and cycling the potential from +0.6 to −0.35 V (vs. Ag/AgCl) at 20 mV/s. Nafion was diluted to 0.05% in isopropanol and 25 μL were placed on the Pt-black modified electrode and left to dry at room temperature. The working electrode was polished and modified with Pt-black and Nafion before each day of experiments. NO was detected at the surface of the 100 μm diameter Pt-black/Nafion modified gold working electrode at +0.85 V (vs. Ag/AgCl).
ATP detection occurred by measuring the light produced from the chemiluminescent luciferin/luciferase reaction with a PMT (R1527, Hamamatsu Photonics, Hamamatsu, Japan) housed in a light-excluding black box.46 The luciferin/luciferase solution contained 10 mg/mL crude firefly lanterns and 1 mg/mL luciferin in PBS. The solution was filtered (0.22 μm PES filter, MidSci, Fenton, MO), loaded into two syringes, and continuously pumped into the device at 2.5 μL/min.
For analysis, 1 μL plugs were injected onto the device. Flow injection analysis of injected RBC samples yielded peaks for amperometric and chemiluminescent signals. Peak heights from NO- and ATP-spiked samples, injected in triplicate, were used to determine the concentrations of NO and ATP in the various blood samples via calibration with standard additions. All data, for analysis and presentation purposes, was smoothed in PeakFit (San Jose, CA) with a Savitzky-Golay filter (0.5% window) to help filter the noise. Determined concentrations reported in this manuscript are expressed with averages and standard error of the mean, with variance coming from the different donations. P-values for comparisons were calculated using a paired T-test.
Optimization and Characterization
To visualize the mixing capabilities of the channel, 50 μM fluorescein was pumped into the device through the luciferin/luciferase ports (Figure 3). RBCs were imaged at various points in the device by injecting a 1 μL plug of 7% RBCs or, for greater contrast, continuously flowing a 7% suspension of RBCs through the main inlet of the device. Bright field images of RBCs and fluorescent imaging were obtained using an inverted fluorescence microscope (Olympus EX 60) equipped with a 100 W Hg Arc lamp and a Qicam Fast digital CCD camera (QImaging, Montreal, Canada). All images were captured with Streampix Digital Video Recording software (Norpix, Montreal, Canada), processed, and analyzed using ImageJ.
Figure 3.
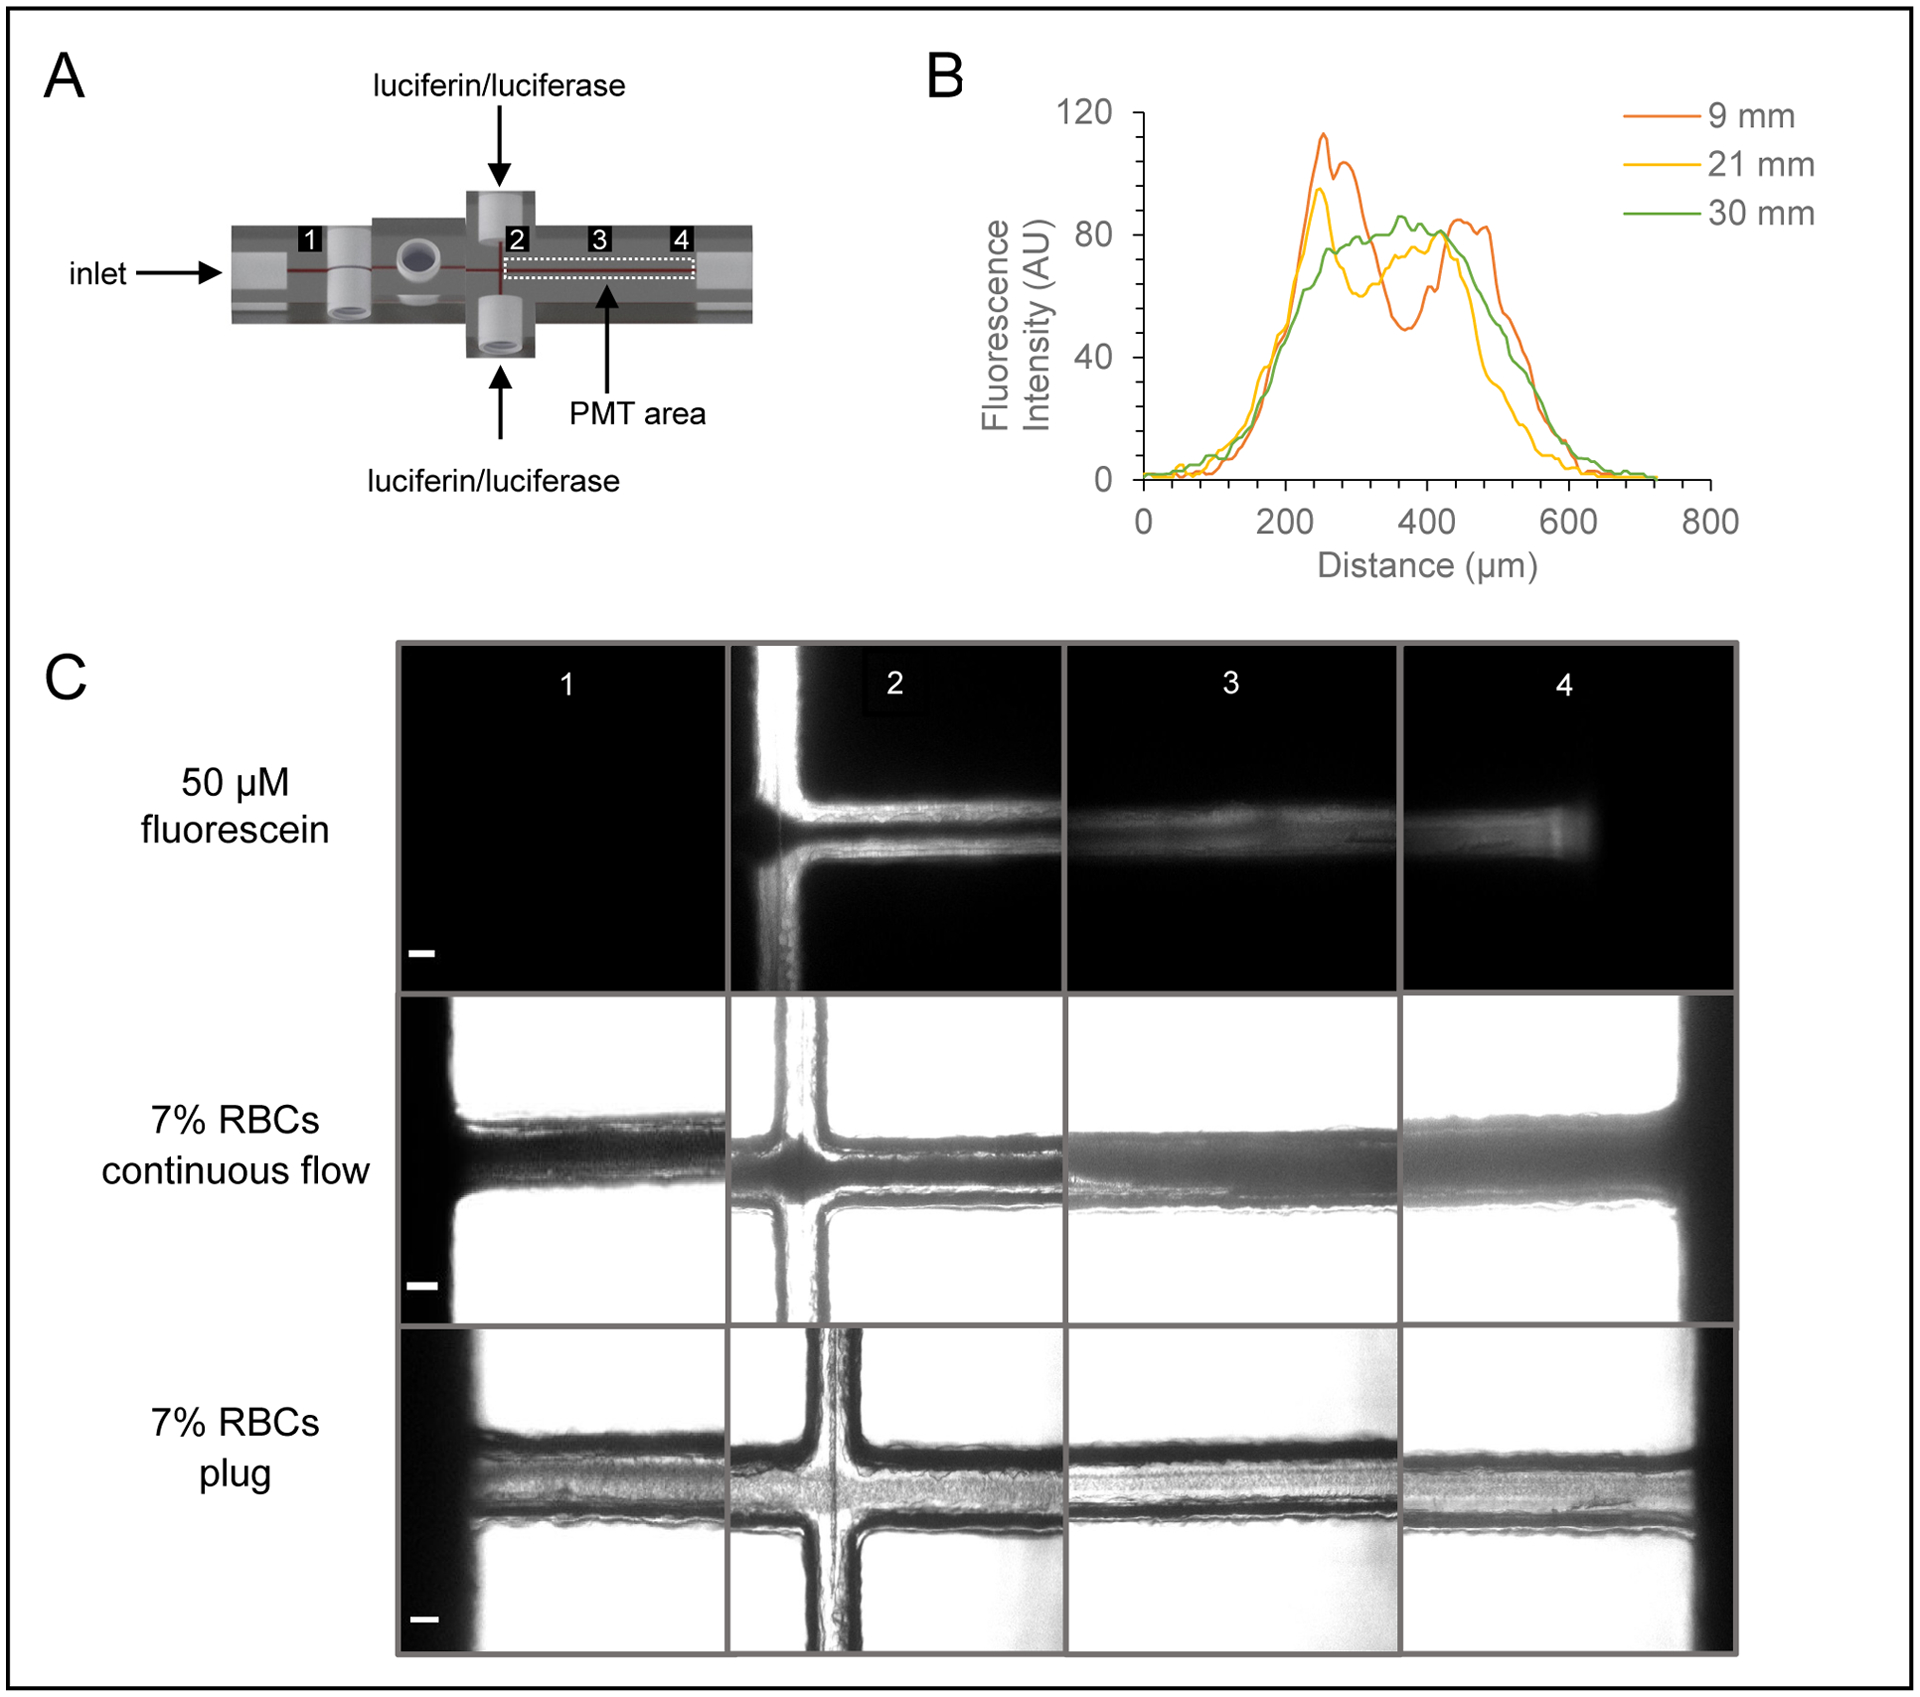
Characterization of mixing in ATP/chemiluminescence portion of the device. A) CAD rendering of the multi-modal, double T device that illustrates the imaging points before and across the mixing channel. B) Graph showing the fluorescence intensity (line scan) across the mixing channel as a function of the distance downstream from the double T intersection. C) Micrographs of fluorescein and RBCs at discrete imaging points before and across the mixing channel (scale bar = 100 μm).
A previous report from our group described a device with a single inlet port for reagent addition and a mixing T for chemiluminescence detection of ATP.46 The design reported here (Figure 1) includes an additional reagent port at a 90 degree angle forming a double mixing T. To compare the two designs, ATP standards (0–2.5 μM) were prepared in PBS and injected into the device. For the single mixing T device (Figure S2), a syringe pump was used to continuously pump reagent through the device at 5 μL/min, while the double mixing T device had two syringe pumps with flow rates of 2.5 μL/min.
Red Blood Cell Studies
Whole blood (40 mL) was collected via venipuncture from healthy human donors into heparinized syringes and centrifuged at 500g and 4°C for 10 minutes. The plasma and buffy coat were removed by aspiration. The remaining RBCs were washed three times with a physiological salt solution (PSS) containing 21.0 mM tris(hydroxymethyl)aminomethane, 4.7 mM KCl, 2.0 mM CaCl2, 140.5 mM NaCl, 1.2 mM MgSO4, 5.5 mM glucose, and 0.5% (w/v) bovine serum albumin, at pH 7.4. RBCs were used for analysis within two days of drawing. When stored overnight, the RBCs were stored in PSS and washed three times in PSS the day of use. RBCs were diluted with PBS to a final hematocrit of 7% prior to injection into the device. Dilution to this hematocrit helped eliminate clogging of tubing and devices and minimized the volume of RBCs needed for each analysis. The drawing of blood followed a protocol approved by the Institutional Review Board of Saint Louis University. Blood was obtained from healthy humans and informed consent was obtained from all volunteers. All record keeping was in compliance with regulations of the Health Insurance Portability and Accountability Act.
All solutions were prepared the day of the experiment. Standard addition curves were created using 1 mL of RBCs and 0–250 μL of NO or ATP stock solution. Special care was taken to protect NO standards and samples from oxidation. Buffer and volumetric flasks used to make NO solutions were sealed with Suba-Seal silicone rubber septa (Millipore-Sigma, St. Louis, MO) and purged of oxygen with argon. A NO stock solution was prepared by bubbling NO gas through deoxygenated PBS for 30 minutes to achieve a saturated concentration of 1.9 mM.50 For standard addition samples, NO was diluted to 95 μM in deoxygenated PBS. An ATP stock solution of 25 μM was made in PBS. The RBC samples were diluted with PBS to a final volume of 1.25 mL and a final hematocrit of 7%. RBC samples were spiked with analytes immediately prior to injection into the device. Normoxic RBCs were diluted in PBS, whereas hypoxic conditions were achieved using oxyrase.44,45 Hypoxic samples were diluted in PBS with 10% oxyrase broth and incubated at room temperature for 30 minutes. For inhibition trials, prior to being exposed to hypoxic conditions, RBCs were incubated with 1 mM L-NAME (N-Nitro-L-arginine methyl ester) for one hour and 250 μM glybenclamide for 30 minutes.
For long-term RBC storage studies, an in-house preparation of an FDA approved storage additive solution (AS-1) that contains 111 mM glucose, 154 mM NaCl, 2 mM adenine, and 41 mM mannitol, at a pH of 5.8 was used for storage of freshly isolated RBCs.51 Packed RBCs were added to AS-1 at a volume ratio of 2:1, resulting in ~60% hematocrit. For each day of analysis, the stored RBCs were diluted with PBS or, for hypoxic conditions, PBS with 10% oxyrase. Standard addition samples were made by mixing 800 μL of the diluted RBCs with 0–200 μL of NO or ATP stock solution and brought to a final volume of 1 mL with PBS (for a final hematocrit of 7%).
Results/Discussion
Device Design
Figures 1 and S1 show the design of the transparent, 3D-printed, multi-modal device used to determine NO and ATP concentrations in the RBC samples. Figure 1A shows a CAD rendering of the microfluidic device. Fluidic connections and electrodes were threaded in the device for assembly as shown in Figure 1B. NO detection occurred as the RBCs flow past the in-line amperometric detector made up of two fabricated electrodes and a commercially available, threaded reference electrode. The working electrode was fabricated using a 100 μm diameter gold wire (coated with Pt-black and Nafion) and the auxiliary was made from a 500 μm platinum wire. Downstream from the amperometric portion of the device, two streams of luciferin/luciferase solution converged with the sample stream to form a double T. The device was placed with the ATP mixing channel directly over a PMT window. The device and its electrodes and tubing were placed in a light excluding box. The device can be assembled in a few minutes and is robust enough to be used for months on end. Parts that wear from use can be replaced without reconstruction of the entire microfluidic set-up. The 3D-printed device and utilization of commercial parts make this device easily transferrable to other labs. The threaded electrodes can easily be removed for repolishing before each run. Both the amperometric and chemiluminescence detection portion of the device were fully characterized and optimized, as described below.
Device Characterization
The multi-modal device was designed so that the sample of interest (in this case, a RBC solution) first encountered electrodes for NO detection. This was needed because chemiluminescence detection of ATP requires the addition of luciferin/luciferase reagents that could dilute the NO and possibly interfere with its detection. This necessitated an in-line electrochemical cell approach, with the three electrodes threading into the device. Amperometric detection of NO is favorable for its temporal resolution, dynamic range, and sensitivity, but to enhance selectivity, electrode modifications are often necessary.33 For this reason, Pt-black was electrodeposited on the electrode surface (Figure 2A). Platinization increases the surface area of the electrode and acts as a catalyst decreasing the potential needed to oxidize the analyte.52,53 To impart selectivity for NO over its oxidation product nitrite, the working electrode was coated with Nafion, a commonly used cation exchange polymer that limits the transport of negatively charged species to an electrode.54 To investigate the use of Nafion for selectivity enhancement, equimolar concentrations of NO and nitrite were injected into the device. The signal for nitrite was only 2% of the signal of NO, suggesting that the nitrite was effectively excluded from the electrode surface (Figure 2B). The average peak heights were 1.68 ± 0.09 nA for NO and 0.036 ± 0.006 nA for nitrite (n=3 injections). The LOD for NO detection was found to be 40 nM. Figure 2C shows the detection of NO from triplicate injections of a 7% RBC solution, with the inset showing the comparison of injecting this solution vs. a 7% RBC solution spiked with 9.5 μM NO.
Because in-channel mixing of the luciferin/luciferase reagents is crucial for the quantitative determination of ATP released from RBCs, this study characterized the mixing throughout the channel of the double mixing T device. The initial single mixing T device was designed to have a single inlet port with a channel positioned at a 90 degree angle (Figure S2), whereas the double mixing T device has two inlet ports on opposite sides of the mixing channel, allowing continuous flow of luciferin/luciferase reagent to improve mixing of the RBCs flowing from the device inlet (Figure 3). To investigate the effect of mixing in these devices, the mixing was imaged at various lengths down the channel (with the points being expressed as 1–4 in Figure 3A). A 50 μM fluorescein solution was continuously pumped through the luciferin/luciferase port, with PBS being pumped through the device inlet. The fluorescence line scan data in Figures 3 and S2 suggests the double mixing T device has significant mixing capability compared to the single mixing T device. At the end of the channel of the double T device, the intensity profile of fluorescein is uniform across the width of the channel, and this contrasts with the line scans of the single mixing T device, which shows that the streams do not completely mix at the same point. To display the mixing that the RBCs experience in the double T device, similar images were taken with plugs of 7% RBCs and continuously flowing 7% RBCs (Figure 3C).
To further characterize the mixing between the two possible designs, ATP was injected at the inlet and luciferin/luciferase reagents were introduced into the mixing T, with the device being placed over a PMT. A calibration curve comparison was made with the single vs. double T designs, with use of the double T leading to more than double the calibration sensitivity (Figure 4A). The sensitivity was also affected by luciferin/luciferase reagent flow rate relative to the sample flow rate (Figure S3). A luciferin/luciferase reagent flow rate of 1.25 μL/min gave the highest response; however, 2.5 μL/min was used in subsequent stories to increase sample throughput and minimize the time between each injection. Using the optimized design and these flow rates resulted in an LOD for ATP of 30 nM. While the sensitivity and LOD were sufficient for these studies, the addition of obstacles or turns to enhance mixing could be used to further improve these figures of merit.55 The chemiluminescent response to injections of 7% solutions of RBCs are shown in Figure 4B, with the inset showing a comparison of injecting a sample spiked with 2.5 μM ATP. To ensure that there was no crosstalk or interference between the two detection modes, an additional calibration comparison experiment was performed, with each analyte being injected separately and then calibration curves made from injecting mixtures containing both analytes. The selectivity of each method is illustrated in nearly identical calibration curves of ATP and NO-spiked ATP samples as well as NO and ATP-spiked NO samples (Figure S4).
Figure 4.
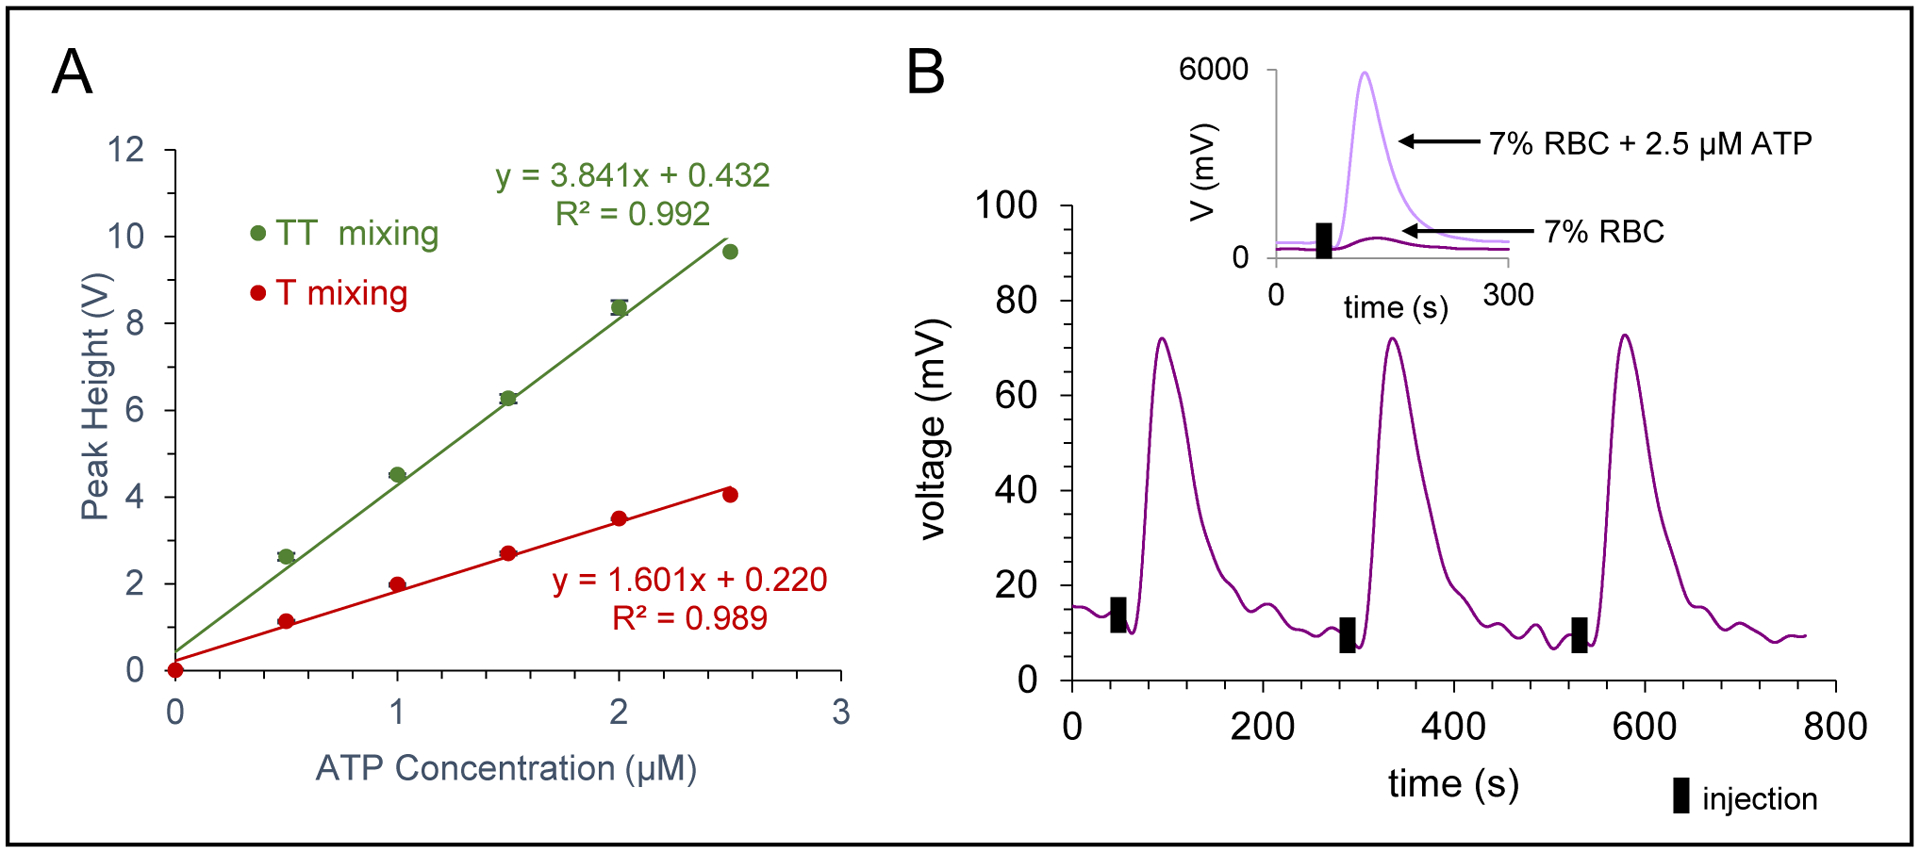
Characterization of ATP detection. A) Effect of mixing device (single T vs. double T) on the calibration sensitivity, with a significant increase seen for the double T mixing device. B) Chemiluminescence trace for ATP detection of a 7% RBC sample (triplicate injections). Inset shows trace for injection of 7% RBC sample and an overlay of a 7% RBC sample spiked with 2.5 μM ATP.
RBC Studies
With the optimized design and parameters, buffer/injection plugs were pumped through the inlet of the device at 15 μL/min and luciferin/luciferase was pumped from two syringes at a rate of 2.5 μL/min (to each side channel). In the range of 550–570 nm, which is the maximum emission wavelengths of the luciferin/luciferase reaction, deoxygenated hemoglobin absorbs more light than oxygenated hemoglobin.56 Therefore, the chemiluminescent signal of ATP in hypoxic samples is attenuated relative to that in normoxic samples (Figure S5). For this reason, separate standard curves were performed to quantitate the amount of ATP in normoxic vs. hypoxic samples. To account for any matrix effects, the method of standard addition was used to quantitate the NO and ATP for all the RBC studies.
The optimized multi-modal device was used to quantitate the concentrations of RBC-derived NO and ATP in both normoxic and hypoxic samples (Figure 5). Injections of normoxic RBCs (7% hematocrit) resulted in 0.6 ± 0.2 μM NO (n=11) and 190 ± 20 nM ATP (n=10) (values reported as averages ± standard error of the mean). It is well documented that RBCs release NO and ATP in response to hypoxia.4–6,31,32 With each donation, the RBCs were also exposed to hypoxic conditions (via incubation with oxyrase) and the RBC solution injected into the device. Oxyrase is reported to decrease oxygen levels to approximately 3%.44 It was found that hypoxic RBCs released more NO (5.0 ± 0.9 μM, p<0.0002 vs. normoxic samples, Figure 5A) and these values are in line with Halpin et al. who measured NO release in hypoxic RBCs with a fluorescent probe.44 The release of NO could be inhibited by L-NAME (an inhibitor of NO synthase25,57). Hypoxic RBCs that were exposed to L-NAME for one hour before being exposed to hypoxic conditions released an average of 1.0 μM less NO than the non-inhibited hypoxic sample (for an average of 4.0 ± 0.8 μM NO, p<0.0004). In the same experiments, ATP release from the RBCs was measured under normoxic and hypoxic conditions. Normoxic ATP concentrations are dependent upon method used to stimulate the release and solution hematocrit. Generally accepted values are in the hundreds of nanomolar range.12,17,21,58–62 Here (Figure 5B), normoxic RBCs released 190 ± 20 nM ATP, significantly less than the ATP concentration from cells exposed to hypoxia (470 ± 50 nM, p<0.0006 vs. normoxic samples). The amount of ATP released from hypoxic RBCs could be inhibited by exposing the cells to glybenclamide (a cystic fibrosis transmembrane regulator inhibitor7,62,63), with the amount of ATP released by inhibited cells that were then exposed to hypoxic conditions decreasing by 80 nM to 390 ± 50 nM (p<0.0002 vs. non-inhibited hypoxic samples). These studies clearly show the ability of the 3D-printed device to robustly measure NO and ATP from RBCs exposed to a variety of conditions.
Figure 5.
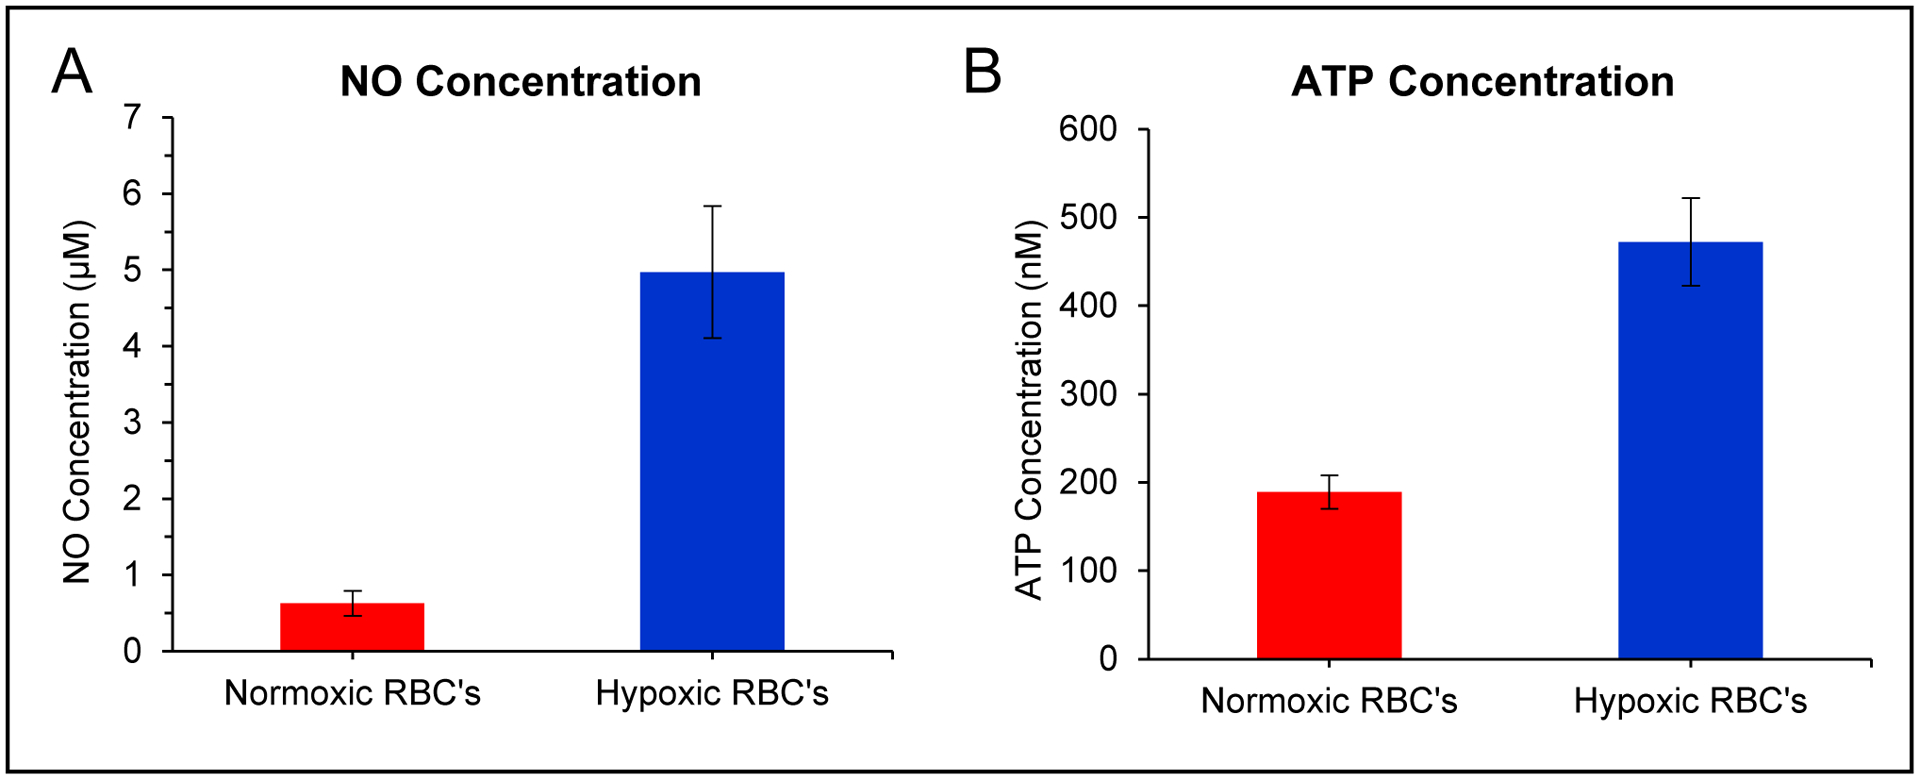
Use of multi-modal device to quantitate NO and ATP release from healthy RBCs. A) Bar graph showing average NO concentrations from normoxic and hypoxic RBCs (7% solution, n=11 different donations, error = SEM). B) Bar graph showing average ATP concentrations from normoxic and hypoxic RBCs (7% solution, n=10 different donations, error = SEM).
Blood Storage Study
FDA approved additive solution 1 (AS-1) is widely used for long term storage of RBCs.51 Recently, researchers have investigated the effect of this storage solution on RBC function.64,65 AS-1 has a glucose concentration of 111 mM prior to the addition of RBCs and remains over 25 mM even after the addition of the cell, a value that is a much greater than the glucose levels in vivo (5.5 mM). These hyperglycemic conditions could contribute to advanced glycation end-products and increased cell rigidity reported in stored RBCs.65 The multi-modal device was used to measure the concentration of NO and ATP from a RBC sample that was stored in AS-1 over the course of three weeks. Both basal (normoxic) RBCs and RBCs exposed to hypoxic conditions on the day of analysis were injected into the device and the NO and ATP values determined via standard additions. The data in Figure 6 shows an increase of NO concentration between day 1 and 8 that decreases close to initial levels by day 15. Hypoxic conditions always led to an increase in NO release (Figure 6A). Similar to prior reports, ATP levels in stored RBC solutions decreased over time.64–66 Hypoxia-induced ATP release occurred up to day 8, but after two weeks of storage, no release of ATP was observed under hypoxic conditions (Figure 6B). While the health and function of stored RBC solutions cannot simply be based on NO and ATP levels alone, the change between day 8 and day 15 for both NO and ATP release could be further investigated to determine what is mechanistically different and whether these changes may be contributing to the transfusion complications found in cases with blood that has been stored for over two weeks.67,68 In addition, the type of device developed here could be used to investigate the use of normoglycemic solutions (4–6 mM) for long-term RBC storage.64,69
Figure 6.
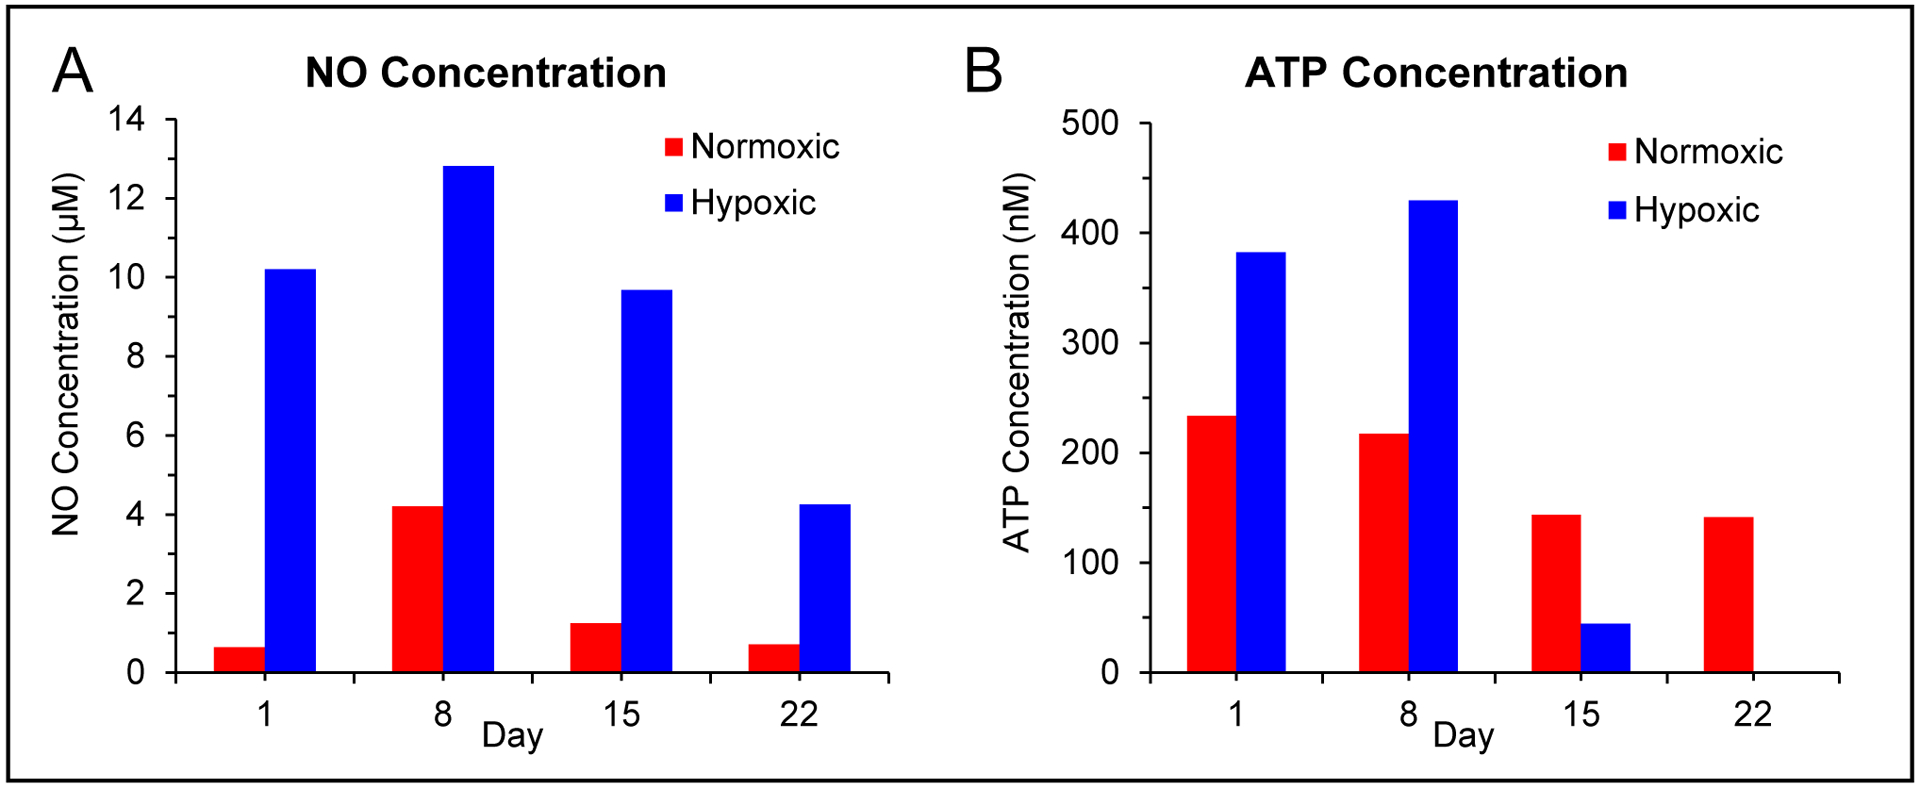
Use of multi-modal device to investigate the effect of an approved storage solution on NO and ATP release from a single RBC sample under normoxic and hypoxic conditions over the course of 3 weeks. A) Bar graph showing average NO concentrations from normoxic and hypoxic RBCs (7% solution) as a function of the storage day (stored RBCs were exposed to hypoxic conditions on the day of analysis). B) Bar graph showing average ATP concentrations from normoxic and hypoxic RBCs (7% solution) as a function of the storage day (stored RBCs were exposed to hypoxic conditions on the day of analysis).
Conclusion
In this work, a multi-modal, 3D-printed device was developed to measure NO (via amperometry) and ATP (via chemiluminescence) release from RBCs. The device was fully characterized and optimized, with the final iteration being able to determine the concentrations of NO and ATP from RBCs in a variety of conditions (normoxic, hypoxic, and long-term storage solutions). Near real-time analysis of flowing RBCs provides a more accurate representation of the NO and ATP levels RBCs experience in vivo. This type of robust device opens new possibilities for studying NO and ATP interdependence, especially in diseased RBCs since in autoimmune diseases, patients are found to have abnormal levels or behavior in terms of NO and ATP.70–73 This multi-modal device has the potential to study any electrochemically active analyte and could be paired with cell culture to study cell-to-cell interactions, for example, how hypoxic RBCs stimulate endothelial cells and the interplay between RBCs and endothelial cells on NO production.
Supplementary Material
Acknowledgments
The authors would like to acknowledge Dr. Randy Sprague (Department of Pharmacology and Physiology at Saint Louis University) for providing access to red blood cells and to Saint Louis University’s Center for Additive Manufacturing (SLU-CAM) for providing access to the Stratasys PolyJet printers. The research was funded by the National Institutes of Health (1R01NS105888-01).
References
- 1.Sender R, Fuchs S and Milo R, PLoS Biol, 2016, 14, e1002533. [DOI] [PMC free article] [PubMed] [Google Scholar]
- 2.Weed RI, Reed CF and Berg G, J Clin Invest, 1963, 42, 581–588. [DOI] [PMC free article] [PubMed] [Google Scholar]
- 3.Ellsworth ML, Acta Physiol Scand, 2000, 168, 551–559. [DOI] [PubMed] [Google Scholar]
- 4.Ellsworth ML, Ellis CG, Goldman D, Stephenson AH, Dietrich HH and Sprague RS, Physiology, 2009, 24, 107–116. [DOI] [PMC free article] [PubMed] [Google Scholar]
- 5.Bergfeld GR and Forrester T, Cardiovasc Res, 1992, 26, 40–47. [DOI] [PubMed] [Google Scholar]
- 6.Cosby K, Partovi KS, Crawford JH, Patel RP, Reiter CD, Martyr S, Yang BK, Waclawiw MA, Zalos G, Xu X, Huang KT, Shields H, Kim-Shapiro DB, Schechter AN, Cannon RO 3rd and Gladwin MT, Nat Med, 2003, 9, 1498–1505. [DOI] [PubMed] [Google Scholar]
- 7.Sprague RS, Ellsworth ML, Stephenson AH, Kleinhenz ME and Lonigro AJ, Am J Physiol, 1998, 275, H1726–H1732. [DOI] [PubMed] [Google Scholar]
- 8.Edwards J, Sprung R, Spence D and Sprague R, Analyst, 2001, 126, 1257–1260. [DOI] [PubMed] [Google Scholar]
- 9.Ellsworth ML, Forrester T, Ellis CG and Dietrich HH, Am J Physiol, 1995, 269, H2155–H2161. [DOI] [PubMed] [Google Scholar]
- 10.McCullough WT, Collins DM and Ellsworth ML, Am J Physiol, 1997, 272, H1886–H1891. [DOI] [PubMed] [Google Scholar]
- 11.Miseta A, Bogner P, Berenyi E, Kellermayer M, Galambos C, Wheatley DN and Cameron IL, Biochimica et Biophysica Acta, 1993, 1175, 133–139. [DOI] [PubMed] [Google Scholar]
- 12.Castiaux AD, Pinger CW, Hayter EA, Bunn ME, Martin RS and Spence DM, Anal Chem, 2019, 91, 6910–6917. [DOI] [PMC free article] [PubMed] [Google Scholar]
- 13.Xie PJ, Ye ML, Hu ZY, Pan GW, Zhu Y and Zhang JJ, Chin. Chem. Lett, 2011, 22, 1485–1488. [Google Scholar]
- 14.Aragon-Martinez OH, Galicia O, Isiordia-Espinoza MA and Martinez-Morales F, Tohoku J Exp Med, 2014, 233, 205–214. [DOI] [PubMed] [Google Scholar]
- 15.He L, Wei X, Ma X, Yin X, Song M, Donninger H, Yaddanapudi K, McClain CJ and Zhang X, J Am Soc Mass Spectrom, 2019, 30, 987–1000. [DOI] [PMC free article] [PubMed] [Google Scholar]
- 16.Li F, Hu X, Wang F, Zheng B, Du J and Xiao D, Talanta, 2018, 179, 285–291. [DOI] [PubMed] [Google Scholar]
- 17.Nishiyama K, Mizukami R, Kuki S, Ishida A, Chida J, Kido H, Maeki M, Tani H and Tokeshi M, Biosens Bioelectron, 2022, 198, 113832. [DOI] [PubMed] [Google Scholar]
- 18.Racine ML and Dinenno FA, J Physiol, 2019, 597, 4503–4519. [DOI] [PMC free article] [PubMed] [Google Scholar]
- 19.Kirby BS, Sparks MA, Lazarowski ER, Lopez Domowicz DA, Zhu H and McMahon TJ, Am J Physiol Heart Circ Physiol, 2021, 320, H1055–H1065. [DOI] [PMC free article] [PubMed] [Google Scholar]
- 20.Montalbetti N, Leal Denis MF, Pignataro OP, Kobatake E, Lazarowski ER and Schwarzbaum PJ, J Biol Chem, 2011, 286, 38397–38407. [DOI] [PMC free article] [PubMed] [Google Scholar]
- 21.Price AK, Martin RS and Spence DM, J Chromatogr A, 2006, 1111, 220–227. [DOI] [PubMed] [Google Scholar]
- 22.Tomaiuolo G, Biomicrofluidics, 2014, 8, 051501. [DOI] [PMC free article] [PubMed] [Google Scholar]
- 23.Ignarro LJ, Buga GM, Wood KS, Byrns RE and Chaudhuri G, Proc. Natl. Acad. Sci. U.S.A, 1987, 84, 9265–9269. [DOI] [PMC free article] [PubMed] [Google Scholar]
- 24.Palmer RM, Ferrige AG and Moncada S, Nature, 1987, 327, 524–526. [DOI] [PubMed] [Google Scholar]
- 25.Moncada S, Palmer RM and Higgs EA, Pharmacol Rev, 1991, 43, 109–142. [PubMed] [Google Scholar]
- 26.Bogle RG, Coade SB, Moncada S, Pearson JD and Mann GE, Biochem Biophys Res Commun, 1991, 180, 926–932. [DOI] [PubMed] [Google Scholar]
- 27.Eligini S, Porro B, Lualdi A, Squellerio I, Veglia F, Chiorino E, Crisci M, Garlasche A, Giovannardi M, Werba JP, Tremoli E and Cavalca V, PLoS One, 2013, 8, e66945. [DOI] [PMC free article] [PubMed] [Google Scholar]
- 28.Cortese-Krott MM and Kelm M, Redox Biol, 2014, 2, 251–258. [DOI] [PMC free article] [PubMed] [Google Scholar]
- 29.Jubelin BC and Gierman JL, Am. J. Hypertens, 1996, 9, 1214–1219. [DOI] [PubMed] [Google Scholar]
- 30.Kleinbongard P, Schulz R, Rassaf T, Lauer T, Dejam A, Jax T, Kumara I, Gharini P, Kabanova S, Ozuyaman B, Schnurch HG, Godecke A, Weber AA, Robenek M, Robenek H, Bloch W, Rosen P and Kelm M, Blood, 2006, 107, 2943–2951. [DOI] [PubMed] [Google Scholar]
- 31.Nagababu E, Ramasamy S, Abernethy DR and Rifkind JM, J Biol Chem, 2003, 278, 46349–46356. [DOI] [PubMed] [Google Scholar]
- 32.Webb AJ, Milsom AB, Rathod KS, Chu WL, Qureshi S, Lovell MJ, Lecomte FM, Perrett D, Raimondo C, Khoshbin E, Ahmed Z, Uppal R, Benjamin N, Hobbs AJ and Ahluwalia A, Circ Res, 2008, 103, 957–964. [DOI] [PMC free article] [PubMed] [Google Scholar]
- 33.Hetrick EM and Schoenfisch MH, Annu Rev Anal Chem, 2009, 2, 409–433. [DOI] [PMC free article] [PubMed] [Google Scholar]
- 34.Giustarini D, Dalle-Donne I, Colombo R, Milzani A and Rossi R, Free Radic Res, 2004, 38, 1235–1240. [DOI] [PubMed] [Google Scholar]
- 35.Godino N, Gorkin R 3rd, Linares AV, Burger R and Ducree J, Lab Chip, 2013, 13, 685–694. [DOI] [PubMed] [Google Scholar]
- 36.Rogers SC, Khalatbari A, Gapper PW, Frenneaux MP and James PE, J Biol Chem, 2005, 280, 26720–26728. [DOI] [PubMed] [Google Scholar]
- 37.Nagababu E and Rifkind JM, Free Radic Biol Med, 2007, 42, 1146–1154. [DOI] [PMC free article] [PubMed] [Google Scholar]
- 38.Wang Y and Yin M, Microchimica Acta, 2009, 166, 243–249. [Google Scholar]
- 39.Suriany S, Xu I, Liu H, Ulker P, Fernandez GE, Sposto R, Borzage M, Wenby R, Meiselman HJ, Forman HJ, Coates TD and Detterich JA, Free Radic Biol Med, 2021, 171, 143–155. [DOI] [PubMed] [Google Scholar]
- 40.Malinski T, Radomski MW, Taha Z and Moncada S, Biochem Biophys Res Commun, 1993, 2, 960–965. [DOI] [PubMed] [Google Scholar]
- 41.Goto M and Mochizuki S, Med Biol Eng Comput, 2008, 46, 509–516. [DOI] [PubMed] [Google Scholar]
- 42.Park SS, Hong M, Song C, Jhon GJ, Lee Y and Suh M, Anal Chem, 2010, 82, 7618–7624. [DOI] [PubMed] [Google Scholar]
- 43.Hunter RA, Privett BJ, Henley WH, Breed ER, Liang Z, Mittal R, Yoseph BP, McDunn JE, Burd EM, Coopersmith CM, Ramsey JM and Schoenfisch MH, Anal Chem, 2013, 85, 6066–6072. [DOI] [PMC free article] [PubMed] [Google Scholar]
- 44.Halpin ST and Spence DM, Anal Chem, 2010, 82, 7492–7497. [DOI] [PubMed] [Google Scholar]
- 45.Selimovic A, Erkal JL, Spence DM and Martin RS, Analyst, 2014, 139, 5686–5694. [DOI] [PMC free article] [PubMed] [Google Scholar]
- 46.Hayter EA, Castiaux AD and Martin RS, Anal. Methods, 2020, 12, 2046–2051. [DOI] [PMC free article] [PubMed] [Google Scholar]
- 47.Currens ER, Armbruster MR, Castiaux AD, Edwards JL and Martin RS, Anal. Bioanal. Chem, 2022, 414, 3329–3339. [DOI] [PMC free article] [PubMed] [Google Scholar]
- 48.Rimington RP, Capel AJ, Player DJ, Bibb RJ, Christie SDR and Lewis MP, Macromol. Biosci, 2018, 18, 1800113. [DOI] [PubMed] [Google Scholar]
- 49.Erkal JL, Selimovic A, Gross BC, Lockwood SY, Walton EL, McNamara S, Martin RS and Spence DM, Lab Chip, 2014, 14, 2023–2032. [DOI] [PMC free article] [PubMed] [Google Scholar]
- 50.Shin JH, Privett BJ, Kita JM, Wightman RM and Schoenfisch MH, Anal. Chem, 2008, 80, 6850–6859. [DOI] [PMC free article] [PubMed] [Google Scholar]
- 51.Harris SB and Hillyer CD, in Blood banking and transfusion medicine: basic principles & practice, eds. Hillyer CD, Silberstein LE, Ness PM, Anderson KC and Roback JD, Churchill Livingstone, Philadelphia, Editon edn., 2007, pp. 183–204. [Google Scholar]
- 52.Lee Y, Oh BK and Meyerhoff ME, Anal Chem, 2004, 76, 536–544. [DOI] [PubMed] [Google Scholar]
- 53.Privett BJ, Shin JH and Schoenfisch MH, Chem Soc Rev, 2010, 39, 1925–1935. [DOI] [PMC free article] [PubMed] [Google Scholar]
- 54.Selimovic A and Martin RS, Electrophoresis, 2013, 34, 2092–2100. [DOI] [PMC free article] [PubMed] [Google Scholar]
- 55.Ward K and Fan ZH, J Micromech Microeng, 2015, 25, 094001. [DOI] [PMC free article] [PubMed] [Google Scholar]
- 56.Townsend D, D’Aiuto F and Deanfield J, J Med Biol Eng, 2014, 34, 172–177. [Google Scholar]
- 57.Sprague RS, Stephenson AH, Dimmitt RA, Weintraub NL, McMurdo L and Lonigro AJ, Am J Physiol, 1995, 270, H1941–H1948. [DOI] [PubMed] [Google Scholar]
- 58.Moehlenbrock MJ, Price AK and Martin RS, Analyst, 2006, 131, 930–937. [DOI] [PubMed] [Google Scholar]
- 59.Carroll JS, Ku C, Karunarathne W and Spence DM, Anal Chem, 2007, 79, 5133–5138. [DOI] [PubMed] [Google Scholar]
- 60.Wan J, Ristenpart WD and Stone HA, Proc. Natl. Acad. Sci. U.S.A, 2008, 105, 16432–16437. [DOI] [PMC free article] [PubMed] [Google Scholar]
- 61.Mortensen SP, Thaning P, Nyberg M, Saltin B and Hellsten Y, J Physiol, 2011, 589, 1847–1857. [DOI] [PMC free article] [PubMed] [Google Scholar]
- 62.Cinar E, Zhou S, DeCourcey J, Wang Y, Waugh RE and Wan J, Proc. Natl. Acad. Sci. U.S.A, 2015, 112, 11783–11788. [DOI] [PMC free article] [PubMed] [Google Scholar]
- 63.Faris A and Spence DM, Analyst, 2008, 133, 678–682. [DOI] [PubMed] [Google Scholar]
- 64.Wang Y, Giebink A and Spence DM, Integr Biol, 2014, 6, 65–75. [DOI] [PubMed] [Google Scholar]
- 65.Liu Y, Hesse LE, Geiger MK, Zinn KR, McMahon TJ, Chen C and Spence DM, Lab Chip, 2022, 22, 1310–1320. [DOI] [PMC free article] [PubMed] [Google Scholar]
- 66.Hess JR, Transfus Apher Sci, 2010, 43, 51–59. [DOI] [PubMed] [Google Scholar]
- 67.Koch CG, Li L, Sessler DI, Figueroa P, Hoeltge GA, Mihaljevic T and Blackstone EH, N Engl J Med, 2008, 358, 1229–1239. [DOI] [PubMed] [Google Scholar]
- 68.Wang D, Sun J, Solomon SB, Klein HG and Natanson C, Transfusion, 2012, 52, 1184–1195. [DOI] [PMC free article] [PubMed] [Google Scholar]
- 69.Mu R, Chen C, Wang Y and Spence DM, Anal. Methods, 2016, 8, 6856–6864. [Google Scholar]
- 70.Johnson AW, Land JM, Thompson EJ, Bolaños JP, Clark JB and Heales SJ, J Neurol Neurosurg Psychiatry, 1995, 58, 107. [DOI] [PMC free article] [PubMed] [Google Scholar]
- 71.Carroll J, Raththagala M, Subasinghe W, Baguzis S, D’Amico Oblak T, Root P and Spence D, Mol Biosyst, 2006, 2, 305–311. [DOI] [PubMed] [Google Scholar]
- 72.Ghiran IC, Zeidel ML, Shevkoplyas SS, Burns JM, Tsokos GC and Kyttaris VC, Arthritis Rheum, 2011, 63, 503–512. [DOI] [PMC free article] [PubMed] [Google Scholar]
- 73.Janes TM and Spence DM, Anal. Methods, 2018, 10, 3416–3422. [Google Scholar]
Associated Data
This section collects any data citations, data availability statements, or supplementary materials included in this article.


