

Abstract
Advances in human sequencing technologies, coupled with statistical and computational tools, have fostered the development of methods for dating admixture events. These methods have merits and drawbacks in estimating admixture events in multi-way admixed populations. Here, we first provide a comprehensive review and comparison of current methods pertinent to dating admixture events. Second, we assess various admixture dating tools. We do so by performing various simulations. Third, we apply the top two assessed methods to real data of a uniquely admixed population from South Africa. Results reveal that current dating admixture models are not sufficiently equipped to estimate ancient admixtures events and to identify multi-faceted admixture events in complex multi-way admixed populations. We conclude with a discussion of research areas where further work on dating admixture-based methods is needed.
Keywords: admixture, dating admixture event, genome, proxy ancestry
Introduction
The history of human evolution is characterized by the exchange of genetic materials across individuals, resulting in individuals with unique genetic features. Through decades, human evolution has commonly been analyzed and dated using radiocarbon from materials associated with human fossils [1]. However, advanced high-throughput technologies have continuously enabled the dating of the human evolution through DNA. The DNA dating of the earliest modern human fossils in Eurasia has contributed to comprehend the modern human migration out of Africa [2–6]. The study of human genetic variation has evolved over time due to the observation of different traits among individuals in several population groups around the globe. One of the features of human evolution is the migrations of populations from one place to another, which yields human mixture [2, 3], referred to as admixture, resulting from interbreeding between two or more previously isolated populations. This interbreeding yields genetic recombination breakpoints and the formation of variations and mixed DNA segments. There is a great interest in understanding the dynamics related to the origin of these variations, the evolution process and its consequences in human healthcare.
Today, there exists various methods for dating admixture events, and these current approaches are grouped in the following two main categories (Table 1): the linkage disequilibrium (LD)-based [7, 8] and the haplotype-based/ancestry block-size distribution (or tract length)-based [9–12] dating admixture approaches. Although these methods have been tested using putative available data either from the HapMap [13] or from the 1000 Genomes Project [14], few have not been sufficiently tested on complex multi-way admixed populations such as admixed populations of more than three genetic ancestral populations within several admixture events. As a result, the performance of these methods under such complex admixture makeup remains largely unknown or, at best, poorly characterized.
Table 1 .
Current dating admixture genomic tools
Here, we aim at providing a broad and comprehensive review of current methods pertinent to dating admixture events. We assess various admixture dating tools, which estimate the time of admixture. We do so by performing various simulations assuming a particular number of generations and use these to evaluate the tools. Finally, we apply the top two assessed methods to a uniquely complex admixed population from South Africa. We conclude with a discussion of research areas where further work on dating admixture-based methods is needed.
Understanding complex admixture
Recently, sequencing of ancient DNA from archaic humans has revealed signals of shared ancestry between modern and archaic human groups [15]. Since then, it becomes critical to understand what modern humans obtained from the admixture between archaic human groups, particularly if phenotypic variation observed among present-day human populations can find explanation from the archaic human introgression.
The divergence of genetic ancestry has come about as a result of the following: (1) biogeographical distributions of human populations [15, 16] and (2) interbreeding between two or more previously isolated populations. During admixture processes, the chromosomes of the new generation contain continuous blocks inherited from parental populations that breakdown through successive generations. The chromosome of the descendant displays a pattern of chromosomal segments (or blocks) of different ancestry with different sizes that may provide some information about the geological time of the admixture events [5, 9, 10].
Recent population studies revealed that many world populations are admixed, and the complexity of the admixture became more complex from one generation to another [7, 17, 18]. Figure 1 shows an approximation and partial world-wide painting of admixture. This distribution of admixture at the genetic level and/or along the genome of admixed individual can exhibit a pattern of single-nucleotide polymorphisms (SNPs), which may have either medical or evolutionary implications.
Figure 1 .

A partial world-wide admixture painting map. Figure shows several world-wide admixed populations. We have identified these patterns of admixture through published paper on population structure from 2008 to 2018.
Over the past decade, studies of admixed populations have increasingly gained interest of population geneticists because of the inference of population history and the past demographic processes. Studies of the admixture patterns in human populations have contributed to a wide range of biomedical applications from the identification of both local selection and genetic variants underlying ethnic difference in disease risk to the understanding of human history [19]. These studies have so far contributed in the understanding of patterns of the genetic variation throughout modern human evolution and have improved the understanding of the demographics and adaptive processes of human populations. Today, the advance in technologies has further facilitated the movement of people around the globe, therefore this may increase the complexity of population admixture dynamics [7], resulting in multi-faceted admixture events.
The richer mixture of SNPs in admixed populations is likely to contribute to wider phenotypic variability and difference in response to drug therapies within these populations. This is a component that is being missed in traditional studies of homogeneous populations [20]. A critical implication of the degree of admixture/traits association is that admixed populations are likely to complicate genetic and clinical assessments of their conditions [20, 21]. Accordingly, understanding the structure of human genetic admixture is not only of anthropological relevance, but also of medical necessity. Admixture is also of great relevance to clinical applications related to pharmacogenetics and personalized medicine [17, 18]. For an improved understanding of the human admixture, the dynamics of associated admixture events need to be detected, quantified and dated. In the next section, we discuss current techniques used to age the admixture events.
Genome-based dating admixture events
To date, advances in high-throughput sequencing and genotyping technologies, combined with the appropriate computational and statistical methods have made feasible the inference of the admixture history of human populations [22, 23]. Consequently, ancient DNA analyses have transformed research [24–30] into human evolutionary history, making it possible to observe the patterns of human genetic variation that existed in the past [1]. The distribution of ancestral chromosomal segments, the pattern of LD, the length of ancestral tracks and the recombination breakpoints in human genome can provide information about the age of admixture [9, 31]. This can elucidate several genetics events such as the signature of natural selection, heritable genes with associations to diseases, drug response [32] and the age of mutation in local ancestry at a fine scale [33]. The inference of both genetic ancestry through high-throughput sequencing and genotyping data has enhanced the development of recent approaches for dating admixture events [22, 23], mutation and polygenic adaptation selection [34]. Dating past admixture events has become one of the focuses of research for population geneticists because of its implications in human migration studies and, therefore, patterns of heritable traits. LD and the distribution of ancestry segment tracks in the genome of the mixed-ancestry individual are used to infer distinct date of admixture events [9, 35].
A range of methods have been developed to date admixture events through the genome of admixed individuals. Some methods estimate the date of admixture from the break points of ancestry blocks. Other approaches define ancestry blocks either using simple empirical criteria, the differential presence of population-specific variants, assigning ancestry for predefined genomic windows using conditional random fields or wavelet transform to obtain an indirect measure of the average admixture block length. Another set of approaches estimate the date of admixture by defining the switch of ancestry segments though searching for rapid decays in LD [36]. Although the estimation of time since admixture occurred is highly dependent on the models being used, most of these methods have shown to be accurate for recent admixture when using well-separated proxy ancestral populations of the admixed population under study. However, reconstructing complex demographic features for much older admixture events (i.e. thousands rather than hundreds of years in the past) remains extremely challenging [36]. Overall, approaches for dating admixture events can broadly be clustered into the following two main categories (Table 1): (1) LD-based approach and (2) haplotypes/ancestry block size distribution-based approaches. Dating admixture events is currently a complex topic; below we will broadly discuss a partial list of dating admixture events approaches.
LD-based approach
During the admixture process, gene flow between proxy ancestral populations in the admixed populations creates LD relative to these ancestral populations. The rate of decay of such created LD depends on the proportion of admixture, the recombination rate and the time since admixture occurred. Various methods have used the rate of decay of such LD to infer the age of admixture event. Initially introduced by Moorjani and colleagues in 2011 [36], to compute the weighted correlation between a pair of SNPs (Box 1) that reveals their allele frequency differentiation in the proxy ancestral populations [8]. The method obtains an estimate of the time since admixture happened by exploring the change in this correlation with increasing the genetic distance among these markers and further fits an exponential distribution to the decay of the correlation using the least-square model (Box 1). In 2013, Loh et al. [7] extended the work of Moorjani and colleagues [36] in improving the computation with the use of fast Fourier transform and the comparison of single, two reference curves to decide the minimum distance for fitting the exponential (Box 1). This introduces an improvement to the work of Moorjani and colleagues by removing the bias in estimating the date of admixture event and makes the computation less expensive, relating the admixture proportion to the amplitude in the exponential decay fit [7, 36]. Thereafter, Pickrell et al. [37], in 2014, extended the method suggested by Loh et al. [7] to introduce a mixture exponential decay model that addresses multiple admixture events (Box 1) in the population history using the decay of LD.
Box 1 .

Linkage disequilibrium-based approach.
To illustrate how the multiple weighted correlation coefficient is computed, let us consider A1, A2 and A3 as the three proxy ancestral populations and B as the admixed population from A1, A2 and A3. The improved method by Pickrell et al. [37] computes the weighted LD for all possible pairwise proxy ancestral populations. Given  ,
,  and
and  , the weighted LD was computed based on Loh et al. [7] from all pair of SNPs between populations namely A1 and A2, A1 and A3 and A2 and A3, respectively, in the admixed population B. Thus, the multiple weighted correlation coefficient is given by the following:
 |
(1) |
After computing the multiple weighted correlation coefficient, the date of admixture between A1 and A3, accounting for the effect of the admixtures A1-A2 and A2-A3, in which case there is only one exponential based term, two admixture dates that exhibit the date between A1 and A3 and an admixture event that has occurred either between A1 and A2 or between A2 and A3, in which case, there is a second exponential based term associated with the second admixture date, explicitly defined as follows:
 |
(2) |
where  and
and  are the number of generations and
  is the genetic distance in centiMorgan,
  is the affine term and
  and
and  the amplitude of the multiple weighted LD curve.
There exists two possible type of admixture LD, which include the following: (i) LD produced by admixture itself and (ii) LD inherited from ancestral populations (ancLD). It is reasonable that the use of weighted LD may help decrease the effects of ancLD. Most of these LD-based dating admixture approaches use starting distance to confirm that the ancLD’s effect is small enough. LD-based dating admixture approaches have undergone several years of development and improvement, and today weighted LD-based algorithms are robust in approaches used for dating admixture. As a result, inaccuracies in local ancestry from complex multi-way admixed populations are still one of the main challenges in studying genetic ancestry [38]. Since weighted LD can be calculated based on genotype data [39], the LD-based methods currently have advantage over haplotypes/ancestry block size distribution-based approaches (see details below) to avoid the risk of phasing errors and local ancestry inference errors.
The implemented LD-based method in both ROLLOFF [8] and ALDER [39] can only date admixture events under the hybrid isolation (HI) model; however, the recent version of ALDER (MALDER) can date the admixture events based on multiple-way and multiple-wave models [39], which is potentially the most powerful model as it can derive the proxy ancestral populations for each wave of admixture. Recently, Zhou et al. [40] introduced an alternative approach (approach implemented in iMAAPs) to reduce the ancLD’s effect using the combination proxy reference populations and weighted ancLD. iMAAPs can infer the multiple-wave admixture, but it is still under the two-way admixture model [40]. Moreover, to allow possible isolation after a certain duration of continuous gene flow (CGF), Zhou et al. [40] extended the continuous admixture model including gradual admixture (GA) and CGF models in CAMer [41] to GA-Isolation and CGF-Isolation by considering isolation after admixture [41].
Haplotypes/ancestry block size distribution-based approach
In 2009, Price et al. [35] introduced a likelihood approach that leverages Hidden Markov model (HMM) to compute the number of ancestry transitions, referred to as the number of breakpoints. This approach determines whether the admixed descendant has 0, 1 or 2 of alleles of a particular ancestry at a given locus by viewing each haplotype block as a representative sample from the predefined ancestry and computes the likelihood of the haplotypes of the admixed individual coming from one reference population versus others. Using an HMM assumption for a given state, the referred likelihood of an observed allele in an admixed individual genome is given by
 |
(3) |
where  , i = 1,2,3 are the mutation parameters;
  is the offspring chromosomal haplotype site;
  denotes if at genotyped SNPs, an individual
  from the offspring
  copies a segment of genome from a reference population
  and
and  is the probability for a copy of ancestry genotype segment of an individual
  to have a single pair of haplotypes [35]. The point estimate
  of the number of generations is given by
 |
(4) |
where  is the total Morgan length;
  is the proportion of admixture; and
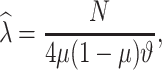
  is the ancestry transition, which is the observed number of breakpoints [35]. The estimated number of breakpoints in the above method by Price et al. [35] may result in underestimating the admixture dates and in the case of closely related populations, enough power is needed to reliably assign chromosomal segments to an ancestral population by defining large genomic windows, which correspondingly reduces the identification of closely spaced breakpoints [9]. The other limitation of this model is that gene flow is assumed to be weak enough that any recombination can be unlikely between migrant chromosomes [40]. The accuracy of the inferred ancestry switch may be limited when using the raw genomic and inaccurate proxy ancestry populations.
Pugach and colleagues [9] explored the ancestral block approach using the wavelet transform (under the simple HI model) to infer the admixture time to derive the dominant frequency of the ancestry tracts in the admixed populations and compared the latter to those obtained from extensive simulations. This method has been shown to be powerful for dating old admixture events and was proven to better estimate admixture time compared to HAPMIX. However, the method shows consistent dispersion around the estimate and lacks to generate the wavelet in greater details particularly to identify aspects of non-time-related information [9]. This approach is divided in two different analytical steps. The first step constructs on principal components (PCs), which are utilized to attain a signal of admixture from the genome of the admixed individual. Mathematical details are displayed in Box 2. The second step (Box 2) relies on the decomposition of the resulting admixture signal to extract the information about the age of the admixture event [9]. Pool and Nielsen developed an inference approach for ancestry blocks along the genome of a mixed ancestry individual given a source of preventative ancestral populations [38]. This approach can possibly infer the time of admixture from the ancestry track length distribution. After a number of generations  from the advent of admixture, the distribution of the track length follows an exponential distribution, which means
  is given by
 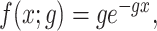 where
where  is the length of an admixture tract.
Box 2 .

Haplotypes/ancestry block size distribution-based approach: Principal component.
Later on, in 2012, Gravel applied the same study to multiple ancestral populations [11], but the approach required accurate identification of the boundaries of admixture chunks, which is not always available for fitting the distribution of ancestral segments. Jin and colleagues [18], developed similar method to unravel the admixture dynamics in order to infer distinct admixture events by taking into account distinct admixture models, including the HI, GA and CGF models. They later inferred the theoretical distributions of ancestral tracks under the HI and GA models [18, 42] (Box 3). Later, Hellenthal et al. [12] introduced a dating admixture model by extending the method developed by Lawson et al. [43]. This model considers each individual in a sample as a recipient, whose chromosomes are reconstructed using chunks of DNA donated by other individuals. The first part of this method uses an HMM to break down the chromosomes of each admixed individual into `chunks’ and associates it to a single appropriate ancestral individual. In the second part, complete haplotype segments of the admixed populations are identified and assigned to different ancestral populations [12, 43]. For each pair of ancestral populations, an exponential decay distribution curve (Box 3) is fitted to estimate single best fitting rate and derives the most appropriate single admixture event and estimating the date it happened (Box 3). Because the choice of demographic admixture model has an impact in estimating the date of admixture, recently, Ni et al. [44] explored a model, which is based on the distribution of ancestral tracts that allows the selection of optimal admixture model to estimate the number, time and order of admixture waves. This method makes use of the Likelihood ratio test to determine the optimal model for inference and expectation–maximization (EM) algorithm to estimate multiple admixture events under the chosen optimal model.
Box 3 .

Haplotypes/ancestry block size distribution-based approach: Ancestry block distribution.
Evaluating current dating admixture tools
With the increasing availability of high-throughput genomic data and the development of admixture dating methods, one needs to assess their performance. Yunusbayev et al. [45] compared two implemented methods (ALDER and stepPCO) to infer the date of Siberian/Asian admixture among various Turkic peoples. They performed various simulations based on data from different sources and concluded that the ALDER estimates tend to be closer to the true estimates compared to the stepPCO estimates. In addition, stepPCO tend to be closer to the estimates for older generation. On real data set, stepPCO estimates tend to be older leading not to consider its estimate [45]. In addition, Brucato et al. [46] analyses give highly correlated admixture date estimate between MALDER and GLOBETROTTER.
Here, we evaluate various state-of-the-art tools (Table 1) of dating admixture events; ROLLOFF [8, 36], ALDER [7], stepPCO [9], GLOBETROTTER [12] and MALDER [7]. These tools were chosen as they were extensively applied to several population genetics studies (Supplementary Data 1). From the original publication, each of these aforementioned tools has been evaluated against HAPMIX. Each of these tools was either outperformed or was completive to HAPMIX. We first conduct the assessment through the simulation (Supplementary Data 2) of admixture events that mimicked real admixture scenario and various times since the event occurred using data from 1000 Genomes Project [14] and from Chimusa et al. [47] (Supplementary Data 2, Table 1). We follow the model of exponential growth (see detail in Supplementary Data 2) based on the expansion model from Rogers and Harpendings [48]:
Two-way single-point admixture event simulation
We independently simulated 10 data sets, each consisting of 100 admixed individuals (see detail in Supplementary Data 2) and considering CEU (Utah residents with Northern Western European ancestry; 183 samples) and YRI (Yoruba Nigeria; 186 samples) as proxy ancestral populations in a two-way single-point admixture scenario (Supplementary Data 2, Table 2) assuming the number of generations—N = 5, 10, 20, 40, 74, 100, 250, 400, 600 and 800, respectively. Table 2 indicates that stepPCO significantly underestimates the true number of generations (the simulated time of admixture baseline) since admixture occurred as these generations increase with old generations. We also found that the dominant frequency of the wavelet increases as generations increase, which would correspond to an abundance of low-frequency wavelets (that is, broader ancestry chunks) for recent generations to high-frequency wavelets indicating narrow ancestry blocks for older generations [9]. This may indicate the limitation of stepPCO in estimating the breakpoints of ancestry chunk sizes. From both ROLLOFF and ALDER (Table 2), the inferred dates of admixture overestimate the true dates starting from N = 400 generations onwards. In contrast to ROLLOFF, the date inferred by ALDER tends to approximate the true simulated date, particularly for recently admixture event (N = 5 to 100 even up to 250 generations). In addition, the range of the 95% confidence interval (CI) grows wider for older dates, in the case of ROLLOFF, indicating a lot of variance in the estimate of the date from the simulation, particularly for older admixture events. GLOBETROTTER and MALDER fit approximately well to the date (Table 2) from our simulation, particularly for recently admixture events (N = 5 up to 400 generations), while MALDER overestimates older admixture events and GLOBETROTTER underestimates them.
Table 2 .
Two-way single-point admixture from CEU and YRI, resulting to 100 admixed individuals. Values in the table are the number of generations [and their  standard error (SE)]
| True generations | Estimated number of generations | ||||
|---|---|---|---|---|---|
ROLLOFF  SE SE
|
ALDER  SE SE
|
StepPCO  SE SE
|
GLOBETROTTER  SE SE
|
MALDER  SE SE
|
|
| 5 | 3.01  0.04 0.04 |
4.58  0.3 0.3 |
3 
|
4.7 
|
5  0.3 0.3 |
| 10 | 7.4 
|
9.29  0.8 0.8 |
6 
|
9.8 
|
9  0.1 0.1 |
| 20 | 16.35 
|
19  0.9 0.9 |
11 
|
18.6 
|
18  2.1 2.1 |
| 40 | 35.6  4.2 4.2 |
38.6  3.9 3.9 |
29 
|
32 
|
37  4.2 4.2 |
| 74 | 62.5 
|
71.7  3.7 3.7 |
60 
|
69 
|
74  3.7 3.7 |
| 100 | 87.4 
|
97.4  8.6 8.6 |
72 
|
75.6 
|
90  15 15 |
| 250 | 209.2 
|
217 21.7 21.7 |
142 
|
180.3 
|
240  11 11 |
| 400 | 453.6 
|
413  76.2 76.2 |
242 
|
380.1 
|
391  28 28 |
| 600 | 634.3 
|
718  96.6 96.6 |
309  504.3 504.3 |
412.3 
|
543  39 39 |
| 800 | 836.7 
|
963  98.8 98.8 |
542  598.7 598.7 |
591.8 
|
610  41 41 |
Three-way multi-point admixture events simulation
Given that ROLLOFF, ALDER and stepPCO were unable to infer multiple admixture events, we evaluated GLOBETROTTER and MALDER under three-way admixture to assess multiple admixture events using multi-point simulation (Supplementary Data 2, Table 3). We independently simulated 9 data sets, each contained 140 admixed individuals in a 3-way multi-point admixture process with proxy ancestry from Europeans (CEU, 183 samples), Yoruba (YRI, 186 samples) and Bengali from Bangladesh (BEB, 144 samples). We assumed two admixture processes at generations  and N1
 where
where  = 5, 9, 30, 80, 137, 200, 308 and 510, respectively. The simulation results in Table 3 indicate that GLOBETROTTER has significantly underestimated and mostly failed to accurately estimate older admixture events (1st admixture event). Even though GLOBETROTTER detected recent admixture event (2nd admixture event), it still underestimated the large number of generations. MALDER has detected both admixture events and recovered mostly recent number of generations, but it still overestimated the large number of generations.
Table 3 .
Simulation results for three- and four-way multi-point admixture. Values in the table are the number of generations (and their  standard error (SE)
| Estimated results simulation: three-way admixture between CEU, YRI and CHB | |||||
|---|---|---|---|---|---|
| Date assuming two events | |||||
| 2nd admixture event | 1st admixture event | ||||
| True | MALDER | GLOBETROTTER | True | MALDER | GLOBETROTTER |
| 2 | 1.8  1.0.5 1.0.5 |
2  1.1 1.1 |
5 | 5  1.02 1.02 |
4  9.8 9.8 |
| 5 | 5.8  0.3 0.3 |
4.1  2.5 2.5 |
10 | 9  0.28 0.28 |
9  20.9 20.9 |
| 10 | 9.01  1.01 1.01 |
8  8.6 8.6 |
20 | 16  11.5 11.5 |
15  50.5 50.5 |
| 35 | 39  0.96 0.96 |
v31  24.9 24.9 |
70 | 60  198.15 198.15 |
53  159.5 159.5 |
| 50 | 7  1 1 |
42  48.5 48.5 |
100 | 107  214.1 214.1 |
85  181.2 181.2 |
| 100 | 111.52  222 222 |
86  125.5 125.5 |
200 | 208  96.3 96.3 |
143  366.1 366.1 |
| 150 | 176  12 12 |
105  267.5 267.5 |
300 | 318  6.8 6.8 |
271  741.5 741.5 |
| 225 | 231  149 149 |
167  289.8 289.8 |
450 | 502  468.6 468.6 |
370  799.9 799.9 |
| Four-way multi-point admixture between CEU, YRI, KHS, GIH and CHB | |||||
| 3rd admixture event | 2nd admixture event | 1st admixture event | |||
| True | MALDER  SE SE |
True | MALDER  SE SE |
True | MALDER  SE SE |
| 10 | – | 40 | 46.173  180.25 180.25 |
200 | 217.662  290.051 290.051 |
Four-way multi-point admixture events simulation
We simulated a data set of 140 admixed individuals in a four-way multi-point admixture scenario (Supplementary Data 2, Table 4) based on admixture from Europeans (CEU, 183 samples), Yoruba (YRI, 186 samples) and Bengali (BEB, 144 samples) and Khoisan (KHS, 24 samples). Here, we assumed three admixture processes at generations 200, 40 and 10 to evaluate MALDER. The simulation results in Table 3 indicate that MALDER infers two admixture events, which approximately fit the simulated admixture model. Nevertheless, in spite of negligible errors (or differences) between the estimated number of generations from MALDER and the true values, MALDER still tends to overestimate older admixture events (Table 3). This suggests that MALDER is able to estimate distinct admixture events with the presence of older admixture but might miss to detect recent admixture event. It is worth noting that the large variance of MALDER estimates is mainly due to the patterns of LD as the number of generations increase.
Application into a multi-way admixed South African Coloured population
Here we applied the top two tools, MALDER and GLOBETROTTER, to estimate the date of admixture events in a uniquely admixed South African Coloured (SAC) population with a total of 773 admixed individuals [48, 49]. We merged three SAC populations including those from Western Cape region (sample size, 733) [49], Colesberg (sample size, 20) [50] and Wellington (sample size, 20) [50] regions in South Africa. Southern Africa is a unique region filled with great genetic diversity. This diversity extends to geography, ecology and the genetic composition of human populations in the region. The region’s history is one of the most distinctive, reaching back at least 100000 years to the origin of modern humans [51, 52]. However, the SAC population represents a highly admixed group of individuals from multiple ancestral populations [49]. This population diversity is the result of both a multi-faceted colonization history [2, 52, 53] and South Africa’s location with respect to major trade routes within the past 600 years [52, 53]. Previous studies have shown that the SAC population is five-way admixed (details in Supplementary Data 2, Figure 1) with ancestral populations from Europeans, Indian, Khoisan, East Asian and African Bantu [48–50, 54]. Therefore, we considered proxy ancestral populations data from HapMap3 (Supplementary Data 2, Table 1) including individuals of Utah with Northern and Western European ancestry from the Centre d'Etude du Polymorphism Humain (CEPH) collection (CEU, n = 165); Yoruba individuals from Ibadan, Nigeria (YRI, n = 203); Han Chinese individuals from Beijing, China (CHB, n = 137); Gujarati Indian from Houston, Texas, USA (GIH, n = 101) and Khoisan from South Africa (KHS, n = 49). The merged set contained 272796 SNPs in common and, previously, we run dating admixture analysis using MALDER and GLOBETROTTER. MALDER detected three admixture events in the SAC population. The first event occurred 4 ± 1.3 generations ago followed by the second event 18 ± 4 generations ago and the third event 295 ± 78 generations ago. The first event is more (less) concordant with a recent study [4], which highlights the admixture mostly between African and non-African during the colonial era in Southern Africa. The second event overestimated the arrival and the expansion of the Europeans through the Dutch East India in South Africa around that time. The third event overestimated the arrival of the Bantu-speaking populations, which might have admixed with the San population in the region. GLOBETROTTER infers as best-guess `one-date’, which predicts a single admixture event of all the ancestral populations (Supplementary Data 2,Figures 2–4). Assuming one event, GLOBETROTTER infers 9 generations (95%CI = [8.9; 10.6]); but when assuming two events, GLOBETROTTER generates 3 generations and 13 generations. As indicated early, the SAC is characterized with several recent admixture events; we would expect more than three recent admixture events to be detected.
Challenges and opportunity in dating admixture events
Advancement in both human genotyping and sequencing and the development of both statistical and computational tools have enabled several methods to date the admixture events in order to understand the admixture history and the evolutionary of human populations. These methods have been utilizing the information from the genome of several current world-wide populations as representative or equivalent ancient populations known to be involved in the migration and/or admixture processes yielding today’s admixed populations around the world (Figure 1). These methods have been applied to several human populations (Supplementary Data 1) to estimate the age of admixture events and have so far shed light on the patterns of admixture and genetic variation throughout modern human evolution. In addition, they have increased our understanding of the demographics and history. These methods have differing merits and drawbacks with regard to the estimation of dates of admixture events in admixed populations.
Supplementary Data 1 displays a partial list of dating admixture events in several populations around the world using current developed tools. In addition to inconsistencies of some results obtained from dating admixture event using different tools (Supplementary Data 1), most of these tools are limited to two-way single-point admixture models and their accuracy is mostly limited to recently single-point admixture event. It is worth to note from Supplementary Data 1 and our current simulation results that plausible dates of admixture events, regardless of the implemented admixture model, still remains, by some degree, a challenging concept for researchers—particularly when it is about fitting an admixture model to real admixed populations. In spite of recent improvements on mixture exponential decay model that captures older admixture event and/or multiple admixture events [37], our simulation based on several admixture models suggested that mixture exponential decay model tended to overestimate dates of admixture events for older admixture (Table 3). Furthermore, mixture exponential decay model is limited to detect, at most,s three admixture events in multi-point admixture events. This is observed in estimating multi-faceted admixture events in the SAC population.
Hellenthal et al. [12] introduced an admixture dynamic model to optimize several admixture models, including the HI, GA and CGF models [18, 42]. However, the simulation results showed that it has a limitation in underestimating ancient admixture events (Table 3) in multi-way admixed populations and to adequately identify multi-faceted admixture events. Importantly, the inconvenience of these methods lies in the fact that either the method is limited to two-way single-point admixture model to estimate ancient admixture event or multi-way admixture with multiple admixture models to fairly estimate recent admixture events. Practical consideration may also limit these methods: (1) since these methods make use of proxy ancestral populations in the inference, the accuracy may depend on the choice of these proxy ancestral populations. Inappropriate or insufficient proxy ancestral populations can result in erroneously inferred ancestry, pattern of LD and the recombination breakpoints therefore affecting the detection of admixture events and the estimate date; (2) to sufficiently capture the LD patterns and/or ancestry haplotypes, an adequate and sufficient sample size from the target admixed population is needed; (3) to adequately build up a model that will infer distinct times admixture events, correlating to the real admixture history using appropriate proxy ancestries based on patterns of local ancestry inference or chromosomal blocks.
Finally, current dating admixture event approaches (Table 1) do not yet account for models that adequately make use of admixed populations as proxy ancestry and appropriately model recombination events where these proxy ancestral populations are closely related or being admixed themselves. Another limitation in dating admixture events in complex multi-way admixed populations, such as the SAC population, is due to current limited accuracy of the ancestry switch inference models. In fact, modeling the distribution of ancestry segments or pinpointing ancestry along the genome of complex multi-way admixed populations is presently an unsolved problem [48, 55, 56]. Existing model of ancestry switch may attain adequate accuracy on average but may struggle from false deviations in average locus-specific ancestry at some genomic segments in which the modeled proxy ancestral population is unusually different from the true ancestral due to the historical action of natural selection.
Conclusion and perspective
Different methods have been developed to estimate date of admixture events and tested using putative available data from the 1000 Genome Project. These data have become a reference panel or proxy panel for testing methods of admixture dating, but one should also investigate the population structure of these data, which could be admixed themselves, and consequently, making the reference panel data inaccurate.
There is a need to make use of closely related populations for assessing different admixture dating methods to improve the accuracy of results. Moreover, most of dating admixture methods struggles to accurately estimate the date of admixture events from admixed populations with more than three-way admixture events. In addition, many methods find it difficult to infer the date of admixture for older admixture events due to the failure to either accurately model the pattern of LD or optimally fit the distribution of ancestral block (or ancestral tracts) or due to simplistic assumptions in modeling admixture histories of the admixed population and reference populations. These methods rely on either accurate local ancestry information or global ancestry inference, and when the reference populations are highly divergent from the true admixed populations or when the ancestry tracts are short, in the case for ancient admixture, it becomes harder to predict accurate estimates. In this review, we have dissected the advantages and limitations of each approach. We performed an evaluation of these methods using their respective tools through the simulation of admixture events that mimicked real admixture scenarios and various times since the admixture event happened.
Our results indicate that most current tools for dating admixture events have some limitations in capturing ancient admixture events and admixture models in a multi-way admixture scenario. Despite MALDER and GLOBETROTTER showing improvement and producing reasonable date estimates over other current methods, the results from both simulations and real data suggest that dating ancient and recently multi-faceted admixture events accounting for the effect of other admixtures remains a challenge.
Current recommendation would be to integrate or compare results across at least two tools in estimating the age of admixture. Results obtained suggest the need for developing an integrative or a new approach to date ancient and multi-faceted admixture events in multi-way admixed populations to further advance our understanding of human demographics and movement. While more appropriate and updated genome-wide panel data are required to increase the accuracy of these results, the inference of ancestry switch and/or pinpointing ancestry along the genome of multi-way admixed individual are important to have accurate ancestry breakpoints to efficiently estimate admixture events.
Improved methods of ancestry inference based on new and large data sets, particularly from African populations known for long history, high diversity and mixture will also improve our understanding of human movement and their implication in the adaptation and consequently in the human healthcare.
These approaches will likely facilitate the development of more powerful tools for dating admixture events, admixture mapping and estimating the age of a disease locus showing ethnic difference in disease risk. Further investigations in dating admixture events should aim to improve accuracy with less variance on the estimated parameters from the date of admixture in a more complex scenario using reliable data for the description of the admixture patterns in any admixed population around the world. Future studies need to consider with high importance the use of the best proxy (the closest that have contributed to the mixture) ancestral populations within the accurate admixture model that fits the population under study. Also, dating bones based on genetic data has become a recent approach to investigate population history [39, 46] especially for older admixture events. This could be an addition to confirm the truthiness of the results generated from genotype data as previous historical records were used for results validation.
Supplementary Material
Acknowledgements
We are grateful to Ephifania Geza, Jacquiline W. Mugo and Nicola Mulde for helpful discussions. Computations were performed using facilities provided by Centre for high performance computing (CHPC) (https://www.chpc.ac.za/). The content of this publication is solely the responsibility of the authors and does not necessarily represent the official views of the funders.
Emile R. Chimusa, PhD in Bioinformatics from University of Cape Town, a Senior Lecturer at the Division of Human Genetics, Department of Pathology, University of Cape Town, South Africa.
Joel Defo, MSc, student at the Division of Human Genetics, Department of Pathology, University of Cape Town, South Africa.
Prisca K. Thami, PhD candidate at the Division of Human Genetics, Department of Pathology, University of Cape Town, South Africa.
Denis Awany, MSc degrees from Makerere University and African Institute for Mathematical Sciences. He is a PhD Student at the University of Cape Town, South Africa.
Delesa D. Mulisa, PhD candidate at the Division of Human Genetics, Department of Pathology, University of Cape Town, South Africa.
Imane Allali, PhD and postdoctoral fellow at the Computational Biology Division, University of Cape Town, South Africa.
Hassan Ghazal, PhD and a researcher at the University Mohammed First, Oujda, Morocco.
Ahmed Moussa, PhD, professor at Abdelmalek Essaadi University École nationale des sciences appliquées de Tétouan (ENSA), Tangier, Morocco.
Gaston K. Mazandu, PhD and senior lecturer at the Division of Human Genetics, Department of Pathology, University of Cape Town, South Africa.
Contributor Information
Emile R Chimusa, Division of Human Genetics, Department of Pathology, Institute of Infectious Disease and Molecular Medicine,Faculty of Health Sciences, University of Cape Town, Observatory, Cape Town, South Africa.
Joel Defo, Division of Human Genetics, Department of Pathology, Institute of Infectious Disease and Molecular Medicine,Faculty of Health Sciences, University of Cape Town, Observatory, Cape Town, South Africa.
Prisca K Thami, Division of Human Genetics, Department of Pathology, Institute of Infectious Disease and Molecular Medicine,Faculty of Health Sciences, University of Cape Town, Observatory, Cape Town, South Africa; Botswana Harvard AIDS Institute Partnership, Gaborone, Botswana; Department of Biological Sciences, University of Botswana, Gaborone, Botswana.
Denis Awany, Division of Human Genetics, Department of Pathology, Institute of Infectious Disease and Molecular Medicine,Faculty of Health Sciences, University of Cape Town, Observatory, Cape Town, South Africa.
Delesa D Mulisa, Division of Human Genetics, Department of Pathology, Institute of Infectious Disease and Molecular Medicine,Faculty of Health Sciences, University of Cape Town, Observatory, Cape Town, South Africa.
Imane Allali, Division of Computational Biology, Department of Biomedical Sciences, Institute of Infectious Disease and Molecular Medicine,Faculty of Health Sciences, University of Cape Town, Observatory, Cape Town, South Africa.
Hassan Ghazal, University Mohammed First, B.P.524 Oujda, Morocco.
Ahmed Moussa, Abdelmalek Essaadi University ENSA, Tangier, Morocco.
Gaston K Mazandu, Division of Human Genetics, Department of Pathology, Institute of Infectious Disease and Molecular Medicine,Faculty of Health Sciences, University of Cape Town, Observatory, Cape Town, South Africa; Division of Computational Biology, Department of Biomedical Sciences, Institute of Infectious Disease and Molecular Medicine,Faculty of Health Sciences, University of Cape Town, Observatory, Cape Town, South Africa; African Institute for Mathematical Sciences (AIMS), Muizenberg, Cape Town, South Africa.
Key Points
Discussing the importance of admixture and approaches for dating admixture.
Provide a broad discussion in advance made in methods pertinent to dating admixture events.
Evaluation of various admixture dating tools though simulation data sets.
Discussing currently challenge and conclude with a discussion of research areas where further work on dating admixture-based methods is needed.
Funding
German Academic Exchange Service (DAAD), the German Academic Exchange Programme (reference number 91653117); the National Institutes of Health Common Fund [grant number 1U54HG009790–01(IFGeneRA), U01HG009716 (HI Genes Africa), U24HG006941 (H3ABioNet), 1U01HG007459–01 (SADaCC)]; and Wellcome Trust/AESA (H3A/18/001); the sub-Saharan African Network for TB/HIV Research Excellence (SANTHE), a DELTAS Africa Initiative [grant # DEL-15-006].
References
- 1. Fu Q, Li H, Moorjani P, et al. Genome sequence of a 45,000-year-old modern human from western Siberia. Nature 2014;514:445–9. [DOI] [PMC free article] [PubMed] [Google Scholar]
- 2. Tishkoff SA, Williams SM. Genetic analysis of African populations: human evolution and complex disease. Nat Rev Genet 2002;3:611–21. [DOI] [PubMed] [Google Scholar]
- 3. Busby GBJ, Hellenthal G, Montinaro F, et al. The role of recent admixture in forming the contemporary West Eurasian genomic landscape. Curr Biol 2015;25:2518–26. [DOI] [PMC free article] [PubMed] [Google Scholar]
- 4. Montinaro F, Busby GBJ, Gonzalez-Santos M, et al. Complex ancient genetic structure and cultural transitions in Southern African populations. Genetics 2016;205:303–16. [DOI] [PMC free article] [PubMed] [Google Scholar]
- 5. Sanderson J, Sudoyo H, Karafet TM, et al. Reconstructing past admixture processes from local genomic ancestry using wavelet transformation. Genetics 2015;200:469–81. [DOI] [PMC free article] [PubMed] [Google Scholar]
- 6. Hublin J-J, Ben-Ncer A, Bailey SE, et al. New fossils from Jebel Irhoud, Morocco and the pan-African origin of Homo sapiens. Nature 2017;546:289. [DOI] [PubMed] [Google Scholar]
- 7. Loh P-R, Lipson M, Patterson N, et al. Inferring admixture histories of human populations using linkage disequilibrium. Genetics 2013;193:1233–54. [DOI] [PMC free article] [PubMed] [Google Scholar]
- 8. Moorjani P, Patterson N, Hirschhorn JN, et al. The history of African gene flow into Southern Europeans, Levantines, and Jews. PLoS Genet 2011;7:e1001373. [DOI] [PMC free article] [PubMed] [Google Scholar]
- 9. Pugach I, Matveyev R, Wollstein A, et al. Dating the age of admixture via wavelet transform analysis of genome-wide data. Genome Biol 2011;12:R19. [DOI] [PMC free article] [PubMed] [Google Scholar]
- 10. Xu S, Huang W, Qian J, et al. Analysis of genomic admixture in Uyghur and its implication in mapping strategy. Am J Hum Genet 2008;82:883–94. [DOI] [PMC free article] [PubMed] [Google Scholar]
- 11. Gravel S. Population genetics models of local ancestry. Genetics 2012;191:607–19. [DOI] [PMC free article] [PubMed] [Google Scholar]
- 12. Hellenthal G, Busby GBJ, Band G, et al. A genetic atlas of human admixture history. Science 2014;343:747–51. [DOI] [PMC free article] [PubMed] [Google Scholar]
- 13. Consortium IH others . A second generation human haplotype map of over 3.1 million SNPs. Nature 2007;449:851. [DOI] [PMC free article] [PubMed] [Google Scholar]
- 14. Consortium 1000 Genomes Project, others . A global reference for human genetic variation. Nature 2015;526:68. [DOI] [PMC free article] [PubMed] [Google Scholar]
- 15. Dannemann M, Racimo F. Something old, something borrowed: admixture and adaptation in human evolution. Curr Opin Genet Dev 2018;53:1–8. [DOI] [PubMed] [Google Scholar]
- 16. Shriver MD, Parra EJ, Dios S, et al. Skin pigmentation biogeographical ancestry and admixture mapping. Hum Genet 2003;112:387–99. [DOI] [PubMed] [Google Scholar]
- 17. Winkler CA, Nelson GW, Smith MW. Admixture mapping comes of age. Annu Rev Genomics Hum Genet 2010;11:65–89. [DOI] [PMC free article] [PubMed] [Google Scholar]
- 18. Jin W, Li R, Zhou Y, et al. Distribution of ancestral chromosomal segments in admixed genomes and its implications for inferring population history and admixture mapping. Eur J Hum Genet 2014;22:930. [DOI] [PMC free article] [PubMed] [Google Scholar]
- 19. Seldin MF, Pasaniuc B, Price AL. New approaches to disease mapping in admixed populations. Nat Rev Genet 2011;12:523. [DOI] [PMC free article] [PubMed] [Google Scholar]
- 20. Goetz LH, Uribe-Bruce L, Quarless D, et al. Admixture and clinical phenotypic variation. Hum Hered 2014;77:73–86. [DOI] [PubMed] [Google Scholar]
- 21. Mao X, Bigham AW, Mei R, et al. A genomewide admixture mapping panel for Hispanic/Latino populations. Am J Hum Genet 2007;80:1171–8. [DOI] [PMC free article] [PubMed] [Google Scholar]
- 22. Liu Y, Nyunoya T, Leng S, et al. Softwares and methods for estimating genetic ancestry in human populations. Hum Genomics 2013;7:1. [DOI] [PMC free article] [PubMed] [Google Scholar]
- 23. Thornton TA, Bermejo JL. Local and global ancestry inference and applications to genetic association analysis for admixed populations. Genet Epidemiol 2014;38(Suppl 1):S5–S12. [DOI] [PMC free article] [PubMed] [Google Scholar]
- 24. Richards MP, Trinkaus E. Isotopic evidence for the diets of European Neanderthals and early modern humans. Proc Natl Acad Sci 2009;106:16034–9. [DOI] [PMC free article] [PubMed] [Google Scholar]
- 25. Lazaridis I, Patterson N, Mittnik A, et al. Ancient human genomes suggest three ancestral populations for present-day Europeans. Nature 2014;513:409. [DOI] [PMC free article] [PubMed] [Google Scholar]
- 26. Ehmann WD. In: Winefordner JD (ed). Radiochemistry and nuclear methods of analysis. New York: John Wiley and Sons Inc., 1991, 245 [Google Scholar]
- 27. Tsoulfanidis N, Landsberger S. Measurement and Detection of Radiation, 4th edn. Boca Raton, FL: CRC Press, 2015, 448–52. [Google Scholar]
- 28. Richter D, Grün R, Joannes-Boyau R, et al. The age of the hominin fossils from Jebel Irhoud, Morocco, and the origins of the Middle Stone Age. Nature 2017;546:293–6. [DOI] [PubMed] [Google Scholar]
- 29. McDougall I, Brown FH, Fleagle JG. Sapropels and the age of hominins Omo I and II, Kibish, Ethiopia. J Hum Evol 2008;55:409–20. [DOI] [PubMed] [Google Scholar]
- 30. Brown FH, McDougall I, Fleagle JG. Correlation of the KHS Tuff of the Kibish Formation to volcanic ash layers at other sites, and the age of early Homo sapiens (Omo I and Omo II). J Hum Evol 2012;63:577–85. [DOI] [PubMed] [Google Scholar]
- 31. Churchhouse C, Marchini J. Multiway admixture deconvolution using phased or unphased ancestral panels. Genet Epidemiol 2013;37:1–12. [DOI] [PubMed] [Google Scholar]
- 32. Cheng R, Lim JE, Samocha KE, et al. Genome-wide association studies and the problem of relatedness among advanced intercross lines and other highly recombinant populations. Genetics 2010;185:1033–44. [DOI] [PMC free article] [PubMed] [Google Scholar]
- 33. Jin W, Xu S, Wang H, et al. Genome-wide detection of natural selection in African Americans pre- and post-admixture. Genome Res 2012;22:519–27. [DOI] [PMC free article] [PubMed] [Google Scholar]
- 34. Bhatia G, Patterson N, Pasaniuc B, et al. Genome-wide comparison of African-ancestry populations from CARe and other cohorts reveals signals of natural selection. Am J Hum Genet 2011;89:368–81. [DOI] [PMC free article] [PubMed] [Google Scholar]
- 35. Price AL, Tandon A, Patterson N, et al. Sensitive detection of chromosomal segments of distinct ancestry in admixed populations. PLoS Genet 2009;5:e1000519. [DOI] [PMC free article] [PubMed] [Google Scholar]
- 36. Moorjani P, Thangaraj K, Patterson N, et al. Genetic evidence for recent population mixture in India. Am J Hum Genet 2013;93:422–38. [DOI] [PMC free article] [PubMed] [Google Scholar]
- 37. Pickrell JK, Reich D. Toward a new history and geography of human genes informed by ancient DNA. Trends Genet 2014;30:377–89. [DOI] [PMC free article] [PubMed] [Google Scholar]
- 38. Pool JE, Nielsen R. Inference of historical changes in migration rate from the lengths of migrant tracts. Genetics 2009;181:711–9. [DOI] [PMC free article] [PubMed] [Google Scholar]
- 39. Moorjani P, Sankararaman S, Fu Q, et al. A genetic method for dating ancient genomes provides a direct estimate of human generation interval in the last 45,000 years. Proc Natl Acad Sci USA 2016;113:5652–7. [DOI] [PMC free article] [PubMed] [Google Scholar]
- 40. Zhou Y, Yuan K, Yu Y, et al. Inference of multiple-wave population admixture by modeling decay of linkage disequilibrium with polynomial functions. Heredity (Edinb) 2017;118:503–10. [DOI] [PMC free article] [PubMed] [Google Scholar]
- 41. Zhou Y, Qiu H, Xu S. Modeling continuous admixture using admixture-induced linkage disequilibrium. Sci Rep 2017;7: 43054. [DOI] [PMC free article] [PubMed] [Google Scholar]
- 42. Jin W, Wang S, Wang H, et al. Exploring population admixture dynamics via empirical and simulated genome-wide distribution of ancestral chromosomal segments. Am J Hum Genet 2012;91:849–62. [DOI] [PMC free article] [PubMed] [Google Scholar]
- 43. Lawson DJ, Hellenthal G, Myers S, et al. Inference of population structure using dense haplotype data. PLoS Genet 2012;8: e1002453. [DOI] [PMC free article] [PubMed] [Google Scholar]
- 44. Ni X, Yuan K, Yang X, et al. Inference of multiple-wave admixtures by length distribution of ancestral tracks. Heredity (Edinb) 2018;121:52–63. [DOI] [PMC free article] [PubMed] [Google Scholar]
- 45. Yunusbayev B, Metspalu M, Metspalu E, et al. The genetic legacy of the expansion of Turkic-speaking nomads across Eurasia. PLoS Genet 2015;11:e1005068. [DOI] [PMC free article] [PubMed] [Google Scholar]
- 46. Brucato N, Kusuma P, Beaujard P, et al. Genomic admixture tracks pulses of economic activity over 2,000 years in the Indian Ocean trading network. Sci Rep 2017;7:2919. [DOI] [PMC free article] [PubMed] [Google Scholar]
- 47. Chimusa ER, Meintjies A, Tchanga M, et al. A genomic portrait of haplotype diversity and signatures of selection in indigenous southern African populations. PLoS Genet 2015;11:e1005052. [DOI] [PMC free article] [PubMed] [Google Scholar]
- 48. Chimusa ER, Zaitlen N, Daya M, et al. Genome-wide association study of ancestry-specific TB risk in the South African Coloured population. Hum Mol Genet 2013;23:796–809. [DOI] [PMC free article] [PubMed] [Google Scholar]
- 49. Geza E, Mugo J, Mulder NJ, et al. A comprehensive survey of models for dissecting local ancestry deconvolution in human genome. Brief Bioinform 2018;6(29):bby044. [DOI] [PMC free article] [PubMed] [Google Scholar]
- 50. Schlebusch CM, Lombard M, Soodyall H. MtDNA control region variation affirms diversity and deep sub-structure in populations from southern Africa. BMC Evol Biol 2013;13:56. [DOI] [PMC free article] [PubMed] [Google Scholar]
- 51. Bräuer G, Rimbach KW. Late archaic and modern Homo sapiens from Europe, Africa, and Southwest Asia: craniometric comparisons and phylogenetic implications. J Hum Evol 1990;19:789–807. [Google Scholar]
- 52. Tishkoff SA, Reed FA, Friedlaender FR, et al. The genetic structure and history of Africans and African Americans. Science 2009;324:1035–44. [DOI] [PMC free article] [PubMed] [Google Scholar]
- 53. Mountain A. The First People of the Cape: A Look at Their History and the Impact of Colonialism on the Cape’s Indigenous People. Cape Town: New Africa Books, 2003. [Google Scholar]
- 54. Quintana-Murci L, Harmant C, Quach H, et al. Strong maternal Khoisan contribution to the South African coloured population: a case of gender-biased admixture. Am J Hum Genet 2010;86:611–20. [DOI] [PMC free article] [PubMed] [Google Scholar]
- 55. Pasaniuc B, Sankararaman S, Torgerson DG, et al. Analysis of Latino populations from GALA and MEC studies reveals genomic loci with biased local ancestry estimation. Bioinformatics 2013;29:1407–15. [DOI] [PMC free article] [PubMed] [Google Scholar]
- 56. Deng L, Ruiz-Linares A, Xu S, et al. Ancestry variation and footprints of natural selection along the genome in Latin American populations. Sci Rep 2016;6:21766. [DOI] [PMC free article] [PubMed] [Google Scholar]
- 57. Patterson N, Moorjani P, Luo Y, et al. Ancient admixture in human history. Genetics 2012;192:1065–93. [DOI] [PMC free article] [PubMed] [Google Scholar]
- 58. Ni X, Yang X, Guo W, et al. Length distribution of ancestral tracks under a general admixture model and its applications in population history inference. Sci Rep 2016;6:20048. [DOI] [PMC free article] [PubMed] [Google Scholar]
- 59. Corbett-Detig R, Nielsen RA. Hidden Markov model approach for simultaneously estimating local ancestry and admixture time using next generation sequence data in samples of arbitrary ploidy. PLoS Genet 2017;13:e1006529. [DOI] [PMC free article] [PubMed] [Google Scholar]
Associated Data
This section collects any data citations, data availability statements, or supplementary materials included in this article.