

Summary
In mammals, gut commensal microbiota interact extensively with the host and the same interactions can be dysregulated in diseased states. Animal imaging is a powerful technique that is widely used to diagnose, measure, and track biological changes in model organisms such as laboratory mice. Several imaging techniques have been discovered and adopted by the research community that provide dynamic, non-invasive assessment of live animals but these gains have not been universal across all fields of biology. Herein, we describe a method to non-invasively image commensal bacteria based on the specific metabolic labeling of bacterial cell walls to illuminate the gut bacteria of live mice. This tagging strategy may additionally provide unprecedented insight into cell wall turnover of gut commensals, which has implications for bacterial cellular growth and division, in a live animal.
eTOC Blurb
Imaging of gut microbiota in live animals can provide critical insight into host-microbiome interactions. Apostolos et al, devised a near-infrared imaging strategy based on the specific incorporation of synthetic peptidoglycan precursors, thus providing insights into cell wall biosynthesis and remodeling in live hosts.
Graphical Abstract

Introduction
Molecular imaging of animal models is a powerful technique that is widely utilized to diagnose, measure, and track biological processes and their functional implications. Yet, to date, there are no existing standard techniques to image gut bacteria in live animals. There is a critical need for such methods as trillions of bacteria reside within the gastrointestinal (GI) tract of humans.1,2 The importance of the gut community to the host is evidenced by the wide irerange of pathologies linked to microbiota disruptions. These range from immune dysfunctions (e.g., allergies and numerous autoimmune conditions) to endocrine system disorders (e.g., obesity and diabetes).2–5 Very recently, fragments of peptidoglycan (PG) within the bacterial cell wall were shown to play a major role in mediating gut-brain communication by regulating appetite and body temperature in mice6 and in strongly modulating responses to check-point inhibitors of immunotherapies in mouse tumor models.7 In the case of severe disruptions to the gut bacterial communities (e.g., colitis caused by Clostridium difficile), it is more straight forward to establish a clear connection and causational link.8,9 But, more often, disruptions to gut commensals are subtle and chronic, requiring a range of techniques to adequately decipher them.
The current state-of-the-art, non-invasive technique used to monitor gut bacteria is classification by 16S rRNA sequencing from fecal samples.8,10 This method has several advantages (relatively high convenience, compositional resolution, and prolonged analysis over time) but it also has serious limitations (time gap between collection and introduction of variable, live dynamic bacterial composition of the gut may not be represented in the fecal sample, and lack of spatial resolution). Additionally, the emergence of metabolomics – especially in the context of integrated mass-spectrometry pipelines – has the potential to move an orthogonal set of information to supplement our understanding of the gut microbiome.9 Alternatively, non-invasive metabolic molecular imaging could report on dynamic responses to biological factors (e.g., prebiotics, probiotics, diet, and antibiotics) in real-time. Surprisingly, live animal imaging of gut bacterial communities remains underdeveloped, despite the growing evidence that gut bacteria play central roles in human health and disease. To directly address this technical gap, we describe a non-invasive imaging modality to illuminate gut bacteria in live mice using near infrared (NIR) fluorophores by harnessing the ability of bacteria to metabolically incorporate exogenous cell wall analogs (Figure 1A).
Figure 1.

Metabolic labeling of bacterial cell wall results in the installation of imaging probes. (A) Schematic representation of the installation of molecular fragments linked to NIR fluorescent tags within the cell wall of bacteria. (B) Schematic representation of an example of a PG building block in which an exogenous d-amino acid can be exchanged with d-alanine within the PG of live bacteria. (C) Representation of the two reactants and the product of IED-DA reactions.
Nearly all bacteria, including those residing in the gut of humans, are protected by a shield-like structure called the bacterial cell wall.8,10–12 The unique chemical composition and dynamic remodeling of the bacterial cell wall makes it an ideal target for designing metabolic molecular imaging agents with high specificity because mammalian cells do not have an equivalent biomacromolecule. A principal component of the cell wall is PG, a polymer composed of repetitive disaccharide units (N-acetylglucosamine and N-acetylmuramic acid) with short peptides (called stem peptides) linked to the N-acetylmuramic acid (Figure 1B). Neighboring stem peptides are heavily crosslinked by cell wall-linked transpeptidases to endow greater rigidity and strength to the PG matrix.8,11,12 One of the unique structural characteristics of PG is the inclusion of d-amino acids within the stem peptide.8,13 This unique feature has been leveraged for the development of PG-specific labels. More specifically, bacteria can swap exogenous D-amino acids from the medium into their expanding PG scaffold during cellular growth via surface bound transpeptidases (Figure 1B).14–24
We posited that live gut bacteria imaging can be achieved in mice by oral administration of D-amino acid surface tags to enable the selective installation of NIR fluorophores. In 2017, Hudak et al. (and since then others25–27) used a d-amino acid conjugated to a visible range fluorophore to label gut bacteria of mice. These seminal results demonstrated that gut bacteria can be remodeled with single D-amino acid probes; however, visible-range fluorophores cannot be used for live animal imaging.28 Also in 2017, our laboratory independently demonstrated in vivo labeling of bacteria in the gut of Caenorhabditis elegans (C. elegans)29 using a 2-step strategy mediated by an inverse electron demand Diels-Alder (IED-DA) reaction.15,30,31 We showed that tetrazine-displaying D-amino acids tagged the surface of bacteria in C. elegans and after treatment with a trans-cyclooctene (TCO)-linked Cy5 fluorophore, bacterial cells were selectively labeled with the fluorophore. IED-DA reactants include TCO and tetrazine moieties, which rapidly and quantitatively react to form a stable covalent bond (Figure 1C).32 Critically, the biocompatibility of the tetrazine/TCO handles is highlighted by the first successful completion of a human clinical trial in which doxorubicin-TCO was periodically administered to selectively release drugs from a tetrazine-modified polymer implanted within tumor masses.33
Results
As a starting point in the development of the tagging strategy, we set out to adapt our earlier findings with C. elegans to NIR imaging. To this end, we utilized the combination of a tetrazine-modified D-amino acid (d-PheZ)29 anchored on a phenylalanine and a TCO-linked fluorophore (Figure 2A). Surface tagging conditions were first analyzed in vitro by incubation of bacteria with the metabolic tag followed by labeling with the reactive fluorophore, which is expected to fluorescently tag the PG of live bacteria (Figure 2B). However, when transitioning to in vivo studies, a key feature to consider when developing a dosing and imaging schedule is the kinetics of PG biosynthesis and remodeling of gut bacteria. It is well established that PG biosynthesis and remodeling is tightly coupled to bacterial cell growth, which requires new PG material to be assembled to support de novo cellular replication.8,11,12 While these features can be readily assessed and measured in vitro, they remain largely uncharacterized in commensal communities. Recent efforts have started to provide estimates into the doubling rate of gut bacteria in mice.34,35 However, these tools have limitations in that they primarily measure relative growth rates and they require the use of non-native, genetically modified organisms. As such, questions regarding the rate of gut bacteria PG turn-over in gut commensals are yet to be fully elucidated.
Figure 2.

Measurement of whole cell labeling with tetrazine-conjugated metabolic probes. (A) Chemical structures of d-PheZ and l-PheZ. (B) Schematic representation of the steps leading to surface tagging of bacterial cells following metabolic incorporation of d-amino acids. (C) Flow cytometry analysis of L. casei grown overnight with 25 μM d- or l-PheZ followed by treatment with 25 μM TCO-Cy5. (D) Flow cytometry analysis of L. casei grown to stationary phase and then treated with 25 μM d-PheZ, followed by TCO-Cy5 at different time points. (E) Flow cytometry analysis of L. casei treated overnight with 100 μM of d-PheZ. Subsequently, cells were incubated with 50 μM of TCO-Cy5 and then resuspended in the conditions noted. For the flow results, the fluorescence units are the mean fluorescence of the entire channel. Data are represented as mean +/− SD (n = 3). P-values were determined by a two-tailed t-test (* denotes a p-value < 0.05, ** < 0.01, ***<0.001, ns = not significant).
In the context of our assay, if there is considerably rapid PG biosynthesis (consistent with fast bacterial replication), the expectation would be that the PG probe would be readily incorporated into the cell wall, as it is typically observed in a nutrient-rich culture. To mimic fast-growth kinetics, Lactobacillus casei (L. casei) were diluted (1:100) and grown through log-phase in the presence of the phenylalanine derivative d-PheZ, followed by treatment with TCO-Cy5 dye (Figure 2C). L. casei is commonly found in the gut of humans and can be used as a model for PG remodeling.36 As expected, and similar to our previous results using other bacterial species, cellular fluorescence levels were significantly higher than untreated cells. Cells treated with l-PheZ29 showed a significantly lower level of fluorescence compared to treatment with d-PheZ. These results are anticipated because the d-enantiomer of non-canonical amino acids has been shown to be preferentially incorporated in the PG, while modified l-amino acids are not.14 Alternatively, we considered the possibility that bacterial cells in the gut may be in a slower-replicating (or quiescent) state. To approximate this, d-PheZ was added to stationary phase L. casei and fluorescence levels were monitored over time (Figure 2D). A clear increase in cellular fluorescence was observed despite limited cellular growth. It is likely that PG remodeling, rather than PG biosynthesis, could account for this increase in metabolic tagging.
Additionally, the kinetics of loss of the metabolic tag needed to be considered. To model this, L. casei from an overnight culture was labeled with the combination of d-PheZ and TCO-Cy5. Cells were washed, the supernatant was removed and replaced with either PBS or media isolated from L. casei in stationary growth (spent media). A third condition involved the back-dilution of cells into fresh media. From these results, it is evident that fresh media stimulates a rapid loss of surface tagging, presumably due to faster cellular growth and PG remodeling kinetics in the absence of the PG probe (Figure S1). Media promoting slower growth kinetics showed considerably slower loss in cellular fluorescence (Figure 2E). Therefore, we anticipate that loss of cellular tagging could be a proxy for the kinetics of cellular growth and remodeling, and, therefore, may be used to gain insight into PG remodeling in gut commensal bacteria.
While Cy5 can be used to image bacteria in the transparent C. elegans, it was necessary to switch to a NIR fluorophore (Cy7.5) to properly image gut commensal bacteria in mice. In vitro labeling of bacteria was performed to establish the suitability of TCO-Cy7.5 in PG tagging. Three species of bacteria were chosen: L. casei, Enterococcus faecalis (E. faecalis), and Lactobacillus plantarum (L. plantarum). These organisms have been previously found in the gut of humans.37 Cells were individually subjected to the 2-step surface tagging scheme and analyzed by flow cytometry (Figure S2). As expected due to the structural similar of Cy7.5 to Cy5, high levels of cellular fluorescence were observed across all species of bacteria. Background cellular fluorescence levels were low and, similarly, treatment with the dye alone (TCO-Cy7.5) led to minimal cellular fluorescence. Cell tagging with d-PheZ was also assessed by confocal microscopy and the labeling pattern was consistent with the metabolic incorporation with the PG scaffold (Figure S3).
These confirmatory results led us to test a similar bacterial labeling scheme in live mice. We first performed gut microbiota labeling in mice that have conventional microbiomes. For these experiments, mice were first orally gavaged with d-PheZ or l-PheZ, followed by a 2-hour chase period (to allow the unincorporated amino acid to passage), then administered with TCO-Cy7.5. Mice were imaged via NIRF-IVIS two hours following the gavaging with the dye (Figure 3). A measurable difference in fluorescence was observed in mice treated with the d-PheZ relative to the stereocontrol l-PheZ, a finding that is suggestive of cell wall labeling of gut commensals. Interestingly, it was observed that the labeling half-life was relatively short using d-PheZ, as evidenced by the decrease in fluorescence signal between 4 and 22 hours after the final dosing period (Figure S4). Together, these results establish that single d-amino acids can potentially be applied to illuminate the gut commensal community of live animals.
Figure 3.

Imaging of Mice with Cell Wall Probe. IVIS imaging of WT female mice orally gavaged with l-PheZ or d-PheZ (5 mM in 200 μL of PBS) twice (1 hour apart). After 4 hours, mice were orally administered TCO-Cy7.5 (1 mM in 100 μL of PBS). Imaging was performed 2 hours after dye administration.
Encouraged by the results of single d-amino acid gut labeling, and as an alternative strategy, we sought to image gut bacteria by using a one-step method in which the fluorophore is connected directly to the metabolic tag. A one-step labeling strategy is aimed at reducing the potential timing and cross-reactivity issues that could be associated with the 2-step IED-DA strategy. One option would be to directly conjugate the fluorophore onto the sidechain of a single d-amino acid (e.g., d-lysine). However, we hypothesized that large sidechains would significantly impede PG incorporation due to poor recognition by cell wall transpeptidases. This hypothesis was premised on our previous systematic study using a library of d-amino acid variants in which the fluorophore was held constant but the chemical structure of the sidechain varied in physical characteristics (size, length, flexibility, charge).31 Because NIR fluorophores are typically large (and often highly charged to compensate for the hydrophobicity of the elongated conjugated system), we had anticipated that modification of a NIR fluorophore onto the d-amino acid sidechain would greatly suppress PG incorporation. Instead, we envisioned that administration of a synthetic stem peptide analog conjugated to a NIR fluorophore would circumvent this challenge (Figure 4A). We38–41, and others42–44, have shown that treatment of bacterial cells with stem peptide analogs also result in their incorporation into the PG scaffold by PG-related transpeptidases (Figure 4B). The principal advantage of stem peptide analogs is that our laboratory previously showed that the N-terminus of a tetra- or penta- stem peptide analog demonstrates tolerability to large chemical modifications.
Figure 4.

One step labeling of Bacterial Cell Walls. (A) Chemical structure of d-Tet and description of the three primary design features. (B) Schematic representation of the mode of incorporation of d-Tet within existing PG in live bacteria. The tetrapeptide is expected to be processed by transpeptidases by the removal of the terminal D-Ala, which yields a thioester intermediate in the active site of Ldts. Subsequent capture by a nearby nucleophile leads to the formation of a stable covalent bond between the PG and the imaging probe. (C) L. casei treated overnight with 100 μM of l- or d-Tet and subsequently analyzed by flow cytometry. Data are represented as mean +/− SD (n = 3). P-values were determined by a two-tailed t-test (* denotes a p-value < 0.05, ** < 0.01, ***<0.001, ns = not significant).
We synthesized two analogs of the canonical stem peptide from PG with a NIR Cy7.5 covalently linked to the N-terminus (Figure 5A). One of the tetrapeptides (d-Tet) contained a d-alanine on the C-terminus, which mimics the native stem peptide of almost all known bacteria. We also synthesized a control diastereomer (l-Tet) in which a single stereocenter on the C-terminal alanine is in the l configuration, which prevents processing by bacterial transpeptidases.45 As a starting point, incorporation of the tetrapeptide tag (d-Tet) was first assessed in vitro (Figure 4C). As expected, bacterial cells treated with dD-Tet displayed notably higher cellular fluorescence relative to untreated cells and cells treated with the diastereomer l-Tet. With these results, we set out to evaluate the tetra-peptide probes in vivo. Mice were orally gavaged either d-Tet or l-Tet and imaged periodically afterwards using NIRF imaging (Figure 5A and 5B). Interestingly, in early time points there was minimal difference between the two treatment groups, which is likely reflective of tagging reagents undergoing peristaltic transit through the GI tract (Figure S5). After a chase period, there was a measurable difference in the fluorescence levels of mice administered the cell wall tags. Histological studies of the GI tract of mice treated with d-Tet was similar to that of untreated mice, which underscores the selectivity of metabolic incorporation of the probe and its lack of adverse interaction with the host cells (Figure 5C) These results, collectively, suggest that a stem-peptide analog d-Tet can selectively tag and report on the presence of gut bacteria in live mice.
Figure 5.

Live animal imaging after one-step metabolic tag. (A) IVIS imaging of female mice orally gavaged 2x, 1 h apart, with a tetrapeptide tag (1 mM in 100 μL of PBS) containing a terminal d-Ala (d-Tet), expected not to incorporate in the bacterial PG (left) and with a tetrapeptide tag containing a terminal l-Ala (l-Tet), expected to incorporate in the cell walls of bacteria in the mouse gut (right). Mice were imaged 22 hours after the final administration. (B) Quantification of panel (A). (C) Swiss rolls were prepared from colons (left panel) and small intestines (right panel) of mice treated with d-Tet or vehicle 22 hours after mice were last gavaged with the imaging probe.
To further evaluate the utility and applicability of this labeling strategy, we sought to test the imaging of Germ-Free (GF) mice (BALB/cAnNTac) that are devoid of a gut bacterial community. The lack of bacterial cells that can be metabolically labelled by our probe is expected to result in background levels of signals. These mice were gavaged with d-Tet as before and imaged (Figure 6A). The same mice were subsequently conventionalized by co-housing with SPF mice for 4 days to allow for a period of recovery upon introduction to a conventional vivarium. This was followed by a series of fecal microbiota transplantation (FMT) treatments (3 times, once a day) to robustly induce bacterial engraftment in the recipient mice. The mice were co-housed for an additional 10 days to promote the growth and repopulation of the gut bacterial communities. All together, these measures are consistent with the amount of time that is required to observe a stable level of bacterial cells in the GI tract of GF mice post FMT from donor SPF mice.46,47 Oral gavaging of d-Tet to mice was performed 2X on day one as described previously, followed by NIR imaging analysis 22 hours later. Our results show a marked increase in fluorescence (Figure 6A) in mice that were conventionalized relative to GF mice, which is consistent with the expected engraftment of bacterial cells. Ex-vivo imaging of the GI tract of the same mice demonstrated that the cecum and the large intestines appear to label more prominently, which would be consistent with a larger load of bacterial cells (Figure 6B). These results represent a promising first step to potentially extend this strategy in the future into a non-invasive imaging tool that can provide insight into the dynamics of the gut commensal bacteria.
Figure 6.

Imaging of Conventionalized Mice. (A) Left: IVIS imaging of GF BALB/cAnNTac mice orally gavaged 2x, 1 h apart, with d-Tet tag (1 mM in 100 μL of PBS) before conventionalization and imaged 22 hours after the final administration. Right: IVIS imaging of the same mice after conventionalization. Mice were orally gavaged 2x, 1 h apart, with d-Tet tag (1 mM in 100 μL of PBS) and imaged 22 hours after the final administration. On the day of the gavage, one of the mice bit through the gavaging tube resulting in evident staining of the mouth and paw areas, which is visible in the left panel B (bottom mouse). (B) Small and large intestines harvested from GF mice that were conventionalized by FMT and then gavaged with 100 uL of 1 mM d-Tet twice, one hour apart. Mice were sacrificed 22 h post final gavage and intestines were imaged using LagoX IVIS (ex 745 nm, em 810 nm, 30s exposure).
Discussion
In conclusion, we have demonstrated that cell wall probes can provide a potential route to the non-invasive imaging of gut commensal bacteria in mice. To this end, animals were administered synthetic analogs of PG (either single d-amino acids or tetrapeptide stem mimetics) to induce their metabolic incorporation into the PG scaffold. Single amino acid labeling was based on biorthogonal installation of a NIR fluorophore while the tetrapeptide was directly linked to the NIR fluorophore. Overall, there were discernable differences observed in both routes of tagging; however, the tetrapeptide labeling showed a stronger contrast between the metabolic tag and a stereocontrol. Interestingly, there was a relatively short half-life of the single d-amino acid PG label, which may indicate that the cell walls of gut commensals undergo considerable levels of PG remodeling. The difference between the kinetics of remodeling and/or bacterial growth is likely to be tied to the types of bacteria that metabolically incorporate each type of probe. Given that they likely operate via distinct mechanisms, they may be targeting different strains of gut microbiota. We are currently investigating how cell wall probes could be leveraged to more precisely visualize cell wall biosynthesis in live animal hosts. Finally, we demonstrated that our labeling strategy could illuminate the colonization of GF mice following FMT. In the future, we plan to optimize the labeling conditions to gain greater insight into the dynamics related to cell wall biology in gut bacteria of live mice in response to various stressors (antibiotics, bacteriophage, and probiotics).
While the cell wall label strategy at this stage does not provide a full range of dynamic features of the microbiota population, our data suggests that it may provide (in the future iterations) key insights into cell wall remodeling/bacterial cell growth. The 16S technology is a much more mature technology and its more recent iterations are now providing a higher level of information. Likewise, we anticipate that future iterations of cell wall labeling in combination with non-invasive imaging will similarly evolve to provide a richer range of information in relation to microbiota cell wall dynamics.
Limitations of the study. While it would be ideal that a labeling strategy of the gut microbiome would access all commensal bacteria equally, it is difficult to project which species of bacteria are labeled with the metabolic labels described. In fact, it is likely that the single amino acids may label a different population than bacteria label with the larger stem peptide analog. Moreover, the larger tetrapeptide analog would be expected to have low permeability into the periplasmic space of Gram-negative bacteria. As such, the tetrapeptide would be limited to labeling primarily Gram-positive organisms. Another limitation is that NIR imaging can have relatively poor spatial resolution, a feature that could be improved with a change in the imaging moiety (e.g., by using ligands compatible with SPECT imaging). Finally, it was observed that the half life of the metabolic tags was unexpectedly short and this could pose some limitations on the types of studies that are used to study gut microbiome dynamics.
Significance
The discovery of the mechanisms underpinning the interactions between gut bacteria and their host requires tools that provide real time information on this community. As animal models for human diseases have improved over the years, it has become possible to use these models to understand basic biology and gain foundational knowledge to enable translational research. Pathophysiological changes to animals need to be assessed and monitored to further describe cause and effect relationships. In recent years, a number of imaging techniques have been widely adopted that provide a dynamic, non-invasive assessment of the same animal subject, which can reduce experimental variability and provide a clearer response to potential therapeutics. While these imaging techniques have improved our understanding of human pathology – most notably cancer biology – these technical gains have not been observed in the imaging of gut bacterial communities. We describe a strategy of non-invasive commensal bacteria imaging that takes advantage of the ability of bacterial cells to metabolically incorporate analogs of their cell walls to ultimately illuminate the gut bacteria of mice.
STAR METHOD
RESOURCE AVAILABILITY
Lead Contact
Further information and requests for resources and reagents should be directed to and will be fulfilled by the lead contact, Marcos Pires (mpires@virginia.edu).
Materials availability
Experimental materials generated in this study are available upon request. Depending on the reagent and institution of origin, an MTA might be required.
Data and code availability
All data reported in this paper will be shared by the lead contact upon request.
This paper does not report original code.
Any additional information required to reanalyze the data reported in this paper is available from the lead contact upon request
Experimental Model and Subject Details
Bacteria Cell Culture
Bacterial cells were cultured in specific media in an aerobic environment shaking at 250 rpm at 37 °C. Bacterial strains Lactobacillus casei (ATCC 393) and Lactobacillus plantarum (ATCC 21028) were grown in lactobacillus MRS broth for in vitro studies. Enterococcus faecium (ATCC 29212) was grown in Brain Heart Infusion (BHI) broth for in vitro studies.
Animals
The mice in this experiment were handled and processed in accordance with the protocol approved by the University of Virginia Animal Care and Use Committee in accordance with current guidelines of National Institutes of Health Model Procedure of Animal Care and Use. 15–16 week-old female BALB/c mice were purchased from Charles River laboratories and maintained in pathogen-free barrier facilities at the University of Virginia. Germ-free 16 week-old female BALB/c mice were purchased from Taconic laboratories and gavaged/imaged immediately upon arrival to UVA. Following the first round of imaging, germ-free mice were conventionalized by fecal oral gavage as previously reported (PMID 31064848). Briefly, cecal contents from wild-type mice housed in pathogen-free conditions at UVA were collected, homogenized, and frozen at −80 °C in sterile 1:1 glycerol/PBS. Germ-free mice were orally gavaged for three consecutive days with the cecal slurry, and allowed to engraft for two weeks. During this period, and prior to the second round of imaging, conventionalized germ-free mice were co-housed with wild-type mice. All experiments in this study were approved by the University of Virginia Institutional Animal Care and Use Committee.
Method Details
Reagents
Materials.
All peptide related reagents (resin, coupling reagent, deprotection reagent, amino acids, and cleavage reagents) were purchased from ChemImpex. Sulfo-Cy7.5-NHS was purchase from Lumiprobe. TCO-Amine was purchased from Click Chemistry Tools. Nickel (II) trifluoromethanesulfonate, anhydrous hydrazine, and sodium nitrite were purchased from Sigma Aldrich.
In vitro flow cytometry analysis of bacterial labeling with single amino acid probes.
Media (200 μL per well) containing 25 μM of each single amino acid were prepared. Bacterial cells from an overnight culture (3 mL) were added to the medium (1:100 dilution) to a total volume of 200 μL and allowed to grow overnight at 37°C with shaking at 250 rpm. The bacteria were harvested at 6,000g and washed three times with original culture volume of 1X PBS followed by fixation with 2% formaldehyde in 1X PBS for 30 min at room temperature. The cells were washed once more to remove formaldehyde and then resuspended in culture volume (200 μL) of 50 μM Cy5-TCO (Click Chemistry Tools) for 30 min at room temperature with shaking. Cells were washed three times with 1X PBS before analysis with an AttuneNxT (Thermo Fisher) flow cytometer equipped with a 638 nm laser and 670/14 nm bandpass filter. The data were analyzed using the AttuneNxT Software, where populations were gated and no less than 10,000 events per sample were recorded. For the flow results, the fluorescence units are the mean fluorescence of the entire channel.
In vitro flow cytometry analysis of bacterial labeling with tetrapeptide probes.
Media (200 μL per well) containing 100 μM of each probe were prepared. Bacterial cells from an overnight culture (3 mL) were added to the medium (1:100 dilution) to a total volume of 200 μL and allowed to grow overnight at 37°C with shaking at 250 rpm. The bacteria were harvested at 6,000g and washed three times with original culture volume of 1X PBS followed by fixation with 2% formaldehyde in 1X PBS for 30 min at room temperature. The cells were washed once more to remove formaldehyde and then analyzed using a Cytoflex S (Beckmann Coulter) flow cytometer equipped with an 808 nm laser and 840/20 nm bandpass filter. The data were analyzed using the CytExpert Software, where populations were gated and no less than 10,000 events per sample were recorded. For the flow results, the fluorescence units are the mean fluorescence of the entire channel.
In vitro confocal imaging of bacterial labeling with single amino acid probes.
Media (3 mL) containing 100 μM of D-PheZ were prepared. Bacterial cells from an overnight culture were added to the medium (1:100 dilution) to a total volume of 3 mL and allowed to grow overnight at 37°C with shaking at 250 rpm. The bacteria were harvested at 6,000g and washed three times with original culture volume of 1X PBS followed by fixation with 2% formaldehyde in 1X PBS for 30 min at room temperature. The cells were washed once more to remove formaldehyde and then resuspended in 50 μM of Cy5-TCO (Click Chemistry Tools) for 30 min at room temperature with shaking. Cells were washed three times with 1X PBS before confocal analysis. Glass microscope slides were spotted with a 1% agarose pad and 2 μL of fixed bacterial samples were deposited onto the agarose. Samples were covered with a micro cover glass and imaged using a Zeiss 880/990 multiphoton Airyscan microscopy system (63x oil-immersion lens) equipped with a 639 nm laser. Images were obtained and analyzed via Zeiss Zen software. We acknowledge the Keck Center for Cellular Imaging and for the usage of the Zeiss 880/980 multiphoton Airyscan microscopy system (PI- AP: NIH-OD025156).
In vitro flow cytometry analysis of L. casei with resuspension conditions.
Media (3 mL) containing 100 μM of D-PheZ or no probe were inoculated with L. casei cells 1:100 from an overnight culture (3 mL). These cells were allowed to grow overnight to stationary phase, where they were then harvested at 6,000 ×g for 2 mins. The supernatant (3 mL) from the overnight culture of blank cells was saved as “spent media.” Then, the cells were washed three times with 1X PBS at original culture volume. The pellets were resuspended (3 mL) in 50 μM TCO-Cy5 for 30 mins at room temperature with shaking. After 30 mins, cells were harvested and washed three times as before. Each sample was then resuspended in “spent” media, PBS, or fresh media. A time 0 sample was taken (50 μL) before the cells were allowed to shake and time point samples were then collected every 2 hours (up to 8 hours with one sample taken at 22 hours) with washing three times, before analysis by flow cytometry, using the AttuneNxT parameters described above. Loss of fluorescence signal over time from fresh media was attributed to cell growth as measured by OD600 - As described above cells resuspended in fresh media (15 μL of cells + 485 μL of MRS media) were incubated at 37 °C and optical density of suspension was measured at 15 min., 2, 4 and 20 h times points. The observed ODs for L. casei were 0.209, 0.311, 0.501 and 1.70 indicating cell numbers were increasing with incubation time.
In vivo gut labeling and imaging of mice with single amino acid probes (two step).
Mice were orally gavaged twice with 200 μL of 5 mM of D-PheZ or L-PheZ, one hour apart. Four hours later, mice were orally gavaged with 100 μL of 1 mM Sulfo-Cy7.5-TCO. Images of live mice were taken at selected time points after the final gavage. To image, mice were anesthetized with vaporized isoflurane (covetrus) by use of an anesthetic machine to enable imaging. Images were taken using Spectral Instruments Lago X bioluminescence, fluorescence, and X-ray scanner with the fluorescence excitation set to 745 nm and the emission set to 810 nm. Images were processed using the Spectral Imaging software.
In vivo gut labeling and imaging of mice with tetrapeptide probes (one step).
Mice were orally gavaged with 100 μL of 1 mM of each probe twice, one hour apart. Images were taken at selected time points starting two hours after the final gavage. To image, mice were anesthetized and imaged with the parameters previously described.
In vivo gut labeling and imaging of GF mice with tetrapeptide probes (one step).
Mice (BALB/cAnNTac from Tacomic) were orally gavaged with 100 μL of 1 mM of each probe twice, one hour apart. Images of live mice were taken at selected time points starting two hours after the final gavage, using the parameters previously described. Conventionalized mice were orally gavaged with 100 μL of 1 mM of each probe twice, one hour apart. Images of live mice were taken at selected time points starting two hours after the final gavage, followed by imaging as described above.
Chemical Synthesis
General Methods for Chemical Synthesis
All solvents and reagents were obtained from commercial sources and were used as such.
Boc-4-cyano-D-phenylalanine (1.00 g, 3.45 mmol) or Boc-4-cyano-L-phenylalanine were added to a reaction vessel with a stir bar. Nickel (II) trifluoromethanesulfonate (61.6 mg, 0.17 mmol), acetonitrile (1.80 mL, 34.5 mmol), and anhydrous hydrazine (5.50 mL, 172 mmol) were added. The vessel was sealed, and the mixture stirred in an oil bath for 24 hr at 60°C. The solution was cooled to room temperature, followed by the dropwise addition of sodium nitrite (4.76g, 69.0 mmol) in 8 mL of water. 1M HCl was added dropwise until gas evolution ceased and pH of the solution was 3. The mixture was extracted with EtOAc, organic phase dried with MgSO4. The Boc-protected tetrazine was dissolved in DMF (20 mL), followed by the addition of HBTU (3 eq, 3.16g, 8.33 mmol) and DIEA (6 eq, 2.90 mL, 16.6 mmol). The mixture was added to a peptide vessel containing rink amide resin (5.00g, 2.05 mmol) and the vessel was incubated for 2 hr at ambient temperature with shaking. The resin was washed with DCM, MeOH, DCM, MeOH, DCM 2X (15 mL each). The resin was transferred to a round bottom flask and a solution of TFA/DCM (30:70, 30 mL) was added and stirred for 1 hr on ice. The residue was triturated with cold diethyl ether and the precipitate was purified by reversed phase HPLC (RP-HPLC) using a C18(2) column (Phenomenex) to yield D-PheZ or L-PheZ as a pink solid.
Analytical HPLC analysis of d-PheZ. Solvent A (H2O 0.01% TFA) Solvent B (MeCN 0.01% TFA). 5% Solvent B to 100% Solvent B over 50 mins; absorbance measured at 220 nm.

[M+H]+ calculated = 259.1302, observed = 259.1302
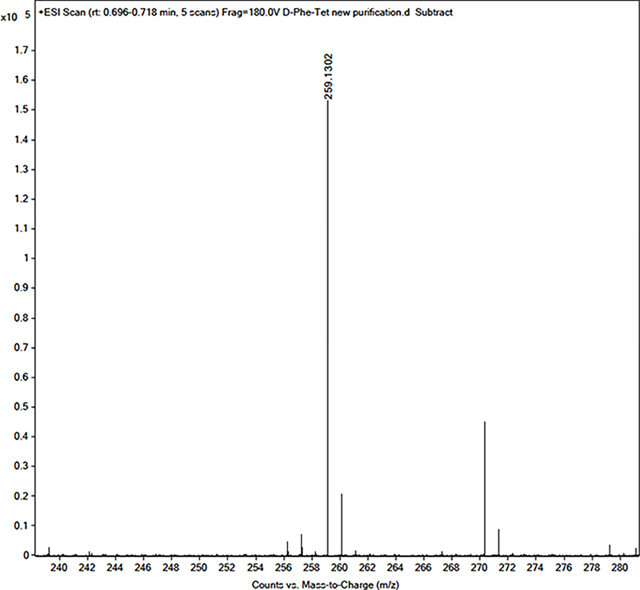
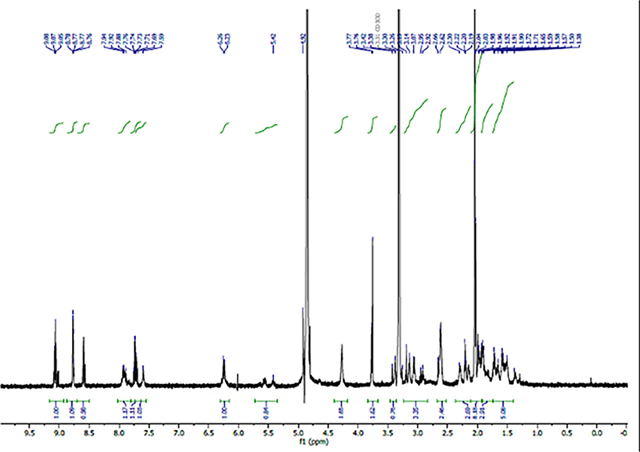
1H NMR (600 MHz, CD3OD) δ 8.56 (d, J = 6.0 Hz, 2H, 2’-ArH), 7.58 (d, J = 6.0 Hz, 2H, 3’-ArH), 4.19 (t, J=6.0 Hz, 1H, CH), 3.37 (dd, J=6.0, 18Hz, 1H, CH2), 3.19 (dd, J=6.0, 18Hz, 1H, CH2), 3.05 (s, 3H, CH3).

Analytical HPLC analysis of L-PheZ. Solvent A (H2O 0.01% TFA) Solvent B (MeCN 0.01% TFA). 5% Solvent B to 100% Solvent B over 50 mins; absorbance measured at 220 nm.

[M+H]+ calculated = 259.1302, observed = 259.1297
[M+Na]+ calculated = 281.1121, observed = 281.1117

1H NMR (600 MHz, CD3OD) δ 8.56 (d, J = 6.0 Hz, 2H, 2’-ArH), 7.58 (d, J = 6.0 Hz, 2H, 3’-ArH), 4.18 (t, J=6.0 Hz, 1H, CH), 3.37 (dd, J=6.0, 18Hz, 1H, CH2), 3.20 (dd, J=6.0, 18Hz, 1H, CH2), 3.05 (s, 3H, CH3).

SulfoCy7.5 NHS Ester (Lumiprobe) was reacted with TCO-Amine HCl (Click Chemistry Tools) and DIEA was added to the solution (in DMSO, 1 Sulfo Cy7.5 NHS ester : 1 TCO-Amine : 7 DIEA). The reaction was purified using RP-HPLC equipped with a C8(2) column.
Analytical HPLC analysis of SulfoCy7.5-TCO. Solvent A (H2O 0.01% TFA) Solvent B (MeCN 0.01% TFA). 5% Solvent B to 100% Solvent B over 50 mins; absorbance measured at 220 nm.

[M+H]+ calculated = 1178.3710, observed = 1178.7711
[M+2H]2+ calculated = 589.6891, observed = 589. 4264


1H NMR (600 MHz, CD3OD)
Fmoc-D-Ala-OH or Fmoc-L-Ala-OH (1.1 eq, 188 mg, 0.605 mmol) was added to a 25 mL peptide synthesis vessel charged with 2-chlorotrityl chloride resin (500 mg, 0.55 mmol) and DIEA (4 eq, 0.382 mL, 2.20 mmol) in dry DCM (5 mL). The resin was agitated for 1 h at ambient temperature and washed with MeOH and DCM (3 × 15 mL each). The Fmoc protecting group was removed with 20% piperidine in DMF (15 ml) for 30 min at ambient temperature, then washed as before. Fmoc-L-Lys(Ac)-OH (3 eq, 677 mg, 1.65 mmol), HBTU (3 eq, 625 mg, 1.65 mmol), and DIEA (6 eq, 0.574 mL, 3.30 mmol) in DMF (10 mL) were added to the reaction flask and agitated for 2 h at ambient temperature. The Fmoc deprotection and coupling procedure was repeated as before using the same equivalencies with Fmoc-D-glutamic acid α-amide (3 eq, 608 mg, 1.65 mmol) and then with Fmoc-L-Alanine-OH (3 eq, 514 mg, 1.65 mmol). The Fmoc group at the N-terminus was removed and the peptide was cleaved from resin with a solution of TFA/H2O/TIPS (95%, 2.5%, 2.5%, 20 mL) with agitation for 2 h at ambient temperature. The resin was filtered and resulting solution concentrated in vacuo. The residue was triturated with cold diethyl ether and then reacted with Sulfo-Cy7.5 NHS ester (2 mg) in DMF (250 μL) and DIEA (50 μL, 0.288 mmol) for 4 h at room temperature. The peptide was then crashed out in cold diethyl ether, concentrated in vacuo, and purified by RP-HPLC.
Analytical HPLC analysis of l-Tet. Solvent A (H2O 0.01% TFA) Solvent B (MeCN 0.01% TFA). 5% Solvent B to 100% Solvent B over 50 mins; absorbance measured at 220 nm.

Expected [M+H]+ = 1410.627, Observed = 1410.249

Analytical HPLC analysis of d-PheZ. Solvent A (H2O 0.01% TFA) Solvent B (MeCN 0.01% TFA). 5% Solvent B to 100% Solvent B over 50 mins; absorbance measured at 220 nm.

Expected [M+H]+ = 1410.627, Observed = 1410.274

1H NMR (600 MHz, CD3OD)

Quantification and Statistical Analysis
Statistical parameters are reported in Figure Legends and in Method Details. The data (mean ± S.D.; n ≥ 3) were statistically analyzed, by one-way ANOVA with Dunnet posttests by using GraphPad Prism 5 software. ns, not significant; *, p < 0.05; **, p < 0.01; ***, p < 0.001; ****, p < 0.0001.
Supplementary Material
Scheme S1. Synthesis of d- and l-Phe-Z. 29.

Scheme S2. Synthesis of SulfoCy7.5-TCO.

Scheme S3. Synthesis of D- or L-Tet.

KEY RESOURCES TABLE.
| REAGENT or RESOURCE | SOURCE | IDENTIFIER |
|---|---|---|
| Antibodies | ||
| Bacterial and virus strains | ||
| Lactobacillus casei | American Type Culture Collection | ATCC 393 |
| Lactobacillus plantarum | American Type Culture Collection | ATCC 21028 |
| Enterococcus faecium | American Type Culture Collection | ATCC 29212 |
| Biological samples | ||
| Chemicals, peptides, and recombinant proteins | ||
| Sulfo-Cy7.5-NHS | Lumiprobe | cat # 46320 |
| Sulfo-Cy7.5-TCO | Broadpharm | cat # BP-22424 |
| TCO-Amine | Click Chemistry Tools | cat # 1021-25 |
| Cy5-TCO | Click Chemistry Tools | cat # 1089-5 |
| MRS | Millipore Sigma | cat # 69966 |
| Brain Heart Infusion | Millipore Sigma | cat # 53286 |
| Nickel (II) trifluoromethanesulfonate | Millipore Sigma | cat # 731331-1G |
| anhydrous hydrazine | Millipore Sigma | cat # 215155 |
| sodium nitrite | Millipore Sigma | cat # 237213 |
| Critical commercial assays | ||
| Deposited data | ||
| Experimental models: Cell lines | ||
| Experimental models: Organisms/strains | ||
| female BALB/c mice | Charles River Laboratories | https://www.criver.com/animal-model-ordering?product_id=389 |
| BALB/cAnNTac Germ Free mice | Tacomic | https://www.taconic.com/customer-service/start-an-order/?catalogNumber=BALB |
| Oligonucleotides | ||
| Recombinant DNA | ||
| Software and algorithms | ||
| ChemDraw 18.2 | PerkinElmer | https://perkinelmerinformatics.com/products/research/chemdraw/ |
| Aura Spectral Instruments Imaging 4.0.0 | Spectral Instruments Imaging | https://spectralinvivo.com/software/ |
| AttuneNxT Software | ThermoFisher | https://www.thermofisher.com/us/en/home/life-science/cell-analysis/flow-cytometry/flow-cytometers/attune-nxt-flow-cytometer/resources.html |
| CytExpert Software | Beckman Coulter | https://www.beckman.com/flow-cytometry |
| Zeiss Zen software | Zeiss | https://www.zeiss.com/microscopy/en/products/software/zeiss-zen.html |
| Other | ||
Highlights.
Bacterial cell walls are metabolically remodeled with synthetic building blocks
In vivo click chemistry results in installation of near infrared fluorescent probes
Gut microbiota of live mice is imaged over time
Fecal microbiota transplant results in increase in fluorescence in germ-free mice
Acknowledgements
This study was supported by the NIH grant GM124893-01 (M.M.P.) and 1R01CA253285 from the NCI (M.R.R.).
Footnotes
Declaration of Interests
The authors declare no competing interests.
Publisher's Disclaimer: This is a PDF file of an unedited manuscript that has been accepted for publication. As a service to our customers we are providing this early version of the manuscript. The manuscript will undergo copyediting, typesetting, and review of the resulting proof before it is published in its final form. Please note that during the production process errors may be discovered which could affect the content, and all legal disclaimers that apply to the journal pertain.
References
- 1.Sender R, Fuchs S, and Milo R (2016). Revised Estimates for the Number of Human and Bacteria Cells in the Body. PLoS Biol 14, e1002533. 10.1371/journal.pbio.1002533. [DOI] [PMC free article] [PubMed] [Google Scholar]
- 2.Fan Y, and Pedersen O (2021). Gut microbiota in human metabolic health and disease. Nat Rev Microbiol 19, 55–71. 10.1038/s41579-020-0433-9. [DOI] [PubMed] [Google Scholar]
- 3.Shreiner AB, Kao JY, and Young VB (2015). The gut microbiome in health and in disease. Curr Opin Gastroenterol 31, 69–75. 10.1097/MOG.0000000000000139. [DOI] [PMC free article] [PubMed] [Google Scholar]
- 4.Guarner F, and Malagelada JR (2003). Gut flora in health and disease. Lancet 361, 512–519. 10.1016/S0140-6736(03)12489-0. [DOI] [PubMed] [Google Scholar]
- 5.Belkaid Y, and Hand TW (2014). Role of the microbiota in immunity and inflammation. Cell 157, 121–141. 10.1016/j.cell.2014.03.011. [DOI] [PMC free article] [PubMed] [Google Scholar]
- 6.Gabanyi I, Lepousez G, Wheeler R, Vieites-Prado A, Nissant A, Wagner S, Moigneu C, Dulauroy S, Hicham S, Polomack B, et al. (2022). Bacterial sensing via neuronal Nod2 regulates appetite and body temperature. Science 376, eabj3986. 10.1126/science.abj3986. [DOI] [PubMed] [Google Scholar]
- 7.Griffin ME, Espinosa J, Becker JL, Luo JD, Carroll TS, Jha JK, Fanger GR, and Hang HC (2021). Enterococcus peptidoglycan remodeling promotes checkpoint inhibitor cancer immunotherapy. Science 373, 1040–1046. 10.1126/science.abc9113. [DOI] [PMC free article] [PubMed] [Google Scholar]
- 8.Vollmer W, Blanot D, and de Pedro MA (2008). Peptidoglycan structure and architecture. FEMS Microbiol Rev 32, 149–167. 10.1111/j.1574-6976.2007.00094.x. [DOI] [PubMed] [Google Scholar]
- 9.Han S, Van Treuren W, Fischer CR, Merrill BD, DeFelice BC, Sanchez JM, Higginbottom SK, Guthrie L, Fall LA, Dodd D, et al. (2021). A metabolomics pipeline for the mechanistic interrogation of the gut microbiome. Nature 595, 415–420. 10.1038/s41586-021-03707-9. [DOI] [PMC free article] [PubMed] [Google Scholar]
- 10.Typas A, Banzhaf M, Gross CA, and Vollmer W (2011). From the regulation of peptidoglycan synthesis to bacterial growth and morphology. Nat Rev Microbiol 10, 123–136. 10.1038/nrmicro2677. [DOI] [PMC free article] [PubMed] [Google Scholar]
- 11.Lovering AL, Safadi SS, and Strynadka NC (2012). Structural perspective of peptidoglycan biosynthesis and assembly. Annu Rev Biochem 81, 451–478. 10.1146/annurev-biochem-061809-112742. [DOI] [PubMed] [Google Scholar]
- 12.Holtje JV (1998). Growth of the stress-bearing and shape-maintaining murein sacculus of Escherichia coli. Microbiol Mol Biol Rev 62, 181–203. 10.1128/MMBR.62.1.181-203.1998. [DOI] [PMC free article] [PubMed] [Google Scholar]
- 13.Silhavy TJ, Kahne D, and Walker S (2010). The bacterial cell envelope. Cold Spring Harb Perspect Biol 2, a000414. 10.1101/cshperspect.a000414cshperspect.a000414[pii]. [DOI] [PMC free article] [PubMed] [Google Scholar]
- 14.Kuru E, Hughes HV, Brown PJ, Hall E, Tekkam S, Cava F, de Pedro MA, Brun YV, and VanNieuwenhze MS (2012). In Situ probing of newly synthesized peptidoglycan in live bacteria with fluorescent D-amino acids. Angew Chem Int Ed Engl 51, 12519–12523. 10.1002/anie.201206749. [DOI] [PMC free article] [PubMed] [Google Scholar]
- 15.Siegrist MS, Whiteside S, Jewett JC, Aditham A, Cava F, and Bertozzi CR (2013). (D)-Amino acid chemical reporters reveal peptidoglycan dynamics of an intracellular pathogen. ACS Chem Biol 8, 500–505. 10.1021/cb3004995. [DOI] [PMC free article] [PubMed] [Google Scholar]
- 16.Bisson-Filho AW, Hsu YP, Squyres GR, Kuru E, Wu F, Jukes C, Sun Y, Dekker C, Holden S, VanNieuwenhze MS, et al. (2017). Treadmilling by FtsZ filaments drives peptidoglycan synthesis and bacterial cell division. Science 355, 739–743. 10.1126/science.aak9973 355/6326/739 [pii]. [DOI] [PMC free article] [PubMed] [Google Scholar]
- 17.Pilhofer M, Aistleitner K, Biboy J, Gray J, Kuru E, Hall E, Brun YV, VanNieuwenhze MS, Vollmer W, Horn M, and Jensen GJ (2013). Discovery of chlamydial peptidoglycan reveals bacteria with murein sacculi but without FtsZ. Nat Commun 4, 2856. 10.1038/ncomms3856ncomms3856 [pii]. [DOI] [PMC free article] [PubMed] [Google Scholar]
- 18.Fleurie A, Lesterlin C, Manuse S, Zhao C, Cluzel C, Lavergne JP, Franz-Wachtel M, Macek B, Combet C, Kuru E, et al. (2014). MapZ marks the division sites and positions FtsZ rings in Streptococcus pneumoniae. Nature 516, 259–262. 10.1038/nature13966 nature13966 [pii]. [DOI] [PMC free article] [PubMed] [Google Scholar]
- 19.Liechti GW, Kuru E, Hall E, Kalinda A, Brun YV, VanNieuwenhze M, and Maurelli AT (2014). A new metabolic cell-wall labelling method reveals peptidoglycan in Chlamydia trachomatis. Nature 506, 507–510. 10.1038/nature12892. [DOI] [PMC free article] [PubMed] [Google Scholar]
- 20.Faure LM, Fiche JB, Espinosa L, Ducret A, Anantharaman V, Luciano J, Lhospice S, Islam ST, Treguier J, Sotes M, et al. (2016). The mechanism of force transmission at bacterial focal adhesion complexes. Nature 539, 530–535. 10.1038/nature20121 nature20121 [pii]. [DOI] [PMC free article] [PubMed] [Google Scholar]
- 21.Qiao Y, Lebar MD, Schirner K, Schaefer K, Tsukamoto H, Kahne D, and Walker S (2014). Detection of lipid-linked peptidoglycan precursors by exploiting an unexpected transpeptidase reaction. J Am Chem Soc 136, 14678–14681. 10.1021/ja508147s. [DOI] [PMC free article] [PubMed] [Google Scholar]
- 22.Lebar MD, May JM, Meeske AJ, Leiman SA, Lupoli TJ, Tsukamoto H, Losick R, Rudner DZ, Walker S, and Kahne D (2014). Reconstitution of peptidoglycan cross-linking leads to improved fluorescent probes of cell wall synthesis. J Am Chem Soc 136, 10874–10877. 10.1021/ja505668f. [DOI] [PMC free article] [PubMed] [Google Scholar]
- 23.Shieh P, Siegrist MS, Cullen AJ, and Bertozzi CR (2014). Imaging bacterial peptidoglycan with near-infrared fluorogenic azide probes. Proc Natl Acad Sci U S A 111, 5456–5461. 10.1073/pnas.1322727111 1322727111 [pii]. [DOI] [PMC free article] [PubMed] [Google Scholar]
- 24.Ngo JT, Adams SR, Deerinck TJ, Boassa D, Rodriguez-Rivera F, Palida SF, Bertozzi CR, Ellisman MH, and Tsien RY (2016). Click-EM for imaging metabolically tagged nonprotein biomolecules. Nat Chem Biol 12, 459–465. 10.1038/nchembio.2076 nchembio.2076 [pii]. [DOI] [PMC free article] [PubMed] [Google Scholar]
- 25.Wang W, Lin L, Du Y, Song Y, Peng X, Chen X, and Yang CJ (2019). Assessing the viability of transplanted gut microbiota by sequential tagging with D-amino acid-based metabolic probes. Nat Commun 10, 1317. 10.1038/s41467-019-09267-x. [DOI] [PMC free article] [PubMed] [Google Scholar]
- 26.Lin L, Song J, Du Y, Wu Q, Gao J, Song Y, Yang C, and Wang W (2020). Quantification of Bacterial Metabolic Activities in the Gut by d-Amino Acid-Based In Vivo Labeling. Angew Chem Int Ed Engl 59, 11923–11926. 10.1002/anie.202004703. [DOI] [PubMed] [Google Scholar]
- 27.Wang W, Yang Q, Du Y, Zhou X, Du X, Wu Q, Lin L, Song Y, Li F, Yang C, and Tan W (2020). Metabolic Labeling of Peptidoglycan with NIR-II Dye Enables In Vivo Imaging of Gut Microbiota. Angew Chem Int Ed Engl 59, 2628–2633. 10.1002/anie.201910555. [DOI] [PubMed] [Google Scholar]
- 28.Hudak JE, Alvarez D, Skelly A, von Andrian UH, and Kasper DL (2017). Illuminating vital surface molecules of symbionts in health and disease. Nat Microbiol 2, 17099. 10.1038/nmicrobiol.2017.99. [DOI] [PMC free article] [PubMed] [Google Scholar]
- 29.Pidgeon SE, and Pires MM (2017). Cell Wall Remodeling of Staphylococcus aureus in Live Caenorhabditis elegans. Bioconjug Chem 28, 2310–2315. 10.1021/acs.bioconjchem.7b00363. [DOI] [PubMed] [Google Scholar]
- 30.Fura JM, Sabulski MJ, and Pires MM (2014). D-amino acid mediated recruitment of endogenous antibodies to bacterial surfaces. ACS Chem Biol 9, 1480–1489. 10.1021/cb5002685. [DOI] [PubMed] [Google Scholar]
- 31.Fura JM, Kearns D, and Pires MM (2015). D-Amino Acid Probes for Penicillin Binding Protein-based Bacterial Surface Labeling. J Biol Chem 290, 30540–30550. 10.1074/jbc.M115.683342. [DOI] [PMC free article] [PubMed] [Google Scholar]
- 32.Blackman ML, Royzen M, and Fox JM (2008). Tetrazine ligation: fast bioconjugation based on inverse-electron-demand Diels-Alder reactivity. J Am Chem Soc 130, 13518–13519. 10.1021/ja8053805. [DOI] [PMC free article] [PubMed] [Google Scholar]
- 33.Wu K, Yee NA, Srinivasan S, Mahmoodi A, Zakharian M, Mejia Oneto JM, and Royzen M (2021). Click activated protodrugs against cancer increase the therapeutic potential of chemotherapy through local capture and activation. Chem Sci 12, 1259–1271. 10.1039/d0sc06099b. [DOI] [PMC free article] [PubMed] [Google Scholar]
- 34.Korem T, Zeevi D, Suez J, Weinberger A, Avnit-Sagi T, Pompan-Lotan M, Matot E, Jona G, Harmelin A, Cohen N, et al. (2015). Growth dynamics of gut microbiota in health and disease inferred from single metagenomic samples. Science 349, 1101–1106. 10.1126/science.aac4812. [DOI] [PMC free article] [PubMed] [Google Scholar]
- 35.Myhrvold C, Kotula JW, Hicks WM, Conway NJ, and Silver PA (2015). A distributed cell division counter reveals growth dynamics in the gut microbiota. Nat Commun 6, 10039. 10.1038/ncomms10039. [DOI] [PMC free article] [PubMed] [Google Scholar]
- 36.Hill D, Sugrue I, Tobin C, Hill C, Stanton C, and Ross RP (2018). The Lactobacillus casei Group: History and Health Related Applications. Front Microbiol 9, 2107. 10.3389/fmicb.2018.02107. [DOI] [PMC free article] [PubMed] [Google Scholar]
- 37.Human Microbiome Project C (2012). Structure, function and diversity of the healthy human microbiome. Nature 486, 207–214. 10.1038/nature11234. [DOI] [PMC free article] [PubMed] [Google Scholar]
- 38.Pidgeon SE, Apostolos AJ, Nelson JM, Shaku M, Rimal B, Islam MN, Crick DC, Kim SJ, Pavelka MS, Kana BD, and Pires MM (2019). L,D-Transpeptidase Specific Probe Reveals Spatial Activity of Peptidoglycan CrossLinking. ACS Chem Biol 14, 2185–2196. 10.1021/acschembio.9b00427. [DOI] [PMC free article] [PubMed] [Google Scholar]
- 39.Dalesandro BE, and Pires MM (2021). Induction of Endogenous Antibody Recruitment to the Surface of the Pathogen Enterococcus faecium. ACS Infect Dis 7, 1116–1125. 10.1021/acsinfecdis.0c00547. [DOI] [PMC free article] [PubMed] [Google Scholar]
- 40.Apostolos AJ, Pidgeon SE, and Pires MM (2020). Remodeling of Cross-bridges Controls Peptidoglycan Cross-linking Levels in Bacterial Cell Walls. ACS Chem Biol 15, 1261–1267. 10.1021/acschembio.0c00002. [DOI] [PMC free article] [PubMed] [Google Scholar]
- 41.Apostolos AJ, Nelson JM, Silva JRA, Lameira J, Achimovich AM, Gahlmann A, Alves CN, and Pires MM (2020). Facile Synthesis and Metabolic Incorporation of m-DAP Bioisosteres Into Cell Walls of Live Bacteria. ACS Chem Biol 15, 2966–2975. 10.1021/acschembio.0c00618. [DOI] [PMC free article] [PubMed] [Google Scholar]
- 42.Ngadjeua F, Braud E, Saidjalolov S, Iannazzo L, Schnappinger D, Ehrt S, Hugonnet JE, Mengin-Lecreulx D, Patin D, Etheve-Quelquejeu M, et al. (2018). Critical Impact of Peptidoglycan Precursor Amidation on the Activity of l,d-Transpeptidases from Enterococcus faecium and Mycobacterium tuberculosis. Chemistry 24, 5743–5747. 10.1002/chem.201706082. [DOI] [PubMed] [Google Scholar]
- 43.Gautam S, Kim T, Shoda T, Sen S, Deep D, Luthra R, Ferreira MT, Pinho MG, and Spiegel DA (2015). An Activity-Based Probe for Studying Crosslinking in Live Bacteria. Angew Chem Int Ed Engl 54, 10492–10496. 10.1002/anie.201503869. [DOI] [PubMed] [Google Scholar]
- 44.Lin H, Lin L, Du Y, Gao J, Yang C, and Wang W (2021). Biodistributions of l,d-Transpeptidases in Gut Microbiota Revealed by In Vivo Labeling with Peptidoglycan Analogs. ACS Chem Biol 16, 1164–1171. 10.1021/acschembio.1c00346. [DOI] [PubMed] [Google Scholar]
- 45.Pidgeon SE, Apostolos AJ, Nelson JM, Shaku M, Rimal B, Islam MN, Crick DC, Kim SJ, Pavelka MS, Kana BD, and Pires MM (2019). L,D-Transpeptidase Specific Probe Reveals Spatial Activity of Peptidoglycan CrossLinking. ACS Chemical Biology 14, 2185–2196. 10.1021/acschembio.9b00427. [DOI] [PMC free article] [PubMed] [Google Scholar]
- 46.Turnbaugh PJ, Ridaura VK, Faith JJ, Rey FE, Knight R, and Gordon JI (2009). The effect of diet on the human gut microbiome: a metagenomic analysis in humanized gnotobiotic mice. Sci Transl Med 1, 6ra14. 10.1126/scitranslmed.3000322. [DOI] [PMC free article] [PubMed] [Google Scholar]
- 47.Stefka AT, Feehley T, Tripathi P, Qiu J, McCoy K, Mazmanian SK, Tjota MY, Seo GY, Cao S, Theriault BR, et al. (2014). Commensal bacteria protect against food allergen sensitization. Proc Natl Acad Sci U S A 111, 13145–13150. 10.1073/pnas.1412008111. [DOI] [PMC free article] [PubMed] [Google Scholar]
Associated Data
This section collects any data citations, data availability statements, or supplementary materials included in this article.
Supplementary Materials
Data Availability Statement
All data reported in this paper will be shared by the lead contact upon request.
This paper does not report original code.
Any additional information required to reanalyze the data reported in this paper is available from the lead contact upon request