

Abstract
Mycobacterium tuberculosis (Mtb) secretes extracellular vesicles (EVs) containing a variety of proteins, lipoproteins, and lipoglycans. While emerging evidence suggests that EVs contribute to tuberculosis pathogenesis, the factors and molecular mechanisms involved in mycobacterial EV production have not been identified. In this study, we use a genetic approach to identify Mtb proteins that mediate vesicle release in response to iron limitation and antibiotic exposure. We uncover a critical role for the isoniazid‐induced, dynamin‐like proteins, IniA and IniC, in mycobacterial EV biogenesis. Further characterization of a Mtb iniA mutant shows that the production of EVs enables intracellular Mtb to export bacterial components into the extracellular environment to communicate with host cells and potentially modulate the immune response. The findings advance our understanding of the biogenesis and functions of mycobacterial EVs and provide an avenue for targeting vesicle production in vivo.
Keywords: bacterial dynamins, extracellular vesicles, iron response, Mycobacterium tuberculosis
Subject Categories: Immunology; Membranes & Trafficking; Microbiology, Virology & Host Pathogen Interaction
The iron‐regulated, dynamin‐like proteins IniAC promote the production and release of extracellular vesicles from Mycobacterium tuberculosis.

Introduction
Mycobacterium tuberculosis (Mtb) remains one of the most pernicious human pathogens. This bacterium infects over 10 million people and is responsible for the death of over one million individuals each year. There is no effective vaccine that protects against pulmonary TB, and resistance to antibiotics is on the rise. A better understanding of the pathophysiology of Mtb is needed to generate new prophylactic, diagnostic, and therapeutic tools that strengthen TB control efforts.
The ability of Mtb to evade, subvert, and exploit the immune defense response (Cambier et al, 2014) is central to its success as a pathogen and largely mediated by secreted bacterial factors (Abdallah et al, 2007). Mtb possesses various canonical secretion systems such as the Sec and twin‐arginine translocation (TAT) pathways, and five different specialized type VII secretion systems that generally enable export of individual molecules (Feltcher et al, 2010; Rivera‐Calzada et al, 2021). In addition, mycobacteria export multiple proteins, lipids, and glycolipids packed within extracellular vesicles (EVs) (Prados‐Rosales et al, 2011). Extracellular vesicles are membrane bound nanostructures released by live cells from all domains of life (Gill et al, 2019). Extracellular vesicles have become a paradigm in cell–cell communication enabling cells to transfer a broad range of biomolecules to other cells, influencing the physiology of the recipient cell and orchestrating systemic responses.
Although the specific content of EVs depends on the physiological state of the cell of origin, EVs produced by pathogenic bacteria frequently transport virulence factors, such as toxins, adhesins, antimicrobial‐inactivating enzymes, and effectors of immune evasion (Ciofu et al, 2000; Kuehn & Kesty, 2005; Kuipers et al, 2018). Mycobacteria‐derived EVs, in particular, carry virulence‐associated molecules such as the M. ulcerans cytotoxin mycolactone, the hemolytic protein TlyA, the adhesin HBHA, the siderophore mycobactin, and several immunologically active lipoproteins and glycolipids (Marsollier et al, 2007; Prados‐Rosales et al, 2011, 2014b; Mittal et al, 2014; Lee et al, 2015; Chiplunkar et al, 2019). Mtb EVs (hereafter refer to as MEVs) are 20–250 nm in diameter and are enriched in polar lipids consistent with their origin from the cytoplasmic membrane (Prados‐Rosales et al, 2011). Mycobacterial extracellular vesicles transport several Toll‐like receptor 2 (TLR2) agonists such as lipoproteins and lipoarabinomannan (LAM) among others, which induce TLR‐2‐dependent proinflammatory cytokine release in macrophages (Prados‐Rosales et al, 2011). After intratracheal injection into mice, MEVs induce robust lung inflammation that impedes control of a subsequent infection with virulent Mtb (Prados‐Rosales et al, 2011). Mycobacterial extracellular vesicles can mediate transfer of antigens to dendritic cells for presentation to T cells (Jurkoshek et al, 2016), but they have shown to also inhibit T‐cell activation (Athman et al, 2017). Thus, the discovery of vesicle secretion in Mtb uncovered a new dimension of intrabacterial and bacteria–host cell communication. The lack of vesicle‐deficient mutants has, however, impeded addressing the mechanisms of release and function of MEVs. In this study, we linked upregulation of MEV production to induction of the iniBAC operon and recognized the dynamin‐like proteins IniA and IniC as critical factors in MEV biogenesis. Characterization of a vesicle production‐deficient mutant revealed the role of MEVs in iron acquisition and export of bacterial molecules out of infected macrophages. The results indicate that MEVs production is not essential for Mtb fitness or stress response. This study constitutes an important step forward in comprehending the mechanism of MEV biogenesis and the contribution of MEVs to TB pathogenesis.
Results and Discussion
Induction of iniBAC leads to increased EV production in mycobacteria
Previously, we showed that MEV production is upregulated under conditions of iron limitation and downregulated by VirR, a protein of unknown function (Rath et al, 2013; Prados‐Rosales et al, 2014b). However, how iron and VirR regulate MEV biogenesis is unknown. We hypothesized that they control the expression of MEV biogenesis factors. To identify these factors, we conducted RNA sequencing, identified genes upregulated in a virR mutant relative to wild‐type Mtb, and determined the overlap between VirR‐regulated genes and genes induced under iron limitation in wild‐type (WT) Mtb, according to our published data (Data ref: Kurthkoti et al, 2017a; Kurthkoti et al, 2017b). This analysis showed iniA, iniC, and iron–sulfur cluster [FeS] assembly genes (Rv1460‐Rv1466) upregulated in both conditions (Fig 1A). In the Mtb genome, iniA and iniC are part of a three gene operon that also includes iniB (Alland et al, 2000) (Fig 1B). Accordingly, quantitative RT–PCR confirmed induction of the complete operon in Mtb WT cultured in low‐iron medium and in cells lacking VirR relative to WT cultured in high‐iron medium (Fig 1C).
Figure 1. Genes commonly upregulated in high vesicle producing Mtb .
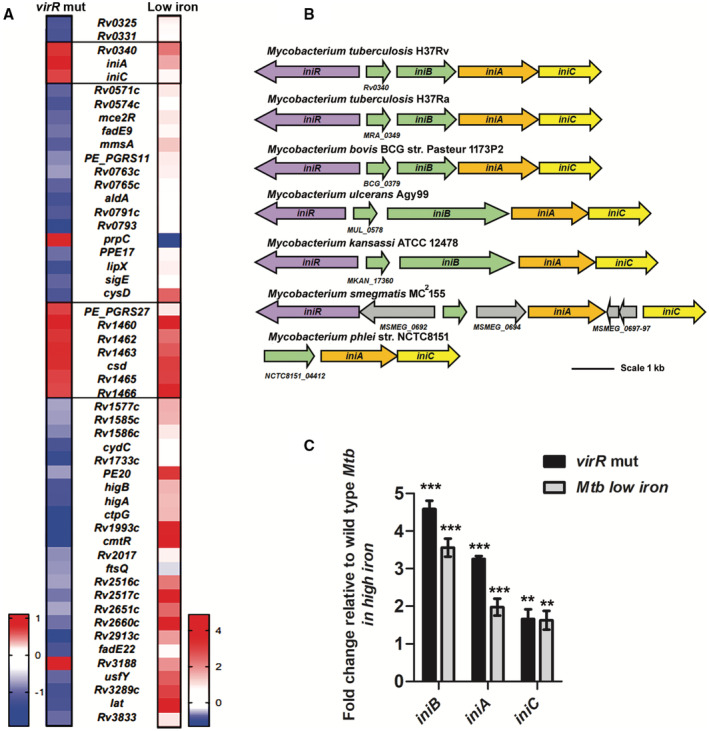
- Heat map showing average fold change of genes differentially expressed in biological triplicates of a virR mutant relative to WT in high‐iron (left panel) and in WT Mtb in low‐iron relative to high‐iron MM (right panel). The scales in the two panels are different to facilitate visualization of genes upregulated in both conditions. Upregulated genes are shown in red and downregulated ones in blue. The data show iniAC and the cluster of genes involved in [FeS] assembly (Rv1460‐Rv1466) commonly induced in low iron relative to high iron and in the virR mutant relative to WT Mtb.
- Schematic representation of the chromosomal region containing the “ini” genes in diverse mycobacterial species. Genes encoding IniA and IniC are conserved in all mycobacteria examined, whereas iniB is lacking in the fast growing mycobacteria M. smegmatis and M. phlei.
- qRT‐PCR data showing induction of each gene in the iniBAC operon in WT Mtb cultured in low iron and in the virR mutant strain cultured in high iron, expressed as fold change relative to WT Mtb cultured in iron sufficient conditions. RNA extracted from biological triplicates was analyzed. The data are presented as means ± SEM. **P ≤ 0.01; ***P ≤ 0.001 (Student's t‐test).
Source data are available online for this figure.
To further investigate the relationship between iniBAC induction and EV biogenesis, we tested vesicle production in mycobacteria overexpressing iniBAC, in high‐iron medium. The antibiotic isoniazid (INH) is a potent inducer of the iniBAC operon (Alland et al, 2000; Boot et al, 2017) via activation of IniR. IniR senses increased free trehalose resulting from INH treatment and activates iniBAC transcription (Boot et al, 2017). We quantitated MEVs released by Mtb exposed to a subinhibitory concentration of INH (50 ng/ml) sufficient to induce iniBAC. Mycobacterial extracellular vesicles were isolated from the culture supernatant filtrate (CSF) by differential ultracentrifugation, purified in a density gradient, and quantitated based on protein, lipid, and antigenic content and nanoparticle tracking analysis (NTA) normalized to the CFU number, as done previously (Prados‐Rosales et al, 2011, 2014a; Gupta & Rodriguez, 2019). INH‐mediated iniBAC induction was concomitant to augmented MEV production (Fig 2A–D). Moreover, increased release of EVs was also observed in M. smegmatis (Msm) overexpressing Mtb iniAC (as Msm lacks iniB), after transformation with a plasmid carrying these genes placed under the control of the strong hsp60 promoter (Fig 2E–H). These gain‐of‐function experiments affirmed the link between augmented expression of iniAC and increased EV production in mycobacteria. It is worth noting that the observed increase in vesicle release in Mtb or Msm was not associated with leakage of cytosolic material, a reliable indicator of a negative effect on membrane integrity (Appendix Fig S1).
Figure 2. Overexpression of iniAC leads to increased EV production in Mtb and Msm .
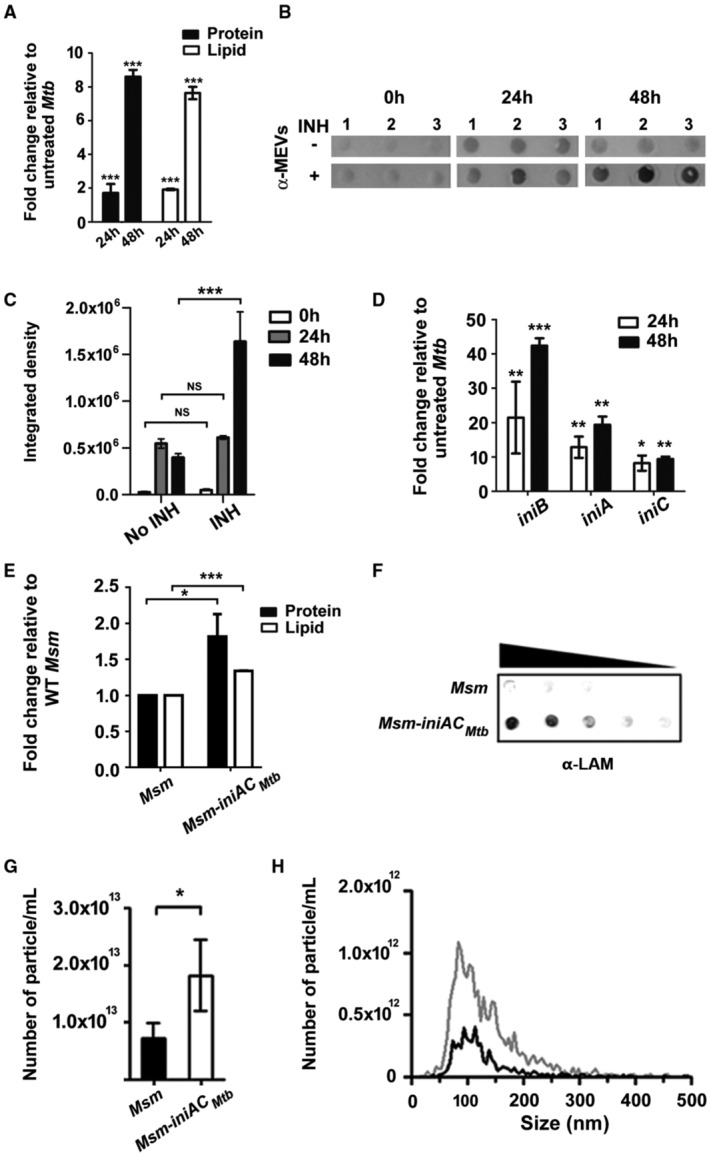
- MEV quantitation based on protein and lipid content in vesicle preparations isolated from the same number of Mtb cells treated with INH 50 ng/ml for 24 and 48 h relative to untreated cells. Three independent cultures were analyzed. Data are presented as mean ± SEM. ***P ≤ 0.001 (Student's t‐test).
- Immunodot blot assay detecting MEVs obtained from three independent cultures (1, 2, 3) and derived from the same number of Mtb exposed to 50 ng/ml INH for 24 and 48 h. A polyclonal antiserum raised against purified MEV (Prados‐Rosales et al, 2014a) was used as a primary antibody.
- Integrated density of the signals in the Immunodot blots shown in panel (B) showing increased MEVs abundance in cells treated with INH. Data are presented as mean ± SD. ***P ≤ 0.001. (Student's t‐test).
- Induction of iniBAC transcription in Mtb treated with INH for 24 and 48 h relative to untreated cells. Gene transcripts were quantitated by qRT‐PCR. RNA was isolated from three independent cultures. Data are presented as mean ± SEM. *P ≤ 0.05; **P ≤ 0.01; ***P < 0.001 (Student's t‐test).
- Protein and lipid content in vesicle preparations isolated from the same number of WT and Msm overexpressing iniAC Mtb (Msm iniAC Mtb ). Three independent cultures were analyzed. Data are presented as mean ± SEM. *P ≤ 0.05; ***P ≤ 0.001 (Student's t‐test).
- Representative Immunodot blot of EVs isolated from the same number of WT and Msm overexpressing iniAC Mtb (Msm iniAC Mtb ) and WT Msm. A specific antibody against the Msm EV component LAM was used for vesicle detection. The black triangle indicates that increasing dilutions of the sample were spotted onto the membrane. The experiment was repeated three times with independent cultures.
- Nanoparticle analysis of EV preparations derived from WT and Msm overexpressing Mtb iniAC (Msm iniAC Mtb ::pMV261) showing number of particles per ml determined by Zeta View NTA in three independent EV preparations. Data are presented as mean ± SEM. *P ≤ 0.05 (One‐way ANOVA with Tukey's multiple comparisons test).
- The graph shows the average of nanoparticle size distribution in three independent vesicle preparations derived from WT (black) and Msm iniAC Mtb (gray).
Source data are available online for this figure.
IniA and iniC are necessary for secretion of MEVs
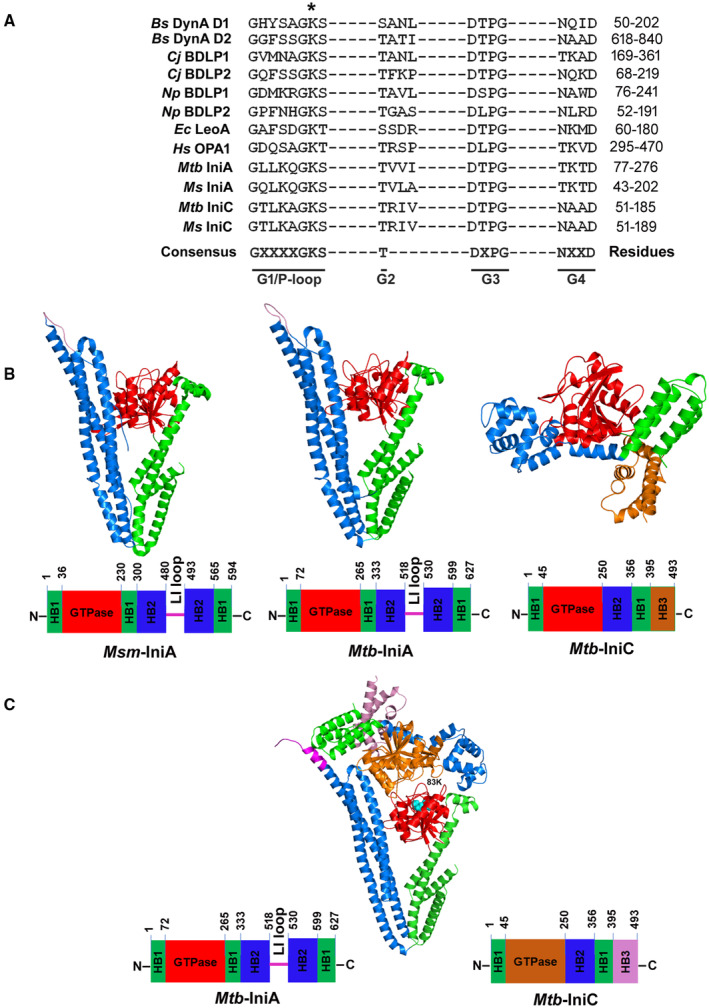
The iniBAC operon has been long recognized as a marker of the mycobacterial response to cell envelope synthesis targeting antibiotics (Alland et al, 2000). However, the biological function of these proteins remains unclear. The first gene in the iniBAC operon encodes a membrane protein of unknown function. The absence of an iniB ortholog in Msm and M. phlei, two mycobacterial species that produce EVs (Prados‐Rosales et al, 2011), suggests IniB is not always necessary for EV biogenesis. However, according to proteomics data, IniB forms part of the MEV cargo, and therefore, might function in the context of vesicles (Lee et al, 2015). IniA and IniC, on the contrary, are not included in MEVs, are conserved in vesicle producing mycobacteria (Fig 1B), and belong to the dynamin protein superfamily, a group of large GTPases that function in membrane fission or fusion (Jimah & Hinshaw, 2019) (Fig EV1A). Crystallographic analysis of Msm IniA demonstrated structural homology to dynamin‐like proteins (DLP) with a characteristic globular GTPase domain and two elongated, alpha helical bundle domains (Wang et al, 2019). In the same study, the authors showed that soluble Msm IniA can deform liposomal membranes and to some extent mediate membrane fission, in a GTPase‐dependent fashion. IniC is smaller than IniA and lacks an obvious lipid binding sequence. AlphaFold2 structural modeling of the Mtb proteins predicted the DLP folding of Mtb IniA and IniC (Fig EV1B) with a per residue measure of confidence (pLDDT) score of 76 and 89, respectively (100 is the maximum score). However, IniC is predicted to have an additional alpha helical domain at the carboxy terminus (Fig EV1B).
Figure EV1. Structural modeling of Mtb IniA and IniC.
-
ASequence alignment of the GTP binding domains of the Mtb DLPs and other members of the DLP superfamily. Bacilllus subtilis (Bs) DynA (P54159), Nostoc punctiforme (Np) BDLP1 (B21ZD3) and BDLP2 (B21ZD2), Campylobacter jejuni (Cj) BDLP1 (CJ0411) and BDL2 (CJ0412), Escherichia coli (Ec) LeoA (E3PN25), human mitochondrial OPA1 (0060313) and M. smegmatis (Ms) IniA and IniC. *Indicates the conserved lysine (K) residue mutated in IniA in this study.
-
BCrystal structure of the Msm IniA (left) and structures predicted by AlphaFold2 of Mtb IniA (center) and Mtb IniC (right). Structures are color coded to show the GTPase domain (red), bundle signal element/HB1/neck domain (green), HB2/stalk/trunk domain (blue), and C‐terminal helical tail domain in IniC (orange).
-
CShown is the top ranked structural model of Mtb IniAC complex predicted by AlphaFold‐Multimer prediction. The conserved lysine (K) residue mutated in IniA, in this study is indicated (light blue).
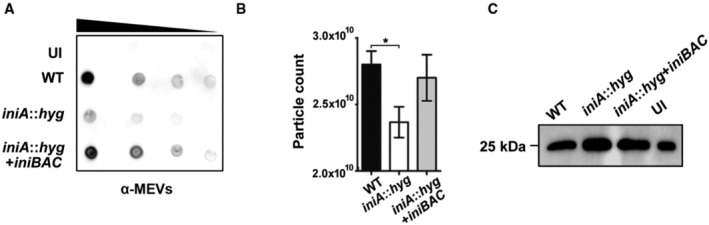
The dynamin‐like nature of IniAC and the direct correlation between biosynthesis of these proteins and vesicle release led us to test a possible role for IniAC in MEV biogenesis. We purified and quantitated vesicles derived from the low‐iron CSF of Mtb WT and a mutant, in which most of iniA was replaced by a hygromycin (hyg) resistance cassette (iniA::hyg) (Colangeli et al, 2005). The iniA::hyg mutant grew as well as WT; however, it was drastically impaired in vesicle production (Fig 3A and B, Appendix Fig S2A–E). Both iniAC but not the individual genes, expressed through the native promoter, rescued MEV production in the mutant (Fig EV2A and B), indicating that the hyg insertion had a polar effect on iniC and that both iniA and iniC are necessary for efficient MEV biogenesis. To further assess the contribution of IniC to vesicle production, we deleted iniC in Msm (MSMG_0698) and determined vesicle release in the mutant. Individual inactivation of iniC dampened vesicle production in Msm and this phenotype was complemented by the Mtb iniC, thus validating the functionality of Mtb IniC (Fig EV2C–E).
Figure 3. MEV production in Mtb iniA::hyg .
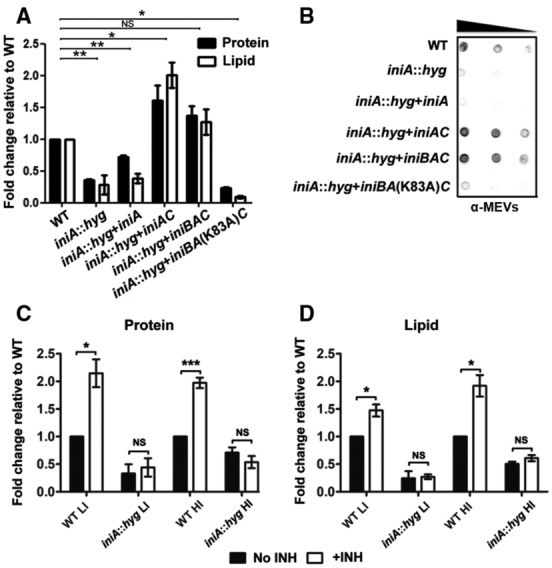
- Quantitation of MEVs released by Mtb strains in low‐iron cultures based on vesicle protein and lipid content normalized to CFUs. Three biological replicates were processed. Data are presented as mean ± SD. *P ≤ 0.05; **P ≤ 0.005 (Student's t‐test).
- Representative Immunodot blot of MEV preparations normalized to CFUs. A polyclonal antiserum raised against purified MEV was used for vesicle detection. The decreasing black bar indicates that increasing dilutions were spotted onto the membrane.
- Protein in vesicle isolates derived from three independent cultures of Mtb WT and iniA::hyg mutant grown in low (LI) or high iron (HI) MM with or without 50 ng/ml INH. Data are presented as mean ± SEM. *P ≤ 0.05; ***P ≤ 0.001 (Student's t‐test).
- Lipid in vesicle isolates derived from three independent cultures of Mtb WT and iniA::hyg mutant cultured in low (LI) or high iron (HI) MM with or without 50 ng/ml INH. Data are presented as mean ± SD. *P ≤ 0.05 (Student's t‐test).
Figure EV2. IniA and IniC are both required for EV release in mycobacteria.

-
AQuantitation of MEV released by Mtb strains based on quantification of protein and lipid in purified MEV isolated from biological triplicates and normalized to CFUs. The graph shows that individually iniA or iniC do not complement the mutant; both genes are needed. Data are presented as mean ± SEM. **P ≤ 0.001; ****P ≤ 0.0001 (Student's t‐test).
-
BRepresentative Immunodot blot of one of the MEV preparations analized in panel (A) using anti‐MEV polyclonal antiserum as primary antibody.
-
CSchematic representation of the Msm genomic region containing iniA and iniC, indicating the location of the primers (P1048, P1106) used to validate allelic exchange and gene deletion of iniC.
-
DValidation of Msm iniC deleted mutant (MsmΔiniC) showing the PCR product amplified with (P1048 and P1106).
-
EQuantitation of EVs released by three independent cultures of Msm strains based on EV protein and lipid normalized to CFU number. Data are presented as mean ± SEM. ***P ≤ 0.001 (Student's t‐test).
Source data are available online for this figure.
Throughout the complementation experiments, we noticed that iniA::hyg complemented with iniAC exhibited higher vesicle production than the iniBAC complemented mutant and WT strains, implying iniAC overexpression when expressed as a two gene operon. Future studies will investigate the possibility that iniB influences iniAC expression.
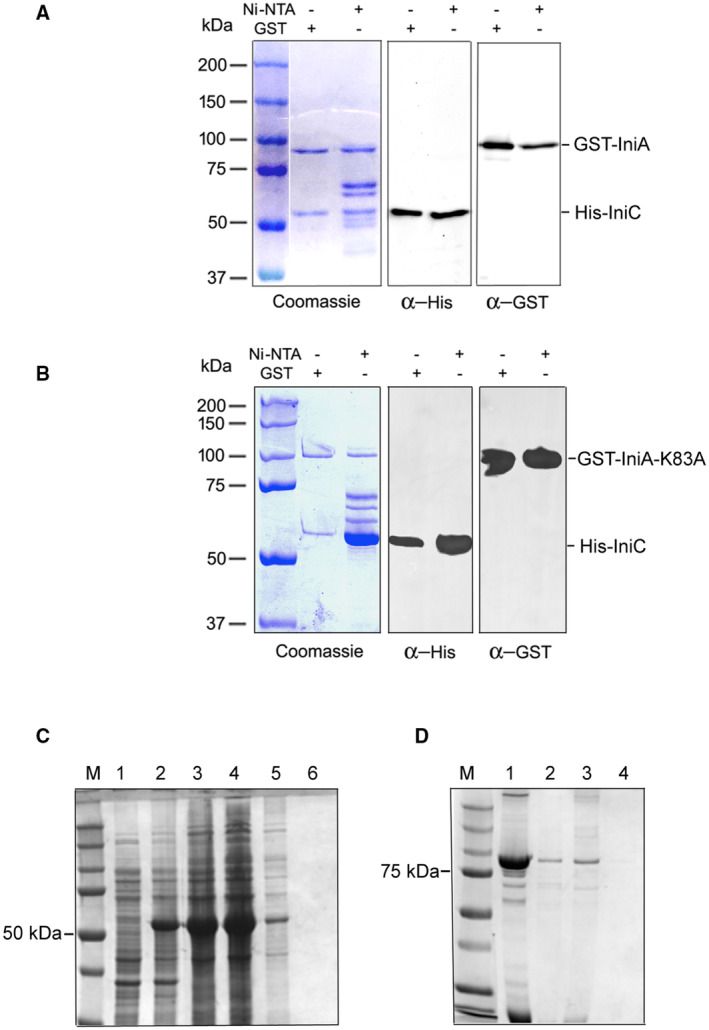
The finding that both, IniA and IniC, are necessary for efficient vesicle release is consistent with the fact that DLPs often occur in pairs that assemble into functional heterocomplexes (Liu et al, 2018). AlphaFold‐Multimer structural prediction yielded five models of IniAC complexes with an interface predicted template modeling (ipTM) score ranging between 0.85 and 0.86 (1 is the maximum score). The top ranked model is shown in Fig EV1C while all five models with their corresponding confidence scores are presented in Appendix Fig S3. Molecular visualization of the IniAC complex model suggests IniA and IniC interact via the GTPase domains. The physical interaction between IniA and IniC was validated by pull‐down analyses. When iniAC were co‐expressed in Escherichia coli, IniA copurified with IniC, and vice versa; IniC copurified with IniA (Fig EV3A). Overall, the genetic and biochemical data indicate IniA and IniC cooperate in the biogenesis of mycobacterial EVs.
Figure EV3. IniA and IniC interaction.
-
ACoomassie‐stained SDS–PAGE and corresponding Western blots showing co‐purification of Mtb GST‐IniA and His‐IniC by affinity chromatography. Anti‐tag (GST and His) specific antibodies were used in the Western blot. The experiment was repeated twice with similar results.
-
BCoomassie‐stained SDS–PAGE and corresponding Western blots showing co‐purification of Mtb GST‐IniAK83A and His‐IniC by affinity chromatography. Anti‐tag (GST and His)‐specific antibodies were used in the Western blot. The experiment was repeated twice with similar results.
-
CControl for nonspecific binding of His‐IniC to the GST column. A cell lysate of E. coli BL21 transformed with a plasmid expressing His‐IniC (~51KDa) uninduced (lane 1) or IPTG induced (lane 2) loaded on a glutathione affinity column; flow through and washes with loading buffer (lanes 3–5); material bound and eluted with 10 mM reduced glutathione (lane 6).
-
DControl for nonspecific binding of GST‐IniA to Ni+2‐NTA. Partially purified GST‐IniA (lane 1) was loaded into a Ni+2‐NTA column. Flow through (lane 2), wash (lane 3) and bound material eluted with 250 mM imidazole (lane 4).
We next investigated the role of GTP in vesicle production by mutating the conserved lysine (K83) in the GTP binding domain of IniA (marked in Fig EV1A) and determining the effect of this mutation on complementation of MEV production in iniA::hyg. While the IniA K83A mutation did not impede the interaction of IniA with IniC (Fig EV3B–D), it precluded phenotypic complementation of iniA::hyg (Fig 3A and B) indicating that GTP hydrolysis by IniA is required for MEV biogenesis.
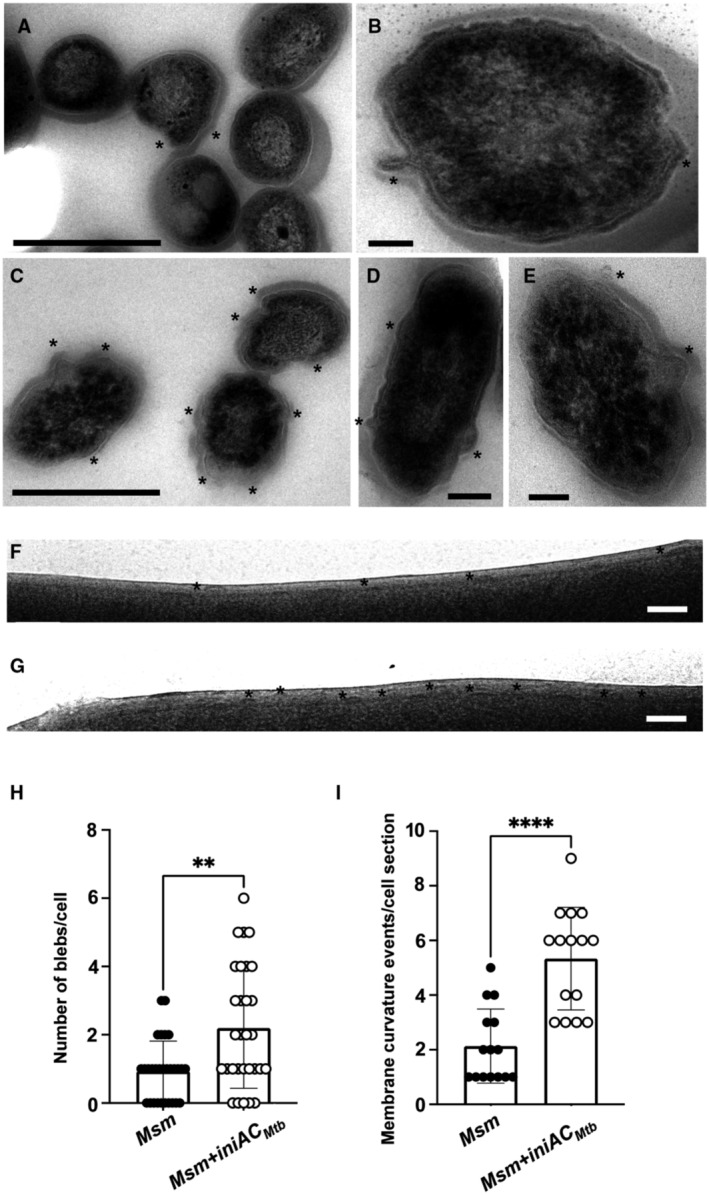
To gain further insights into IniAC function, we examined Msm overexpressing Mtb IniAC by transmission and Cryo electron microscopy. Multiple areas of cell bulging (Fig EV4A–E) reminiscent of cell surface alterations previously observed by Wang et al (2019) in Msm overexpressing IniA were observed in Msm overexpressing iniAC. Additionally, Cryo‐EM micrographs revealed more frequent areas where the plasma membrane of overexpressing cells appears to curve outwards compared with WT Msm (Fig EV4F–I). Together, these observations indicate exacerbated membrane deformation and cell envelope remodeling in association with constitutive overexpression of iniAC. Interestingly, Msm IniA was previously found to preferentially bind cardiolipin (Wang et al, 2019), a cone‐shaped lipid, abundant in the mycobacterial membrane, whose sequestration induces membrane curvature (Agrawal & Ramachandran, 2019). Therefore, it is conceivable that the interaction of IniAC with specific membrane lipids promotes membrane curvature and initiates vesicle formation. Studies of eukaryotic dynamin have shown that dynamin–lipid interaction promotes oligomerization of dynamin around the neck of budding vesicles and GTP hydrolysis, which in turn drives conformational changes in dynamin oligomers that result in tubular membrane constriction, membrane fission, and vesicle scission (Pucadyil, 2011). Considering these observations and our results, we propose a model for IniAC‐dependent vesicle production, in which IniA interaction with membrane curvature inducing lipids initiates vesicle formation and then, in a GTPase‐dependent manner, IniAC multimers promote membrane restructuring and fission, enabling vesicle excision. We further postulate that subsequent traffic of newly released vesicles across the cell envelope might be facilitated by local changes in the cell wall, augmented in response to low iron. This notion is supported by previous studies that indicated increased cell envelope fluidity and upregulation of numerous genes encoding proteins involved in cell surface lipid synthesis and cell wall remodeling in iron limited mycobacteria (Rodriguez et al, 2002; Vijay et al, 2017; Kurthkoti et al, 2017b; Pal et al, 2019).
Figure EV4. Cell surface changes in Msm constitutively overexpressing Mtb iniAC .
-
A, BTransmission electron micrograph of Msm WT. Scale bars are 500 nm in panel (A) and 100 nm in panel (B). Asterisks mark cell blebs.
-
C–ETransmission electron micrograph of Msm overexpressing iniAC (iniAC Mtb ::pMV261). Scale bars are 500 nm panel (C) and 100 nm in panels (D) and (E). Asterisks mark cell blebs.
-
F, GDetail of a cryoelectron micrograph of the cell envelope of Msm WT (F) and Msm overexpressing iniAC (Msm iniAC Mtb ::pMV261) (G). Asterisks mark membrane blebs. Scale bars are 50 nm.
-
HQuantitation of blebs on cells examined in panels (A–E). Thirty individual cells per strain were counted from two different TEM grids. The error bars indicate mean ± SD. **P < 0.05. (Mann–Whitney Test).
-
IQuantitation of cell membrane blebs along a defined longitudinal section of the cell membrane (700–750 nm) on cells examined in pannels F and G. Fifteen cells per strain were counted from a single vitrified sample. The error bars indicate mean ± SD. ****P > 0.0001 (Mann–Whitney Test).
Source data are available online for this figure.
Stimulation of MEV production by INH is dependent on iniAC
Having demonstrated that IniAC are required for vesicle production in mycobacteria, we next determined whether the increased release of MEV observed in cells exposed to INH was dependent on iniAC. Quantification of protein and lipid in vesicle preparations derived from WT and iniA::hyg mutant exposed to INH in low‐ or high‐iron conditions showed that independently of iron levels in the medium (Fig 3C and D), and without affecting cell viability (Appendix Fig S4A and B), INH failed to stimulate MEV production in iniA::hyg, indicating that INH promotes MEV production via induction of iniAC expression. As INH is a cornerstone of TB treatment, this is an important observation; it suggests that nonlethal exposure to INH, for instance, in the context of the granulomatous lesion, might augment MEV production, possibly benefiting the pathogen and that this undesired effect could be prevented by targeting IniAC.
Deficient MEV production restricts iron acquisition capabilities
To obtain essential iron, Mtb synthesizes two biochemically related siderophores: carboxymycobactin (CMb) and mycobactin (Mb). Carboxymycobactin is an amphiphilic molecule secreted via membrane transporters (Jones et al, 2014), whereas Mb, being highly hydrophobic, is restricted to the cell membrane (Ratledge et al, 1982) and exported in MEV (Prados‐Rosales et al, 2014b). Mycobacterial extracellular vesicles produced by WT Mtb but not by a siderophore biosynthesis mutant are utilized by Mtb as iron source (Prados‐Rosales et al, 2014b). We have postulated that MEVs might aid in iron acquisition particularly, in microenvironments where CMb is susceptible to sequestration by the antimicrobial protein siderocalin (Goetz et al, 2002). To examine the potential impact of defective MEV biogenesis in iron acquisition, we evaluated the iniA::hyg mutant strain for growth in low iron, mycobactin synthesis, and mycobactin secretion in vesicles. For this, we used a biological assay where we assessed the ability of vesicle preparations from the various Mtb strains to support the growth of a siderophore synthesis mutant, which is strictly dependent on added siderophores for growth (De Voss et al, 2000; Rodriguez et al, 2008). Growth under iron limitation was identical between WT and Mtb iniA::hyg (Fig 4A) indicating that secreted CMb was sufficient to satisfy the iron needs of the mutant in vitro. Mycobactin biosynthesis was also not affected in the mutant (Fig 4B). However, while MEV preparations derived from the culture supernatant of WT and complemented iniA::hyg mutant strains effectively rescued the Mtb siderophore mutant, equivalent preparations from iniA::hyg cultures failed to do so (Fig 4C). This result is consistent with deficient MEV‐mediated Mb secretion in iniA::hyg and suggests that intersecting MEV biogenesis might restrict the capacity of Mtb to obtain iron via mycobactin during infection.
Figure 4. Growth, siderophore synthesis, and mycobactin secretion in Mtb iniA::hyg in low‐iron medium.
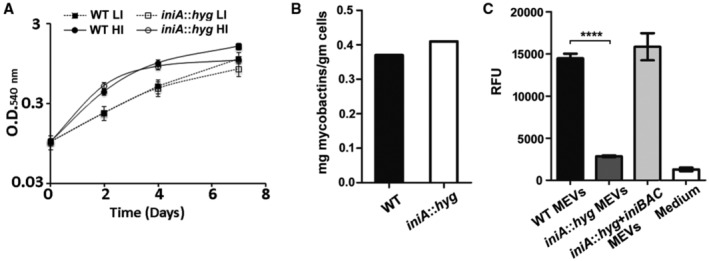
- Growth of Mtb WT and iniA::hyg in high (HI) and low iron (LI) MM based on increase in optical density. Data are presented as mean ± SD of three independent cultures.
- Mycobactin synthesized by Mtb WT and iniA::hyg grown in low‐iron conditions. Data are presented as the mean of mycobactin extracted from two independent cultures.
- The Mtb siderophore synthesis mutant (ST142) was cultured in low‐iron MM (medium) plain or supplemented with MEV preparations derived from equal number of Mtb WT, iniA::hyg and complemented strains grown in low‐iron MM. ST142 growth was determined based on the number of viable cells detected by the resazurine cell viability assay. MEV obtained from three independent cultures were tested. Data are presented as mean ± SD. ****P ≤ 0.0001 (Student's t‐test).
MEV production is not essential for growth under stressful conditions
In culture, Mtb iniA::hyg exhibited normal growth, cell morphology, acid fast staining, aggregation properties, susceptibility to the cell wall, and membrane perturbing agents lysozyme and SDS, respectively (Appendix Fig S5A–E), and, as mentioned before, it also showed a normal iron response. In addition, iniA::hyg growth in human THP‐1 cells differentiated into macrophages and in bone marrow‐derived murine macrophages (BMDM) (Appendix Fig S6A and B, respectively) was comparable with that of WT Mtb. Although we cannot exclude that IniAC may help Mtb adapt to stressful conditions not tested here, these data strongly suggest that deficient MEV secretion does not impact Mtb fitness under stress in vitro or in macrophages.
MEVs at the Mtb‐macrophage interface
As mentioned in the previous section, the production of MEVs seems dispensable for Mtb replication in macrophages. To examine whether MEVs influence the macrophage response to infection, we measured cytokine release in Mtb‐infected BMDMs. Bone marrow‐derived murine macrophages infected with Mtb iniA::hyg secreted similar amounts of IL‐6, IL‐10, TNF‐α, and KC/GRO and about threefold less IL‐1β than WT and complemented strains infected macrophages, indicating that except for IL‐1β, MEVs deficiency does not appear to impact cytokine production induced by the intact bacterium (Fig EV5). We also examined the impact of deficient MEV production on the release of vesicles containing bacterial components out of infected macrophages, which is a well‐recognized method used by Mtb to export hydrophobic biomolecules into the extracellular milieu and modulate immune cell response (Beatty et al, 2000; Athman et al, 2015, 2017; Smith et al, 2017; Schorey et al, 2021). We isolated total EVs present in the culture supernatants of an equal number of Mtb infected THP‐1 cells and conducted semiquantitative dot blot analysis using our anti MEV antiserum to detect vesicles containing bacterial proteins (Ziegenbalg et al, 2013; Prados‐Rosales et al, 2014a). A substantial reduction in bacterial antigens was observed in EVs isolated from the extracellular medium of macrophages infected with iniA::hyg compared with those infected with WT and complemented strains (Fig 5A). This result indicates that the iniA::hyg mutant is deficient in intracellular MEV production and suggest MEVs production is necessary for efficient vesicle‐mediated export of bacterial products out of infected macrophages. While nanoparticle tracking analysis (NTA) showed reduction in the number of particles in EV isolates derived from the supernatant of iniA::hyg infected macrophages (Fig 5B), immunological detection of the exosome‐specific marker CD9 indicated that the reduction in EVs containing bacterial antigens did not seem to be at the expense of macrophage‐derived exosomes (Fig 5C). Collectively, the results support the role of MEVs in the export of bacterial products out of macrophages (Athman et al, 2015). However, considering early studies that showed that blocking macrophages exosome secretion decreased bacterial products in subsequently released EVs (Smith et al, 2017), we propose a model where MEVs produced during macrophage infection intersect the multivesicular bodies and exploit the exosome secretion pathway to reach the extracellular milieu. Conceivably, during this process, MEVs might also transfer bacterial material to exosomes. This model reconciles both schools of thought regarding the origin of EVs (pathogen or host) carrying bacterial components out of Mtb‐infected macrophages. Developing sensitive methods that effectively track the traffic of MEVs produced during macrophage infection is needed to validate this model.
Figure EV5. Cytokine response of macrophages infected with Mtb .
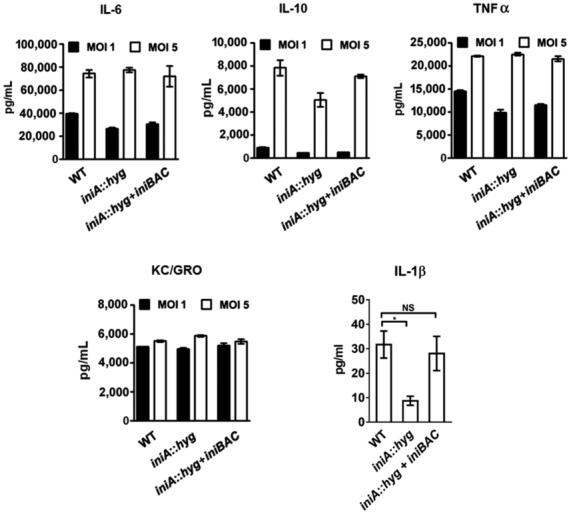
Shown are the levels of IL‐6, IL‐10, TNF‐α, KC/GRO, and IL‐1 β detected in the culture supernatant of BMDMs infected at MOI of 1 or 5 (5 in the case of IL‐1β) with WT, iniA::hyg and complemented strain. Background cytokine levels from uninfected macrophage culture filtrates were subtracted before plotting. Data are presented as means ± SD of triplicate infections. Data are presented as mean ± SD. *P ≤ 0.05 (Student's t‐test). Nonsignificant (NS).
Figure 5. Effect of the iniA::hyg mutation on the export of Mtb components out of infected macrophages within EVs.
- Representative Immunodot‐blot of bacterial antigens associated with EVs isolated from the culture supernatants of THP‐1 cells infected with Mtb WT, iniA:hyg and complemented strains versus uninfected cells (UI). Anti‐MEV specific antiserum was used for detection. The decreasing black bar indicates that increasing dilutions were spotted onto the membrane. The experiment was repeated three times with independent cultures.
- Number of nanoparticles per ml determined by Zeta View NTA in three EV preparations derived from the culture supernatans of THP‐1 cells infected with Mtb WT, iniA:hyg and iniA::hyg complemented strains. Data are presented as mean ± SEM. *P ≤ 0.05 (One‐way ANOVA with Tukey's multiple comparisons test).
- Representative Western blot of total EVs isolated from the CSF of THP‐1 cells infected with Mtb WT, iniA::hyg and complemented strains versus uninfected cells (UI) detecting the exosome marker CD9. The experiment was repeated twice with similar results.
Source data are available online for this figure.
Overall, our results open the way to a better understanding of MEVs biogenesis and show that although deficient MEV production does not impact basic bacterial physiology or stress response, it potentially restricts the ability of Mtb to communicate with host cells. Specifically, we show that IniAC are necessary for efficient export of mycobacterial material from infected macrophages within vesicles, which are well known for their capacity to influence cell immune responses (Schorey et al, 2021). Using the Mtb mutants that we have characterized, future in vivo studies will address the role of MEVs‐dependent immune activation in regulating host immunity and the development of pulmonary immunopathology (Kellerer et al, 2006).
Materials and Methods
Bacterial strains and cell culture
Mtb H37Rv (ATCC) and derived strains: virR::Tn (Rath et al, 2013) iniA::hyg (Colangeli et al, 2005), and ST142 (mbtB::hyg) (De Voss et al, 2000) and M. smegmatis mc21551 (ATCC) were used in this study. Escherichia coli BL21 (DE3) was employed for recombinant protein overexpression and purification. Mtb strains were thawed out from frozen stocks onto Middlebrook 7H10 supplemented with 10% ADN and 0.05% Tween‐80. Fe‐depleted minimal medium (MM) was prepared for culture under defined iron conditions. MM contains 0.5% asparagine, 0.5% KH2P04, 2% glycerol, 0.2% dextrose, and 0.085% NaCl (pH 6.8). Tween‐80 0.05% was added to the MM when determining bacterial growth based on the increase in optical density or by enumerating CFUs to avoid cell clumping. MM was treated with 5% Chelex‐100 (BioRad) for 24 h to remove traces of cations. Chelex resin was removed by filtration through a 0.22‐μm filter (Millipore) and then supplemented with 0.5 mg of ZnCl2/l, 0.1 mg of MnSO4/l, and 40 mg of MgSO4/l. For low‐iron conditions, 2 μM FeCl3 was added to MM, and this medium is referred to as low‐iron MM (LI). When indicated, 50 μM FeCl3 was added to generate high‐iron MM (HI).
Plasmid constructs
To generate the complementing plasmids pSM986, pSM1012, pSM1013, and pSM1014, the coding sequence of iniBAC, iniAC, iniA, and iniC, respectively, plus the native promoter (211 bp upstream of iniB) were PCR‐amplified and cloned at the StuI site of the integrative vector pSM316 (Manganelli et al, 2004). To overexpress iniAC in Msm, the Mtb sequence encompassing iniAC was PCR‐amplified from genomic DNA and placed under the control of the hsp60 promoter at the BamHI site of pMV261 generating pSM1010. To co‐express Mtb iniA and iniC in E. coli, iniA and iniC fused at the N‐terminus to GST and 6x His tags, respectively, were cloned into a dual‐expression plasmid, pQlink generating pSM1024. The iniA K83A mutation was introduced in pSM986 and pSM1024 by site directed mutagenesis using the QuickChange II‐XL mutagenesis kit (Agilent Technologies) to generate pSM1087 and pSM1070, respectively. All constructs were validated by DNA sequencing. Plasmids generated or used in this study are listed in Appendix Table S1.
Operon annotation
Dynamin‐like orthologs in mycobacteria were identified through the NCBI blastn tool using Mtb H37Rv iniB, iniA, and iniC nucleotide sequences as queries. Gene cluster representations were generated using the online Gene Graphics tool (Harrison et al, 2018) by inputting the following queries from NCBI: NC_000962.3 (405950…414238), M. tuberculosis H37Rv; NC_009525.1 (407312…415600), M. tuberculosis H37Ra; NC_008769.1 (436877…445165), M. bovis BCG str. Pasteur 1173P2; NC_008611.1 (587987…597471), M. ulcerans Agy99; CP006835.1 (3796764…3806423), M. kansasii ATCC 12478; CP000480.1 (776854…787659), M. smegmatis mc2155; LR134347.1 (4432270…4436972), M. phlei NCTC8151.
RNA isolation
Mtb strains were grown in HI supplemented with 0.05% Tween 80 at 37°C until they reached an O.D595 of 0.3 and then harvested by centrifugation. When examining INH‐induced gene expression, early logarithmic phase Mtb cultures in HI were treated with 50 ng/ml of INH for 24 and 48 h before RNA isolation. The bacterial cell pellets derived from biological triplicates were suspended in 1 ml RNA protect reagent (Qiagen), mechanically disrupted in a FastPrep‐24 instrument (MP Biomedicals, Santa Ana, CA) in Lysing Matrix B tubes, and RNA was purified with the Direct‐zol RNA miniprep kit (Zymo Research, Irvine, CA). The concentration and quality of the RNAs were evaluated using the Qubit RNA HS Assay Kit (Thermo Fisher Scientific) and Agilent RNA 6000 Nano Chips (Agilent Technologies), respectively.
RNA sequencing
Sequencing libraries were prepared using the Ribo‐Zero rRNA Removal Kit (Illumina Inc.) and the TruSeqStranded mRNA library prep kit (Illumina Inc) following the manufacturer's instructions. Briefly, bacterial rRNA was removed from total RNA, and the remaining RNA was purified using AgencourtRNAClean XP beads (Beckman Coulter), fragmented, and primed for cDNA synthesis. The first strand of cDNA was synthesized by incubation with SuperScript‐II Reverse Transcriptase (Thermo Fisher Scientific) for 10 min at 25°C, 15 min at 42°C, and 15 min at 70°C. The second strand of cDNA was synthesized with Illumina reagents at 16°C for 1 h. Then, A‐tailing and adaptor ligation were performed. Library enrichment was achieved by PCR (30 s at 98°C; 15 cycles of 10 s at 98°C, 30 s at 60°C, 30 s at 72°C; 5 min at 72°C and pause at 4°C). Afterwards, the libraries were visualized on an Agilent 2100 Bioanalyzer using the Agilent High‐Sensitivity DNA kit (Agilent Technologies) and quantified using the Qubit dsDNA HS DNA Kit (Thermo Fisher Scientific). Library sequencing was carried out on an Illumina HiSeq2500 sequencer with 50 nucleotides single‐end reads and at least 20 million reads per individual library were obtained.
Quality control of sequenced samples was performed by the FASTQC software (http://www.bioinformatics.babraham.ac.uk/projects/fastqc/). Reads were mapped against the M. tuberculosis H37Rv strain (GCF_000195955.2_ASM19595v2) reference genome using TopHat (Trapnell & Salzberg, 2009) with bowtie1 option, to align 50 bp reads. The resulting BAM alignment files were used as the input to Rsubread's featureCounts function (Liao et al, 2013) to generate a table of raw counts required for the Differential Expression (DE) analysis, which was carried out by DESeq2 (Love et al, 2014) to detect differentially expressed genes (FDR < 0.05 and Fold change > 1.5) among the two strains. Data were deposited at Gene expression Omnibus (GEO); GSE143996.
Quantitative RT‐PCR
Mtb strains were grown in LI or HI medium with and without INH as specified and RNA was isolated as described above. RNA was reverse‐transcribed using M‐MLV reverse transcriptase (Thermo Fisher Scientific), and real‐time PCR was performed using SYBR Green PCR Master Mix (Thermo Fisher Scientific) on a QuantStudio 6 real‐time PCR System (Thermo Fisher Scientific) using specific primers (Appendix Table S2) designed using the Primer3 software (Untergasser et al, 2012). Gene fold induction normalized to 16S rRNA was calculated using the 2−ΔΔCt method (Schmittgen & Livak, 2008).
Isolation EVs from mycobacterial cultures
Extracellular vesicles released by Mtb or Msm strains were isolated from the cell‐free culture supernatant of logarithmic cultures as described before (Prados‐Rosales et al, 2011, 2014b; Gupta & Rodriguez, 2019). Briefly, the culture supernatant derived from a 0.5–1‐l culture were filtered through a 0.22‐μm filter and concentrated approximately 20‐fold in an Amicon Ultrafiltration system (Millipore) with a 100‐KDa exclusion membrane. The concentrate was then centrifuged at 15,000 g for 15 min at 4°C to remove protein aggregates. Extracellular vesicles were separated by ultracentrifugation at 100,000 g for 2 h at 4°C. For purification, the vesicle pellet was suspended in 0.5 ml phosphate‐buffered saline (PBS) and mixed with 1.5 ml of a 60% Optiprep solution (Sigma‐Aldrich) yielding 45% w/v Optiprep final concentration. This vesicle suspension was overlaid with 1 ml Optiprep 40, 35, 30, 25, and 20% (w/v) and 1 ml of PBS on the top. The gradients were centrifuged at 100,000 g for 18 h. One milliliter fractions was removed starting at the top, diluted with 20 ml PBS and the vesicles recovered by sedimentation at 100,000 g for 1 h and resuspended in PBS. To normalize vesicle production to the number of bacteria, in each experiment, a 2‐ml aliquot was taken from the 1‐l culture and 0.05% tyloxapol or tween‐80 was added to prevent bacterial clumping. This small culture was incubated in identical conditions as the large culture, and at the time of vesicle collection, dilutions were plated onto 7H10 agar plates and colony forming units (CFUs) counted. This procedure was repeated by different operators blinded to the identity of the samples.
Quantitation of MEVs
Isolated vesicles were quantitated by orthogonal methods including protein, lipid, and antigen content, and Nano particle tracking analysis. Protein concentration was measured using the Bradford assay (Bio Rad) while the lipophilic fluorescent probe 1‐(4‐Trimethylammoniumphenyl)‐6‐Phenyl‐1,3,5‐Hexatriene p‐Toluenesulfonate (TMA‐DPH) (Thermo Fisher Scientific) was used to estimate lipid content. TMA‐DPH at a final concentration of 1 μg/ml was mixed with 10 μl of the vesicle preparation in 100 μl of PBS and incubated at 33°C for 20 min, in the dark before measuring fluorescence in a Synergy HI (Biotek) plate reader at 360 nm excitation and 430 nm emission.
To perform semiquantitative Western dot blot, 2 μl of purified vesicles suspended in a volume of PBS normalized to the CFU number and twofold serial dilutions were spotted onto a nitrocellulose membrane (Abcam) and incubated with anti‐MEV polyclonal murine serum (Prados‐Rosales et al, 2014a) as primary antibody for MEV or anti‐LAM specific monoclonal antibody CS‐35 for detection of Msm EVs (ATCC). Antigen–antibody complexes were detected using anti‐mouse IgG and the ECL prime Western Blotting Detection chemiluminescent kit (GE Healthcare). The signal was visualized in a Chemidoc MP imaging system (BIO‐RAD).
Nanoparticle tracking analysis (NTA) was conducted using ZetaView (Particle Metrix). Measurements were taken using a 405 nm 68 mW laser and CMOS camera by scanning 11 cell positions and capturing 30 frames per position at 25°C with camera sensitivity 85, shutter speed 100. Samples were diluted in prefiltered PBS to approximately 106–107 particles/ml. Analysis was performed using the ZetaView Software version 8.05.12 SP1 with a minimum brightness 30, maximum brightness 255, minimum area 5, maximum area 1,000, and minimum trace length 15. Triplicate videos of each sample were taken in light scatter mode. Particle size and concentration were analyzed and plotted using GraphPad Prism 5.0 software.
Cell membrane integrity assay
Mycobacterial strains were grown in 7H9 medium for 7 days, washed in PBS, and transfer to high‐iron MM at O.D595 of 0.3. When specified, MM was supplemented with INH at a final concentration of 50 ng/ml. Cultures were grown until they reached an O.D595 of 0.5 and harvested to get both bacterial cells and culture supernatants. Bacterial cells were disrupted by mechanical agitation to obtain cellular lysates. Supernatants were filtered through a 0.22‐μm filter and concentrated 20 times via ultrafiltration through 100 kDa cutoff membranes (Amicon). Protein concentration in both cell lysates and cell supernatants was determined by BCA (ThermoFisher). Protein extracts were separated in a 12% SDS–PAGE and transferred to nitrocellulose membranes. The blots were blocked with 5% (w/v) nonfat dry milk in PBS for 1 h at room temperature and subsequently incubated overnight at 4°C with a rabbit polyclonal anti‐IdeR (Dussurget et al, 1996) and murine polyclonal anti‐Ag85b (ATCC) antibodies diluted 1:2,000 and 1:3,000, respectively, in PBST with 5% (w/v) nonfat dry milk. Following three PBST washes of 5 min each, the blots were incubated with horseradish peroxidase–conjugated goat anti‐rabbit IgG (Southern Biotech) in blocking buffer for 1 h at room temperature for IdeR detection and with horseradish peroxidase–conjugated goat anti‐mouse IgG (Southern Biotech) for Ag85b detection. After three washes with PBST, the blots were developed by chemiluminescence using the ECL‐pico Western Detection Kit (Pierce).
Generation of an iniC mutant of Msm
The 500‐bps upstream and downstream of iniC were PCR‐amplified from genomic DNA and cloned by In‐Fusion cloning (Takara) into pKM342 (van Kessel & Hatfull, 2006) at the NotI and HindIII sites, respectively. The resulting plasmid (pSM1029) was digested with NdeI and SapI and the excised DNA fragment encompassing the hygromycin resistance cassette flanked by the upstream, and downstream regions of iniC was purified by agarose gel electrophoresis (Qiagen), and electroporated into Msm mc21551 harboring pJV53, which provides the Che9c recombinase (van Kessel & Hatfull, 2006). This recipient Msm strain was grown to logarithmic phase in medium containing 0.2% Na succinate and then treated with 0.2% acetamide to induce expression of gp60 and gp61 of Che9c that facilitate homologous recombination and allelic exchange (van Kessel & Hatfull, 2006). Transformants were selected on 7H10 containing 50 μg/ml hygromycin (Hyg). Hyg‐resistant colonies were analyzed by colony PCR using primers within the Hyg resistance cassette and upstream iniC. PCR products were sequenced to validate allelic exchange.
Protein structure modeling
The crystal structure of IniA from Msm was obtained from the RCSB protein data bank (PDB ID: 6j72) (Wang et al, 2019). The protein structure for IniA and IniC from Mtb was predicted using AlfaFold2 (version ptm) by inputting the amino acid sequences in ColabFold 2. The resulting models were assessed by their two predicted error matrices: per residue local distance difference test (pLDDT) score and predicted template modeling (pTM) scores. The pLDDT scores signify the accuracy of backbone prediction, whereas the pTM scores signify the accuracy of 3D structure of the produced models. A pLDDT score between 70 and 90 indicates a well‐modeled structure, and a pTM score above 0.5 indicates correct domain prediction; confidence increases with a higher value with both parameters. The complex of IniA and IniC from Mtb was predicted using AlfaFold2‐Multimer by inputting the amino acid sequences of IniA and IniC in colabFold as directed. The predicted models were visualized using the PyMol protein visualizing software (https://pymol.org/2/). Clustal Omega (https://www.ebi.ac.uk/Tools/msa/clustalo/) was used for multiple sequence alignment to annotate the domains of the predicted protein models. In addition to pLDDT and pTM scores, the ipTM (interface predicted template modeling) was noted. An ipTM score ≥ 0.85 indicates a highly reliable binding interface.
IniAC interaction assays
A soluble protein extract of E. coli BL21 transformed with pSM1024 or pSM1074 and induced with IPTG was divided into two fractions. One fraction was loaded into a glutathione‐agarose column (Thermo fisher Scientific) while the second fraction was bound to Ni2+‐NTA‐agarose beads (Qiagen). Material loosely bound was removed by washing the glutathione resin with ice‐cold lysis buffer plus 0.1% TritonX‐100 and the NTA agarose beads with lysis buffer containing 25 mM imidazole. GST‐IniA was eluted from the glutathione column with 10 mM reduced glutathione in 50 mM Tris–HCl pH 8.0. His‐IniC was eluted from the Ni2+‐NTA column with 250 mM imidazole. Eluted proteins were separated by SDS–PAGE and visualized by Coomassie staining. GST‐IniA and His‐IniC were detected by Western blot using anti‐GST (Santa Cruz) and anti‐His (Qiagen) specific antibodies, respectively. In parallel, BL21 expressing individually tagged proteins were induced and the lysates corresponding to GST‐IniA and His‐IniC were loaded in a Ni2+‐NTA column and a glutathione‐agarose column, respectively, to control for nonspecific binding.
Electron microscopy
Cells were fixed with 2% glutaraldehyde in 0.1 M cacodylate at room temperature for 2 h, and then incubated overnight in 4% formaldehyde, 1% glutaraldehyde, and 0.1% PBS. After fixation, samples were stained for 90 min in 2% osmium, serially dehydrated in ethanol, and embedded in Spurrs epoxy resin. Thin sections were obtained on an Ultracut UCT (Reichert) and stained with 1% uranyl acetate. Samples were examined in a JEOL JEM1010 operating at 100 kV. For Cryo‐EM, grids were prepared following the standard procedures and observed at liquid nitrogen temperatures in a JEOL JEM‐2200FS/CR transmission electron microscope operated at 200 kV. An in‐column omega energy filter helped to record images with improved signal/noise ratio by zero‐loss filtering. The energy selecting slit width was set at 9 eV. Digital images were recorded on an UltraScan4000 CCD camera under low‐dose conditions at a magnification of 55,058 obtaining a final pixel size of 2.7 Å/pixel.
Mycobactin determination
Mycobacterial strains were grown to mid‐logarithmic phase in 7H9 medium, and 0.7 ml of culture was spread on LI MM agar. After incubation at 37° for 10 days, the bacteria were scraped from the plate, incubated over night with ethanol, and cellular mycobactin extracted in chloroform. Mycobactin was detected and quantified as previously described (Hall & Ratledge, 1982).
Stress assays
To evaluate susceptibility to lysozyme, Mtb strains were grown in 7H9 to early logarithmic phase and then diluted to an O.D540 of 0.1 with 7H9 containing 0, 25 or 50 μg/ml lysozyme (Sigma). The cultures were incubated with agitation at 37°C and increase in O.D540 was monitored daily.
Sensitivity to SDS was tested in zone inhibition assays. Mtb strains were grown in 7H9 medium, and approximately 3 × 10⁷ bacteria were spread evenly onto 7H10 agar plates. A 6.5‐mm paper disk saturated with 10 μl of a solution of SDS 10% was placed in the center of the plate. The diameter of the halo of growth inhibition was measured after 10 days of incubation.
Acid fast staining
Mtb bacilli were fixed with 4% paraformaldehyde and stained with TB‐Auramine‐Rhodamine stain (Remel) following the manufacturer's instructions and visualized in a Nikon Ti‐E fluorescence microscope.
Aggregation assay
Mtb strains grown in 7H10 agar plates were suspended in LIMM without detergent at an initial O.D540 of 0.2. A 5 ml volume of the suspension was dispensed into each well of a six‐well plate. Images of the pellicle formed at the liquid–air interface were captured at increasing time intervals.
Macrophage culture
THP‐1 cells obtained from ATCC were cultured in RPMI (Sigma) supplemented with 10% fetal calf serum, 2 mM L‐Glutamine, and 1 mM Na Pyruvate. To isolate BMDM, bone marrow cells were flushed from the femurs and tibias of C57BL/6 mice using PBS containing penicillin and streptomycin (100 U/ml each). ACK lysing buffer (Quality Biologicals Inc.) was used for red blood cell lysis. A total of 1 × 10⁷ bone marrow cells were seeded in 10 ml DMEM media supplemented with 20% conditioned medium from L929 fibroblast cells (D10 medium). On Days 3 and 5, 50% of the culture medium was replaced with fresh D10 medium. Adherent BMDMs were harvested on Day 5.
Survival of Mtb in macrophages
THP‐1 cells were induced to differentiate into macrophages by treatment with 50 nM phorbol myristate acetate for 24 h and infected with Mtb at an MOI of 1 with Mtb strains grown to logarithmic phase. After 4 h of incubation, macrophages were washed extensively with PBS to remove extracellular bacteria, and fresh RPMI medium was added. At indicated time points, macrophages were lysed with 0.05% sodium dodecyl sulfate (SDS) and serial dilutions of the lysate were plated on 7H10 agar plates to determine CFUs. When assessing Mtb replication in BMDM, macrophages were incubated with Mtb strains at an MOI of 5 for 4 h in antibiotic‐free D10 and then treated with amikacin sulphate (200 μg/ml) for 45 min to eliminate extracellular bacteria. Cells were washed twice, and fresh D10 medium added. At indicated time points, macrophages were lysed and serial dilutions of the lysate were plated on 7H10 agar plates to determine CFUs.
Macrophage response to Mtb infection
Bone marrow‐derived murine macrophages were incubated for 3 h with Mtb strains at the indicated MOI in antibiotic‐free D10 and then washed with PBS to remove extracellular bacteria. After 24 h, the supernatant was collected, sterilized using 0.22‐μm ultrafree‐MC centrifugal filter (EMD Millipore) and cytokines quantified using Mouse proinflammatory V panel from Meso‐Scale Discovery (Gaithersburg, MD) according to the manufacturer's instructions. The plates were read on an MSD detector (Sector Imager 2400, MSD). The calculations to establish calibration curves and determine analyte concentrations were carried out using the MSD discovery workbench analysis software.
Analysis of EVs released by Mtb‐infected macrophages
A equal number of THP‐1 cells were infected with Mtb strains at MOI of 2. After 24 h, the culture supernatants were collected for EV isolation while the macrophages were washed two times with PBS, lysed with SDS to release intracellular bacteria. Serial dilutions of the lysate were plated onto 7H10 agar plates to enumerate CFUs and control for bacterial uptake. Extracellular vesicles in the supernatants were separated by ultracentrifugation at 100,000 g for 2 h followed by a wash with PBS. Extracellular vesicles containing bacterial proteins were detected by semiquantitative dot blot with an anti‐MEV polyclonal antibody. Host exosomes were detected by Western blot with anti‐CD9‐specific antibody (Abcam). Particle number was determined by NTA as above.
Author contributions
Shamba Gupta: Conceptualization; data curation; formal analysis; investigation; writing – original draft. Madhuri Bhagavathula: Data curation; validation; investigation; methodology. Vartika Sharma: Validation; investigation; methodology. Nishant Sharma: Validation; investigation; visualization; methodology. Nevadita Sharma: Validation; investigation; methodology. Ashis Biswas: Validation; investigation; methodology. Ainhoa Palacios: Validation; investigation. Vivian Salgueiro: Validation; investigation. Jose L Lavín: Formal analysis; visualization. Navneet Dogra: Investigation; visualization. Padmini Salgame: Conceptualization; supervision; funding acquisition; investigation; writing – review and editing. Rafael Prados‐Rosales: Conceptualization; formal analysis; supervision; funding acquisition; investigation; writing – original draft. G Marcela Rodríguez: Conceptualization; resources; formal analysis; supervision; funding acquisition; investigation; project administration; writing – review and editing.
Disclosure and competing interests statement
The authors declare that they have no conflict of interest.
Supporting information
Appendix
Expanded View Figures PDF
Source Data for Expanded View
Source Data for Figure 1
Source Data for Figure 2
Source Data for Figure 5
PDF+
Acknowledgements
We are grateful to Carl Nathan, David Alland and Roberto Colangeli for sharing mutant Mtb strains, Jeanette Han for assisting with fluorescent microscopy and Ana M. Aransay and the Genome Analysis Platform at CICbioGUNE for their help on the RNA sequencing. This work was supported by NIH‐NIAID AI162821 awarded to GMR&PS and AI153560 awarded to GMR. RP‐R acknowledges support by MINECO contract PID2019‐110240RB‐I00. VS holds a FPI fellowships from MICINN linked to PID2019‐110240RB‐I00 contract. CIC bioGUNE thanks MINECO for the Severo Ochoa Excellence Accreditation (SEV‐2016–0644). AP holds a fellowship from the Department of Education of the Basque Government (PRE_2018_1_0229).
EMBO reports (2023) 24: e55593
Contributor Information
Padmini Salgame, Email: salgampa@njms.rutgers.edu.
Rafael Prados‐Rosales, Email: rafael.prados@uam.es.
G Marcela Rodríguez, Email: rodrigg2@njms.rutgers.edu.
Data availability
The Datasets produced in this study are available in the following database: RNA‐seq data: Gene expression Omnibus, GSE143996 (https://www.ncbi.nlm.nih.gov/geo/query/acc.cgi?acc=GSE143996).
References
- Abdallah AM, Gey van Pittius NC, Champion PA, Cox J, Luirink J, Vandenbroucke‐Grauls CM, Appelmelk BJ, Bitter W (2007) Type VII secretion—mycobacteria show the way. Nat Rev Microbiol 5: 883–891 [DOI] [PubMed] [Google Scholar]
- Agrawal A, Ramachandran R (2019) Exploring the links between lipid geometry and mitochondrial fission: emerging concepts. Mitochondrion 49: 305–313 [DOI] [PubMed] [Google Scholar]
- Alland D, Steyn AJ, Weisbrod T, Aldrich K, Jacobs WR Jr (2000) Characterization of the Mycobacterium tuberculosis iniBAC promoter, a promoter that responds to cell wall biosynthesis inhibition. J Bacteriol 182: 1802–1811 [DOI] [PMC free article] [PubMed] [Google Scholar]
- Athman JJ, Wang Y, McDonald DJ, Boom WH, Harding CV, Wearsch PA (2015) Bacterial membrane vesicles mediate the release of Mycobacterium tuberculosis lipoglycans and lipoproteins from infected macrophages. J Immunol 195: 1044–1053 [DOI] [PMC free article] [PubMed] [Google Scholar]
- Athman JJ, Sande OJ, Groft SG, Reba SM, Nagy N, Wearsch PA, Richardson ET, Rojas R, Boom WH, Shukla S et al (2017) Mycobacterium tuberculosis membrane vesicles inhibit T cell activation. J Immunol 198: 2028–2037 [DOI] [PMC free article] [PubMed] [Google Scholar]
- Beatty W, Rhoades E, Ullrich H, Chatterjee D, Heuser J, Russell D (2000) Trafficking and release of mycobacterial lipids from infected macrophages. Traffic 3: 235–247 [DOI] [PubMed] [Google Scholar]
- Boot M, van Winden VJC, Sparrius M, van de Weerd R, Speer A, Ummels R, Rustad T, Sherman DR, Bitter W (2017) Cell envelope stress in mycobacteria is regulated by the novel signal transduction ATPase IniR in response to trehalose. PLoS Genet 13: e1007131 [DOI] [PMC free article] [PubMed] [Google Scholar]
- Cambier CJ, Falkow S, Ramakrishnan L (2014) Host evasion and exploitation schemes of Mycobacterium tuberculosis . Cell 159: 1497–1509 [DOI] [PubMed] [Google Scholar]
- Chiplunkar SS, Silva CA, Bermudez LE, Danelishvili L (2019) Characterization of membrane vesicles released by Mycobacterium avium in response to environment mimicking the macrophage phagosome. Future Microbiol 14: 293–313 [DOI] [PMC free article] [PubMed] [Google Scholar]
- Ciofu O, Beveridge TJ, Kadurugamuwa J, Walther‐Rasmussen J, Hoiby N (2000) Chromosomal beta‐lactamase is packaged into membrane vesicles and secreted from Pseudomonas aeruginosa . J Antimicrob Chemother 45: 9–13 [DOI] [PubMed] [Google Scholar]
- Colangeli R, Helb D, Sridharan S, Sun J, Varma‐Basil M, Hazbon MH, Harbacheuski R, Megjugorac NJ, Jacobs WR Jr, Holzenburg A et al (2005) The Mycobacterium tuberculosis iniA gene is essential for activity of an efflux pump that confers drug tolerance to both isoniazid and ethambutol. Mol Microbiol 55: 1829–1840 [DOI] [PubMed] [Google Scholar]
- De Voss JJ, Rutter K, Schroeder BG, Su H, Zhu Y, Barry CE 3rd (2000) The salicylate‐derived mycobactin siderophores of Mycobacterium tuberculosis are essential for growth in macrophages. Proc Natl Acad Sci USA 97: 1252–1257 [DOI] [PMC free article] [PubMed] [Google Scholar]
- Dussurget O, Rodriguez GM, Smith I (1996) An ideR mutant of Mycobacterium smegmatis has a derepressed siderophore production and an altered oxidative‐stress response. Mol Microbiol 22: 535–544 [DOI] [PubMed] [Google Scholar]
- Feltcher ME, Sullivan JT, Braunstein M (2010) Protein export systems of Mycobacterium tuberculosis: novel targets for drug development? Future Microbiol 5: 1581–1597 [DOI] [PMC free article] [PubMed] [Google Scholar]
- Gill S, Catchpole R, Forterre P (2019) Extracellular membrane vesicles in the three domains of life and beyond. FEMS Microbiol Rev 43: 273–303 [DOI] [PMC free article] [PubMed] [Google Scholar]
- Goetz DH, Holmes MA, Borregaard N, Bluhm ME, Raymond KN, Strong RK (2002) The neutrophil lipocalin NGAL is a bacteriostatic agent that interferes with siderophore‐mediated iron acquisition. Mol Cell 10: 1033–1043 [DOI] [PubMed] [Google Scholar]
- Gupta S, Rodriguez GM (2019) Isolation and characterization of extracellular vesicles produced by iron‐limited mycobacteria. J Vis Exp 2019: e60359 [DOI] [PubMed] [Google Scholar]
- Hall RM, Ratledge C (1982) A simple method for the production of mycobactin, the lipid‐soluble siderophore, from mycobacteria. FEMS Microbiol Lett 15: 133–136 [Google Scholar]
- Harrison KJ, Crécy‐Lagard VD, Zallot R (2018) Gene graphics: a genomic neighborhood data visualization web application. Bioinformatics 34: 1406–1408 [DOI] [PMC free article] [PubMed] [Google Scholar]
- Jimah JR, Hinshaw JE (2019) Structural insights into the mechanism of dynamin superfamily proteins. Trends Cell Biol 29: 257–273 [DOI] [PMC free article] [PubMed] [Google Scholar]
- Jones CM, Wells RM, Madduri AV, Renfrow MB, Ratledge C, Moody DB, Niederweis M (2014) Self‐poisoning of Mycobacterium tuberculosis by interrupting siderophore recycling. Proc Natl Acad Sci USA 111: 1945–1950 [DOI] [PMC free article] [PubMed] [Google Scholar]
- Jurkoshek KS, Wang Y, Athman JJ, Barton MR, Wearsch PA (2016) Interspecies communication between pathogens and immune cells via bacterial membrane vesicles. Front Cell Dev Biol 4: 125 [DOI] [PMC free article] [PubMed] [Google Scholar]
- Kellerer C, Hoffmann R, Lang R, Brandau S, Hermann C, Ehlers S (2006) Genetically determined susceptibility to tuberculosis in mice causally involves accelerated and unhanced recruuitment of granulocytes. Infect Immun 74: 4295–4309 [DOI] [PMC free article] [PubMed] [Google Scholar]
- Kuehn MJ, Kesty NC (2005) Bacterial outer mebrane vesicles and the host‐pathogen interactions. Genes Dev 19: 2645–2655 [DOI] [PubMed] [Google Scholar]
- Kuipers ME, Hokke CH, Smits HH, Nolte‐'t Hoen ENM (2018) Pathogen‐derived extracellular vesicle‐associated molecules that affect the host immune system: an overview. Front Microbiol 9: 2182 [DOI] [PMC free article] [PubMed] [Google Scholar]
- Kurthkoti K, Amin H, Marakalala MJ, Ghanny S, Subbian S, Sakatos A, Livny J, Fortune SM, Berney M, Rodriguez GM (2017a) The capacity of Mycobacterium tuberculosis to survive iron‐starvation might enable it to persist in iron‐deprived microenvironments of human granulomas. Gene Expression Omnibus GSE84554 (https://www.ncbi.nlm.nih.gov/geo/query/acc.cgi?acc=GSE84554). [DATASET] [DOI] [PMC free article] [PubMed]
- Kurthkoti K, Amin H, Marakalala MJ, Ghanny S, Subbian S, Sakatos A, Livny J, Fortune SM, Berney M, Rodriguez GM (2017b) The capacity of Mycobacterium tuberculosis to survive iron starvation might enable it to persist in iron‐deprived microenvironments of human granulomas. MBio 8: e01092‐17 [DOI] [PMC free article] [PubMed] [Google Scholar]
- Lee J, Kim SH, Choi DS, Lee JS, Kim DK, Go G, Park SM, Kim SH, Shin JH, Chang CL et al (2015) Proteomic analysis of extracellular vesicles derived from Mycobacterium tuberculosis . Proteomics 15: 3331–3337 [DOI] [PubMed] [Google Scholar]
- Liao Y, Smyth GK, Shi W (2013) The subread aligner: fast, accurate and scalable read mapping by seed‐and‐vote. Nucleic Acids Res 41: e108 [DOI] [PMC free article] [PubMed] [Google Scholar]
- Liu J, Noel JK, Low HH (2018) Structural basis for membrane tethering by a bacterial dynamin‐like pair. Nat Commun 9: 3345 [DOI] [PMC free article] [PubMed] [Google Scholar]
- Love MI, Huber W, Anders S (2014) Moderated estimation of fold change and dispersion for RNA‐seq data with DESeq2. Genome Biol 15: 550 [DOI] [PMC free article] [PubMed] [Google Scholar]
- Manganelli R, Fattorini L, Tan D, Iona E, Orefici G, Altavilla G, Cusatelli P, Smith I (2004) The extra cytoplasmic function sigma factor σE is essential for Mycobacterium tuberculosis virulence in mice. Infect Immun 72: 3038–3041 [DOI] [PMC free article] [PubMed] [Google Scholar]
- Marsollier L, Brodin P, Jackson M, Kordulakova J, Tafelmeyer P, Carbonnelle E, Aubry J, Milon G, Legras P, Andre JP et al (2007) Impact of Mycobacterium ulcerans biofilm on transmissibility to ecological niches and Buruli ulcer pathogenesis. PLoS Pathog 3: e62 [DOI] [PMC free article] [PubMed] [Google Scholar]
- Mittal E, Kumar S, Rahman A, Krishnasastry MV (2014) Modulation of phagolysosome maturation by bacterial tlyA gene product. J Biosci 39: 821–834 [DOI] [PubMed] [Google Scholar]
- Pal R, Hameed S, Fatima Z (2019) Altered drug efflux under iron deprivation unveils abrogated MmpL3 driven mycolic acid transport and fluidity in mycobacteria. Biometals 32: 49–63 [DOI] [PubMed] [Google Scholar]
- Prados‐Rosales R, Baena A, Martinez LR, Luque‐Garcia J, Kalscheuer R, Veeraraghavan U, Camara C, Nosanchuk JD, Besra GS, Chen B et al (2011) Mycobacteria release active membrane vesicles that modulate immune responses in a TLR2‐dependent manner in mice. J Clin Invest 121: 1471–1483 [DOI] [PMC free article] [PubMed] [Google Scholar]
- Prados‐Rosales R, Carreno LJ, Batista‐Gonzalez A, Baena A, Venkataswamy MM, Xu J, Yu X, Wallstrom G, Magee DM, LaBaer J et al (2014a) Mycobacterial membrane vesicles administered systemically in mice induce a protective immune response to surface compartments of Mycobacterium tuberculosis . MBio 5: e01921‐14 [DOI] [PMC free article] [PubMed] [Google Scholar]
- Prados‐Rosales R, Weinrick B, Piqué D, Jacobs WR Jr, Casadevall A, Rodriguez GM (2014b) Role for Mycobacterium tuberculosis membrane vesicles in iron acquistion. J Bacteriol 196: 1250–1256 [DOI] [PMC free article] [PubMed] [Google Scholar]
- Pucadyil TJ (2011) Dynamic remodeling of membranes catalyzed by dynamin. Curr Top Membr 68: 33–47 [DOI] [PubMed] [Google Scholar]
- Rath P, Huang C, Wang T, Wang T, Li H, Prados‐Rosales R, Elemento O, Casadevall A, Nathan CF (2013) Genetic regulation of vesiculogenesis and immunomodulation in Mycobacterium tuberculosis . Proc Natl Acad Sci USA 110: E4790–E4797 [DOI] [PMC free article] [PubMed] [Google Scholar]
- Ratledge C, Patel PV, Mundy J (1982) Iron transport in Mycobacterium smegmatis: the location of mycobactin by electron microscopy. J Gen Microbiol 128: 1559–1565 [DOI] [PubMed] [Google Scholar]
- Rivera‐Calzada A, Famelis N, Llorca O, Geibel S (2021) Type VII secretion systems: structure, functions and transport models. Nat Rev Microbiol 19: 567–584 [DOI] [PubMed] [Google Scholar]
- Rodriguez GM, Voskuil MI, Gold B, Schoolnik GK, Smith I (2002) ideR, An essential gene in Mycobacterium tuberculosis: role of IdeR in iron‐dependent gene expression, iron metabolism, and oxidative stress response. Infect Immun 70: 3371–3381 [DOI] [PMC free article] [PubMed] [Google Scholar]
- Rodriguez GM, Gardner RA, Kaur N, Phanstiel O 4th (2008) Utilization of Fe3+‐Acinetoferrin analogues as an iron source by Mycobacterium tuberculosis . Biometals 21: 93–103 [DOI] [PubMed] [Google Scholar]
- Schmittgen TD, Livak KJ (2008) Analyzing real‐time PCR data by the comparative CT method. Nat Protoc 3: 1101–1108 [DOI] [PubMed] [Google Scholar]
- Schorey JS, Cheng Y, McManus WR (2021) Bacteria‐ and host‐derived extracellular vesicles–two sides of the same coin? J Cell Sci 134: jcs256628 [DOI] [PMC free article] [PubMed] [Google Scholar]
- Smith VL, Cheng Y, Bryant BR, Schorey JS (2017) Exosomes function in antigen presentation during an in vivo Mycobacterium tuberculosis infection. Sci Rep 7: 43578 [DOI] [PMC free article] [PubMed] [Google Scholar]
- Trapnell C, Salzberg SL (2009) How to map billions of short reads onto genomes. Nat Biotechnol 27: 455–457 [DOI] [PMC free article] [PubMed] [Google Scholar]
- Untergasser A, Cutcutache I, Koressaar T, Ye J, Faircloth BC, Remm M, Rozen SG (2012) Primer3—new capabilities and interfaces. Nucleic Acids Res 40: e115 [DOI] [PMC free article] [PubMed] [Google Scholar]
- van Kessel JC, Hatfull GF (2006) Recombineering in Mycobacterium tuberculosis . Nat Methods 4: 147–152 [DOI] [PubMed] [Google Scholar]
- Vijay S, Hai HT, Thu DDA, Johnson E, Pielach A, Phu NH, Thwaites GE, Thuong NTT (2017) Ultrastructural analysis of cell envelope and accumulation of lipid inclusions in clinical Mycobacterium tuberculosis isolates from sputum, oxidative stress, and iron deficiency. Front Microbiol 8: 2681 [DOI] [PMC free article] [PubMed] [Google Scholar]
- Wang M, Guo X, Yang X, Zhang B, Ren J, Liu A, Ran Y, Yan B, Chen F, Guddat LW et al (2019) Mycobacterial dynamin‐like protein IniA mediates membrane fission. Nat Commun 10: 3906 [DOI] [PMC free article] [PubMed] [Google Scholar]
- Ziegenbalg A, Prados‐Rosales R, Jenny‐Avital ER, Kim RS, Casadevall A, Achkar JM (2013) Immunogenicity of mycobacterial vesicles in humans: identification of a new tuberculosis antibody biomarker. Tuberculosis (Edinb) 93: 448–455 [DOI] [PMC free article] [PubMed] [Google Scholar]