Abstract
Studies of DNA methylation (DNAm) in solid human tissues are relatively scarce; tissue-specific characterization of DNAm is needed to understand its role in gene regulation and its relevance to complex traits. We generated array-based DNAm profiles for 987 human samples from the Genotype-Tissue Expression (GTEx) project, representing 9 tissue types and 424 subjects. We characterized methylome and transcriptome correlations (eQTMs), genetic regulation in cis (mQTLs and eQTLs) across tissues and e/mQTLs links to complex traits. We identified mQTLs for 286,152 CpG sites, many of which (>5%) show tissue specificity, and mQTL colocalizations with 2,254 distinct GWAS hits across 83 traits. For 91% of these loci, a candidate gene link was identified by integration of functional maps, including eQTMs, and/or eQTL colocalization, but only 33% of loci involved an eQTL and mQTL present in the same tissue type. With this DNAm-focused integrative analysis, we contribute to the understanding of molecular regulatory mechanisms in human tissues and their impact on complex traits.
The majority of common genetic variants that impact human traits are believed to exert their effects through the regulation of gene expression1,2. Genetic regulation of gene expression has been comprehensively characterized across many human tissue types by the GTEx project3,4, and expression quantitative trait loci (eQTLs) appear to underlie a substantial fraction of variant-trait associations5–7. However, our understanding of the regulatory mechanisms by which variants influence human traits is far from complete.
Elucidating how variants impact epigenetic features, for example DNAm is critical, as these features can influence, and respond to, gene expression8. In humans, DNAm at CpG dinucleotides acts in key biological processes such as gene regulation and cell fate decisions9–11 and plays a critical role in the etiology of numerous diseases12. Interindividual DNAm variation is influenced by genetic variation13–17, and the integration of DNAm quantitative trait loci (mQTLs) with genome-wide association study (GWAS) data has uncovered a putative role for DNAm in genetic regulatory mechanisms14,18–23. With notable exceptions17–20,24–29, most mQTL studies conducted to date have assessed DNAm in whole blood-derived samples21,25,26,30–34, preventing the identification of tissue-specific mQTLs undetectable in blood. Therefore, given the existing differences in DNAm profiles across diverse tissues and cell types35,36, mQTL catalogs derived from a variety of healthy, solid tissues are needed to contribute to the characterization of the etiology of complex traits.
Gene expression with subject-matched genotype data is available for many healthy tissue sources from hundreds of individuals4,37, but comparable data sources for DNAm are limited to fewer tissue types38. The enhancing GTEx (eGTEx) project39 seeks to complement existing gene expression data from human tissues with additional molecular traits, including DNAm. Here, we profiled human DNAm for >750,000 genomic locations (CpGs or CpG sites) using the Illumina EPIC methylation array. The dataset includes 987 samples from 424 donors representing 9 tissue types: breast, kidney, colon, lung, muscle, ovary, prostate, testis and whole blood (Supplementary Table 1). Gene expression is also available for 3,872 samples derived from these 9 tissue types4, and 495 DNAm-profiled samples have gene expression and genotype data available. To further characterize the relationship between DNAm and gene expression in a tissue-specific manner, we identified CpGs for which DNAm was associated with local gene expression, that is expression quantitative trait methylation sites (eQTMs). To characterize the cis-genetic regulation of methylation across tissues and compare it to its gene expression counterpart, we mapped mQTLs and eQTLs. We contrasted mQTL to eQTL profiles and characterized their interdependency as well as differential tissue specificities, functional mechanisms and regulatory pleiotropy signatures. To evaluate the impact of mQTLs on human traits and assess their relative contribution compared to eQTLs, we integrated mQTLs and eQTLs with functional maps, including eQTMs, multi-context eQTLs and GWAS summary statistics of 87 GWASs. Overview of analyses performed is shown in Fig. 1.
Fig. 1 |. Scheme of data generation and analysis overview.
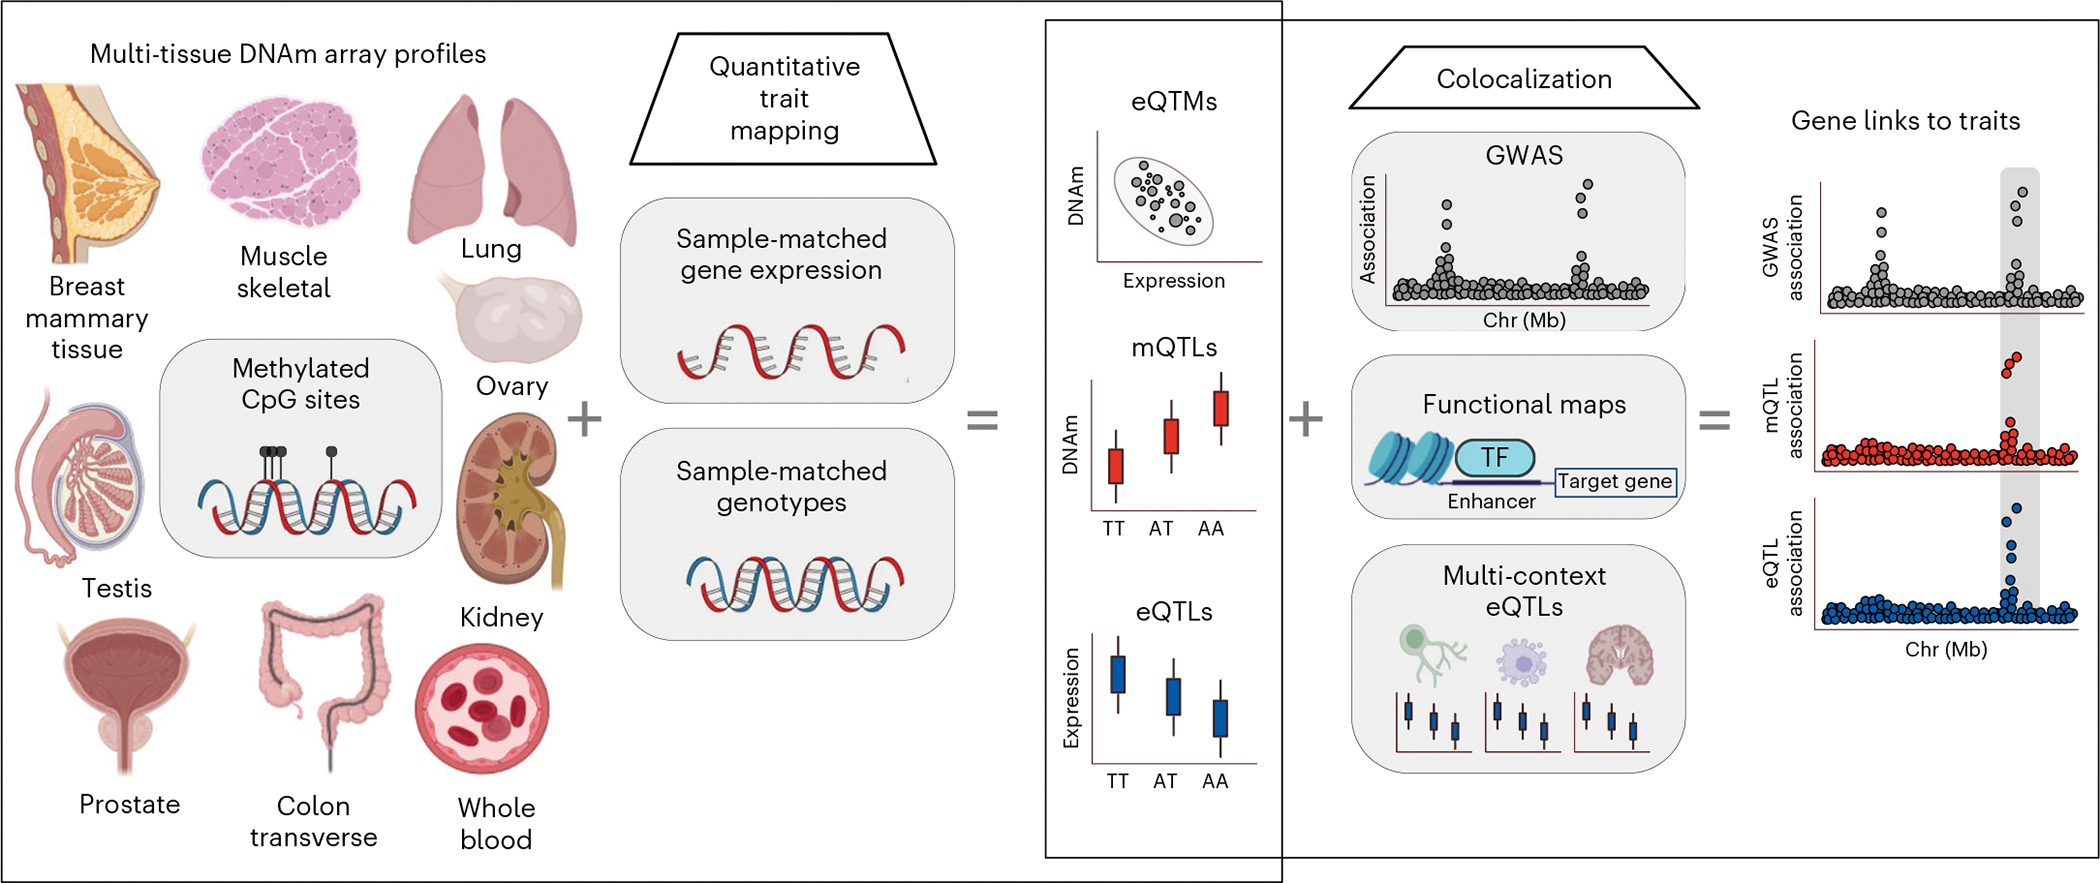
Multi-tissue DNAm Illumina EPIC-array-based profiles are integrated with GTEx project sample-matched gene expression to map DNAm-expression correlations (eQTMs). Sample-matched genotype data are integrated to map mQTLs and eQTLs. e/mQTL signal is colocalized with GWAS data and multi-context eQTLs, and integrated with eQTMs and functional maps, to link variants and genes to traits. This figure was created with adapted templates from http://biorender.com.
Results
DNAm and its correlation with local gene expression differs across tissues and by regulatory features
To investigate the contribution of tissue type to the similarity of DNAm-profiled samples, we applied dimension-reduction and clustering approaches (Methods), which revealed sample similarity by tissue of origin and comparable clusters to transcriptome-derived ones (Extended Data Fig. 1a,b). To characterize the interdependence between DNAm and expression, we mapped eQTMs across tissue types (Extended Data Fig. 1c) and evaluated factors that contribute to eQTM likelihood as a function of gene regulatory location (Methods and Supplementary Note). We observed that eQTMs tend to be either tissue-specific or shared across most (>6) tissue types (Extended Data Fig. 1d). DNAm-expression negative correlation was disproportionately observed for eQTM CpGs (eCpGs) located in proximal compared to distal gene regulatory regions (Extended Data Fig. 1e and Supplementary Table 2). These patterns have been described in specific tissue contexts26,40,41; our analysis confirms their ubiquity across tissues.
Genetic regulation of DNAm in cis exhibits tissue specificity
To characterize the genetic regulation of DNAm across tissues, we mapped genetic variants that affect DNAm levels of proximal (±500 kb) CpG sites in cis (mQTLs). To optimize mQTL discovery, we accounted for non-genetic DNAm variability by fitting per-tissue linear models including surrogate variables that capture technical, environmental and biological factors like age, cellular heterogeneity and smoking habits (Extended Data Figs. 2 and 3). We identified significant (false discovery rate (FDR) < 0.05) mQTL CpG sites in cis (mCpGs) and modeled mQTL effects jointly across tissues to increase QTL-mapping power by leveraging tissue-shared effects42. Additionally, we mapped secondary cis-QTL signals using a stepwise regression procedure43. Although mQTLs are substantially more abundant than eQTLs20,44, their distinctive genomic properties are not fully characterized. To facilitate comparisons of mQTL to cis-eQTL patterns, we used an analogous QTL-mapping approach to identify eQTLs.
We detected a total of 286,152 mQTL CpG sites, of which 45,543 (16%) have secondary signals in at least one tissue. Modeling mQTL effects jointly across tissues resulted in a substantial (more than five-fold) increase in detectable mCpGs per tissue, ranging from 108,844 in testis to 206,802 in lung (Fig. 2a and Supplementary Table 3). We quantified the mQTL replication rate in external muscle20 and brain23 datasets (Supplementary Table 3) and observed high replication rates (average π1 = 0.85).
Fig. 2 |. mQTL discovery and e/mQTL functional mechanism characterization.
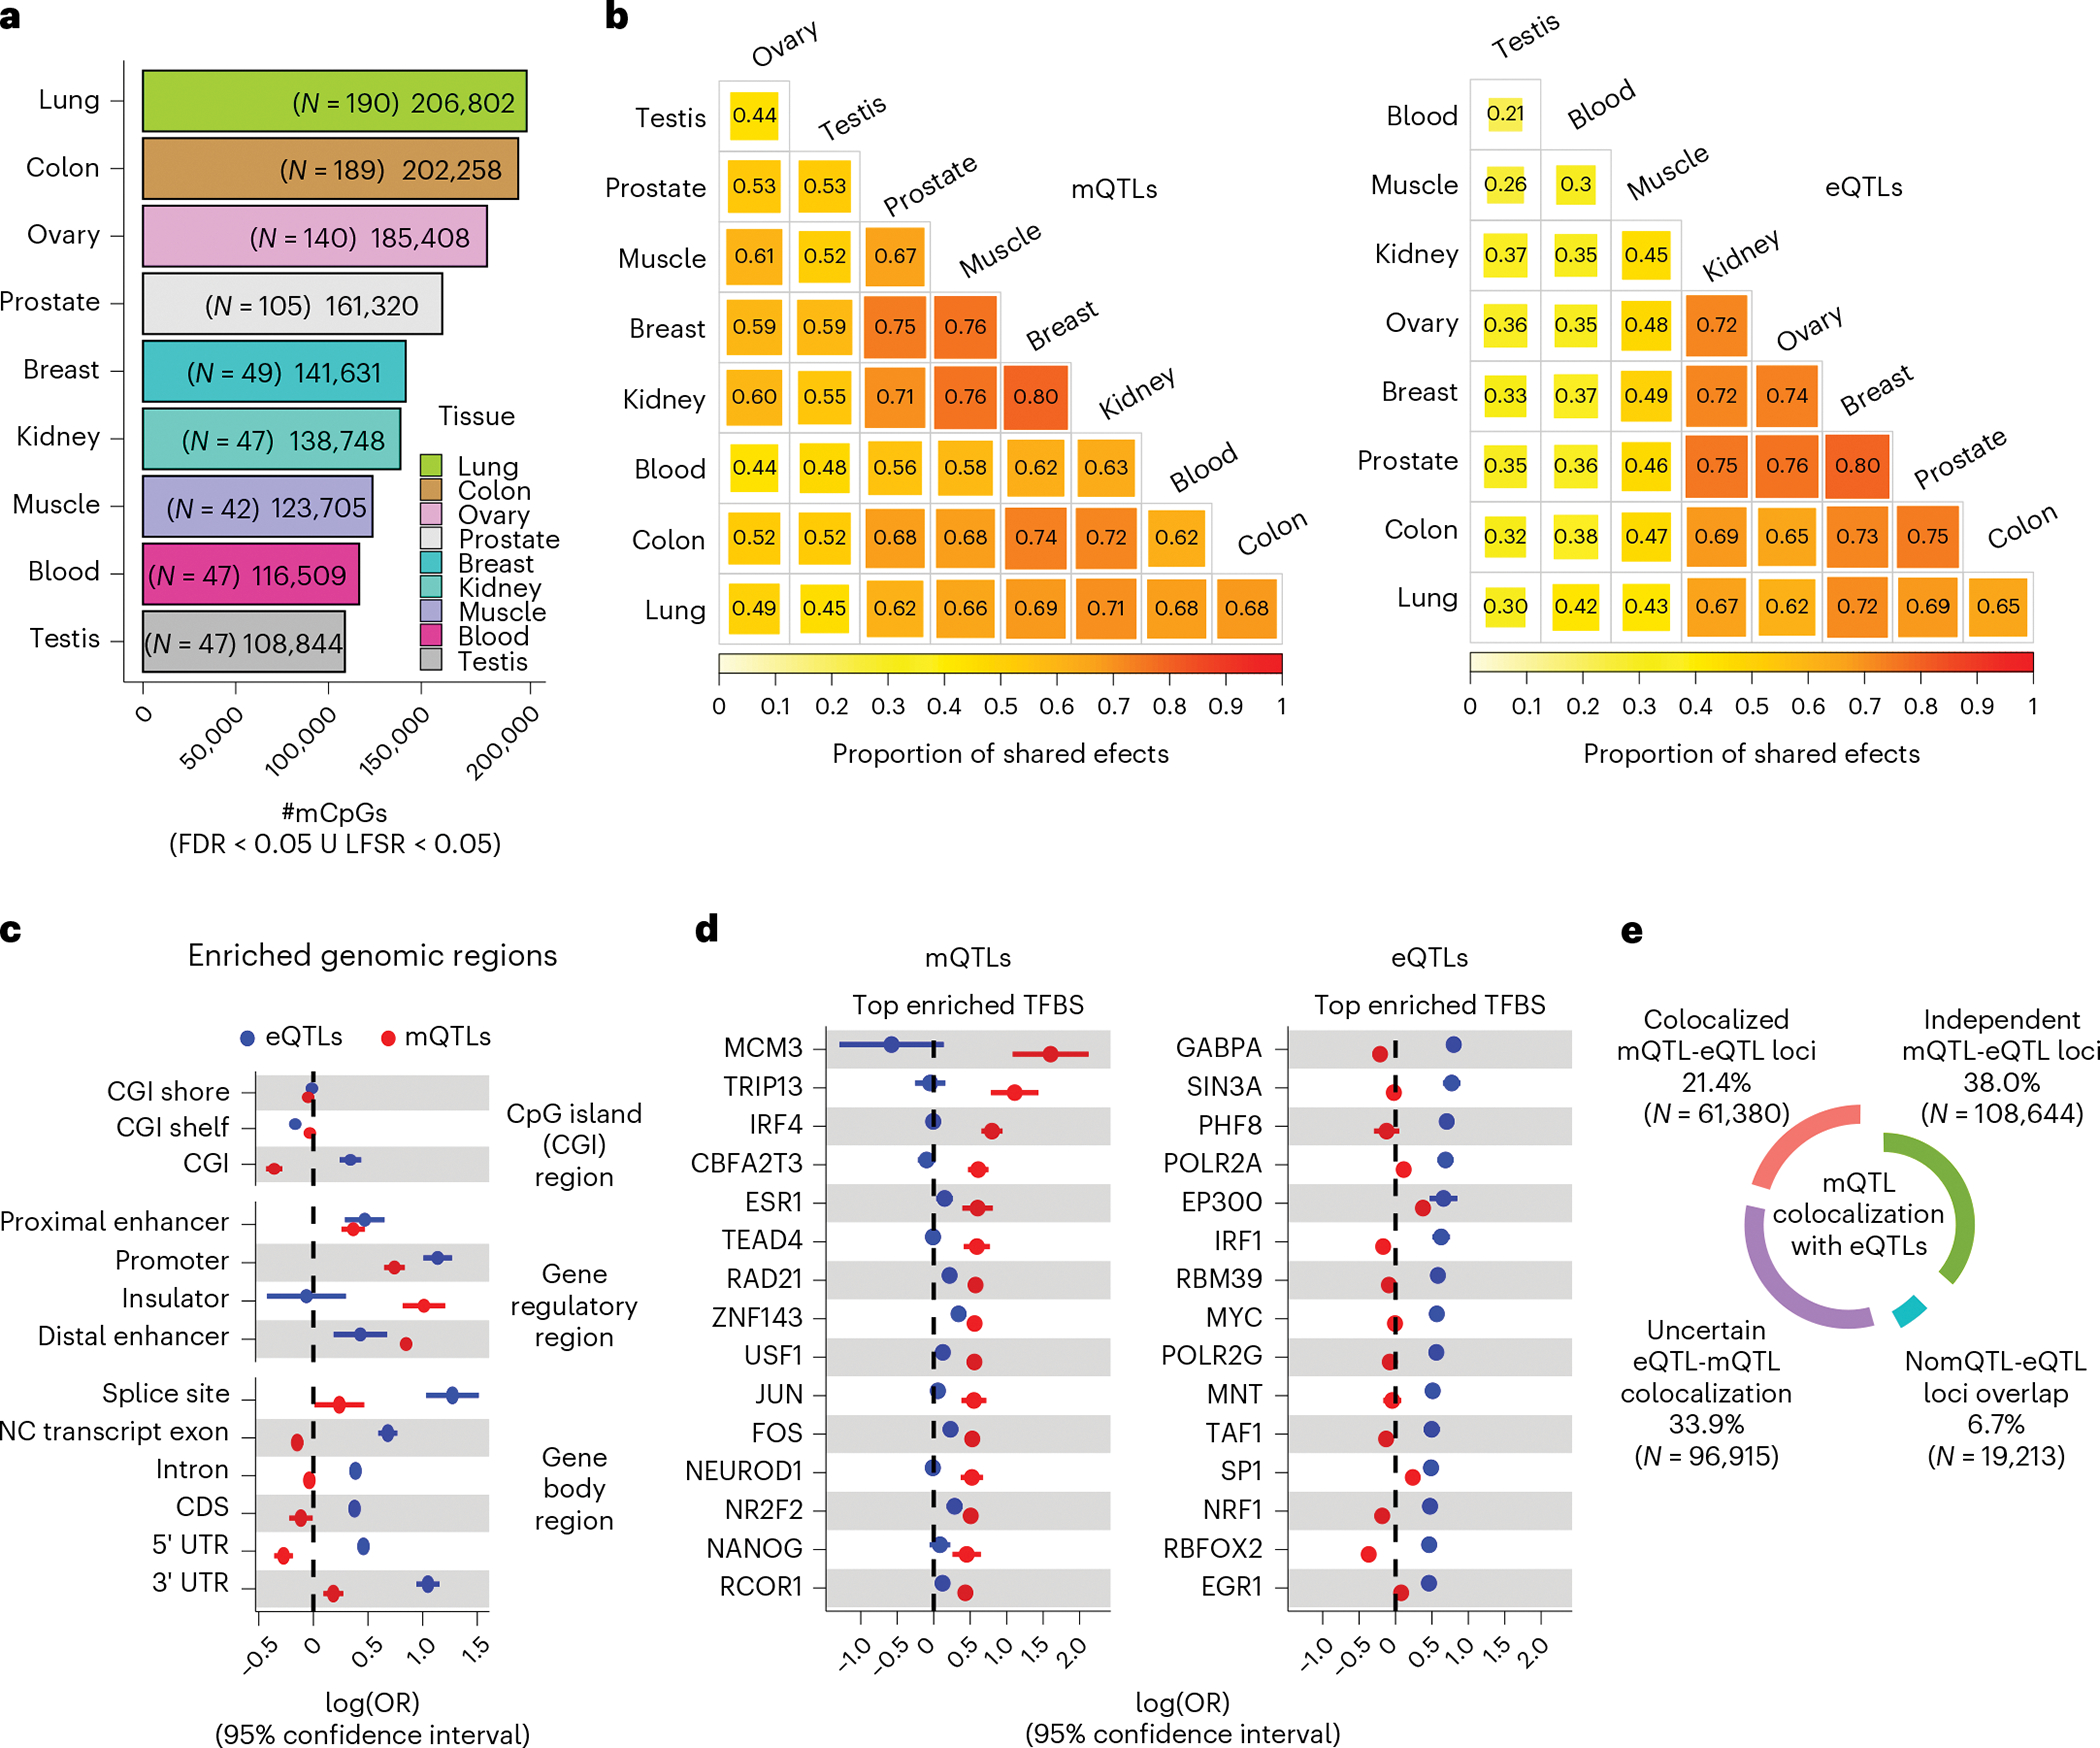
a, Number of CpGs with a mQTL (mCpGs) per tissue defined at local false sign rate (LFSR) < 0.05 or FDR < 0.05, shown with per-tissue mQTL-mapping sample sizes (N) in parentheses. mCpGs, CpG sites with a significant mQTL association. ∪, union. b, Cross-tissue sharing of mQTL (left panel) and eQTL (right panel) tissue-leveraged mashr-derived effect magnitudes. Tissues ordered based on hierarchical clustering with complete agglomeration with Euclidean distance. c, QTL enrichment (x axis) in CpG islands (CGIs), gene body sites and candidate cis-regulatory elements. NC, non-coding; CDS, coding sequence; UTR, untranslated exon region.; OR, odds ratio. d, QTL enrichment (x axis) in transcription factor binding sites (TFBS). Top (largest OR value) 15 significant TFBS enrichments for mQTLs (left panel) and eQTLs (right panel) are shown. For panels c and d, enrichment values correspond to maximum-likelihood estimated log(ORs) derived from across-tissue (nine tissues) meta-analysis (Methods), and whiskers represent the 95% confidence interval of the enrichment value. e, Percentage and number (in parentheses) of mQTL loci (FDR < 0.05) relative to eQTL-colocalization (PP4 > 0.5) category.
For a particular CpG, genetic regulation of DNAm tends to be either highly tissue specific or highly shared across tissue types (Extended Data Fig. 4a,b), similar to patterns observed for eQTLs and splicing QTLs (sQTLs)4. Larger effects are observed for tissue-shared mQTLs; mQTL effect size is correlated (Spearman’s rho > 0.15, P < 2.2 × 10⁻⁶) with the extent of tissue sharing. On average, 37% of mCpGs observed in a given tissue are also present in all tissues (Extended Data Fig. 4b). Compared to GTEx eQTLs, detected mQTLs, and corresponding effect sizes, are more likely to be shared across tissue types (Fig. 2b), as observed in blood cells26. On average, for a given mCpG, 46% of tissues show a similar (within a factor of 2) effect relative to the tissue with the strongest mQTL effect size, and effects are more similar across tissues for mCpGs located in proximal, compared to distal, gene regulatory regions (Extended Data Fig. 4c). On the other hand, a substantial fraction (5% on average) of the identified mCpGs in a given tissue were not detected in other tissues (Extended Data Fig. 4b). Tissue-specific mQTL patterns were clearly validated in external cohorts; we observe that mQTL effect sizes derived from external cohorts are significantly (Wilcoxon rank-sum test P < 1 × 10⁻⁶) larger, and more correlated (Extended Data Fig. 4d,e), when matching the corresponding GTEx mQTL tissue, or tissues with shared cell types. In aggregate, 41% (117,941/286,152) of mCpGs identified herein were not identified as mCpGs in higher-sampled mQTL datasets20,23,33 (Extended Data Fig. 5), indicating that mQTL profiling across multiple tissues with high-coverage arrays unveils a substantial amount of mQTLs missed otherwise.
However, mQTL discovery, tissue-specificity and eQTL-contrasting patterns presented herein are subjected to experimental design limitations (Supplementary Note); for example, the number of mCpGs detected per tissue, and the abundance of tissue-specific mCpGs, are strongly correlated with per-tissue sample size (Spearman’s rho > 0.80).
Functional mechanisms that drive genetic regulation of DNAm differ from gene expression
Molecular mechanisms underlying interindividual DNAm variation are known to exist45–48, but their role in mQTLs, and overlap with eQTLs, is not fully characterized. To compare the molecular mechanisms of detected mQTLs relative to eQTLs, we integrated annotation of CGIs, genomic functional elements and chromatin states (Supplementary Table 4) and performed within- and meta-tissue enrichment analyses (Methods). We observe that, in contrast with eQTLs, the detected mQTLs are more likely to reside in regulatory regions that appear inactive in the mQTL-mapping context analyzed herein (Extended Data Fig. 6), in line with whole-genome mQTL studies 44 reporting that most mQTLs are located in quiescent genomic regions. Although both eQTLs and mQTLs are enriched in gene regulatory regions (Fig. 2c), only eQTLs are enriched in CGIs and gene transcripts, particularly in splicing and untranslated exon regions (UTRs), as previously described4. Conversely, detected mQTLs are depleted from CGIs and genes, as previously observed in blood21,31,34, but are strongly enriched in distal enhancers and putative insulators (Fig. 2c).
QTLs often originate from transcription factor (TF) binding alterations to TF binding sites (TFBSs)49. mQTLs can impact methylation of nearby CpGs by directly altering TF occupancy or by altering TF binding and mediating recruitment of TET1 and DNMT3A enzymes8,25,28,32,50,51, and several TFs have been associated with mQTLs8,50. Yet, the contribution of mQTL- relative to eQTL-associated TFBSs is not well characterized. To further characterize putative mQTL and eQTL TFBS, we integrated chromatin immunoprecipitation with sequencing-derived annotation of TFBSs corresponding to 339 TFs. We identified 126 TFBSs significantly enriched (FDR < 0.01, OR > 1) in eQTLs or mQTLs (Supplementary Table 4). We observed a distinctive TFBS enrichment profile for mQTLs compared to eQTLs. The eQTL enrichments with the smallest P values across tissues correspond to TFs involved in basal transcription (for example, RNA Polymerase II genes). In contrast, mQTLs were enriched, among other TFBSs, in binding sites of steroid receptors (for example, ESR1 and NR2F2) and other proteins known to be involved in 3D organization of the genome (for example, ZNF143) (Supplementary Table 3 and Fig. 2d).
Altogether, these results suggest that mQTLs and eQTLs, in part, differ in their underlying biological mechanisms, driven by distinct sets of TFs. Although eQTLs tend to result from variants residing in gene bodies and regulatory elements, mQTLs result in part from variants altering nongenic, distal regulatory elements, including insulators and elements bound by proteins involved in chromatin spatial conformation and long-range interactions.
Genetic co-regulation of DNAm and gene expression is relatively scarce
Given their divergent genomic enrichment profiles, it is expected that mQTLs and eQTLs are driven, in part, by different causal variants. To identify eQTL-mQTL pairs (e/mQTL) likely to share a common putative causal variant, we performed e/mQTL colocalization, and observed that the proportion of detectable e/mQTL colocalizations is moderate (Fig. 2e), as only 21% of mQTL loci are suggestively colocalized (PP4 > 0.5) with at least one eQTL. Despite limitations in accurately estimating this fraction, our results indicate that a considerable fraction of detected mQTLs do not show clear tissue-matching associations with local gene expression, as previously observed20,23,32.
Genetic regulation of DNAm is characterized by molecular regulatory pleiotropy
Given that correlated methylated CpGs tend to be close together52, a genetic variant influencing DNAm in cis is expected to display molecular pleiotropy as it often impacts multiple CpGs53. To characterize the molecular pleiotropic nature of mQTLs, we quantified the number of mCpGs and eGenes involved in mQTL-eQTL colocalizations (Methods). Overall, we observe pervasive pleiotropy; the majority (78%) of colocalized eQTLs-mQTLs impact multiple mCpGs, and a considerable minority (28%) impact multiple eGenes (Extended Data Fig. 7). The largest pleiotropic set, identified in ovary, is led by variant rs6433571 and involves 114 mCpGs and 8 eGenes in the HOXD gene cluster region (Fig. 3a), associated with epithelial ovarian cancer54. This pleiotropic effect is not driven by ovary-specific gene expression (Fig. 3b) but by ovary-specific genetic regulation of DNAm and expression (Fig. 3c,d). By means of QTL-GWAS colocalization, we identified 112/114 mCpGs and 7/8 eGenes as significantly (PP4 > 0.5) colocalized with ovarian cancer risk (Supplementary Table 5), including the HOXD1 and HOXD3 genes which have a suspected role in genetic risk of ovarian cancer55,56, as well as less characterized genes, for example HAGLR. Together, these findings illustrate how genetic variants can modify the DNAm landscape in a long-range and tissue-specific manner, with coordinated changes in gene expression and implications for disease risk.
Fig. 3 |. Characterization of HOXD-locus e/mQTL pleiotropy in the ovary.
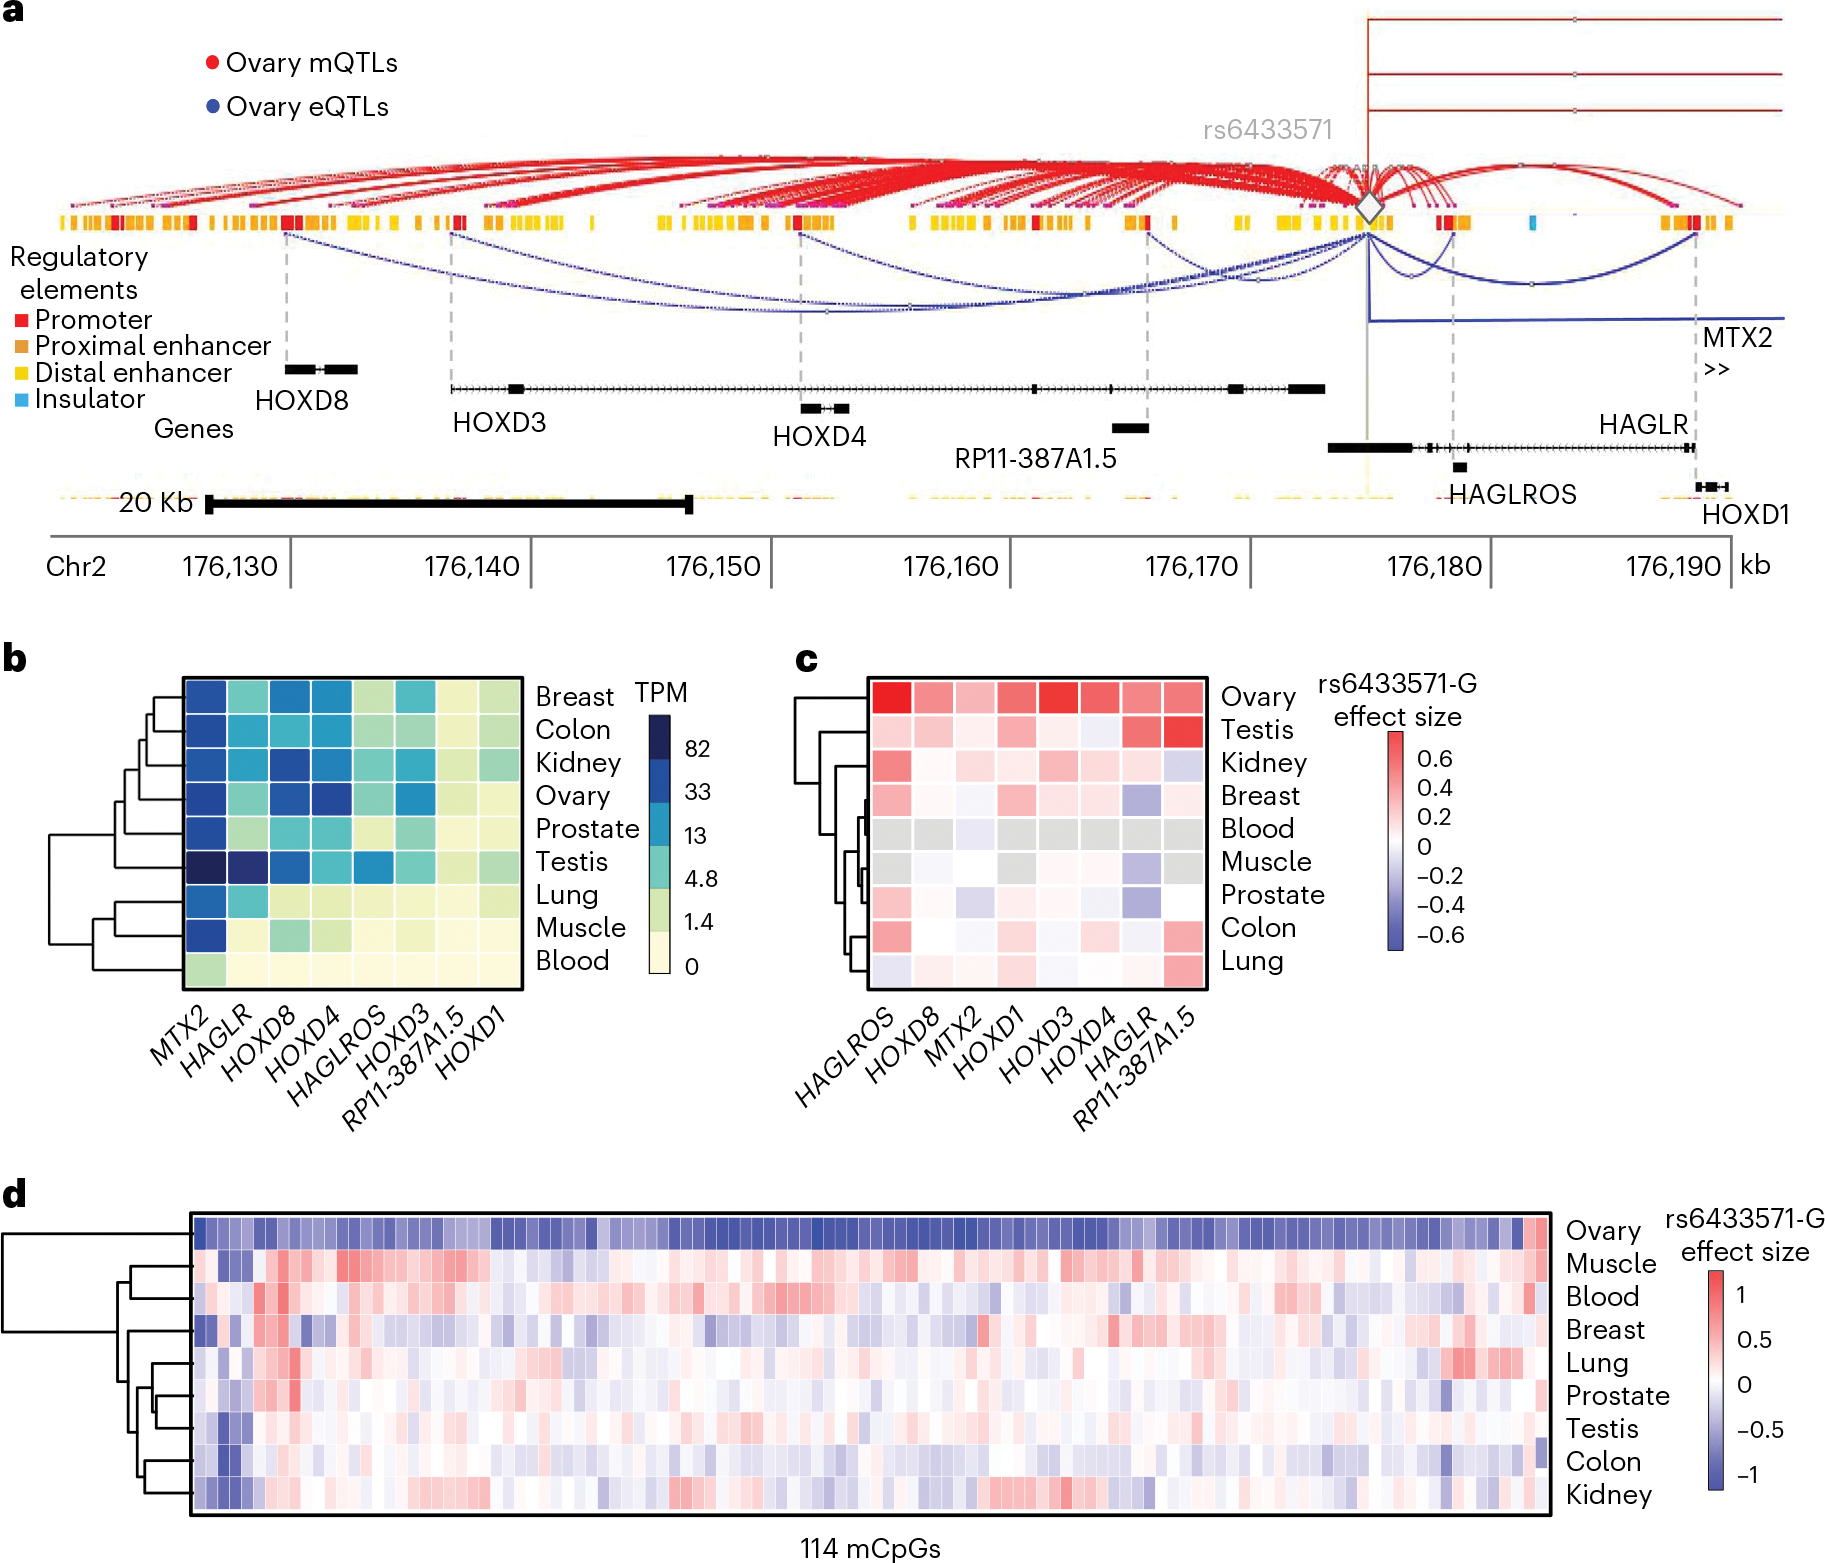
a, Ovary-tissue mQTL and eQTL landscape for HOXD locus. Variant rs6433571 (diamond) impacts multiple mCpGs (red lines) and eGenes (blue lines). Rectangular lines indicate distal eGenes not shown. Regulatory element annotations correspond to ENCODE candidate cis-regulatory elements (cCREs); promoters are shown in red, proximal and distal enhancers in orange and yellow, respectively, and CTCF-only regions (putative insulators) in blue. Dashed and solid gray lines correspond to gene transcription start sites and variant rs6433571 location, respectively. b, Cross-tissue expression levels, in transcripts per million (TPM), of eGenes in the HOXD locus identified in ovary tissue. c,d, QTL effect size of variant rs6433571 minor allele G on HOXD-locus eGenes (c) and mCpGs (d) per tissue. Gray cells in panel c correspond to genes below the expressed threshold in a particular tissue, hence not tested for eQTL signal. For panels b–d, complete-linkage hierarchical clustering based on Euclidean distance was performed for tissues and molecular phenotypes.
Genetic regulation of DNAm impacts complex trait associations extensively
Although most mQTLs do not clearly impact human traits33, multiple studies have provided evidence that a small fraction of mQTLs are associated with human phenotypes and can point to causal disease-relevant pathways and contexts18–21,33,57,58. To evaluate the impact of mQTLs on traits in a systematic manner, and compare their effects to those of eQTLs, we performed QTL-GWAS colocalization by integrating FDR < 0.05 QTLs with 83 GWAS datasets that had at least one QTL-overlapping GWAS hit (P < 5 × 10⁻⁸). To account for decreased mapping power but larger genome-wide abundance of mQTLs compared to eQTLs44, we estimated priors empirically and used a robust multi-method approach (Extended Data Fig. 8).
Across all GWASs, tissues and QTL types, we identified a total of N = 12,922 significant (regional colocalization probability > 0.3 and PP4 > 0.3) QTL-GWAS colocalizations (named simply ‘colocalizations’; Supplementary Table 5). We observed that mQTL colocalizations were more abundant than eQTL colocalizations for almost all (91%) of GWASs (Fig. 4). Alike observations from other studies20,21,57, the observed overlap between eQTL- and mQTL-GWAS colocalizations is moderate, with 27% (749/2,734) of GWAS hits colocalizing with both QTL types in the same tissue (e/mQTL-shared), 55% of hits colocalizing with at least one mQTL but with no eQTLs (mQTL-specific) and 18% of hits colocalizing with at least one eQTL but with no mQTLs (eQTL-specific). The larger fraction of mQTL-specific colocalizations is consistent across trait groups (Extended Data Fig. 9a). These results highlight the importance of integrating different types of -omics data from different tissue sources, and considering secondary QTL signals, to maximize the possibility of identifying molecular links to inheritable traits.
Fig. 4 |. Colocalization of mQTLs and eQTLs with GWAS traits.
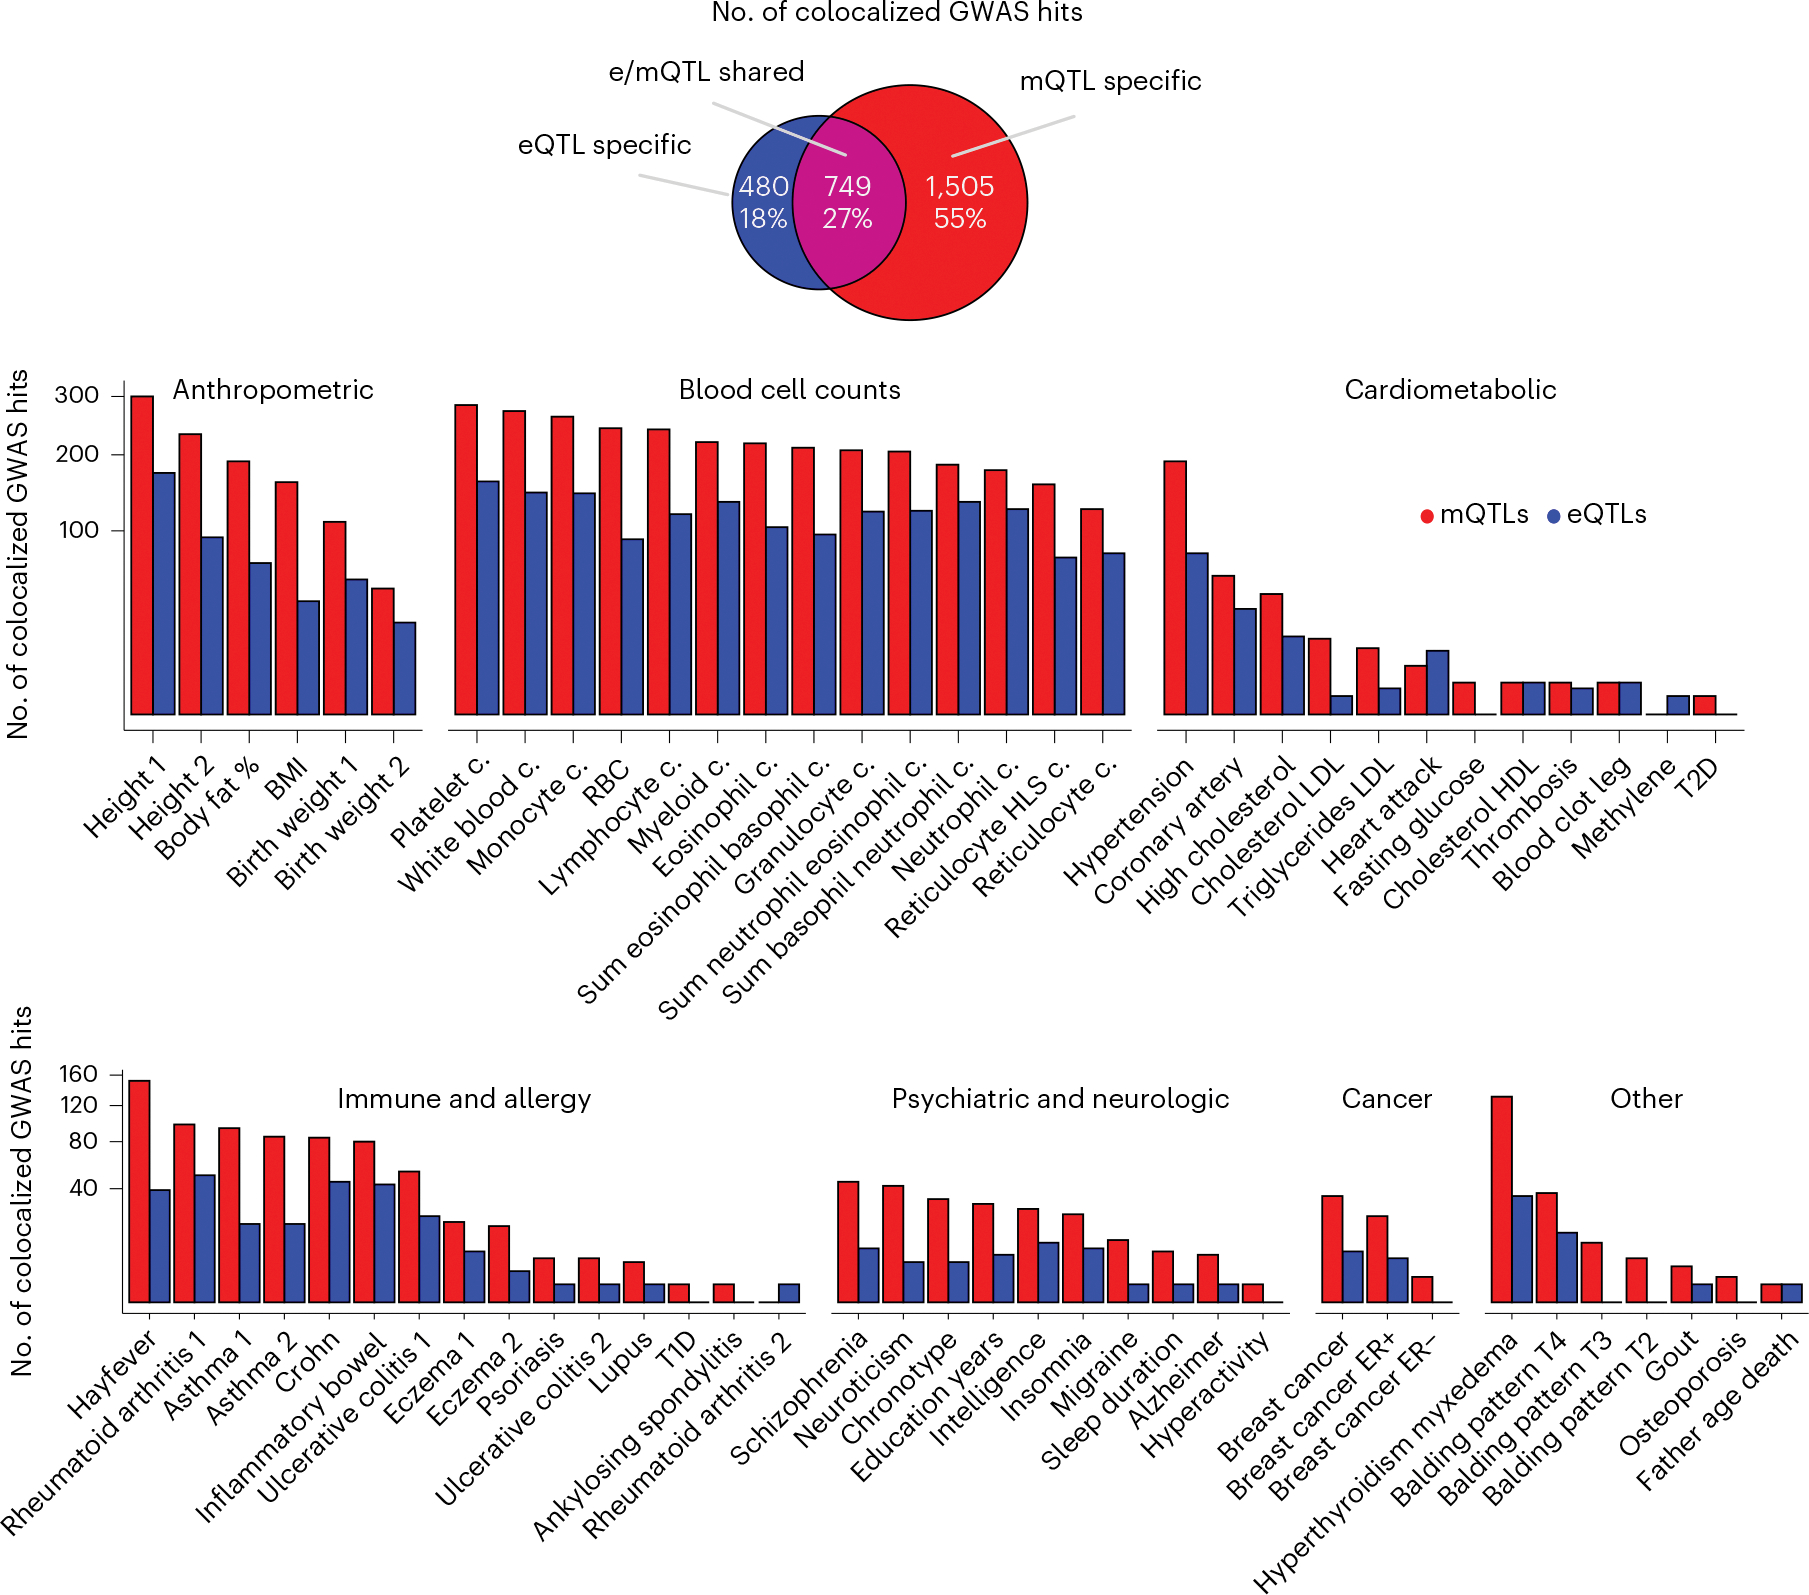
Venn Diagram represents the overlap between colocalized GWAS hits per QTL type. Bar plot represents the number of colocalized GWAS hits (y axis, square-root transformed) per GWAS trait (x axis), trait class and QTL type. BMI, body mass index; c., cell count; LDL, low-density lipoprotein; HDL, high-density lipoprotein; RBC, red blood cell; T1D, type 1 diabetes; T2D, type 2 diabetes; ER, estrogen receptor.
Genetic regulation of DNAm facilitates the fine-mapping of trait-associated variants and characterization of regulatory mechanisms
Among mQTL-specific colocalizations, we identified ovary-specific mQTL associations (rs2853669-cg07380026 P = 6.7 × 10⁻¹³, rs10069690-cg03935379 P = 5.0 × 10⁻⁵) colocalized with two breast cancer GWAS signals in the TERT locus (Fig. 5a,b), possibly impacting TERT. However, TERT expression is mostly undetectable in adult tissues but high in tumors. The locus harbors multiple independent variants associated with several types of cancer risk59. Another example of a mQTL-specific colocalization is an ovary-specific, secondary mQTL association (rs7161194-cg05029961, P = 8.0 × 10⁻¹⁵) that colocalized with a body mass index GWAS signal in the microRNA-rich MEG9 locus (Fig. 5c), for which colocalization could not be identified considering the primary mQTL signal. The mVariant rs7161194 affects cis-microRNA expression60.
Fig. 5 |. Examples of trait-linked e/mQTLs.
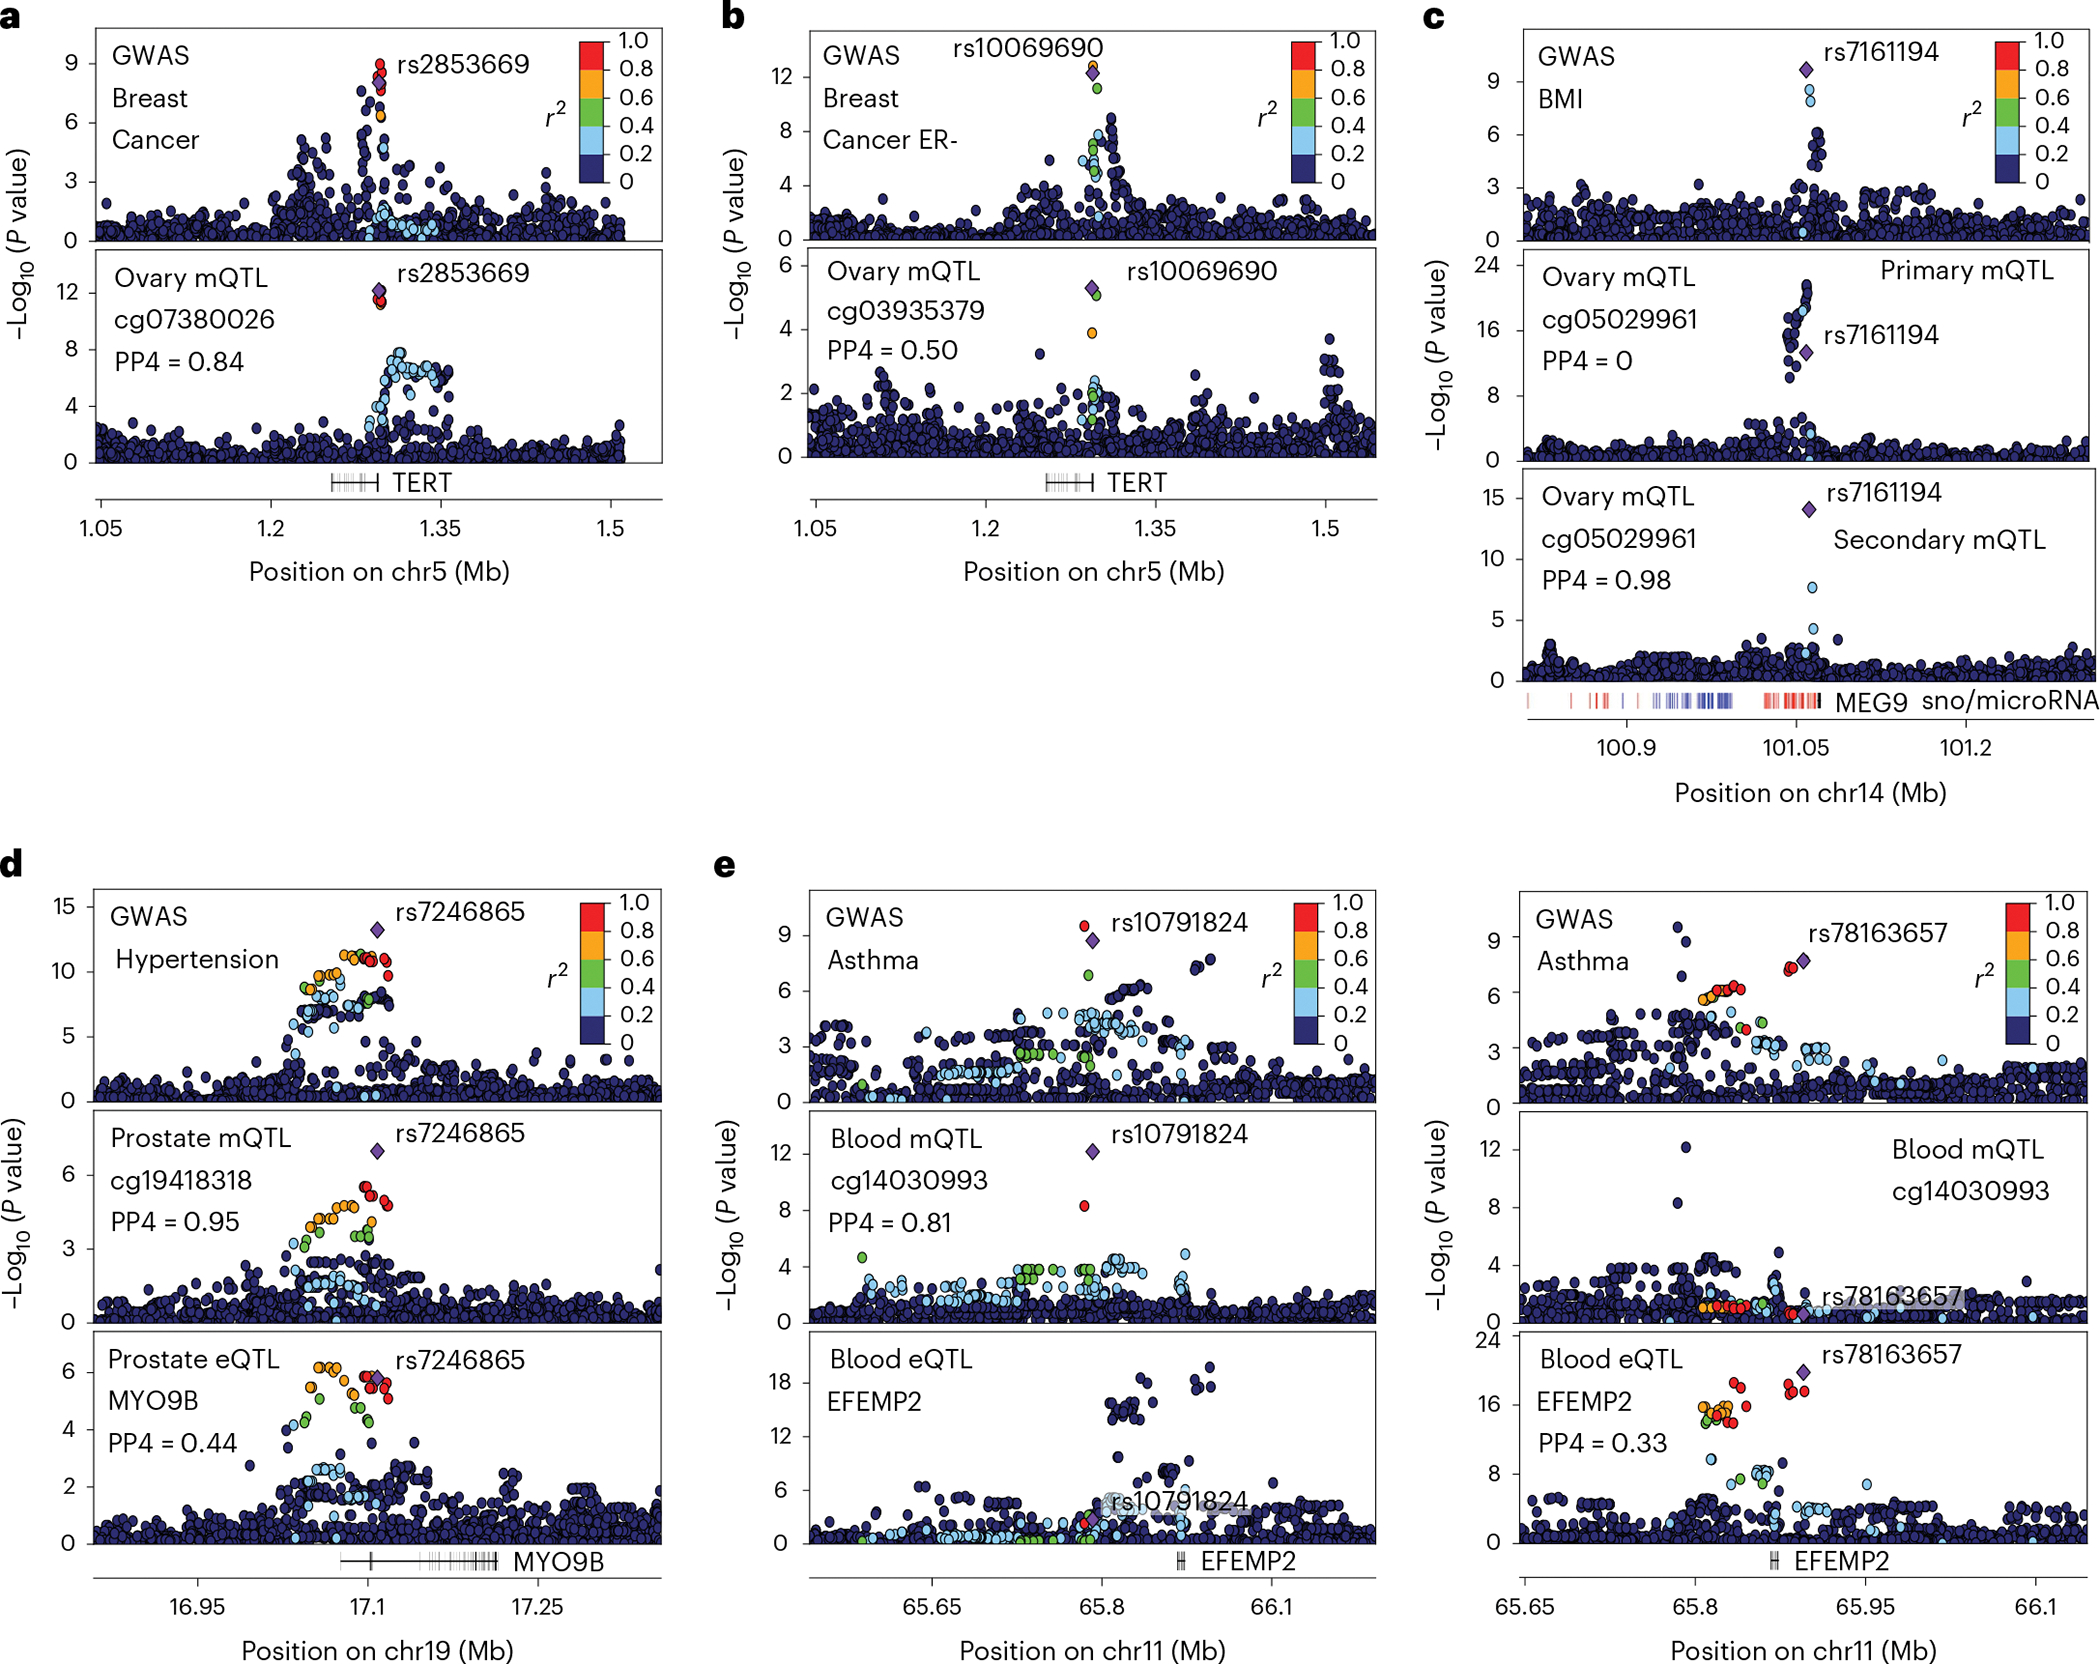
a,b, Genotype-phenotype association P values in the TERT locus for breast cancer GWASs (top panel) and mQTL signal in ovary (bottom panel). c, Genotype-phenotype association P values of the MEG9 locus. Panels illustrate GWAS signal for body mass index (top), cg05029961 primary (middle) and secondary (bottom) mQTL signal in ovary tissue. Secondary mQTL association was obtained adjusting for the top significant variant of primary mQTL signal. Small nucleolar RNA loci (snoRNAs) and microRNA loci are depicted in blue and red, respectively. d, Genotype-phenotype association P values of the MYO9B locus. Panels illustrate GWAS signal for hypertension (top), cg19418318 mQTL signal (middle) and MYO9B eQTL signal (bottom) in prostate. e, Genotype-phenotype association P values of the EFEMP2 locus. Top panels illustrate primary (left) and secondary (right) GWAS signals for asthma. Middle and bottom panels illustrate cg14030993 mQTL and EFEMP2 eQTL signal respectively. For all panels, top GWAS-colocalized e/mQTL is typed in bold, linkage disequilibrium between loci is quantified by squared Pearson coefficient of correlation (r2), and colocalization probability (PP4) of mQTL with GWAS signal is shown. In panels a, c and d, the diamond-shaped point represents the top significant mQTL variant; in panel b, it represents the top significant secondary QTL variant; in panel e, it represents either the top significant mQTL (left) or eQTL (right) variant. P values correspond to nominal GWAS or QTL associations, derived from multiple regression two-sided t-tests.
For 19% (144/749) of the colocalized e/mQTL-GWAS shared loci, the mQTL-GWAS association shows greater colocalization probability than the eQTL-GWAS association in at least one tissue and/or independent QTL colocalization. We observe multiple instances where the lead e/mQTL variants are in low/moderate linkage disequilibrium and the mQTL mirrors the GWAS association substantially more optimally than eQTL does, as in the hypertension-associated MYO9B locus (Fig. 5d). We also observe cases where the GWAS locus harbors association signals compatible with the existence of multiple independent potentially causal variants, where GWAS colocalization with eQTLs and mQTLs contributes to differentiate and characterize these independent variants by their distinct colocalization patterns, as in the EFEMP2 locus linked to asthma (Fig. 5e). Together, these results provide evidence that integration of e/mQTL-GWAS colocalization signals can aid the fine-mapping of trait-associated variants and better characterize the molecular mechanisms underlying complex traits, as shown2,61,62.
Trait-linked mQTLs exhibit molecular regulatory pleiotropy and enrichment in trait-relevant tissues
Identification of QTL associations with traits in relevant tissues can provide insight into their underlying genetic and molecular mechanisms6. By analyzing the observed proportions of mQTL-GWAS colocalizations per tissue, we identified 18/65 traits with a disproportionate (test of equal proportions FDR < 0.05) amount of colocalizations in at least one tissue (Fig. 6a). Overall, the tissue with the largest proportion of colocalizations per trait matched the prior given current biological knowledge. For instance, blood clot and cell count traits were enriched in colocalizations derived from whole blood mQTLs, and breast cancer was nominally (Fisher’s exact test P = 0.02) enriched in breast-derived mQTLs. For traits where the observed tissue link is less obvious, the observed enrichment can be spurious or it could point to an uncharacterized role of a specific tissue in the trait’s biology. Together, these results suggest that mQTLs are potentially informative of complex traits’ relevant tissues and can thereby aid the characterization of trait etiology, as observed for eQTLs5–7. However, this scenario should be reevaluated with a mQTL catalog based on larger sample sizes and covering a wider range of potentially causal tissues
Fig. 6 |. Characteristics of trait-linked mQTLs.
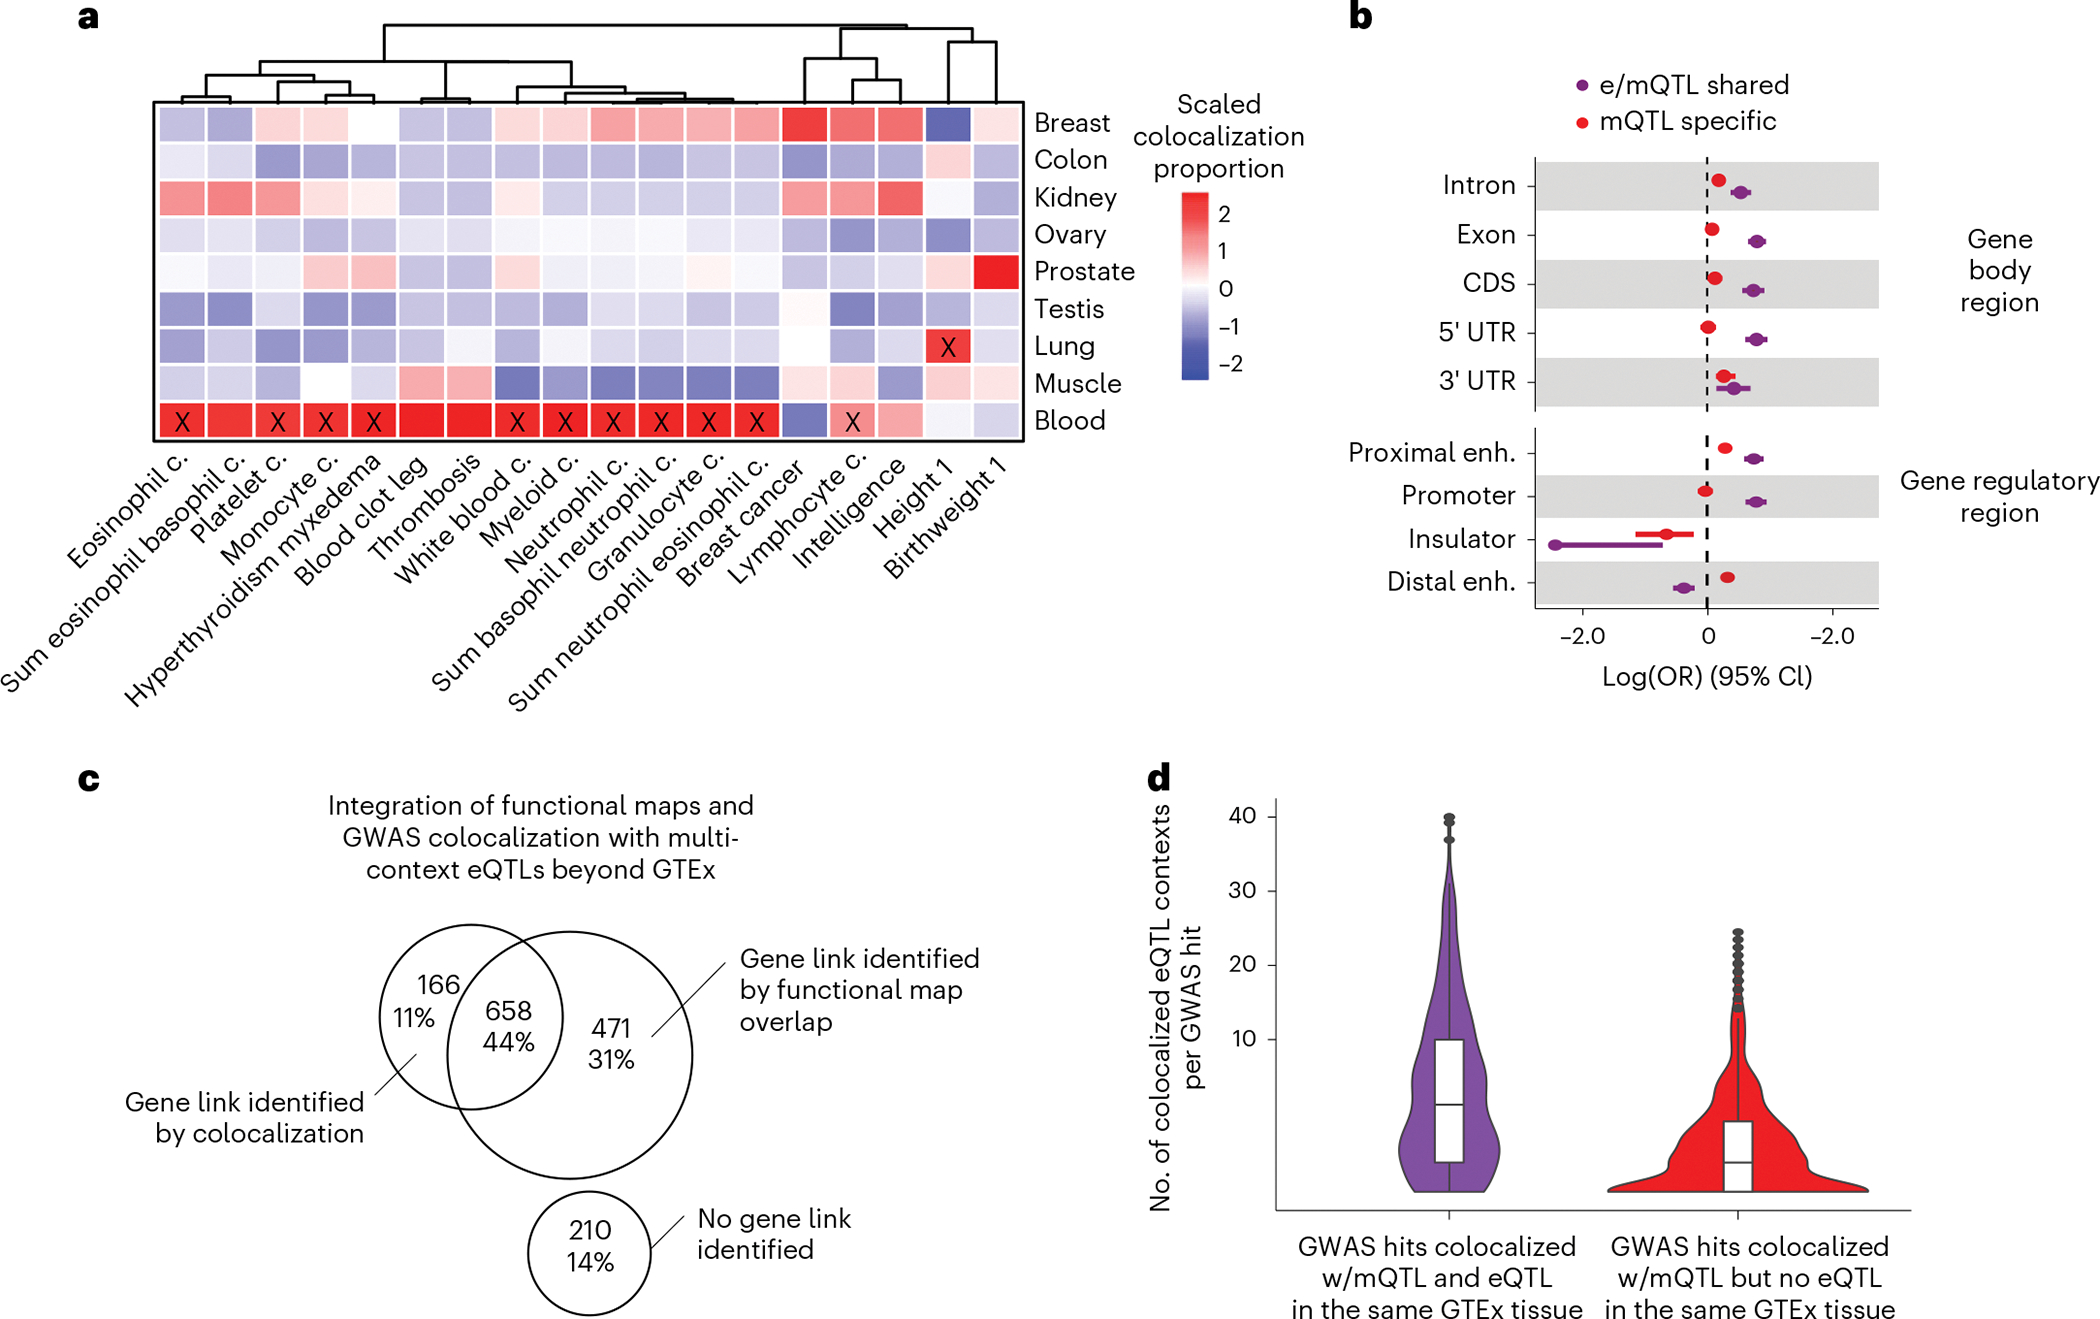
a, Proportion of colocalized mQTLs with GWAS hits per tissue (y axis) and GWAS trait (x axis) scaled by GWAS trait. GWAS traits are clustered by trait-wise scaled colocalization proportion values. Significant (Fisher’s two-sided exact test Bonferroni-corrected P < 0.01) tissue-trait enrichments are labeled with a black cross. b, Trait-linked mCpG enrichment (x axis) in gene body regions and candidate cis-regulatory elements, stratified by QTL-GWAS colocalization group (Fig. 4). Enrichment values correspond to maximum-likelihood estimates of the OR, derived from N = 270,783 trait-association tested mCpGs, and whiskers represent the 95% confidence interval of the enrichment value. enh., enhancer. c, Venn diagram represents overlap between GWAS hits with absence or presence of identified gene links by integrative approach. Analyzed GWAS hits were derived from the previous pairwise colocalization approach, considering mQTL-specific loci, that is mQTL-GWAS colocalizations in absence of eQTL-GWAS colocalization in the same GTEx tissue source (Fig. 4). d, Number of eQTL contexts/catalogs per eQTL-mQTL-GWAS-colocalized cluster (y axis, square-root transformed) derived from the multivariate colocalization approach considering 61 eQTL contexts/catalogs beyond GTEx (Methods). Observations are stratified by QTL-GWAS colocalization group derived from the previous pairwise colocalization approach, that is mQTL-GWAS colocalizations in presence (e/mQTL shared) or absence (mQTL specific) of eQTL-GWAS colocalization in the same GTEx tissue source (Fig. 4).
It is expected that many QTLs that impact traits do so by exhibiting molecular regulatory pleiotropy (that is, altering multiple molecules and/or molecular phenotypes). It has been shown that eQTLs where the lead eQTL variant (eVariant) regulates multiple eQTL genes (eGenes) are more likely to yield a trait association than eQTLs that regulate a single eGene4. However, the effect that regulatory pleiotropy plays in mQTL-trait associations has not been extensively characterized. Here, we observe that mQTL-GWAS colocalizations are enriched in mVariants regulating multiple, as opposed to single, mCpGs (OR = 2.65, Fisher’s exact test P < 2.2 × 10⁻¹⁶). Among trait-linked mCpGs that colocalize with at least one eGene, we observed enrichment (OR = 1.40, P = 6.3 × 10⁻⁸) for trait colocalizations involving multiple mCpGs and eGenes (tier 4 in Extended Data Fig. 7a), as in HOXD locus (Fig. 3a). These results suggest that mQTLs that exhibit regulatory pleiotropy have increased probability of impacting a complex trait.
Trait-linked mQTLs are preferentially located in regulatory regions and exhibit decreased methylation
To better understand the DNAm features that contribute to mQTL impact on traits, we characterized DNAm levels of trait-linked mCpGs and their overlap with open chromatin regions. Compared to mCpGs without identifiable trait links, we observe an enrichment (Fisher’s exact test P < 2.2 × 10⁻¹⁶, OR = 1.50) of trait-linked mCpGs in open chromatin regions; with which 53% (1,791/3,381) of trait-linked mCpGs overlap, with e/mQTL-shared GWAS-colocalized loci exhibiting a stronger enrichment (OR = 1.96) compared to mQTL-specific loci (OR = 1.36). Trait-linked mCpGs tend to have lower DNAm levels compared to trait-agnostic mCpGs (Wilcoxon rank-sum test P < 0.05), whereas trait-linked eGenes tend to be highly expressed (Extended Data Fig. 9b). These results suggest that genetically regulated DNAm loci that play a role in trait etiology tend to correspond to lowly-methylated CpG sites in active chromatin regions.
Typically, variants contributing to the genetic basis of a trait are thought to act by affecting gene regulation. Concordantly, we observe an enrichment (Fisher’s exact test P < 0.05) of trait-linked mCpGs in gene regulatory elements (OR = 1.63, P < 2.2 × 10⁻¹⁶), compared to mCpGs without an identified trait link; 71% (2,390/3,381) of trait-linked mCpGs fall into this category. However, mCpGs corresponding to mQTL-specific colocalizations show a different profile compared to e/mQTL-shared colocalizations (Fig. 6b). Although e/mQTL-shared GWAS-colocalized mCpGs are depleted in distal enhancers (OR = 0.68) and enriched in gene body element regions (OR = 1.54–2.22), promoters (OR = 2.19) and proximal enhancers (OR = 2.12), mQTL-specific GWAS-colocalized mCpGs are enriched in both proximal (OR = 1.36) and distal (OR = 1.39) enhancers, but not in promoters, in line with previous observations23. Our results suggest that distal regulatory elements play an important role in DNAm impact on genotype-phenotype associations.
Integration of trait-linked mQTLs with functional annotation enables identification of candidate causal genes
We detect a considerable amount of GWAS hits colocalizing with at least one mQTL but with no eQTLs (Fig. 4). To identify candidate causal genes for such loci, we integrated mQTL-specific trait-linked mCpGs with functional maps, that is curated promoter- and enhancer-gene target predictions63,64 and eQTM associations generated herein. This set of mCpGs is enriched (Fisher’s exact test P < 2.2 × 10⁻¹⁶, OR = 1.64) in gene links; 68% (1,308/1,911) of mCpGs are eCpGs and/or colocate with enhancers (Supplementary Table 7). Among highly supported loci (≥3 mCpG-gene links), we identify well-known gene–trait relationships, including APOB with cholesterol and ABO with blood traits. We also identified gene–trait links that are less characterized, such as RUNX1 with asthma and TMEM72 with red blood cell counts, with biological evidence compatible with predicted trait links (Supplementary Note). This strategy enabled the identification of candidate causal gene links for 1,129 GWAS loci (Fig. 6c). Overall, combining mQTL with functional maps strengthens evidence for already proposed trait-linked genes and prioritizes candidates for less characterized loci.
To further identify trait–gene links, we jointly modeled GWAS, mQTL and eQTL signal across 61 multi-context eQTL maps derived from tissue and cell types across contexts not profiled in GTEx eQTL maps, including induced pluripotent stem cells and stimulated immune cells (Methods). We identified e/mQTL-GWAS colocalized clusters (PR > 0.8, PP > 0.5) for 56% (824/1,461) of loci previously identified as mQTL-specific when only considering GTEx matching-tissue eQTLs (Fig. 6c and Supplementary Table 7). Clusters that lacked e/mQTLs colocalizations in the same tissue type tend to be present in relatively few eQTL contexts (Fig. 6d), potentially reflecting more spatiotemporally-specific trait-impacting regulatory events. Among identified context-specific colocalized eGenes (Supplementary Note), CLPTM1L (in adipose tissue) and TERT (in induced pluripotent stem cells) eQTLs colocalize with different GWAS signals for breast cancer subtypes (Extended Data Fig. 10), compatible with a putative causal TERT expression link hypothesized for this locus and trait (Fig. 5a). Our results illustrate the value of the mQTL-trait maps generated herein, integrated with additional functional genomic and multi-context eQTLs maps, to facilitate the identification of trait-linked candidate genes.
Discussion
Most prior studies that have characterized DNAm in relation to gene expression patterns have focused on blood cells25,40, with some exceptions20. In contrast, our study has characterized the genome-wide DNAm profile of diverse, healthy human tissue types in a systematic manner. In line with prior studies20,65, we observe that the aggregated contribution of mQTLs to human traits, in terms of number of identifiable associations, is larger than eQTLs, despite mQTLs being derived from substantially smaller sample sets. Consequently, we demonstrate that mQTLs can reveal a substantial number of molecular links to traits otherwise missed by eQTL-GWAS colocalization approaches. For these cases, mQTLs provide evidence of regulatory mechanisms underlying GWAS findings in absence of eQTL-based links to specific genes, and can pinpoint putative candidate genes. Our results indicate that in addition to expression and protein QTLs66, systematic integration of trait-linked mQTL associations with functional genomic maps can help guide the design of variant-to-function studies for complex traits.
The lack of observed eQTLs for mQTL-specific GWAS colocalizations raises questions about how genetically regulated DNAm impacts trait-related biology. It is possible that DNAm-phenotype links involve additional molecular phenotypes other than gene expression67. However, our results suggest that eQTLs explain a substantial fraction of the missing links. That is, genes with low expression levels in bulk tissue or weak eQTL signal, as well as context-specific eGenes, are only revealed as eGenes for DNAm-trait linked loci when considering eQTL maps across multiple, distinct contexts (other than bulk tissue samples from adult nondiseased donors). Hence, we conclude that generally, trait-associated variants are more likely to result in detectable changes to DNAm than gene expression. In that sense, we highlight the usefulness of mQTL maps to proxy ‘elusive’ disease-associated eQTLs68, like in69. Taken together our results emphasize, supported by the trait-linked regulatory pleiotropy patterns observed, the importance of integrating multiple -omics, and the particular relevance of multi-tissue mQTL maps, to pinpoint molecular links and candidate genes to traits.
Importantly, maps of eQTMs, mQTLs and mQTL-GWAS links provided here are not comprehensive due to limited power, biased (gene-centric) set of CpG sites surveyed and lack of cellular resolution in these complex tissues (Experimental design limitations, Supplementary Note). The active versus passive role of DNAm variant-trait links32, and vertical versus horizontal pleiotropy scenarios70, are not resolved. In future studies, whole-genome bisulfite sequencing44 and single-cell DNAm profiling71 can contribute to address these limitations, and the active role of DNAm on corresponding gene targets can be interrogated with recently developed CRISPR-derived experimental approaches72. Larger GTEx DNAm cohort sample sizes would enable tissue-specific trans-mQTL mapping and further contribute to linking mCpGs to phenotypic variation, as observed in blood trans-mQTL studies34,73.
Altogether, the dataset generated herein constitutes the largest cohort with multi-tissue DNAm data generated to date. It allows for integrative -omics analyses by enhancing existing transcriptome-, epigenome- and proteome-based GTEx datasets4,39,74,75 and provides the research community with a valuable resource to investigate the inherited susceptibility to human disease and complex traits from both cross-tissue and multi-omics perspectives. Our results contribute to a better understanding of the human DNA methylome and its relationship with both the transcriptome and complex traits.
Methods
Sample collection and ethical approval
The GTEx research protocol was reviewed by Chesapeake Bay Review, Roswell Park Comprehensive Cancer Center’s Office of Research Subject Protection and the institutional review boards at the University of Pennsylvania. Informed consent, standards and protocols for optimizing postmortem tissue collection and donor recruitment are detailed elsewhere76. Families of participant donors were not compensated. Analyses of GTEx DNA samples at the University of Chicago were not considered human subjects research by the institutional review board at the University of Chicago, because only deidentified data on deceased individuals were involved.
Statistics and reproducibility
No statistical method was used to predetermine sample size, as for each DNAm profiled tissue, sample size was chosen based on availability of biosamples. Samples were randomly allocated in plates; tissue types were not batched by plate. The experiments were not randomized. The investigators were not blinded to allocation during the experiments and outcome assessment, because the data are not from controlled randomized studies. We used all data passing standard quality controls (QCs), resulting in 987 samples. Details of data exclusions are available in ‘Generation of epigenome-wide DNAm methylation (DNAm) data’. For all the boxplots, horizontal lines inside the boxes show the medians. Box bounds show the lower quartile (Q1, the 25th percentile) and the upper quartile (Q3, the 75th percentile). Whiskers are minima (Q1 − 1.5 × IQR) and maxima (Q3 + 1.5 × IQR), where IQR is the interquartile range (Q3–Q1). Outliers are shown in the boxplots. Enrichment values corresponding to variant enrichment in functional annotations were estimated by maximum likelihood estimation with torus, from full summary QTL statistics. Odds ratio values derived from 2 × 2 contingency tables, and corresponding significance, were estimated with the R base function fisher.test. Enrichment across tissues was evaluated by modeling single-tissue enrichment estimates with a random-effects model with the R function metafor::rma. Further details are available in the corresponding Methods section.
Acquisition and processing of genomics data
Gene regulatory element annotations were derived from ENCODE Encyclopedia version 5 (ENCODE5) predicted cCRE catalog, including distal enhancers [ENCFF535MKS], proximal enhancers [ENCFF036NSJ], promoter-like regions [ENCFF379UDA] and putative insulators [ENCFF262LCI], where [${id}] corresponds to ENCODE5 file id from https://www.encodeproject.org/. Putative insulators are defined herein by CTCF binding sites77 unrelated to enhancers, promoter-like regions and DNase-H3K4me3 marks. Gene body annotations were obtained from GENCODE version 26 website (https://www.gencodegenes.org/human/release_26.html). Genomic variant annotations were derived from Ensembl build 102 Variant Effect Predictor cache (ftp://ftp.ensembl.org/pub/release-102/variation/indexed_vep_cache/homo_sapiens_vep_102_GRCh38.tar.gz). Different annotations were collapsed: splice region, acceptor and donor sites were collapsed to ‘splice site’ and coding sequence sites to ‘CDS’. Open chromatin annotations derived from DNase-seq were obtained from ENCODE project version 5 website (https://www.encodeproject.org/). DNase-seq profiles of adult individuals matching tissues analyzed herein were selected, including breast [ENCFF788BHK], colon transverse [ENCFF903WEH], kidney [ENCFF407WZV], lung [ENCFF886KAA], muscle [ENCFF983ONG], ovary [ENCFF500HAK], prostate [ENCFF557QYU] and testis [ENCFF761JZU]. Chromatin state predictions corresponding to an 18-state model derived from 6 marks - H3K4me3, H3K4me1, H3K36me3, H3K27me3, H3K9me3 and H3K27ac - were obtained from ROADMAP FTP site (https://egg2.wustl.edu/roadmap/data/byFileType/chromhmmSegmentations/ChmmModels/core_K27ac/jointModel/final/). Chromatin state predictions corresponding to adult individuals’ epigenomes matching tissues analyzed herein were selected, including colonic mucosa [E075], lung [E096], muscle skeletal [E108], ovary [E097] and primary mononuclear cells from peripheral blood [E062]. TF binding annotations were derived from ENCODE version 2 and 3 chromatin immunoprecipitation with sequencing clustered peaks combined from 1,256 experiments, representing 340 TFs in 129 cell and tissue types; obtained from UCSC table browser (http://genome.ucsc.edu/cgi-bin/hgTables, table encRegTfbsClustered, build hg38). CGI predictions were derived from UCSC table browser (http://genome.ucsc.edu/cgi-bin/hgTables, table cpgIslandExt, build hg38). Enhancer-gene predictions were derived from Genehancer predictions from UCSC table browser (http://genome.ucsc.edu/cgi-bin/hgTables, table geneHancerRegElementsDoubleElite, build hg38), and from https://www.engreitzlab.org/resources/ (all element-gene connections with ABC scores ≥ 0.015).
Generation of epigenome-wide DNAm data
Epigenome-wide DNAm was derived from 1,000 tissue samples from 9 unique tissue types obtained from 424 GTEx subjects, mostly (~83%) from European ancestry given available genotype data4 and the majority self-identified as White (Supplementary Table 1). DNA samples were extracted from GTEx tissue samples using Qiagen Gentra Puregene method at GTEx Laboratory Data, Analysis and Coordinating Center (LDACC), and sent to the Institute for Population and Precision Health Laboratory on 96-well plates. Tissue types were not batched by plate. Bisulfite conversion was applied to 500 ng of DNA using EZ-96 DNA methylation kit (Zymo Research). All samples were then prepared and analyzed in accordance with the manufacturer guidelines and protocol for the Infinium MethylationEPIC array (Illumina). Catalog numbers of technologies and reagents udrf are as follows: Infinium Methylation EPIC 96 samples (catalog no. WG-317–1003), Infinium Methylation Assay AMP (catalog no. 15072768), Infinium HD Assay Kit WG-Post1 LV1 (catalog no. 11300771), Infinium Assay Kit Post 2, LMV (catalog no. 15023542), Infinium Assay Kit Single Post 3 LV (catalog no. 15023551), Infinium Assay Kit Post 4 LV (catalog no. 15023544). The MethylationEPIC array was used to measure DNAm levels for 866,895 (867 K) genomic locations, encompassing primarily CpG dinucleotides but also non-CpG sites. For simplicity, we refer to both types of sites as CpGs or CpG sites. Raw DNAm data was processed with ChAMP software78 (v.2.8.6). For sample QC, we excluded (1) three samples with undetectable or missing methylation values (detection P > 0.01) in ≥5% of CpGs and (2) six samples with mismatched sex. For CpG QC, we excluded (1) CpGs that had detection P > 0.01 in ≥1 sample (N = 44,135) and that had a bead count <3 in ≥5% samples (N = 660), (2) cross-reactive CpGs (N = 40,812), (3) variant-overlapping CpGs or within a single base pair extension (N = 7,708) and (4) CpGs mapping to sex chromosomes. For filters 2 and 3, we selected CpG probes identified in Pidsley et al.79 (Tables S4 and S5), where variants were defined at minor allele frequency (MAF) > 5% in 1000 Genomes Project. A total of 754,054 CpGs passed QC, could be mapped and lifted over from GRCh37 to GRCh38 human genome build and were retained for further analysis.
Raw DNAm values were background-adjusted using the single sample normal-exponential out-of-band (ssnoob) method80,81 with dye bias correction implemented in minfi (v.1.36.0). DNAm β values were normalized using the beta mixture quantile (BMIQ) method, implemented in ChAMP v.2.8.6, adjusting for type I/II probe bias82; output β values for each CpG were used in downstream analysis. After normalization, we removed one additional sample with an array-derived genotype profile not matching the whole-genome sequencing (WGS)-derived one. Principal-component analysis was conducted on DNAm β values within each tissue type, and three samples were removed for being outliers with respect to the top five principal components of the corresponding tissue. A total of 987 samples passed final QC and were retained for further analysis.
Estimation of tissue similarity based on DNAm and gene expression
Mean DNAm and gene expression levels for each tissue type were used to calculate tissue distances (1 – Spearman rank-correlation coefficient (Spearman’s rho)) in a pairwise fashion. For DNAm, Spearman’s rho was calculated on the mean DNAm for each CpG (across all samples for a given tissue) in M-value units, and each CpG was weighted by its cross-tissue variance. The entire set of post-QC profiled CpGs (N = 754,054) was considered for the analysis. For gene expression, Spearman’s rho was calculated on the mean expression for each gene (across all samples for a given tissue) in log2(x + 1) transformed transcript per million units, and each gene was weighted by its cross-tissue variance. Only genes expressed in at least one of the nine tissues (N = 37,686) were considered for the analysis. We performed hierarchical clustering of the tissues using pvclust 2.0.0 (ref. 83) with complete linkage and nboot = 1,000.
eQTM mapping
We define an eQTM as the association of CpG DNAm with proximal gene expression, considering a ±1.5 Mb window centered on the CpG locus, thereby enabling the identification of short- and long-range CpG–gene associations. We analyzed samples with available DNAm, expression and genotype data (Supplementary Table 1), comprising a total of 490 samples, from 25 (testis) to 131 (lung) per tissue, excluding kidney cortex due to insufficient sample size (N = 5). We obtained DNAm residuals by regressing DNAm-derived probabilistic estimation of expression residuals (PEER) factors84 used in cis-mQTL mapping (see below) from inverse-normalized-transformed DNAm levels, and gene expression residuals by regressing expression-derived PEER factors used for eQTL mapping in4 from inverse-normalized-transformed gene expression levels. For each CpG site in each tissue, we calculated Spearman correlation of DNAm with gene expression residuals of proximal (±1.5 Mb window) genes. We applied Bonferroni multiple testing correction to nominal P values, accounting for multiple genes tested per CpG. Then, we adjusted for multiple CpGs tested by applying q-value multiple testing correction85 to the set of top Bonferroni-adjusted P values per CpG. We defined significant CpGs involved in eQTMs (eCpGs) at FDR < 0.05, and for those, significant eQTMs were defined at Bonferroni-adjusted P value < 0.05. To overcome QTM-mapping limited power due to per-tissue available sample sizes, we used an approach to perform a cross-tissue QTL analysis by leveraging QTL signal across tissues42, implemented in the R package mashr (v.0.2.6). We assessed eQTM replication for all tissues in the FUSION Skeletal Muscle Study cohort20. Replication was assessed by means of π1, which enables the estimation of the true positive rate of findings derived from a discovery dataset in a replication dataset86. See additional details of eQTM identification and characterization in Supplementary Note.
QTL mapping for methylation and gene expression QTLs (mQTLs, eQTLs)
We define mQTLs as proximal variants (that is, in cis) to a CpG with a significant genotype effect on its DNAm estimates, considering a ± 500 kb window from the CpG locus. To assess mQTLs, we considered quality controlled (QC-ed) inverse-normalized DNAm data, generated and presented here as part of the eGTEx project, and QC-ed genotype data derived from GTEx v84 filtered at variant MAF > 0.01 per tissue. For each variant-CpG pair, we used an adaptation of v.2.184 FastQTL87, available at https://github.com/broadinstitute/gtex-pipeline/tree/master/qtl, to fit a linear regression model (core_PEERs) separately in each tissue, and tested for significance of genotype on methylation estimates while adjusting for additional known and unknown factors:
where is the inverse-normal-transformed DNAm levels, is the intercept and is the corresponding effect size. is the effect size of genotype on DNAm.
represents a subset of covariates that were used in cis-eQTL mapping4. These covariates include five genotype principal components, two covariates derived from the generation of genotype data by WGS and biological sex status. The WGS covariates are described elsewhere4 and represent the WGS sequencing platform (HiSeq 2000 or HiSeq X) and WGS library construction protocol (PCR based or PCR-free).
PEER represents PEER factors84 derived from DNAm. See additional details of PEER generation in Supplementary Note.
We corrected for multiple testing of variants per CpG87 and multiple CpGs tested86, defining significant mQTL CpGs (mCpGs) at FDR < 0.05. A similar approach was used to identify eQTLs. Conditional QTL analysis was used to identify multiple independent mQTLs and eQTLs for mCpGs and eGenes, respectively, as well as corresponding lead variants for each independent QTL locus. This approach accounts for allelic heterogeneity, where distinct genetic variants at a locus simultaneously and independently affect methylation at a given CpG site. For that, we applied a stepwise regression procedure as described elsewhere43 (details can be found in Supplementary Note). Similarly as in eQTM mapping, we used mashr to identify mQTLs and eQTLs detectable after leveraging QTL signal across tissues (Supplementary Note). Across the article, we refer to CpGs and genes with at least one significant mQTL or eQTL as mCpGs and eGenes, respectively, and to mQTL and eQTL significant variants as mVariants and eVariants, respectively. We assessed mQTL replication and/or validation of mQTL tissue-specific patterns for all tissues in the FUSION Skeletal Muscle Study20 (https://www.ebi.ac.uk/birney-srv/FUSION/), the ROSMAP brain23 (http://mostafavilab.stat.ubc.ca/xQTLServe/) and the GoDMC studies33 (http://mqtldb.godmc.org.uk/) (Supplementary Note, Supplementary Table 3).
To evaluate the adequateness of the mQTL mapping model of choice, two alternative mQTL mapping models were benchmarked:
For each model, we assessed the number of significant (FDR < 0.05) mCpGs, the proportion of true positives, and the replication rate in the FUSION cohort. We observe that the chosen model (core_PEERs) outperforms alternative model choices, as it detects on average across tissues 15–230% more mCpGs than the other models tested, with similar replication rates (Supplementary Table 3). See additional details of mQTL and eQTL identification, characterization and validation in Supplementary Note.
QTL enrichment in genomic annotations
Functional enrichment analyses were performed using torus88(v.1.0.0.dev), similarly to GTEx Consortium4. In brief, the command ‘torus -d ${qtl_statistics} -annot ${annotation_file} -est–fastqtl’ was used, where ${qtl_statistics} correspond to QTL-mapping data for eQTLs (full eQTL-tested gene set per tissue) or mQTLs (subset of 21,000 mQTL-tested CpGs), and ${annotation_file} corresponds to QTL-tested annotated variants. Variants were annotated with Ensembl’s Variant Effect Predictor using datasets from several sources: gene regulatory element and open chromatin annotations were obtained from ENCODE5, gene body annotations were obtained from Ensembl, chromatin state predictions from ROADMAP, TF binding and CGI annotations were obtained from UCSC browser (see Obtention and processing of functional genomic data). For each tissue, torus-derived enrichment estimates correspond to point estimates (derived by maximum likelihood estimation) of the log of odds ratio. Enrichment across tissues was evaluated by modeling single-tissue enrichment estimates (log of odds ratio) with a random-effects model (rma function, metafor R package v.2.0.0). Single-tissue and cross-tissue enrichment estimates are provided in Supplementary Table 4.
Colocalization of mQTLs with eQTLs
We investigated the associations between mQTLs and eQTLs by means of QTL effect size colocalization with coloc89 (v4.0.0) using default priors. For each significantly (PP4 > 0.5) colocalized mQTL-eQTL pair in each tissue, the top-colocalized e/mVariant was defined as the one with the largest PP4 value. See additional details of mQTL-eQTL colocalization in Supplementary Note.
Characterization of colocalized mQTL-eQTL loci
Identification of mQTL-eQTL regulatory pleiotropy.
Considering QTLs, we define regulatory pleiotropy as the event of a variant or a set of variants in a QTL region impacting multiple eGenes and/or mCpGs. To characterize the pleiotropic nature of mQTLs, we quantified the number of mCpGs and eGenes involved in loci harboring eQTL-mQTL (e/mQTL) colocalizations, and classified mCpGs involved in at least one significant e/mQTL colocalization (PP4 > 0.50) in four tiers, depending on their mCpG and eGene connectivity level (Extended Data Fig. 6). Of note, no inference of the nature of the pleiotropic effect, whether vertical or horizontal, is made in this classification. Tiers are defined as follows: (a) tier 1: mCpGs that colocalize with a single eGene and vice versa (1:1 connectivity); b) tier 2: mCpGs that colocalize with multiple eGenes, and each one of those eGenes uniquely colocalizes with that single mCpG (1:m connectivity); (c) tier 3: mCpGs that colocalize with a single eGene, which colocalizes with multiple mCpGs (n:1 connectivity); and (d) tier 4: mCpGs that colocalize with a multiple eGenes, where at least one of the eGenes colocalize with multiple mCpGs (n:m connectivity).
Colocalization of QTL with GWAS signal
Colocalization of ovary cancer GWAS with QTL signal of HOXD pleiotropic locus.
We hypothesized that the mCpGs and eGenes in the HOXD region may be linked to ovarian cancer risk and tested it by means of QTL-GWAS colocalization. Ovary cancer GWAS summary statistics90 were obtained from the Ovarian Cancer Association Consortium (OCAC) website http://ocac.ccge.medschl.cam.ac.uk/ and were filtered (not imputed) as in Barbeira et al.5. Considering OCAC GWAS along with QTL statistics from the set of pleiotropic mCpGs and eGenes identified in the HOXD locus (Fig. 3a), we performed colocalization analysis with coloc89 (v4.0.0) using default priors. Considering QTLs statistics, colocalization was performed based on effect size and associated standard error values; P values and corresponding variant MAFs were used for OCAC GWAS data. The probability of one causal variant associated with both traits (PP4) was used to identify significant (PP4 > 0.50) colocalizations.
Determination of GWAS significant loci.
To investigate possible associations between genetically regulated molecular and complex traits, including disease and ‘healthy’ phenotypes, we used GWAS summary statistics of 87 GWASs; data production and QC are described in detail in Barbeira et al.5. We identify significant GWAS hit loci (that is, genomic windows containing GWAS signal) similarly as described in Barbeira et al.5. In brief, the GWAS summary statistics were split into 1,702 approximately linkage disequilibrium-independent regions91 (Supplementary Table 5). Each region was categorized as a significant GWAS hit locus (GWAS hit) provided it encompassed a non-imputed GWAS significant (P < 5 × 10⁻⁸) variant.
Determination of QTL-GWAS significant loci.
For each GWAS and each QTL tissue pair, colocalization was performed with coloc (v.4.0.0) and fastenloc (v.1.0). The latter is an improved version of enloc92 and was recently described in multiple studies93,94.
coloc approach.
For each GWAS, at each GWAS locus, we identified overlapping (>1 bp) mCpG loci from each of the 9 analyzed tissues, considering per-tissue significant (FDR < 0.05) mCpGs resulting from the single-tissue QTL-mapping approach. For each overlapping mCpG-GWAS region pair, we applied coloc89 to mQTL along with GWAS summary statistics. For mCpGs with secondary QTLs, that is multiple independent mQTLs, conditional - to independent lead mVariants - QTL signals were also tested for colocalization. By this, we prevent putative colocalizations to be missed or miscalculated, as coloc assumes a single variant to be causal of QTL-GWAS effects94. Prior probabilities of a variant yielding (a) a mQTL association (p2), (b) a GWAS association (p1) and (c) a mQTL and a GWAS association (p12) were estimated from fastenloc enrichment values in an analogous manner as done with enloc in5 and provided in Supplementary Table 6. Only the regions with at least 50 variants in common between the GWAS and mCpG loci were tested for colocalization. Both for QTLs and GWAS statistics, colocalization was performed on effect size (effect size) and associated standard error (effect size s.e.) values. Used GWAS statistics were imputed from available z-score (z), allele frequency (f) and sample size values (N) by effect size ≈ z/(f(1 – f)N)^(1/2) and effect size s.e. ≈ effect size/z.
fastenloc approach.
First, GWAS posterior inclusion probability values were obtained with torus from available z-scores. Then, for each tissue, the DNAm levels, genotypes and mQTL-mapping covariates for CpGs and corresponding cis windows considered in the mQTL analysis were processed with dap-g95 (v.1.0.0). Next, we used fastenloc to obtain regional colocalization probabilities for all tuples of interest (GWAS hit, trait, tissue, mCpG) by subsetting corresponding GWAS hits, and significant (single-tissue mQTL set: FDR < 0.05) mCpGs from the genome-wide fastenloc output. An equivalent approach was used for eQTL-GWAS colocalization; the dap-g precomputed eQTL annotations from GTEx (v8) data were obtained from the fastenloc github repository: https://github.com/xqwen/fastenloc. Evaluation of mQTL-GWAS colocalization approach is described in Supplementary Note.
Characterization of signatures of trait-linked mCpGs
Tissue-specific enrichment in mQTL-GWAS colocalizations.
To identify traits with a tissue-specific colocalization enrichment profile, we performed a multisample test for equality of proportions without continuity correction. For each trait with >5 mQTL-GWAS colocalizations, we compared the observed proportions of mQTL-GWAS colocalizations per tissue to the overall proportion of colocalizations for all tissues. We identified traits with a disproportionate amount of colocalizations in at least one tissue at Bonferroni-adjusted P < 0.05. For these traits, scaled-by-trait colocalization proportions per tissue are shown in Fig. 6a, where tissues and traits were clustered via complete-linkage hierarchical clustering based on euclidean distance. A two-sided Fisher’s exact test was conducted to determine significant tissue-trait enrichments at Bonferroni-adjusted P < 0.01, which are indicated by crossed cells in Fig. 6a. This approach has several limitations. We did not observe tissues of relevance for several traits, possibly due to the examination of mQTLs derived from only 9 tissues. For certain tissue–trait pairs, the limitedness of the mQTL catalog examined herein, and the low number of colocalizations identified, may have also impacted the completeness and accuracy of the identified tissue-specific enrichment profiles. This analysis would benefit from a more powered and exhaustive mQTL catalog.
Characterization of molecular regulatory pleiotropy of trait-linked mCpGs.
We evaluated the enrichment of mVariants corresponding to mQTL-GWAS colocalizations in mVariants regulating multiple versus single mCpGs. For each mCpG tested for mQTL-GWAS colocalization, we kept the corresponding colocalization result with the highest coloc PP4 value and the corresponding mVariant. We classified mVariants as pleiotropic if they were estimated to be associated with multiple mCpGs, or as non-pleiotropic, if they were associated with a single mCpG. Association was defined considering dap-g fine-mapping estimates used in the fastenloc mQTL-GWAS colocalization approach, and mQTL credible sets were defined at 90% confidence. We classified mVariants as being also eVariants if they were estimated to be associated with at least one eGene, estimating eQTL credible sets in an analogous manner to mQTL sets. Significant enrichment of trait-linked versus trait-unlinked mVariants in multiple-mCpG and eVariant sets was defined at two-sided Fisher’s exact test P < 0.05. Additionally, we subsetted mCpGs tested for mQTL-GWAS colocalization that were involved in e/mQTL colocalizations, and classified them into mCpG-eGene pleiotropy tiers (Extended Data Fig. 6). Enrichment of trait-linked versus trait-unlinked eGene and mCpGs in each tier was estimated at two-sided Fisher’s exact test P < 0.05. Given its complex linkage disequilibrium structure and genotype imputation inaccuracies, the major histocompatibility complex (MHC) locus is challenging to analyze. To ensure that pleiotropy results are not biased by MHC, we evaluated pleiotropy excluding CpG cis loci overlapping the MHC region, as well as corresponding eQTL-mQTL colocalized eGenes. The pleiotropy distributions were not significantly different (test of equal proportions P < 0.05).
Characterization of DNAm signatures of trait-linked mCpGs.
To evaluate the overlap of trait-linked mCpGs with open chromatin regions, we used annotations derived from ENCODE5 open chromatin regions (see Obtention and processing of functional genomic data). See additional details in Supplementary Note.
We evaluated the putative enrichment of increased disease-risk alleles in gains or losses of DNAm, both across and within GWAS traits. From the set of 87 GWAS tested for mQTL colocalization, we subsetted colocalization results corresponding to 31 GWAS disease traits with for which at least one significant mQTL colocalization was identified. For each GWAS trait and mCpG tested for mQTL-GWAS colocalization, we kept the corresponding colocalization result with the highest coloc PP4 value. For each GWAS trait, we classified tested mCpGs into methylation gain or loss categories, based on the sign of the allelic mQTL effect associated with increased disease risk (that is, positive GWAS effect). Enrichment of each disease in methylation gains and losses was determined at Bonferroni-corrected two-sided Fisher’s exact test P < 0.05. No disease was identified as enriched for DNAm gains or losses. Despite individual traits not being significantly enriched for DNAm change biases, it is possible that a global bias could be detected when considering all traits at once. To test this hypothesis, each disease was labeled as ‘DNAm-gain’ if the corresponding number of colocalized mCpGs associated with a DNAm gain outnumbered the DNAm-loss ones and labeled as ‘DNAm-loss’ otherwise. An exact binomial test was performed to assess whether the proportion of DNAm-gain or DNAm-loss labeled diseases deviated significantly (P < 0.05) from 50%, which was not the case (P = 0.86).
Characterization of trait-linked mCpGs overlap with gene regulatory regions.
Gene regulatory element annotations were derived from ENCODE5 cCREs catalog and gene body element annotations were obtained from GENCODE (see Obtention and processing of functional genomic data). To annotate mCpGs for cCRE and gene body elements, we extended the span of their genomic location by ±100 bps and checked for overlap (≥1 bp) with element regions. Trait-linked mCpGs were classified as e/mQTL shared or mQTL specific (Supplementary Note: Evaluation of mQTL-GWAS colocalization). Enrichment significance of e/mQTL-shared or mQTL-specific trait-linked mCpGs in each gene regulatory region or gene body element category was estimated at two-sided Fisher’s exact test P < 0.05.
Characterization of trait-linked mCpGs overlap with functional maps.
To evaluate the overlap of mQTL-specific trait-linked mCpGs with genomic regions linked to specific genes, we considered functional maps based on curated regulatory-region to gene target predictions63,64 and eQTM predictions generated herein. We extended the genomic location span of mCpGs by ±100 bp, and checked for overlap (≥1 bp) with eCpGs and regulatory regions (gene links). Enrichment of mQTL-specific trait-linked mCpG in gene links was evaluated with two-sided Fisher’s exact test, considering gene links observed for non-colocalized mCpGs. For each trait/gene-linked mCpG, we annotated corresponding regulatory-region gene targets and eCpG-correlated genes; a particular gene was annotated to a mCpG if overlap was found in one or more functional maps. Annotations were collapsed at a GWAS hit level by adding up the number of predicted mCpG-gene links corresponding to the locus, hence providing an estimate of mCpGs that support a gene candidate per trait-associated locus (Supplementary Table 6).
Colocalization of trait-linked mCpGs with multi-context eQTL maps.
To expand on the identification of eGenes underlying mQTL-GWAS specific GWAS hits (Fig. 4), we considered non-GTEx multi-context eQTL resources and performed GWAS-mQTL-eQTL multivariate colocalization with HyPrColoc96 (v.1.0.0), which implements an efficient deterministic Bayesian algorithm to detect colocalization across multiple traits (for example, multi-omic traits from different contexts). The eQTL mappings were obtained from eQTL Catalogue37 (https://www.ebi.ac.uk/eqtl/) release 4, eQTLGen97 (https://eqtlgen.org/cis-eqtls.html) and i2QTL98 (https://doi.org/10.5281/zenodo.4005576) Consortium. The eQTL map set comprised 61 gene-level eQTL mappings identified in cohorts other than GTEx, most of derived from RNA sequencing, encompassing a wide range of tissues and cells, including simulated blood cells, highly powered pluripotent cells and whole blood datasets (Supplementary Table 8). For each mQTL-GWAS specific GWAS hit (Fig. 4), we jointly modeled (1) the mQTL signal corresponding to the top colocalizing mCpG, (2) the external eQTL datasets and eQTL signal for genes with nominal (P < 1 × 10⁻³) eQTL signal for a variant matching the top colocalizing mQTL-GWAS variant and (2) the GWAS signal of the colocalized trait. Only cases with >50 overlapping variants were considered. A single external eQTL dataset was modeled at a time. We refer to PR as the regional association probability that all the traits share an association with one or more variants within the region and PA as the alignment probability that the shared associations between all traits are owing to a single shared putative causal variant. The posterior probability of full colocalization (PPFC = PR*PA) represents the posterior probability that all traits share a causal variant within that region. Clusters were identified when PR > 0.8 and PPFC > 0.5 (PA > 0.625) were satisfied. Prior.1 represents the prior probability that a variant is associated with a single trait, and (1 – prior.2) represents the prior probability that a variant is associated with an additional trait given that it is associated with one trait. We set prior.1 = 1 × 10⁻⁴, and prior.2 = 0.98. We performed sensitivity analysis by setting prior.2 to 0.95, 0.98 and 0.99, and we also calculated the corresponding empirical false positive rate by permuting eQTL with respect to mQTL and GWAS estimates (Supplementary Note); significant colocalization instances are provided (Supplementary Table 8).
Extended Data
Extended Data Fig. 1 |. Characterization of methylomes across tissues, eQTM discovery and tissue specificity patterns.
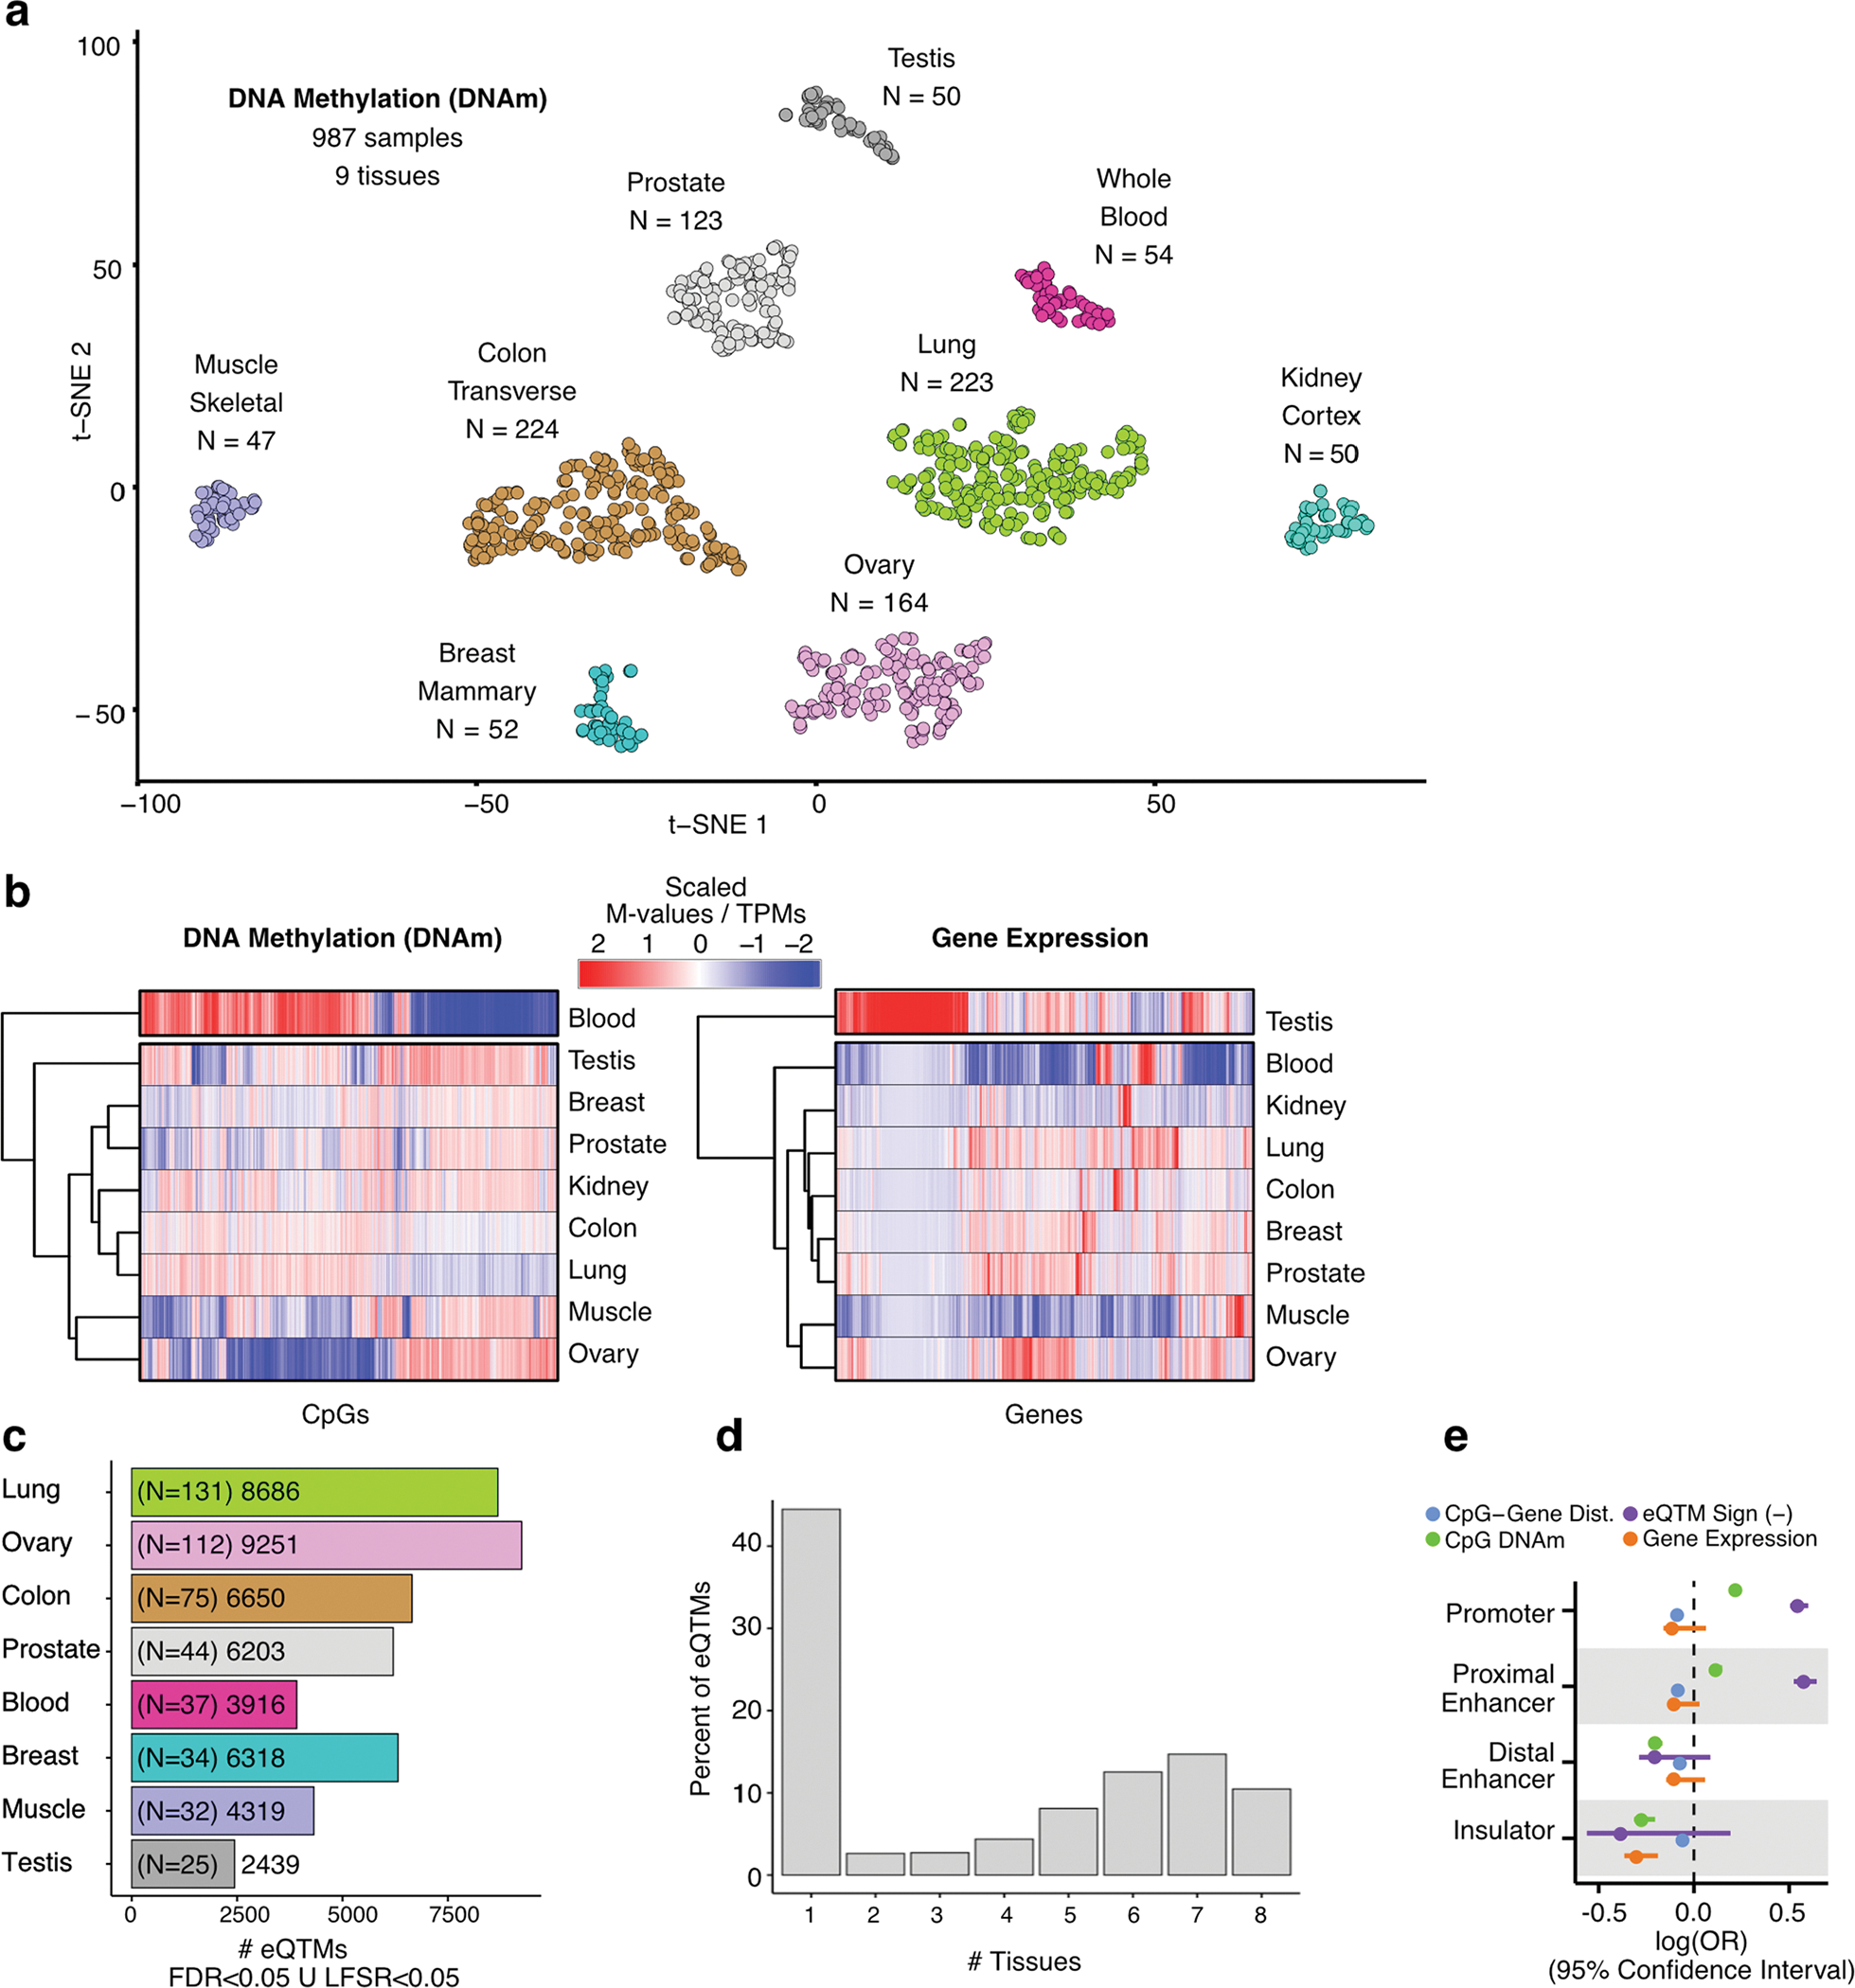
(a) Sample similarity based on DNAm profiles. Dimensionality reduction was performed with a t-Distributed Stochastic Neighbor Embedding approach (t-SNE). (b) Hierarchical tissue clustering based on complete methylomes (left panel) and transcriptomes (right panel) of nine tissues (x axis). The molecular phenotypes displayed (y axis) correspond to the top 20,000 most divergent CpG sites and genes across tissues. DNAm and gene expression values are column-wise scaled. (c) Number of eQTMs per tissue, defined at LFSR < 0.05 or FDR < 0.05, shown with per-tissue eQTM-mapping sample sizes in parentheses. FDR: False Discovery Rate. LFSR: Local False Sign Rate. (d) Tissue sharing profile of eQTMs. (e) Contribution (x axis, square-root transformed log(OR)) of selected factors to eQTM likelihood (presence) for different gene regulatory elements (y axis). Dist.: Distance. OR: Odds Ratio. Factor units: CpG–gene distance [Kb], eQTM Sign [‘1’ for negative correlation between methylation and expression, ‘0’ otherwise], CpG DNAm [M-value], gene expression [log2(TPM + 1)]. OR estimates were derived from across-tissue meta-analysis (nine tissues) of predictor coefficients of eQTM likelihood, fitted with a logistic regression model (Methods).
Extended Data Fig. 2 |. DNAm-derived PEER factors association with technical, clinical and epidemiological covariates.
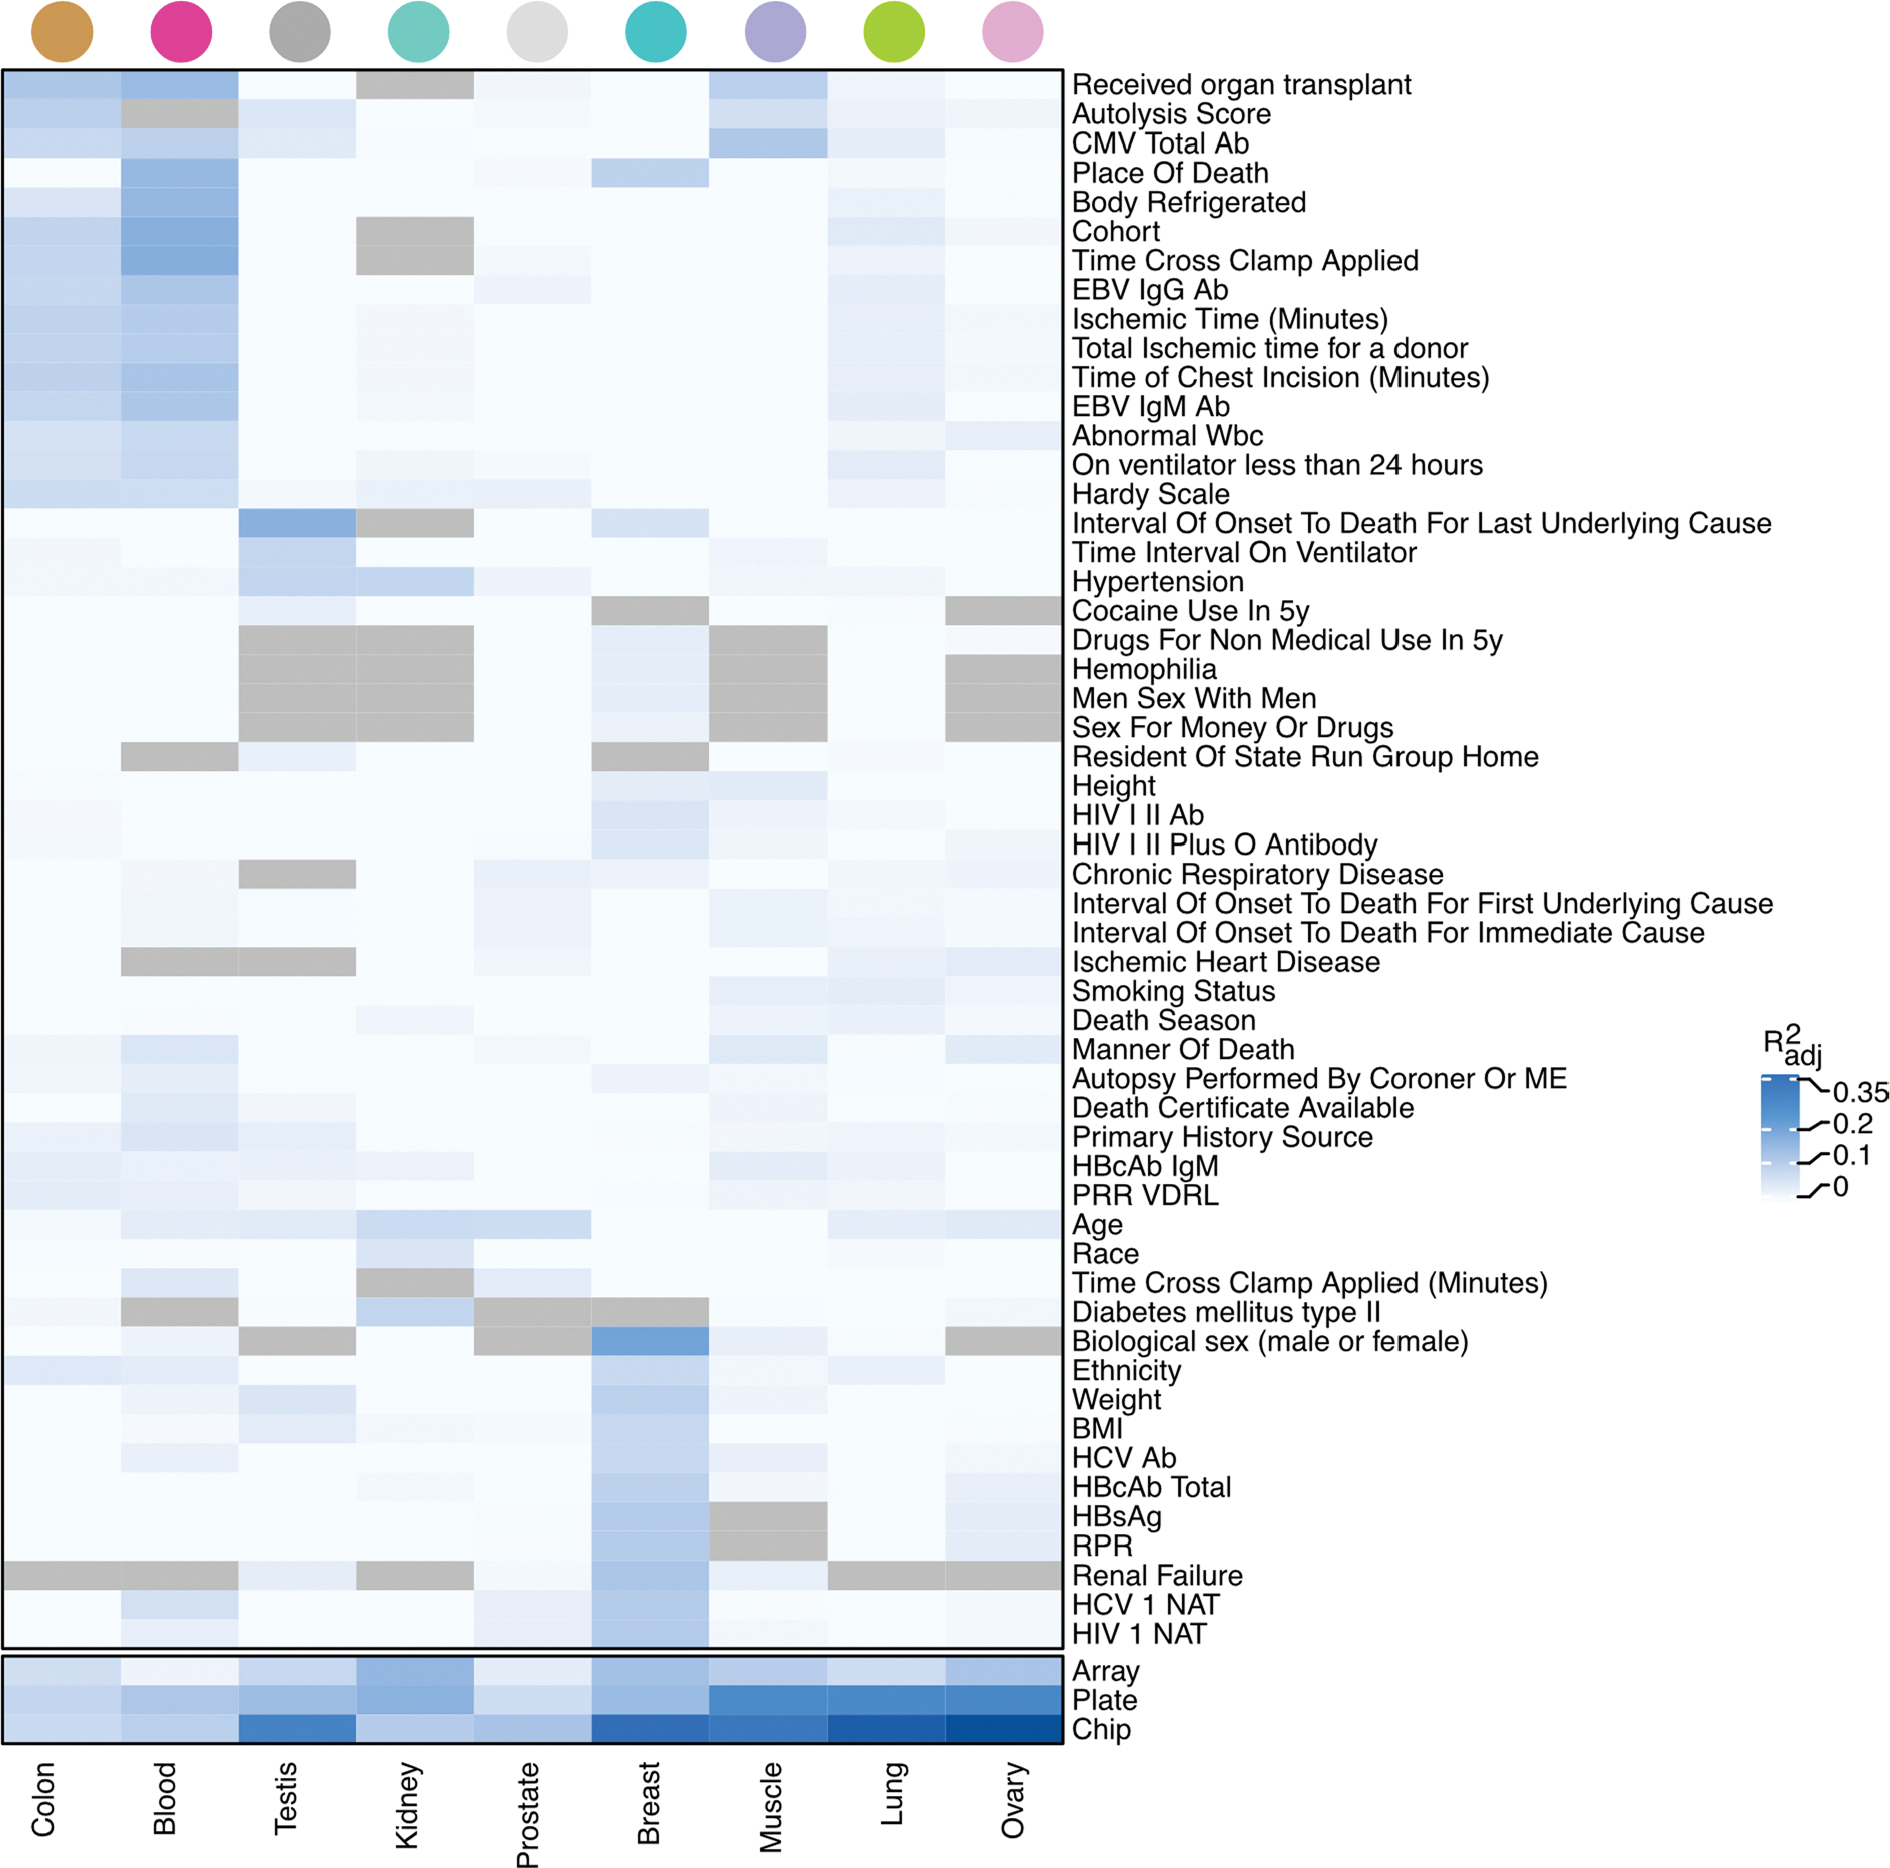
Proportion of variance - mean adjusted R2 across top three PEERs (R2adj) - of the PEER factors explained in part by known donor and sample clinical and biological covariates. Each cell shows the proportion of variance explained by the covariate with respect to the three top PEERs in a specific tissue. Only covariates with R2adj ≥ 0.02 in any tissue are shown. Tissues and covariates are ordered based on hierarchical clustering with complete agglomeration with Euclidean distance. Gray cells indicate unavailable data. The cells at the bottom of the panel shows that the PEERs are capturing batch effects, as expected.
Extended Data Fig. 3 |. DNAm-derived PEER factors association with tissue cellular abundances.
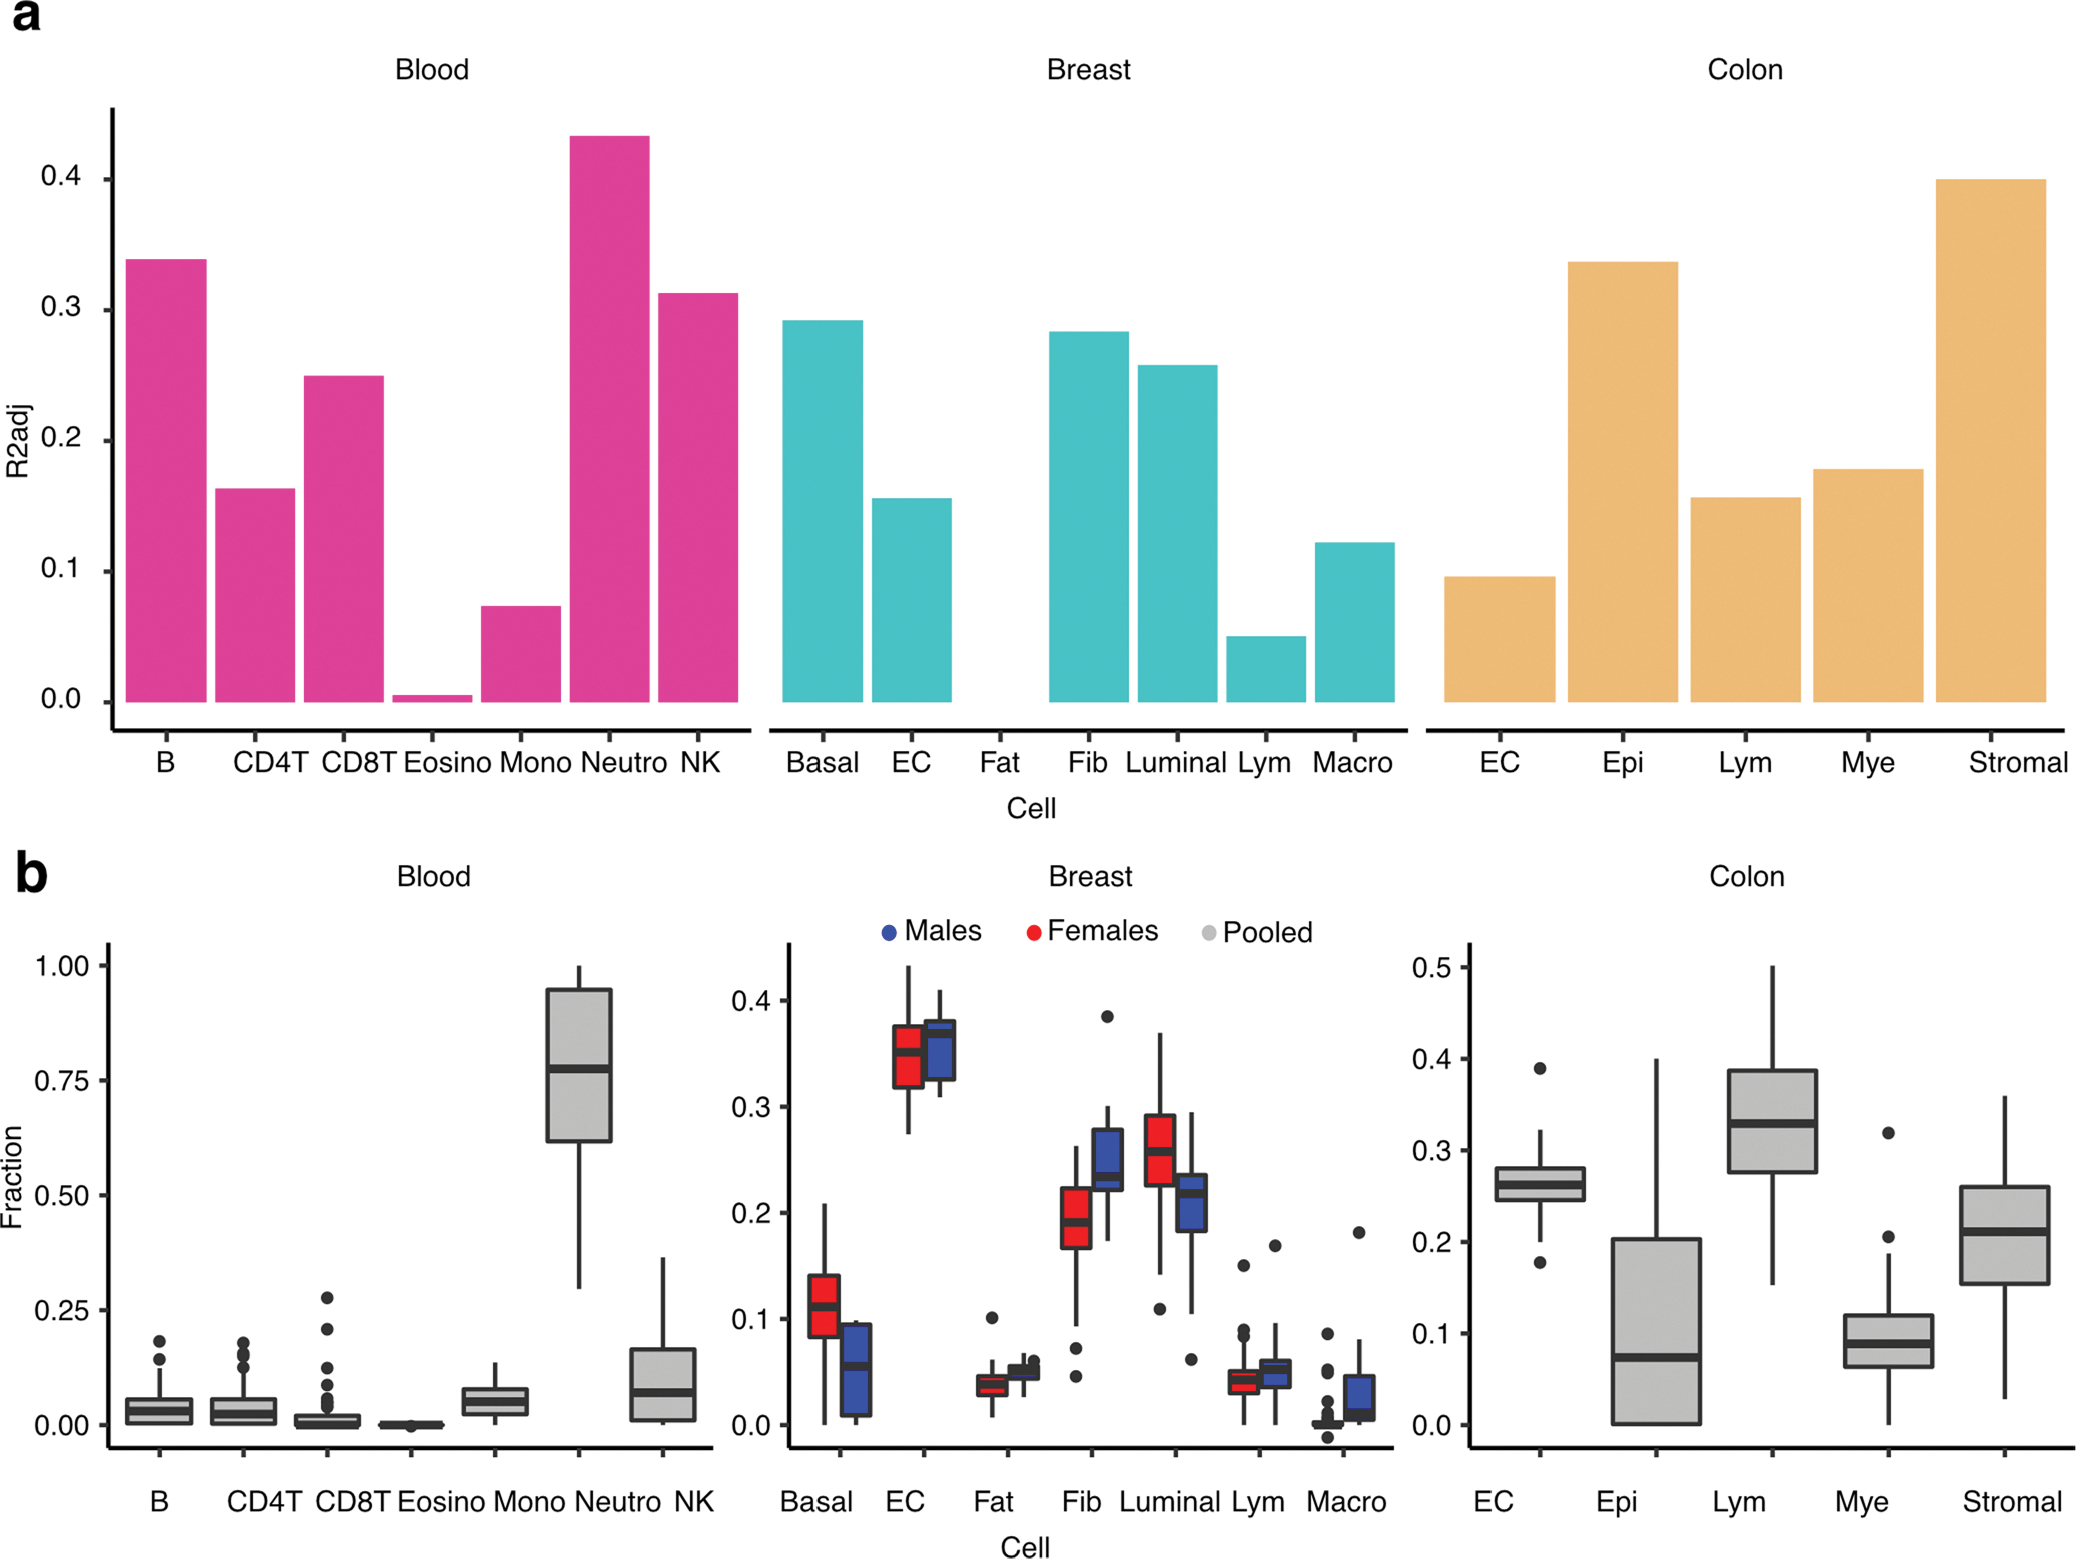
Proportion of variance - mean adjusted R2 across top three PEERs (R2adj) - of the PEER factors explained in part by tissue cellular abundances. Each bar shows the proportion of variance explained by the cell abundance with respect to the three top PEERs in a specific tissue. (b) Fraction of cell abundance (y axis) estimated by DNAm cell-type deconvolution with EpiSCORE, stratified by cell type (x axis) in corresponding tissue. Breast cell abundances are stratified by sex to illustrate sex-differential cell abundances. Cell abundances were estimated for all available samples per tissue: NBreast,Males = 14, NBreast,Females = 38, NBlood,Pooled = 54, NColon,Pooled = 224. B: B cells, NK: Natural Killer cells, CD4T: CD4+ T-cells, CD8T: CD8+ T-cells, Mono: Monocytes, Neutro: Neutrophils, Eosino: Eosinophils, Basal: Basal Epithelial cells, EC: Endothelial cells, Fat: Adipocytes, Luminal: Luminal Epithelial cells, Lym: Lymphocytes, Macro: Macrophages, Epi: Epithelial cells, Mye: Myeloid cells, Stromal: Stromal cells.
Extended Data Fig. 4 |. Tissue specificity of QTLs.
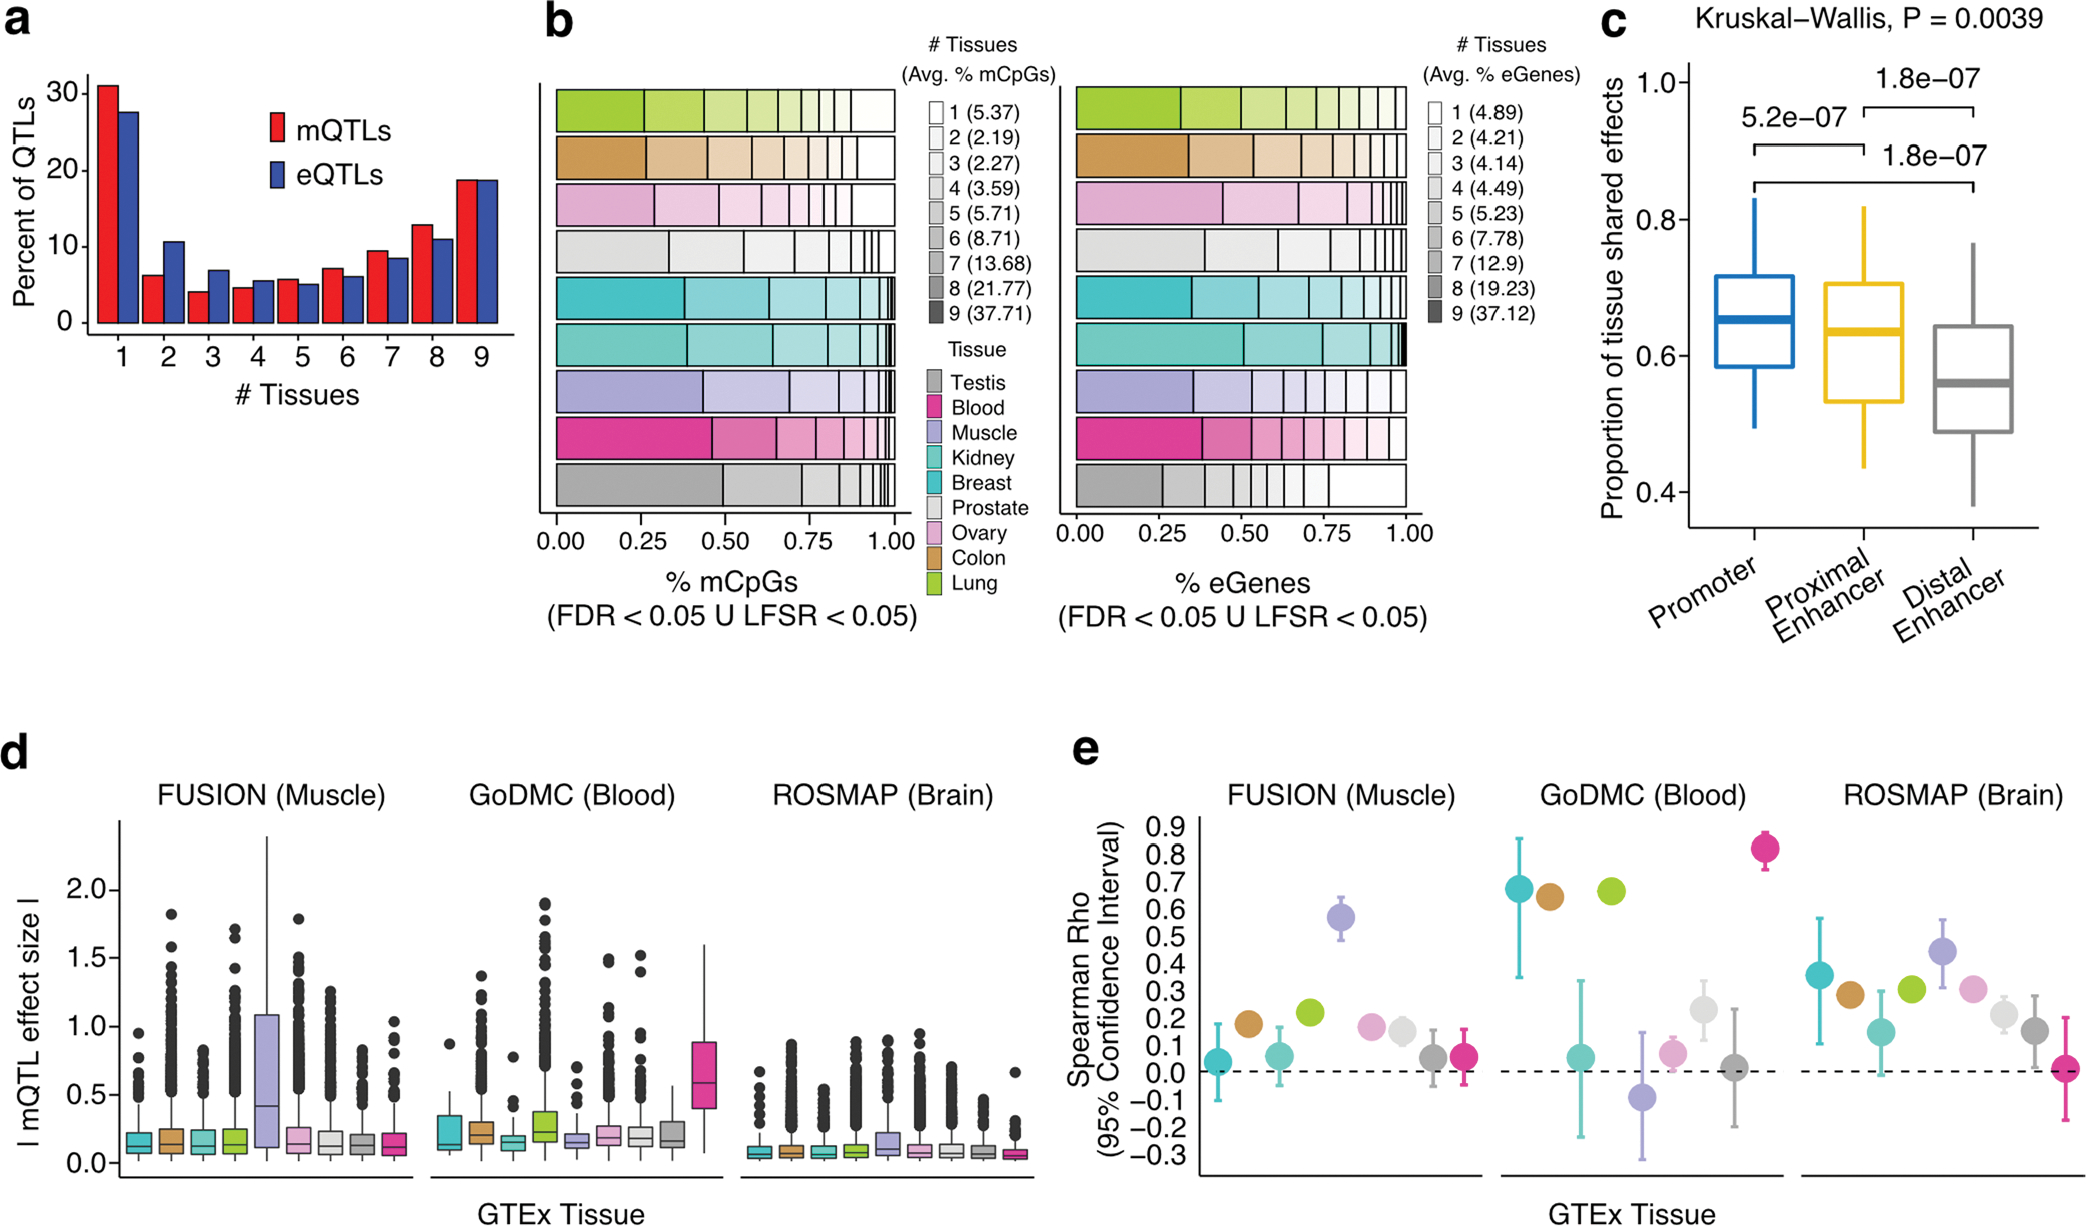
(a) Tissue sharing profile of mQTLs and eQTLs. (b-c) Cross-tissue sharing of mCpGs and eGenes. Cross-tissue mean percent of mCpGs and eGenes per tissue-sharing category is shown in parentheses. Of note, testis is an outlier for eQTL tissue specificity, as 23.5% of eGenes were not detected in any other tissue. Avg.: average (mean). (c) Cross-tissue sharing of mQTL tissue-leveraged effect magnitudes (y axis) per gene regulatory region (x axis, 36 data points per box plot). P-values of paired two-sided Wilcoxon signed rank tests are shown for corresponding pairwise comparisons; p-value of Kruskal-Wallis rank sum test is shown for the three-way comparison. Enh.: Enhancer. (d, e) Validation of tissue-specific mQTLs in muscle, blood and brain mQTL external cohorts, see (b) for tissue color legend. In (d), for each cohort, the average of absolute mQTL effect sizes and corresponding standard error is displayed for each set of tissue-specific mQTLs identified in each GTEx tissue (x axis). In (e), Spearman correlation between external and GTEx mQTL effect sizes, and associated standard error, is shown. Fisher’s z transformation was applied to Spearman correlation coefficients; standard errors were calculated based on the transformed coefficients. In (d,e), the number of QTL associations (N) tested for each pairwise comparison is as follows: NFUSION,GTEx = 195|4142|336,4630,287,4643|1428|360|369, NGoDMC,GTEx = 22|1353|47|1478|70|1019|292|83|102 and NROSMAP,GTEx = 57|2428|156|2587|163|2673|791|214|109, where GTEx corresponds to Breast|Colon|Kidney|Lung|Muscle|Ovary|Prostate|Testis|Blood tissues, respectively.
Extended Data Fig. 5 |. Representativity of GTEx mCpGs in external cohorts.
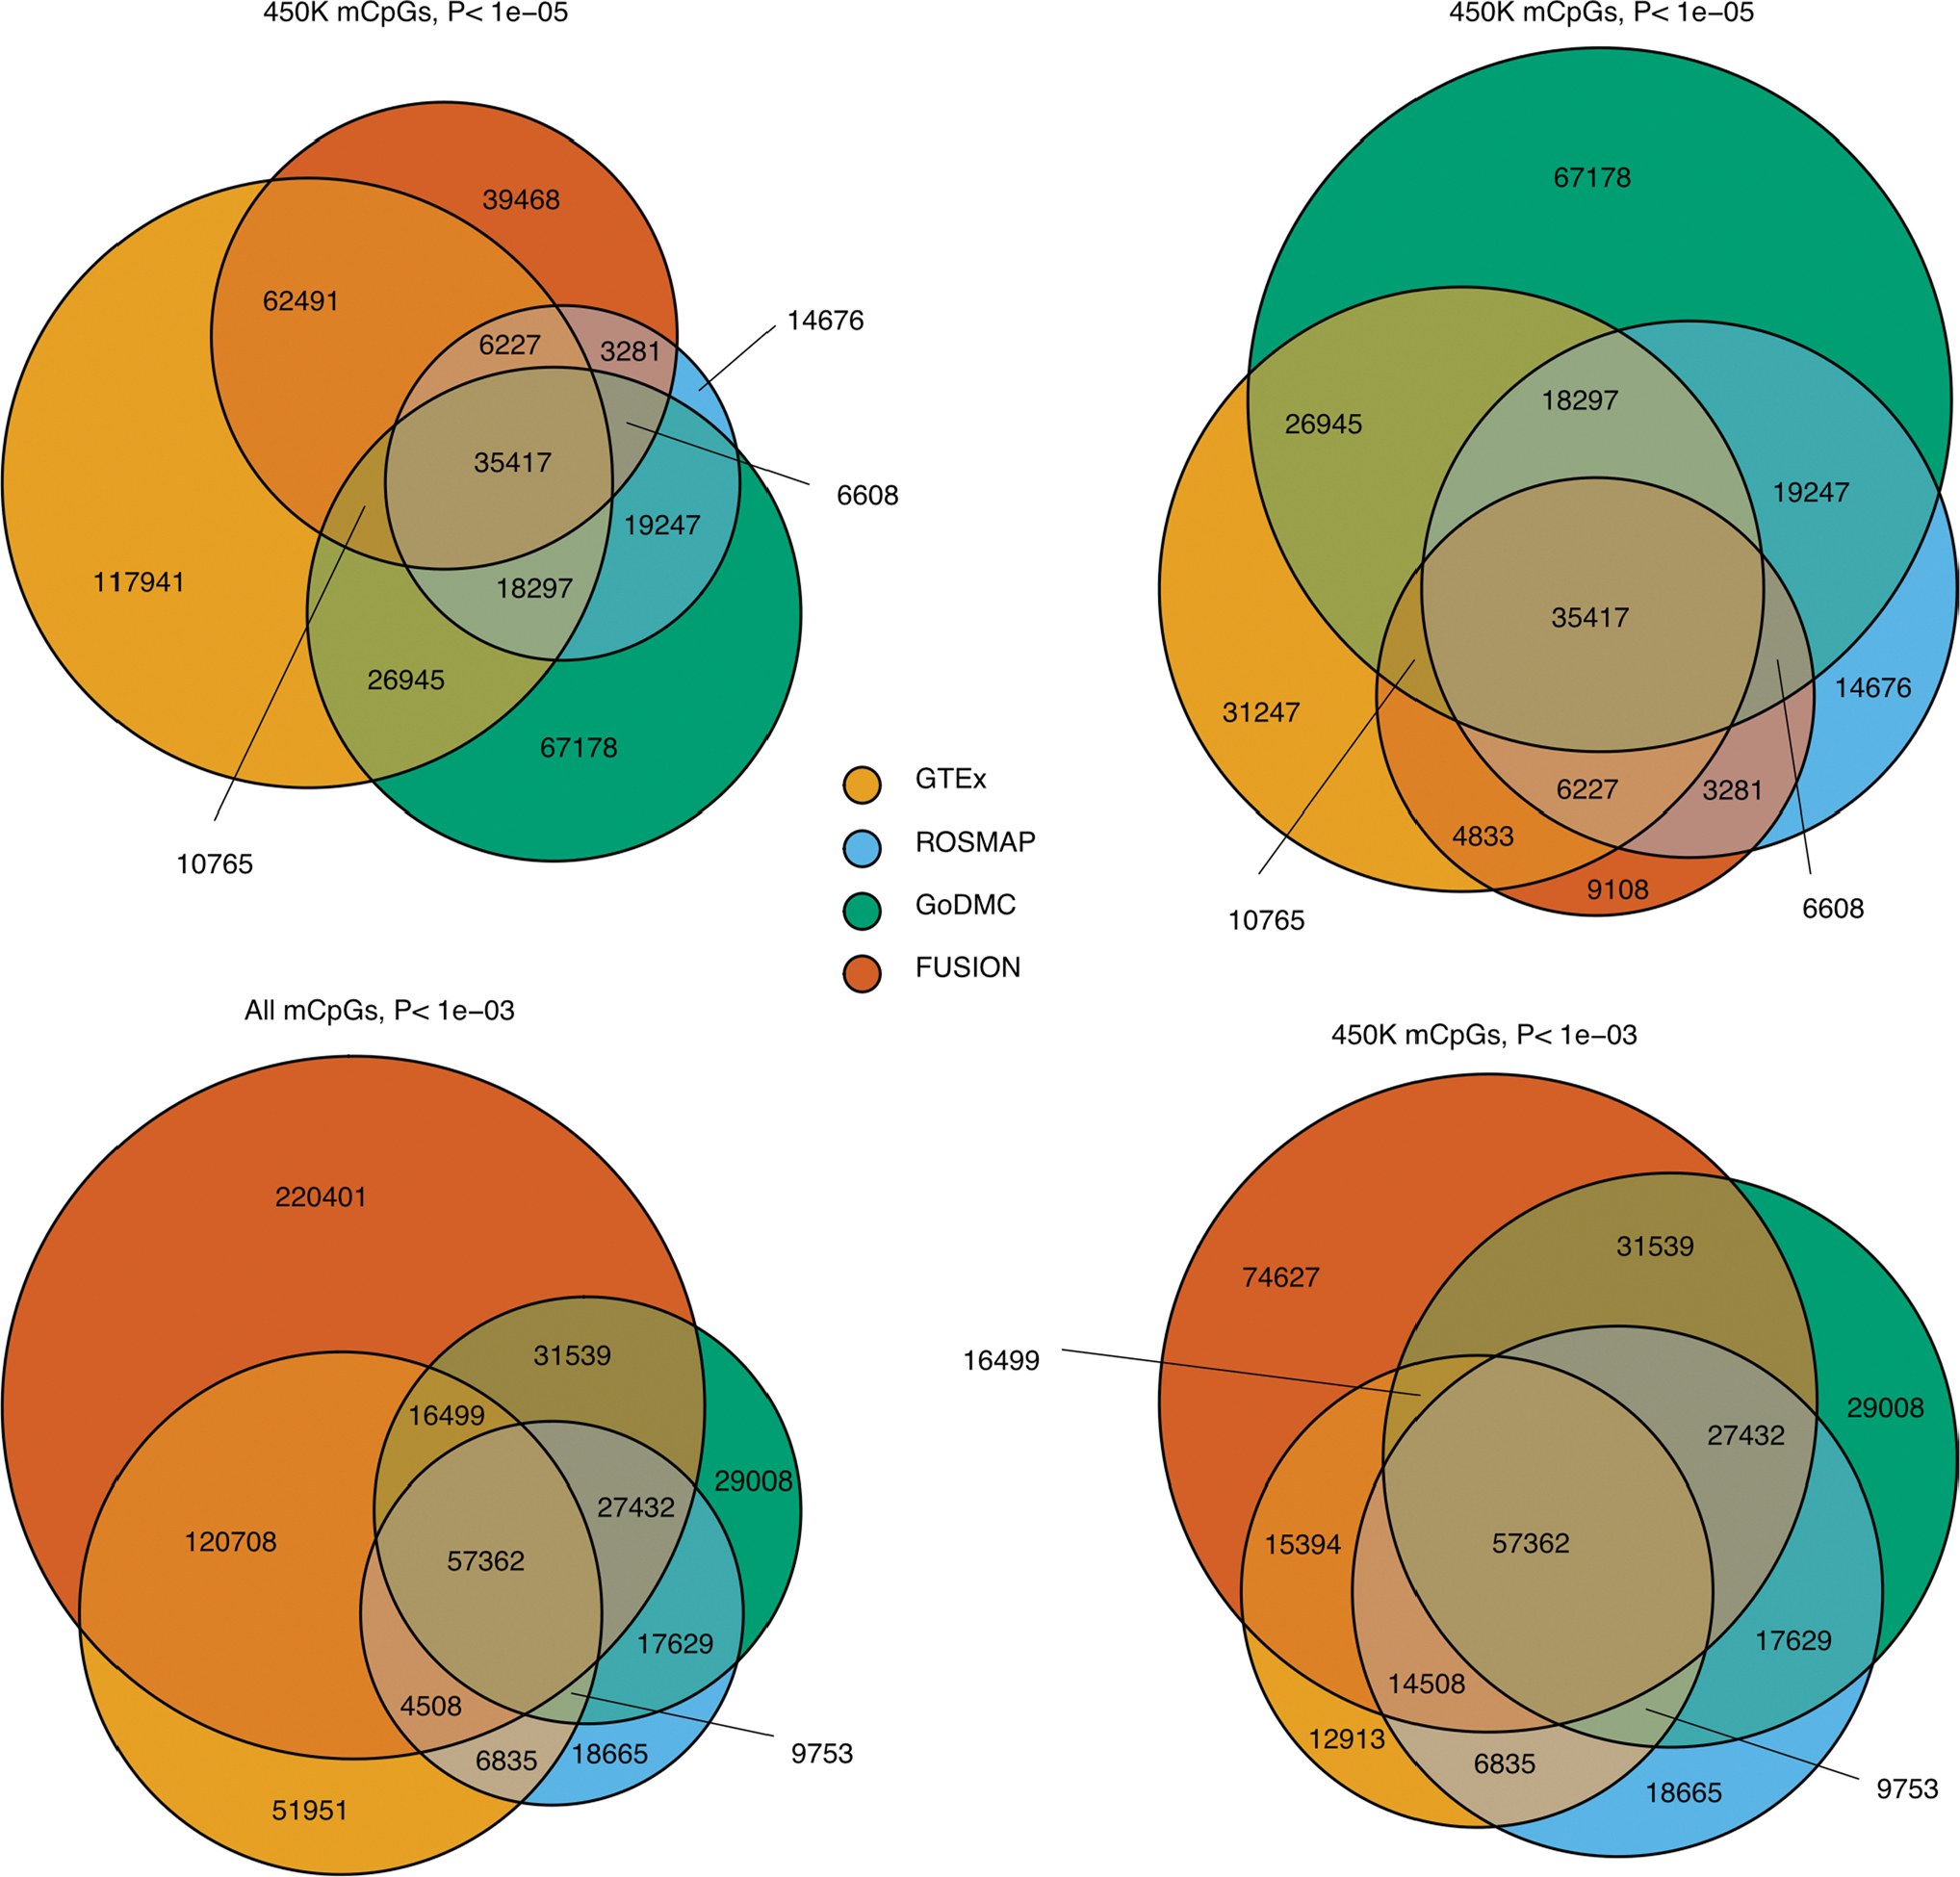
Overlap of mCpGs identified in GTEx (FDR < 0.05) with mCpGs identified in external mQTL cohorts at different nominal p-value thresholds (P < 1e-03 and P < 1e-05). Results are represented for all mCpGs - detected in EPIC and/or 450 K Illumina array - and for 450 K Illumina array CpG sites exclusively. P-value thresholds correspond to external cohort nominal mQTL associations, derived from QTL mapping by multiple regression two-sided t-tests.
Extended Data Fig. 6 |. Enrichment of QTLs in chromatin states.
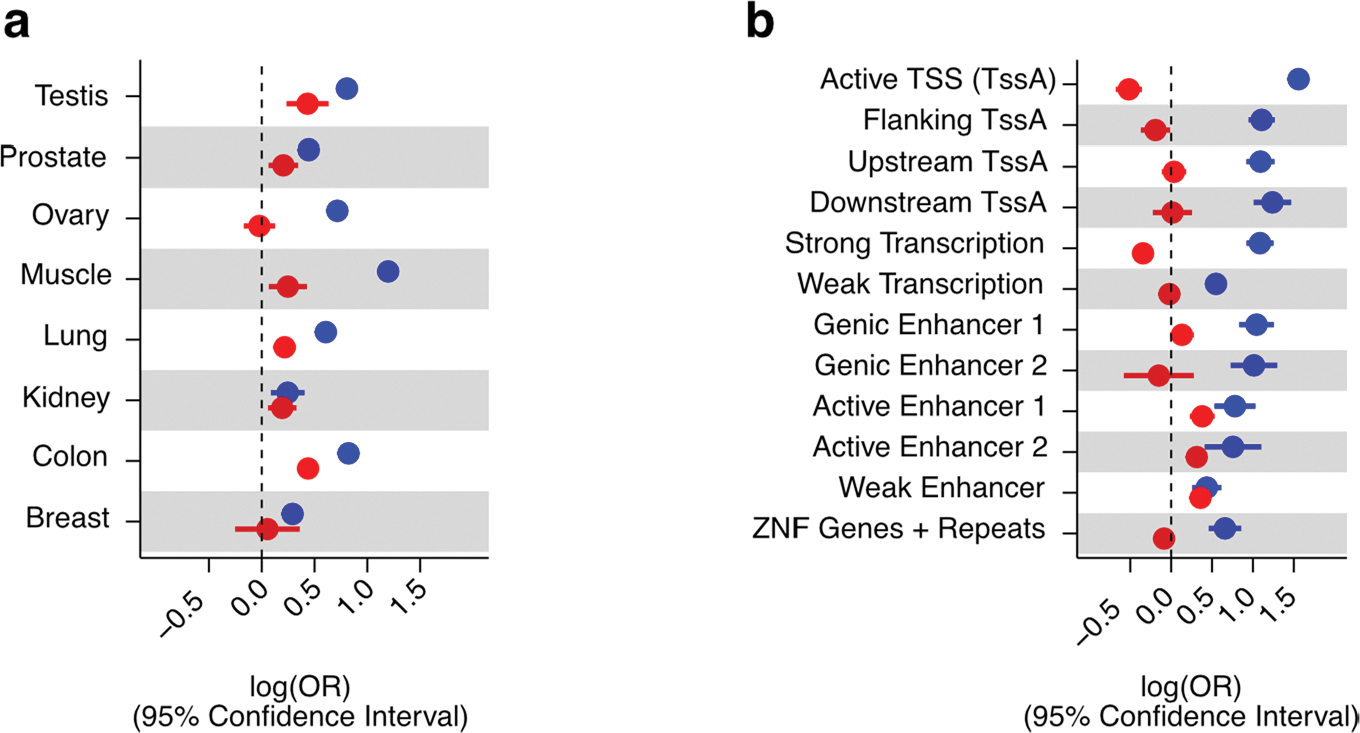
(a) QTL enrichment (x-axis) in tissue-matching open chromatin regions derived from ENCODE DNase-seq profiles per tissue (y-axis). Whole blood is excluded due to lack of a tissue-matching DNase-seq profile. Enrichment differences between tissues may be due in part to per-tissue DNase-seq data quality. (b) QTL enrichment (x-axis) in active chromatin states. OR: Odds Ratio. Enrichment values correspond to maximum-likelihood estimated log(ORs) for single-tissue in (a) and from across-tissue (nine tissues) meta-analysis in (b). In all panels, whiskers represent the 95% confidence interval of the enrichment value.
Extended Data Fig. 7 |. Characterization of mQTL pleiotropy.
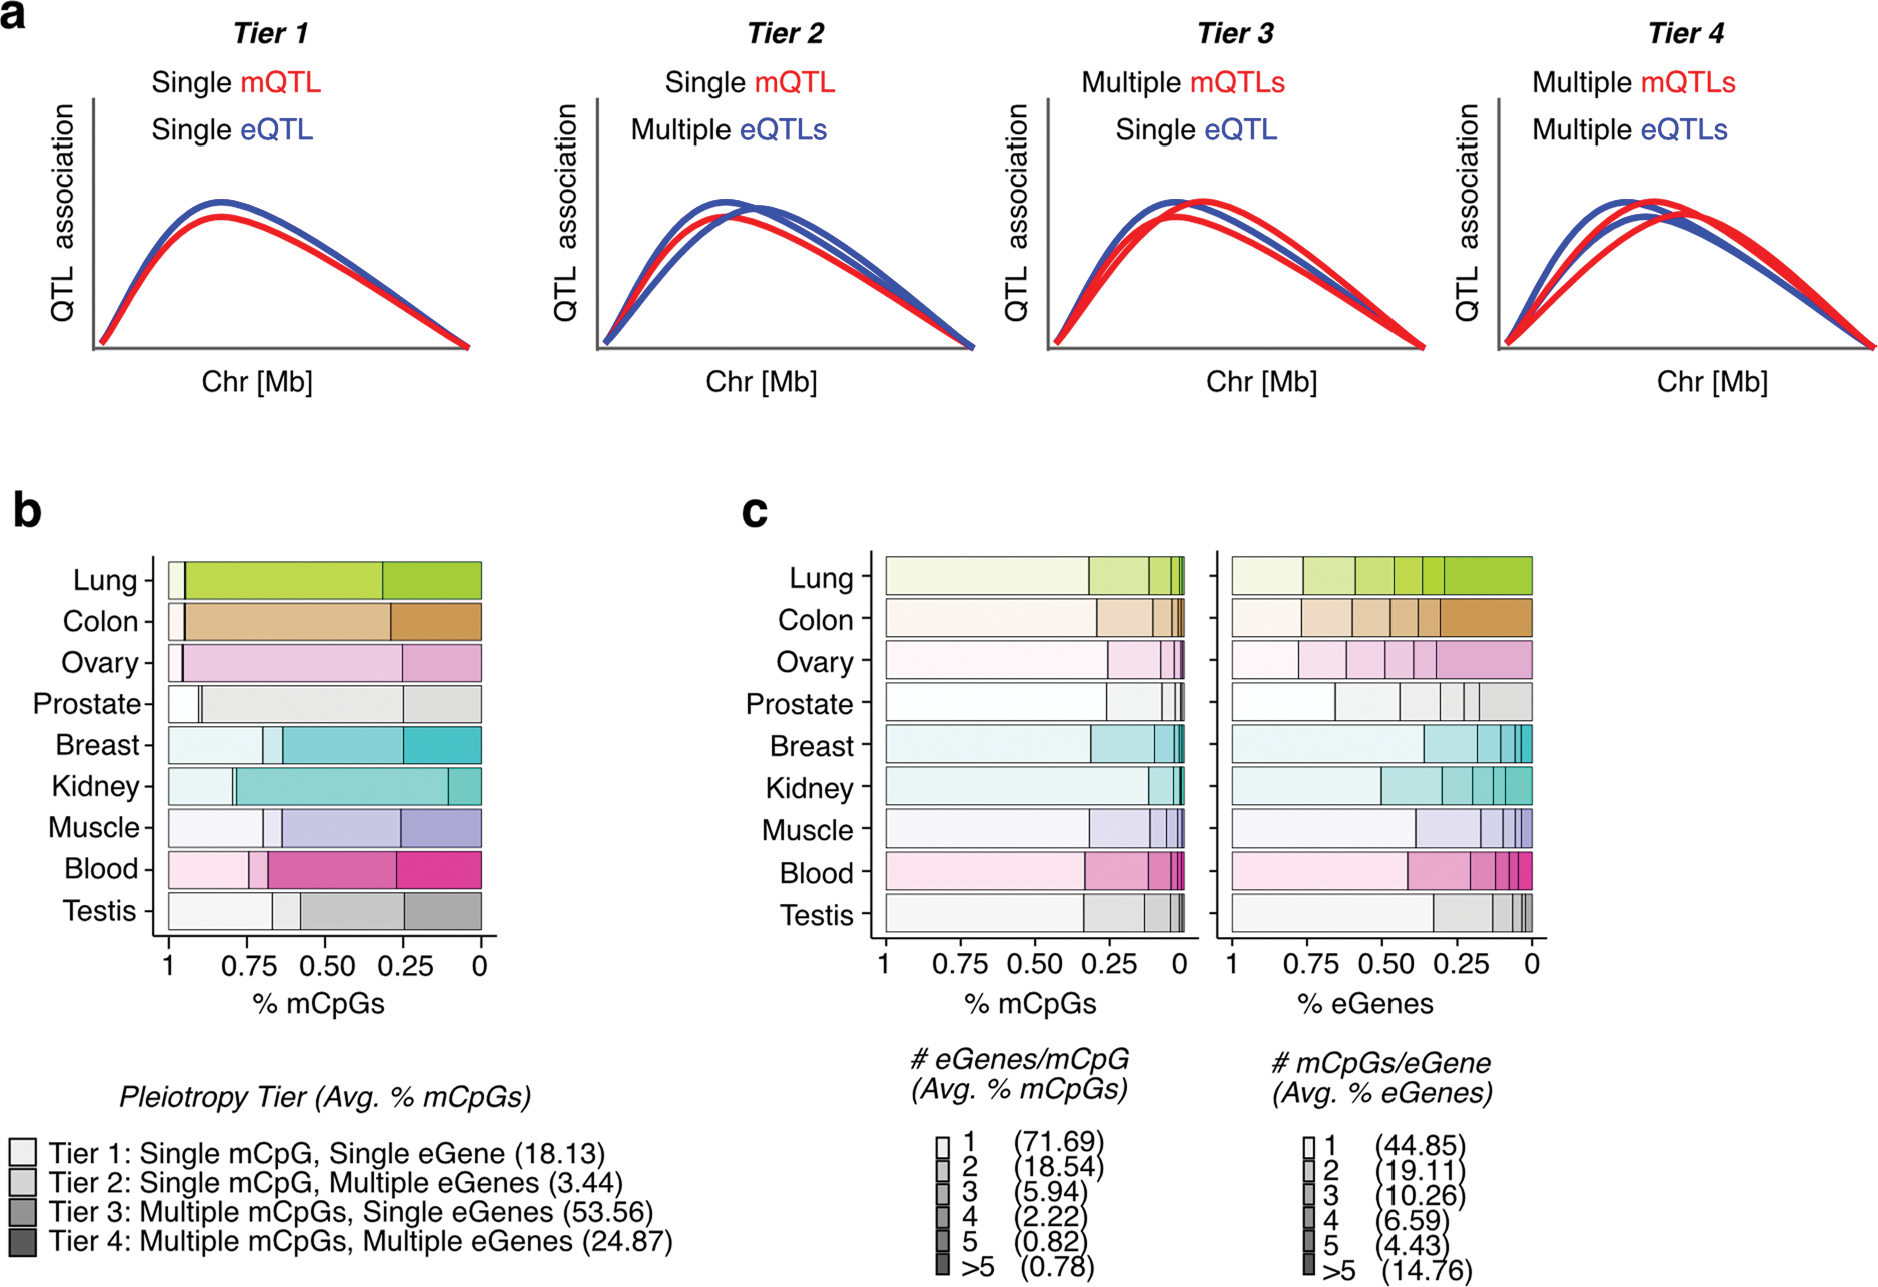
(a) Scheme of possible scenarios of eQTL-mQTL colocalization regarding QTL variants’ pleiotropic effect on multiple mCpGs and eGenes. (b) Quantification of mQTL-eQTL pleiotropy per tier per tissue, in percent of mCpGs belonging to each tier. Tier details illustrated in (a). Avg.: average (mean). (c) Distribution of the number of eGenes per mCpG (left panel) and mCpGs per eGene (right panel) involved in mQTL-eQTL colocalization events, stratified by tissue. Avg.: average (mean).
Extended Data Fig. 8 |. Evaluation of mQTL-GWAS colocalization approach.
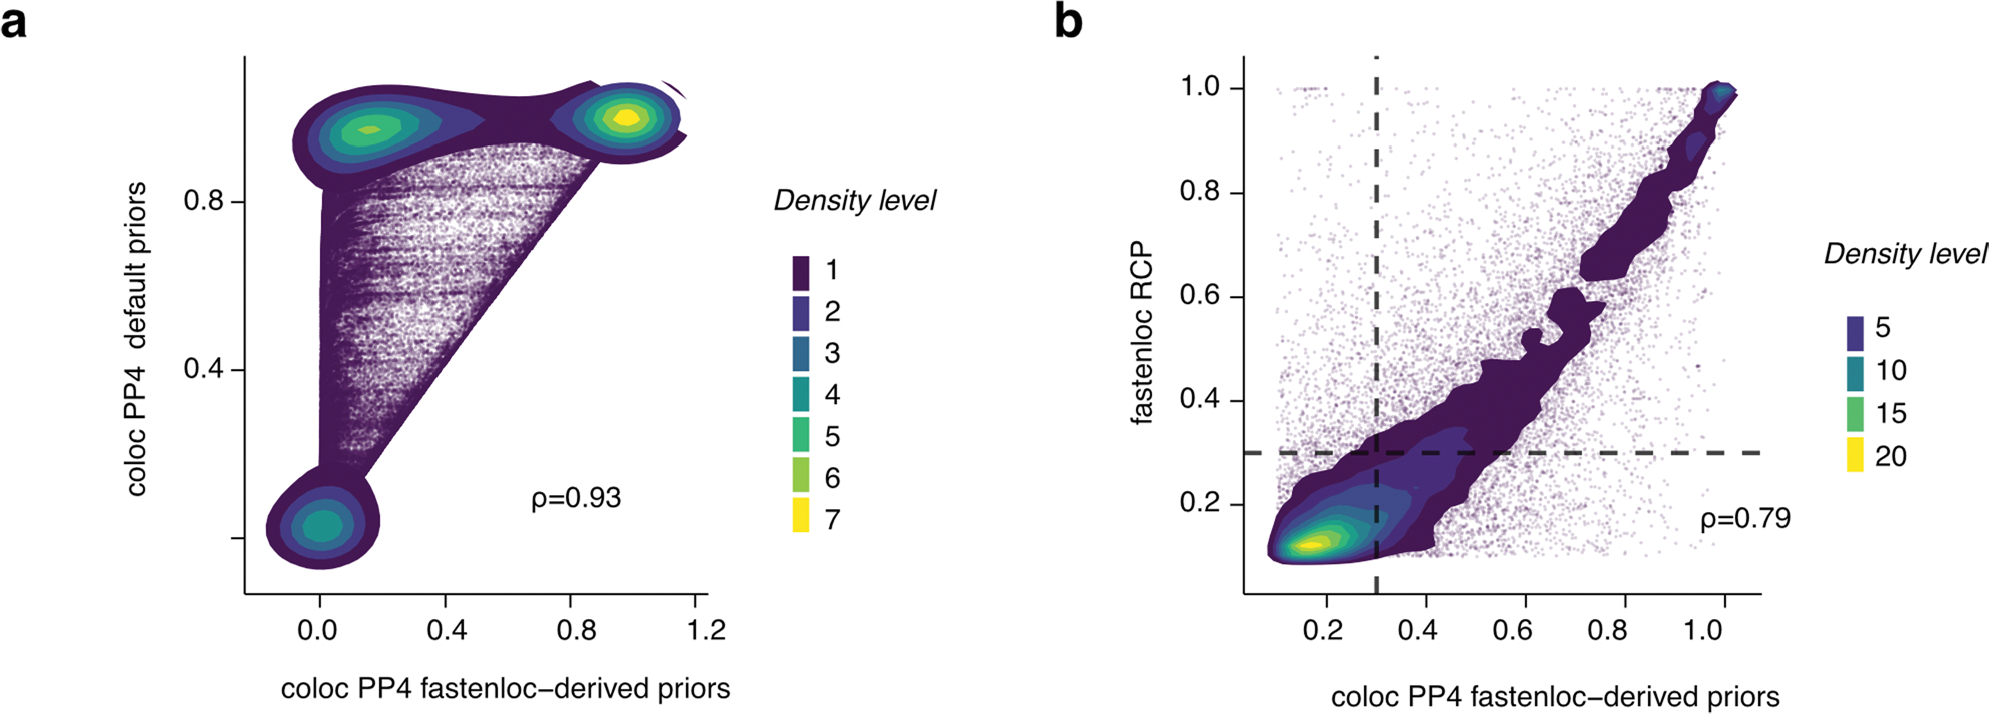
(a) Density plot of mQTL-GWAS colocalization scores based on coloc run with default (y axis) and fastenloc-derived priors (x axis) on UKB standing height GWAS; Spearman’s rho is shown. Each dot corresponds to a colocalization test for a particular GWAS hit, independent mQTL and tissue combination. (b) Density plot of mQTL-GWAS colocalization scores based on coloc (x axis) and fastenloc (y axis) approaches on all GWASs; Spearman’s rho is shown. Each dot corresponds to a colocalization test for a particular GWAS, GWAS hit, independent mQTL and tissue combination. Dots within the top-right quadrant correspond to significant (RCP > 0.3 and PP4 > 0.3) colocalizations. PP4: coloc-derived posterior probability where the two traits share a single causal variant. RCP: fastenloc-derived probability of a genomic region harboring a colocalized signal.
Extended Data Fig. 9 |. Signatures of QTL-GWAS colocalizations and trait-linked QTLs.
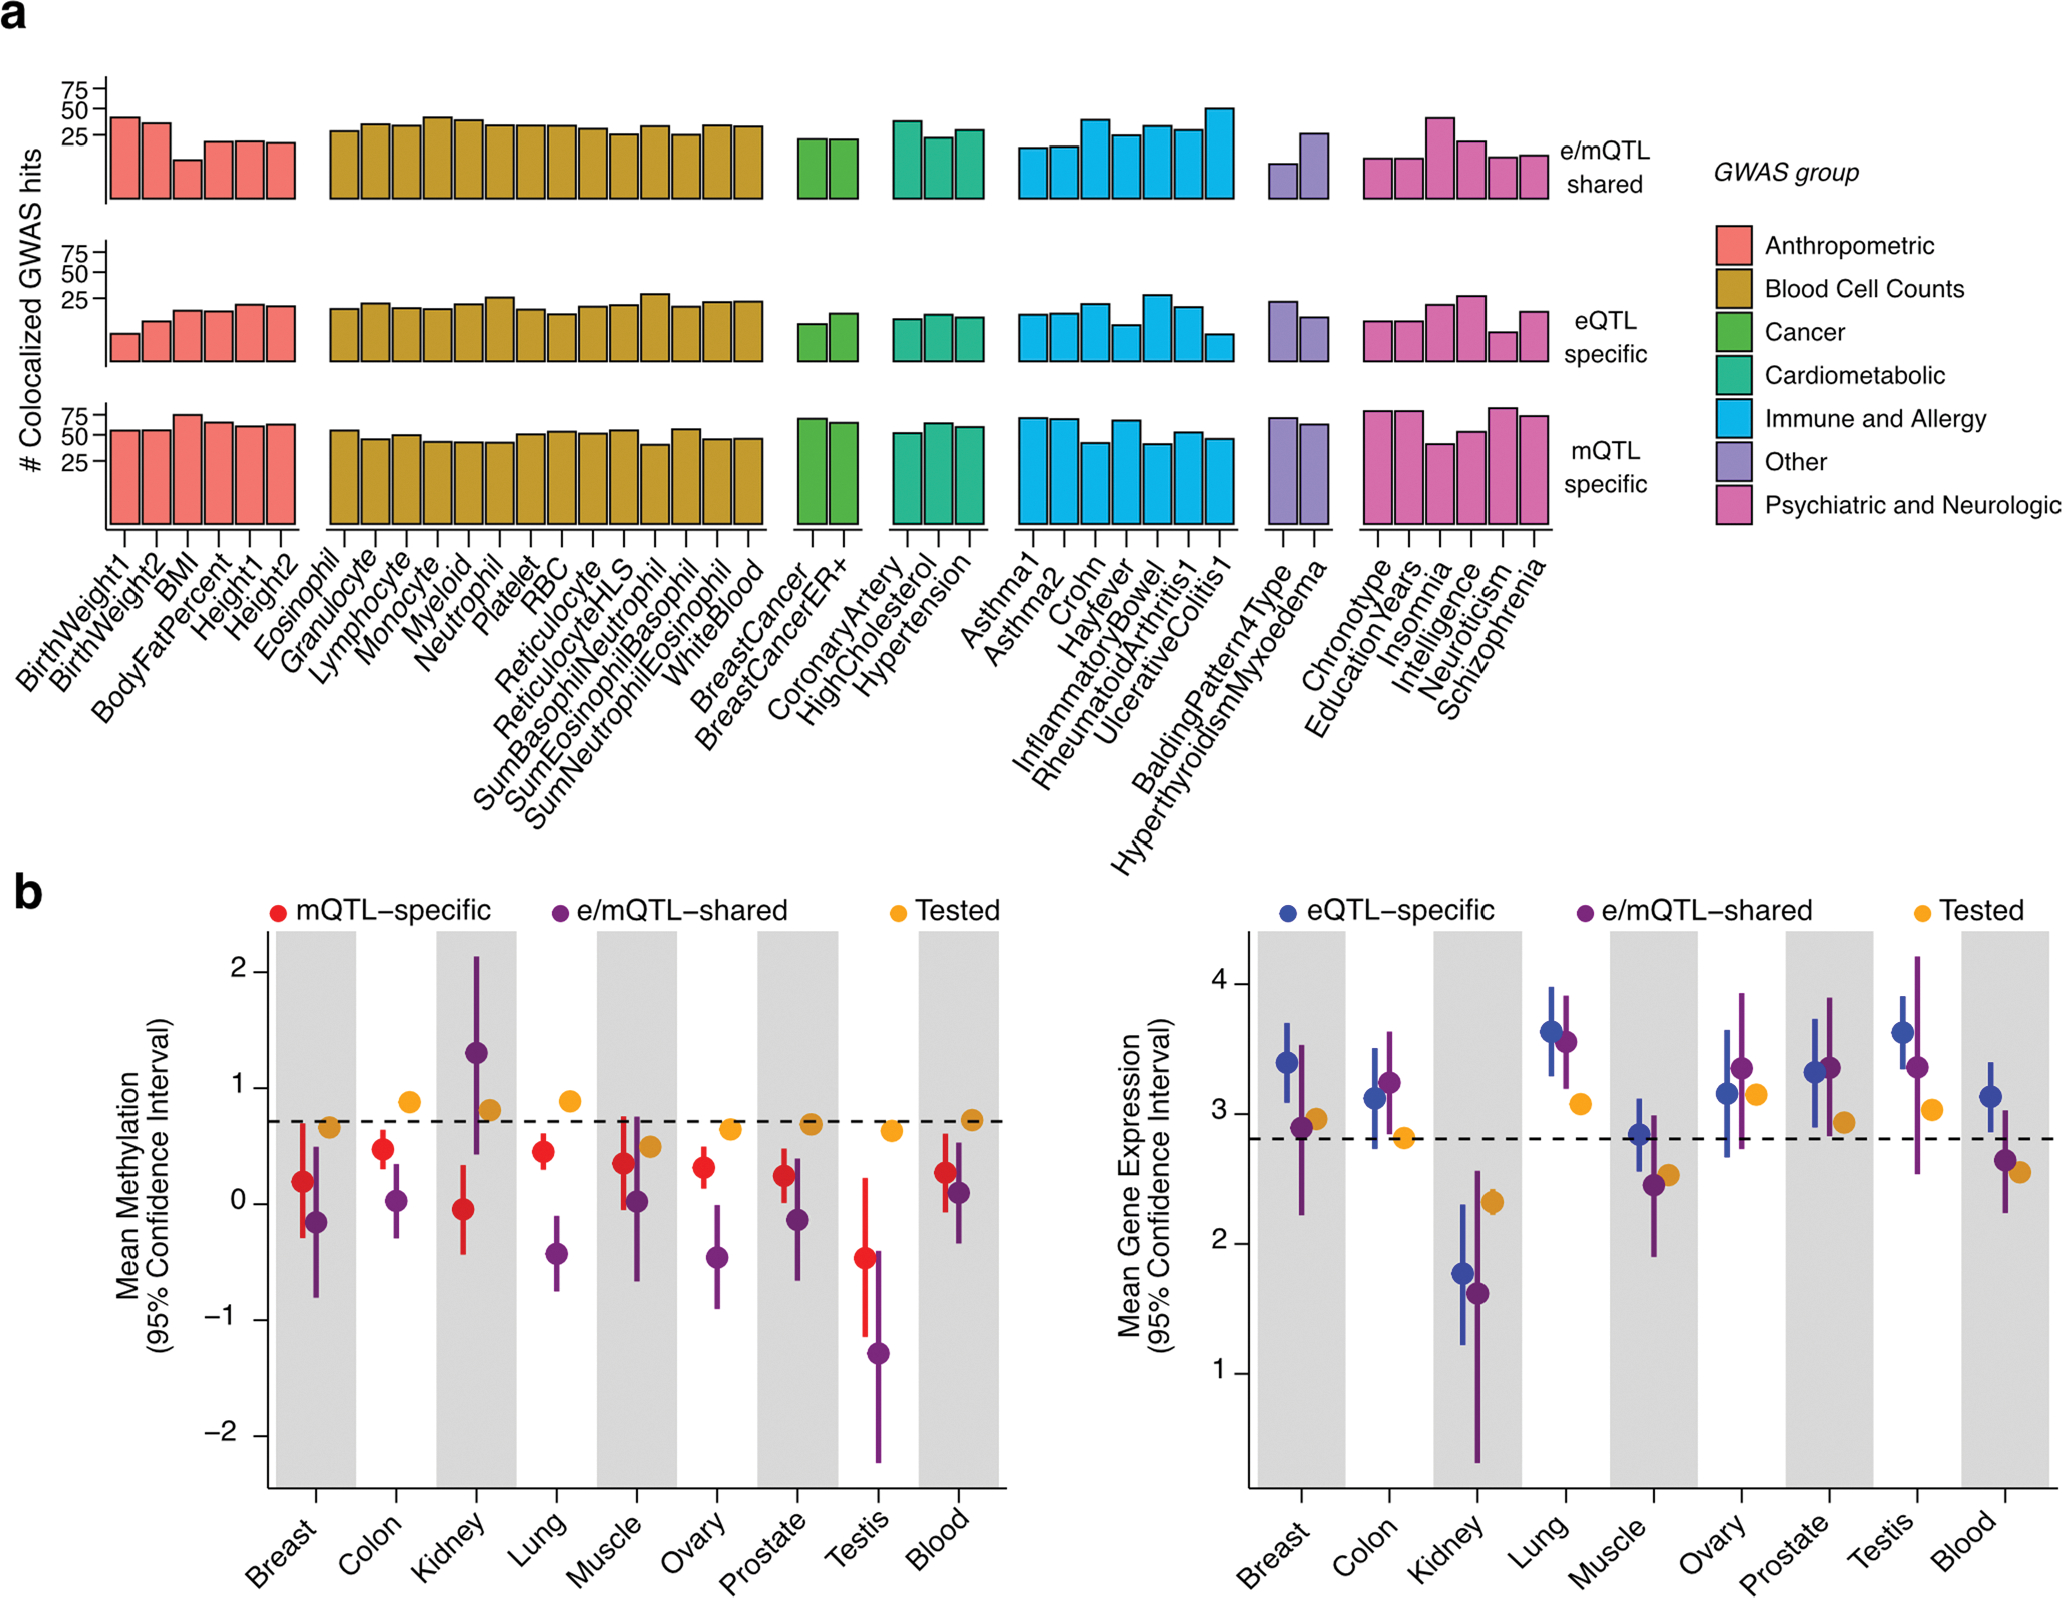
(a) Percent of QTL-colocalized GWAS hits (y axis) per GWAS trait (x axis) stratified by GWAS trait category and colocalization group (see Fig. 4). Only GWAS traits with > = 10 colocalized GWAS hits are displayed. (b) Mean DNAm - in M-values - of mCpGs (left panel) and gene expression - in log2(TPM + 1) - of eGenes (right panel) tested for colocalization, stratified by tissue and colocalization group (see Fig. 4). Mean DNAm and gene expression across tissues is indicated by a dashed line. Whiskers represent the 95% confidence interval of the mean, calculated based on 5,000 replications of bootstrapped samples (random sampling with replacement). The number of mCpGs/eGenes (N) tested per bootstrap is as follows: NMeanMethylation = (12472|51|124), (147806|306|1111), (17574|24|221), (157356|359|1234), (13623|45|162), (127008|147|1041), (65147|103|60), (13576|38|101), (20127|126|254) and NMeanGeneExpression = (10050|27|168), (10800|110|103), (1147|4|22), (13053|144|149), (12594|33|218), (5120|55|47), (6744|43|75), (17025|18|164), (11545|95|291) for QTL-GWAS tested, e/mQTL-shared and e/mQTL-specific eGenes/mCpGs in Breast|Col on|Kidney|Lung|Muscle|Ovary|Prostate|Testis|Blood tissues, respectively.
Extended Data Fig. 10 |. Breast cancer linked e/mQTLs in the TERT-CLPTM1L locus.
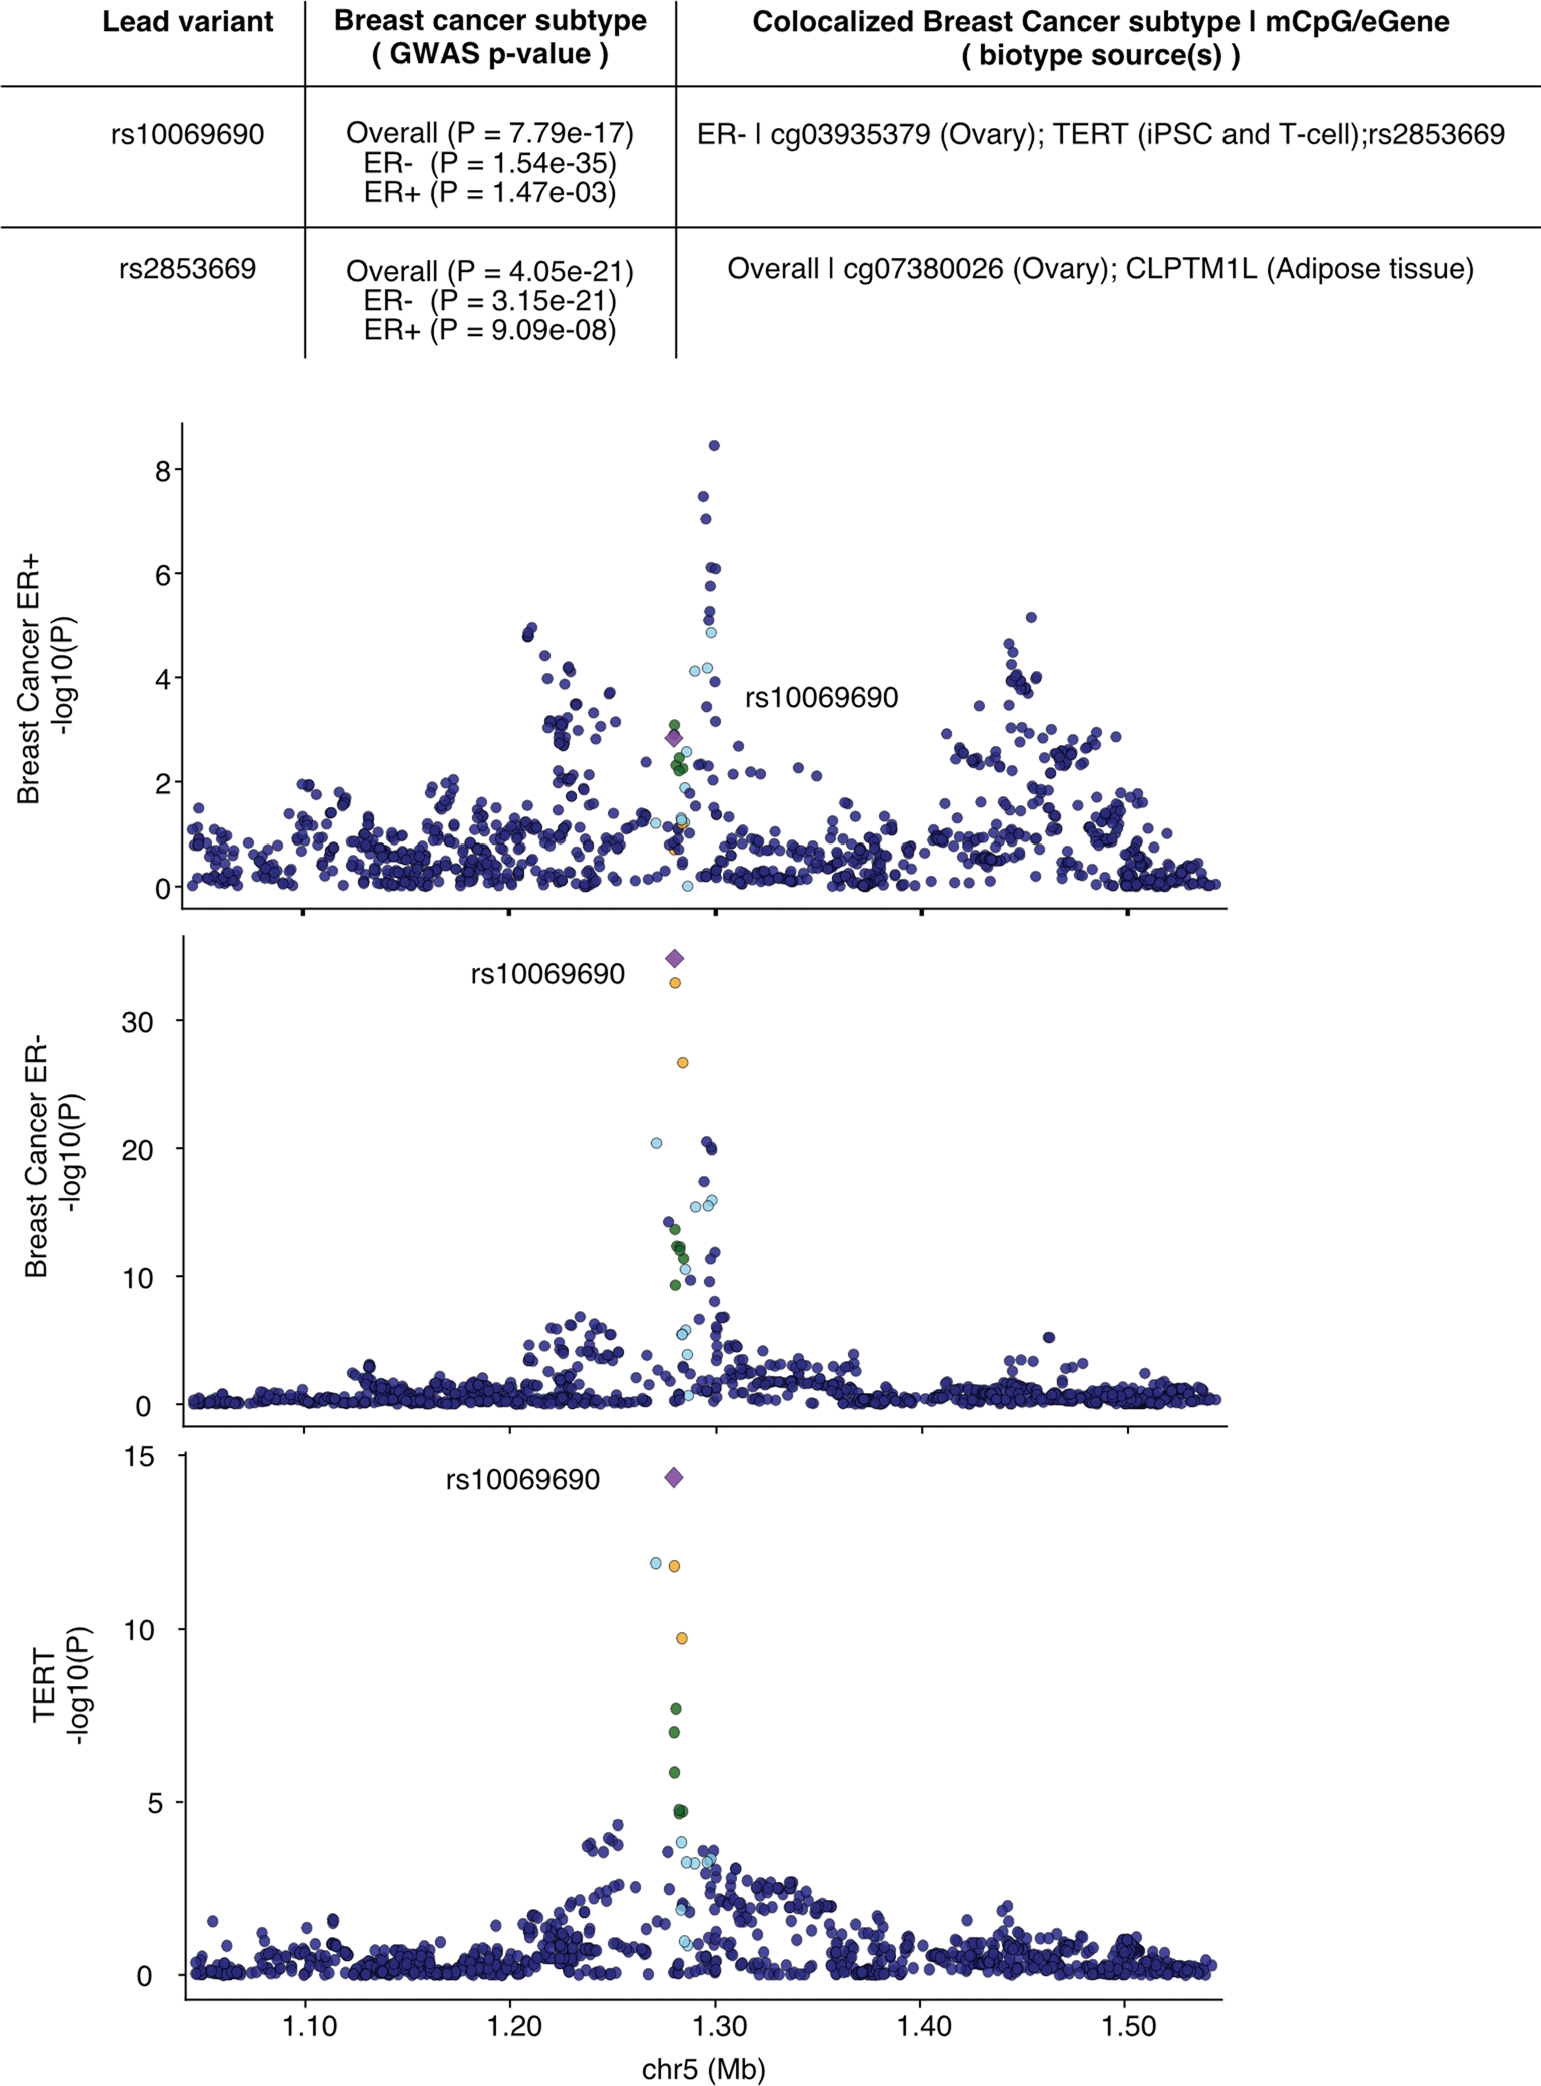
Colocalized molecular phenotypes for this locus, identified by breast cancer GWAS-QTL multivariate colocalization approach (Methods), are provided in the top summary table. The mQTLs colocalizing with these breast cancer GWAS signals (that is, mCpGs cg03935379 and cg07380026) are shown in Fig. 5a, b. Additional details are provided in Supplementary Table 8. Plots illustrate association p-values in the locus for breast cancer estrogen positive (ER+) GWAS (top panel), breast cancer estrogen negative (ER−) GWAS (middle panel) and TERT eQTL signal in induced pluripotent stem cells (iPSCs) (bottom panel). Genotype-phenotype association p-values correspond to rs10069690, lead signal for breast cancer ER- GWAS. Linkage disequilibrium between loci is quantified by squared Pearson coefficient of correlation (r2) in population from European origin. Breast GWAS p-values were obtained from Milne et al. 2017, and iPSC TERT eQTL p-values from Bonder et al 2021. Mb: mega base. P-values correspond to nominal GWAS or QTL associations, derived from multiple regression two-sided t-tests.
Supplementary Material
Acknowledgements
This work was supported by grants U01 HG007601 (to B.L.P.), R35ES028379 (to B.L.P.), 2R01 GM108711 (to L.S.C) and U24 CA210993-SUB (to L.S.C) and was completed in part with computational resources provided by the Center for Research Informatics at the University of Chicago. The funders had no role in study design, data collection and analysis, decision to publish or preparation of the manuscript. We thank the donors and their families for their generous gifts of biospecimens to the GTEx research project; the Genomics Platform at the Broad Institute for data generation; F. Aguet, J. Nedzel and K. Ardlie for sample delivery logistics and data release management; D. Delgado and L. Tong for assistance with assessing mQTL replication; and M. Goraj, J. Witkos, J. Degner and J. Resztak for comments on an earlier version of the manuscript.
Footnotes
Competing interests
The authors declare no competing interests.
Code availability
Code for QTL and eQTM mapping, functional enrichment, and colocalization, as well as code to to generate manuscript figures, is available at the github repository (https://github.com/meritxellop/eGTEx_mQTLs_eQTLs_GWAS) and archived at zenodo (https://doi.org/10.5281/zenodo.7106660)99.
Online content
Any methods, additional references, Nature Portfolio reporting summaries, source data, extended data, supplementary information, acknowledgements, peer review information; details of author contributions and competing interests; and statements of data and code availability are available at https://doi.org/10.1038/s41588-022-01248-z.
Reporting summary
Further information on research design is available in the Nature Portfolio Reporting Summary linked to this article.
Extended data is available for this paper at https://doi.org/10.1038/s41588-022-01248-z.
Supplementary information The online version contains supplementary material available at https://doi.org/10.1038/s41588-022-01248-z.
Peer review information Nature Genetics thanks the anonymous reviewers for their contribution to the peer review of this work.
Reprints and permissions information is available at www.nature.com/reprints.
Data availability
Summary statistics of mQTLs are available at the GTEx Portal (https://gtexportal.org/home/datasets). DNAm normalized data is available at GEO (GSE213478). All GTEx protected data are available via dbGaP (phs000424.v9); access to the DNAm raw data is provided through the AnVIL platform (https://anvil.terra.bio/#workspaces/anvil-datastorage/AnVIL_GTEx_V9_hg38). Independent linkage disequilibrium blocks coordinates to define GWAS hit loci, colocalization summary statistics and priors, single-tissue functional annotation enrichment statistics, and data to generate figures, are available at Figshare (https://figshare.com/projects/DNA_methylation_QTL_mapping_across_diverse_human_tissues_provides_molecular_links_between_genetic_variation_and_complex_traits/149524).
References
- 1.Nicolae DL et al. Trait-associated SNPs are more likely to be eQTLs: annotation to enhance discovery from GWAS. PLoS Genet. 6, e1000888 (2010). [DOI] [PMC free article] [PubMed] [Google Scholar]
- 2.Cano-Gamez E & Trynka G From GWAS to function: Using functional genomics to identify the mechanisms underlying complex diseases. Front. Genet. 11, 424 (2020). [DOI] [PMC free article] [PubMed] [Google Scholar]
- 3.GTEx Consortium et al. Genetic effects on gene expression across human tissues. Nature 550, 204–213 (2017). [DOI] [PMC free article] [PubMed] [Google Scholar]
- 4.GTEx Consortium. The GTEx Consortium atlas of genetic regulatory effects across human tissues. Science 369, 1318–1330 (2020). [DOI] [PMC free article] [PubMed] [Google Scholar]
- 5.Barbeira AN et al. Exploiting the GTEx resources to decipher the mechanisms at GWAS loci. Genome Biol. 22, 49 (2021). [DOI] [PMC free article] [PubMed] [Google Scholar]
- 6.Ongen H et al. Estimating the causal tissues for complex traits and diseases. Nat. Genet. 49, 1676–1683 (2017). [DOI] [PubMed] [Google Scholar]
- 7.Gamazon ER et al. Using an atlas of gene regulation across 44 human tissues to inform complex disease- and trait-associated variation. Nat. Genet. 50, 956–967 (2018). [DOI] [PMC free article] [PubMed] [Google Scholar]
- 8.Banovich NE et al. Methylation QTLs are associated with coordinated changes in transcription factor binding, histone modifications, and gene expression levels. PLoS Genet. 10, e1004663 (2014). [DOI] [PMC free article] [PubMed] [Google Scholar]
- 9.Li E, Beard C & Jaenisch R Role for DNA methylation in genomic imprinting. Nature 366, 362–365 (1993). [DOI] [PubMed] [Google Scholar]
- 10.Payer B & Lee JT X chromosome dosage compensation: how mammals keep the balance. Annu. Rev. Genet. 42, 733–772 (2008). [DOI] [PubMed] [Google Scholar]
- 11.Maurano MT et al. Role of DNA methylation in modulating transcription factor occupancy. Cell Rep. 12, 1184–1195 (2015). [DOI] [PubMed] [Google Scholar]
- 12.Jin Z & Liu Y DNA methylation in human diseases. Genes Dis. 5, 1–8 (2018). [DOI] [PMC free article] [PubMed] [Google Scholar]
- 13.Kaminsky ZA et al. DNA methylation profiles in monozygotic and dizygotic twins. Nat. Genet. 41, 240–245 (2009). [DOI] [PubMed] [Google Scholar]
- 14.Chen L et al. Genetic drivers of epigenetic and transcriptional variation in human immune cells. Cell 167, 1398–1414.e24 (2016). [DOI] [PMC free article] [PubMed] [Google Scholar]
- 15.van Dongen J et al. Genetic and environmental influences interact with age and sex in shaping the human methylome. Nat. Commun. 7, 11115 (2016). vol. [DOI] [PMC free article] [PubMed] [Google Scholar]
- 16.Cheung WA et al. Functional variation in allelic methylomes underscores a strong genetic contribution and reveals novel epigenetic alterations in the human epigenome. Genome Biol. 18, 1–21 (2017). [DOI] [PMC free article] [PubMed] [Google Scholar]
- 17.Volkov P et al. A genome-wide mQTL analysis in human adipose tissue identifies genetic variants associated with DNA methylation, gene expression and metabolic traits. PLoS One 11, e0157776 (2016). [DOI] [PMC free article] [PubMed] [Google Scholar]
- 18.Hannon E et al. Methylation QTLs in the developing brain and their enrichment in schizophrenia risk loci. Nat. Neurosci. 19, 48–54 (2016). [DOI] [PMC free article] [PubMed] [Google Scholar]
- 19.Morrow JD et al. Human lung DNA methylation quantitative trait loci colocalize with chronic obstructive pulmonary disease genome-wide association loci. Am. J. Respir. Crit. Care Med. 197, 1275–1284 (2018). [DOI] [PMC free article] [PubMed] [Google Scholar]
- 20.Taylor DL et al. Integrative analysis of gene expression, DNA methylation, physiological traits, and genetic variation in human skeletal muscle. Proc. Natl Acad. Sci. U. S. A. 116, 10883–10888 (2019). [DOI] [PMC free article] [PubMed] [Google Scholar]
- 21.Huan T et al. Genome-wide identification of DNA methylation QTLs in whole blood highlights pathways for cardiovascular disease. Nat. Commun. 10, 4267 (2019). [DOI] [PMC free article] [PubMed] [Google Scholar]
- 22.Andrews SV et al. Cross-tissue integration of genetic and epigenetic data offers insight into autism spectrum disorder. Nat. Commun. 8, 1–10 (2017). [DOI] [PMC free article] [PubMed] [Google Scholar]
- 23.Ng B et al. An xQTL map integrates the genetic architecture of the human brain’s transcriptome and epigenome. Nat. Neurosci. 20, 1418–1426 (2017). [DOI] [PMC free article] [PubMed] [Google Scholar]
- 24.Gibbs JR et al. Abundant quantitative trait loci exist for DNA methylation and gene expression in human brain. PLoS Genet. 6, e1000952 (2010). [DOI] [PMC free article] [PubMed] [Google Scholar]
- 25.Gutierrez-Arcelus M et al. Passive and active DNA methylation and the interplay with genetic variation in gene regulation. Elife 2, e00523 (2013). [DOI] [PMC free article] [PubMed] [Google Scholar]
- 26.Gutierrez-Arcelus M et al. Tissue-specific effects of genetic and epigenetic variation on gene regulation and splicing. PLoS Genet. 11, e1004958 (2015). [DOI] [PMC free article] [PubMed] [Google Scholar]
- 27.Schulz H et al. Genome-wide mapping of genetic determinants influencing DNA methylation and gene expression in human hippocampus. Nat. Commun. 8, 1511 (2017). vol. [DOI] [PMC free article] [PubMed] [Google Scholar]
- 28.Do C et al. Mechanisms and disease associations of haplotype-dependent allele-specific DNA methylation. Am. J. Hum. Genet. 98, 934–955 (2016). [DOI] [PMC free article] [PubMed] [Google Scholar]
- 29.Grundberg E et al. Global analysis of DNA methylation variation in adipose tissue from twins reveals links to disease-associated variants in distal regulatory elements. Am. J. Hum. Genet. 93, 876–890 (2013). 11/. [DOI] [PMC free article] [PubMed] [Google Scholar]
- 30.Bell JT et al. DNA methylation patterns associate with genetic and gene expression variation in HapMap cell lines. Genome Biol. 12, R10 (2011). [DOI] [PMC free article] [PubMed] [Google Scholar]
- 31.McClay JL et al. High density methylation QTL analysis in human blood via next-generation sequencing of the methylated genomic DNA fraction. Genome Biol. 16, 291 (2015). [DOI] [PMC free article] [PubMed] [Google Scholar]
- 32.Pierce BL et al. Co-occurring expression and methylation QTLs allow detection of common causal variants and shared biological mechanisms. Nat. Commun. 9, 804 (2018). [DOI] [PMC free article] [PubMed] [Google Scholar]
- 33.Min JL et al. Genomic and phenotypic insights from an atlas of genetic effects on DNA methylation. Nat. Genet. 53, 1311–1321 (2021). [DOI] [PMC free article] [PubMed] [Google Scholar]
- 34.Bonder MJ et al. Disease variants alter transcription factor levels and methylation of their binding sites. Nat. Genet. 49, 131 (2017). [DOI] [PubMed] [Google Scholar]
- 35.Qi T et al. Identifying gene targets for brain-related traits using transcriptomic and methylomic data from blood. Nat. Commun. 9, 1–12 (2018). [DOI] [PMC free article] [PubMed] [Google Scholar]
- 36.Schultz MD et al. Human body epigenome maps reveal noncanonical DNA methylation variation. Nature 523, 212–216 (2015). [DOI] [PMC free article] [PubMed] [Google Scholar]
- 37.Kerimov N et al. A compendium of uniformly processed human gene expression and splicing quantitative trait loci. Nat. Genet. 53, 1290–1299 (2021). [DOI] [PMC free article] [PubMed] [Google Scholar]
- 38.Zheng Z et al. QTLbase: an integrative resource for quantitative trait loci across multiple human molecular phenotypes. Nucleic Acids Res. 48, D983–D991 (2020). [DOI] [PMC free article] [PubMed] [Google Scholar]
- 39.eGTEx Project. Enhancing GTEx by bridging the gaps between genotype, gene expression, and disease. Nat. Genet. 49, 1664–1670 (2017). [DOI] [PMC free article] [PubMed] [Google Scholar]
- 40.Kim S et al. Expression quantitative trait methylation analysis reveals methylomic associations with gene expression in childhood asthma. Chest 158, 1841–1856 (2020). [DOI] [PMC free article] [PubMed] [Google Scholar]
- 41.Bommarito PA & Fry RC The role of DNA methylation in gene regulation, in Toxicoepigenetics (eds. McCullough SD & Dolinoy DC) 127–151 (Academic Press, 2019). [Google Scholar]
- 42.Urbut SM, Wang G, Carbonetto P & Stephens M Flexible statistical methods for estimating and testing effects in genomic studies with multiple conditions. Nat. Genet. 51, 187–195 (2019). [DOI] [PMC free article] [PubMed] [Google Scholar]
- 43.Brown AA et al. Predicting causal variants affecting expression by using whole-genome sequencing and RNA-seq from multiple human tissues. Nat. Genet. 49, 1747–1751 (2017). [DOI] [PubMed] [Google Scholar]
- 44.Perzel Mandell KA et al. Genome-wide sequencing-based identification of methylation quantitative trait loci and their role in schizophrenia risk. Nat. Commun. 12, 5251 (2021). [DOI] [PMC free article] [PubMed] [Google Scholar]
- 45.Ziller MJ et al. Charting a dynamic DNA methylation landscape of the human genome. Nature 500, 477–481 (2013). [DOI] [PMC free article] [PubMed] [Google Scholar]
- 46.Schübeler D Function and information content of DNA methylation. Nature 517, 321–326 (2015). [DOI] [PubMed] [Google Scholar]
- 47.Bell CG The epigenomic analysis of human obesity. Obesity 25, 1471–1481 (2017). [DOI] [PubMed] [Google Scholar]
- 48.Villicaña S & Bell JT Genetic impacts on DNA methylation: research findings and future perspectives. Genome Biol. 22, 127 (2021). [DOI] [PMC free article] [PubMed] [Google Scholar]
- 49.Pai AA, Pritchard JK & Gilad Y The genetic and mechanistic basis for variation in gene regulation. PLoS Genet. 11, e1004857 (2015). [DOI] [PMC free article] [PubMed] [Google Scholar]
- 50.Wang M et al. Identification of DNA motifs that regulate DNA methylation. Nucleic Acids Res. 47, 6753–6768 (2019). [DOI] [PMC free article] [PubMed] [Google Scholar]
- 51.Wu Y et al. Integrative analysis of omics summary data reveals putative mechanisms underlying complex traits. Nat. Commun. 9, 918 (2018). [DOI] [PMC free article] [PubMed] [Google Scholar]
- 52.Zhang W, Spector TD, Deloukas P, Bell JT & Engelhardt BE Predicting genome-wide DNA methylation using methylation marks, genomic position, and DNA regulatory elements. Genome Biol. 16, 14 (2015). [DOI] [PMC free article] [PubMed] [Google Scholar]
- 53.Liu Y et al. GeMes, clusters of DNA methylation under genetic control, can inform genetic and epigenetic analysis of disease. Am. J. Hum. Genet. 94, 485–495 (2014). [DOI] [PMC free article] [PubMed] [Google Scholar]
- 54.Goode EL et al. A genome-wide association study identifies susceptibility loci for ovarian cancer at 2q31 and 8q24. Nat. Genet. 42, 874–879 (2010). [DOI] [PMC free article] [PubMed] [Google Scholar]
- 55.Kar SP et al. Network-based integration of GWAS and gene expression identifies a HOX-centric network associated with serous ovarian cancer risk. Cancer Epidemiol. Biomark. Prev. 24, 1574–1584 (2015). [DOI] [PMC free article] [PubMed] [Google Scholar]
- 56.Shah N & Sukumar S The Hox genes and their roles in oncogenesis. Nat. Rev. Cancer 10, 361–371 (2010). [DOI] [PubMed] [Google Scholar]
- 57.Zhao T, Hu Y, Zang T & Wang Y Integrate GWAS, eQTL, and mQTL data to identify Alzheimer’s disease-related genes. Front. Genet. 10, 1021 (2019). [DOI] [PMC free article] [PubMed] [Google Scholar]
- 58.Soliai MM et al. Multi-omics colocalization with genome-wide association studies reveals a context-specific genetic mechanism at a childhood onset asthma risk locus. Genome Med. 13, 157 (2021). [DOI] [PMC free article] [PubMed] [Google Scholar]
- 59.Bojesen SE et al. Multiple independent variants at the TERT locus are associated with telomere length and risks of breast and ovarian cancer. Nat. Genet. 45, 371–384 (2013). 384e1–2. [DOI] [PMC free article] [PubMed] [Google Scholar]
- 60.Huan T et al. Genome-wide identification of microRNA expression quantitative trait loci. Nat. Commun. 6, 6601 (2015). [DOI] [PMC free article] [PubMed] [Google Scholar]
- 61.Giambartolomei C et al. A Bayesian framework for multiple trait colocalization from summary association statistics. Bioinformatics 34, 2538–2545 (2018). [DOI] [PMC free article] [PubMed] [Google Scholar]
- 62.Gleason KJ, Yang F, Pierce BL, He X & Chen LS Primo: integration of multiple GWAS and omics QTL summary statistics for elucidation of molecular mechanisms of trait-associated SNPs and detection of pleiotropy in complex traits. Genome Biol. 21, 236 (2020). [DOI] [PMC free article] [PubMed] [Google Scholar]
- 63.Nasser J et al. Genome-wide enhancer maps link risk variants to disease genes. Nature 593, 238–243 (2021). [DOI] [PMC free article] [PubMed] [Google Scholar]
- 64.Fishilevich S et al. GeneHancer: genome-wide integration of enhancers and target genes in GeneCards. Database 2017, bax028 (2017). [DOI] [PMC free article] [PubMed] [Google Scholar]
- 65.Eales JM et al. Uncovering genetic mechanisms of hypertension through multi-omic analysis of the kidney. Nat. Genet. 53, 630–637 (2021). [DOI] [PubMed] [Google Scholar]
- 66.Ghoussaini M et al. Open Targets Genetics: systematic identification of trait-associated genes using large-scale genetics and functional genomics. Nucleic Acids Res. 49, D1311–D1320 (2021). [DOI] [PMC free article] [PubMed] [Google Scholar]
- 67.Maunakea AK, Chepelev I, Cui K & Zhao K Intragenic DNA methylation modulates alternative splicing by recruiting MeCP2 to promote exon recognition. Cell Res. 23, 1256–1269 (2013). [DOI] [PMC free article] [PubMed] [Google Scholar]
- 68.Umans BD, Battle A & Gilad Y Where are the disease-associated eQTLs? Trends Genet. 37, 109–124 (2021). [DOI] [PMC free article] [PubMed] [Google Scholar]
- 69.Kapoor M et al. Multi-omics integration analysis identifies novel genes for alcoholism with potential overlap with neurodegenerative diseases. Nat. Commun. 12, 5071 (2021). [DOI] [PMC free article] [PubMed] [Google Scholar]
- 70.Hemani G, Bowden J & Davey Smith G Evaluating the potential role of pleiotropy in Mendelian randomization studies. Hum. Mol. Genet. 27, R195–R208 (2018). [DOI] [PMC free article] [PubMed] [Google Scholar]
- 71.Niemöller C et al. Bisulfite-free epigenomics and genomics of single cells through methylation-sensitive restriction. Commun. Biol. 4, 153 (2021). [DOI] [PMC free article] [PubMed] [Google Scholar]
- 72.Nuñez JK et al. Genome-wide programmable transcriptional memory by CRISPR-based epigenome editing. Cell 184, 2503–2519.e17 (2021). [DOI] [PMC free article] [PubMed] [Google Scholar]
- 73.Hawe JS et al. Genetic variation influencing DNA methylation provides insights into molecular mechanisms regulating genomic function. Nat. Genet. 54, 18–29 (2022). [DOI] [PubMed] [Google Scholar]
- 74.Jiang L et al. A quantitative proteome map of the human body. Cell 83, 269–283.e19 (2020). [DOI] [PMC free article] [PubMed] [Google Scholar]
- 75.Rizzardi LF et al. Human brain region-specific variably methylated regions are enriched for heritability of distinct neuropsychiatric traits. Genome Biol. 22, 116 (2021). [DOI] [PMC free article] [PubMed] [Google Scholar]
- 76.Siminoff LA, Wilson-Genderson M, Gardiner HM, Mosavel M & Barker KL Consent to a postmortem tissue procurement study: Distinguishing family decision makers’ knowledge of the Genotype-Tissue Expression Project. Biopreserv. Biobank. 16, 200–206 (2018). [DOI] [PMC free article] [PubMed] [Google Scholar]
- 77.Ali T, Renkawitz R & Bartkuhn M Insulators and domains of gene expression. Curr. Opin. Genet. Dev. 37, 17–26 (2016). [DOI] [PubMed] [Google Scholar]
- 78.Morris TJ et al. ChAMP: 450k Chip Analysis Methylation Pipeline. Bioinformatics 30, 428–430 (2014). [DOI] [PMC free article] [PubMed] [Google Scholar]
- 79.Pidsley R et al. Critical evaluation of the Illumina MethylationEPIC BeadChip microarray for whole-genome DNA methylation profiling. Genome Biol. 17, 208 (2016). [DOI] [PMC free article] [PubMed] [Google Scholar]
- 80.Fortin J-P, Triche TJ Jr & Hansen KD Preprocessing, normalization and integration of the Illumina HumanMethylationEPIC array with minfi. Bioinformatics 33, 558–560 (2017). [DOI] [PMC free article] [PubMed] [Google Scholar]
- 81.Triche TJ Jr, Weisenberger DJ, Van Den Berg D, Laird PW & Siegmund KD Low-level processing of Illumina Infinium DNA Methylation BeadArrays. Nucleic Acids Res. 41, e90 (2013). [DOI] [PMC free article] [PubMed] [Google Scholar]
- 82.Teschendorff AE et al. A beta-mixture quantile normalization method for correcting probe design bias in Illumina Infinium 450 k DNA methylation data. Bioinformatics 29, 189–196 (2013). [DOI] [PMC free article] [PubMed] [Google Scholar]
- 83.Suzuki R & Shimodaira H pvclust: Hierarchical Clustering with P-Values via Multiscale Bootstrap Resampling. https://CRAN.R-project.org/package=pvclust (2015).
- 84.Stegle O, Parts L, Piipari M, Winn J & Durbin R Using probabilistic estimation of expression residuals (PEER) to obtain increased power and interpretability of gene expression analyses. Nat. Protoc. 7, 500–507 (2012). [DOI] [PMC free article] [PubMed] [Google Scholar]
- 85.Leek JT & Storey JD Capturing heterogeneity in gene expression studies by surrogate variable analysis. PLoS Genet. 3, 1724–1735 (2007). [DOI] [PMC free article] [PubMed] [Google Scholar]
- 86.Storey JD & Tibshirani R Statistical significance for genomewide studies. Proc. Natl Acad. Sci. U. S. A. 100, 9440–9445 (2003). [DOI] [PMC free article] [PubMed] [Google Scholar]
- 87.Ongen H, Buil A, Brown AA, Dermitzakis ET & Delaneau O Fast and efficient QTL mapper for thousands of molecular phenotypes. Bioinformatics 32, 1479–1485 (2016). [DOI] [PMC free article] [PubMed] [Google Scholar]
- 88.Wen X Molecular QTL discovery incorporating genomic annotations using Bayesian false discovery rate control. Ann. Appl. Stat. 10, 1619–1638 (2016). [Google Scholar]
- 89.Giambartolomei C et al. Bayesian test for colocalisation between pairs of genetic association studies using summary statistics. PLoS Genet. 10, e1004383 (2014). [DOI] [PMC free article] [PubMed] [Google Scholar]
- 90.Phelan CM et al. Identification of 12 new susceptibility loci for different histotypes of epithelial ovarian cancer. Nat. Genet. 49, 680–691 (2017). [DOI] [PMC free article] [PubMed] [Google Scholar]
- 91.Berisa T & Pickrell JK Approximately independent linkage disequilibrium blocks in human populations. Bioinformatics 32, 283–285 (2016). [DOI] [PMC free article] [PubMed] [Google Scholar]
- 92.Wen X, Pique-Regi R & Luca F Integrating molecular QTL data into genome-wide genetic association analysis: Probabilistic assessment of enrichment and colocalization. PLoS Genet. 13, e1006646 (2017). [DOI] [PMC free article] [PubMed] [Google Scholar]
- 93.Pividori M et al. PhenomeXcan: Mapping the genome to the phenome through the transcriptome. Sci. Adv. 6 (2020). [DOI] [PMC free article] [PubMed] [Google Scholar]
- 94.Hukku A et al. Probabilistic colocalization of genetic variants from complex and molecular traits: promise and limitations. Am. J. Hum. Genet. 108, 25–35 (2021). [DOI] [PMC free article] [PubMed] [Google Scholar]
- 95.Wen X, Lee Y, Luca F & Pique-Regi R Efficient integrative multi-SNP association analysis via deterministic approximation of posteriors. Am. J. Hum. Genet. 98, 1114–1129 (2016). [DOI] [PMC free article] [PubMed] [Google Scholar]
- 96.Foley CN et al. A fast and efficient colocalization algorithm for identifying shared genetic risk factors across multiple traits. Nat. Commun. 12, 764 (2021). [DOI] [PMC free article] [PubMed] [Google Scholar]
- 97.Võsa U et al. Large-scale cis- and trans-eQTL analyses identify thousands of genetic loci and polygenic scores that regulate blood gene expression. Nat. Genet. 53, 1300–1310 (2021). [DOI] [PMC free article] [PubMed] [Google Scholar]
- 98.Bonder MJ et al. Identification of rare and common regulatory variants in pluripotent cells using population-scale transcriptomics. Nat. Genet. 53, 313–321 (2021). [DOI] [PMC free article] [PubMed] [Google Scholar]
- 99.Oliva M eGTEx_mQTLs_eQTLs_GWAS: DNA methylation QTL mapping across diverse human tissues provides molecular links between genetic variation and complex traits. Code resource. GitHub: https://github.com/meritxellop/eGTEx_mQTLs_eQTLs_GWAS; Zenodo: https://doi.org/10.5281/zenodo.7106660 [DOI] [PMC free article] [PubMed] [Google Scholar]
Associated Data
This section collects any data citations, data availability statements, or supplementary materials included in this article.
Supplementary Materials
Data Availability Statement
Summary statistics of mQTLs are available at the GTEx Portal (https://gtexportal.org/home/datasets). DNAm normalized data is available at GEO (GSE213478). All GTEx protected data are available via dbGaP (phs000424.v9); access to the DNAm raw data is provided through the AnVIL platform (https://anvil.terra.bio/#workspaces/anvil-datastorage/AnVIL_GTEx_V9_hg38). Independent linkage disequilibrium blocks coordinates to define GWAS hit loci, colocalization summary statistics and priors, single-tissue functional annotation enrichment statistics, and data to generate figures, are available at Figshare (https://figshare.com/projects/DNA_methylation_QTL_mapping_across_diverse_human_tissues_provides_molecular_links_between_genetic_variation_and_complex_traits/149524).


