Abstract
The performance of computational tools that can predict human splice sites are reviewed using a test set of EST-confirmed splice sites. The programs (namely HMMgene, NetGene2, HSPL, NNSPLICE, SpliceView and GeneID-3) differ from one another in the degree of discriminatory information used for prediction. The results indicate that, as expected, HMMgene and NetGene2 (which use global as well as local coding information and splice signals) followed by HSPL (which uses local coding information and splice signals) performed better than the other three programs (which use only splice signals). For the former three programs, one in every three false positive splice sites was predicted in the vicinity of true splice sites while only one in every 12 was expected to occur in such a region by chance. The persistence of this observation for programs (namely FEXH, GRAIL2, MZEF, GeneID-3, HMMgene and GENSCAN) that can predict all the potential exons (including optimal and sub-optimal) was assessed. In a high proportion (>50%) of the partially correct predicted exons, the incorrect exon ends were located in the vicinity of the real splice sites. Analysis of the distribution of proximal false positives indicated that the splice signals used by the algorithms are not strong enough to discriminate particularly those false predictions that occur within ± 25 nt around the real sites. It is therefore suggested that specialised statistics that can discriminate real splice sites from proximal false positives be incorporated in gene prediction programs.
INTRODUCTION
Computational gene prediction tools are now essential components of genome sequencing projects. The publicly available tools for human gene prediction include HMMgene (1,2), GeneID (3,4), FGENEH (5), FGENESH (6), GENSCAN (7,8), Genie (9,10), GeneParser (11), GeneBuilder (12) and many others (see 13). Previously, Burset and Guigo created a test data set of vertebrate genes and systematically evaluated the performance of available tools (14). Their results indicated that the sensitivity of prediction at the nucleotide level ranged from 60 to 77% and the fraction of actual exons identified was in the range of 40–60%. Upon subsequent improvements, the authors of the individual tools claimed increased performance on the above-mentioned test set. GENSCAN correctly predicted 78% of exons at a specificity of 81% (8) and HMMgene predicted 74% of exons at a specificity of 78% (2). These programs predicted 90–93% of coding nucleotides at a specificity of 90–93%. However, when the programs were benchmarked with a newly determined and experimentally annotated genomic region (namely the human BRCA2 region) of 1.4 Mb size, the best performing tool could identify only 69% of the exons at a specificity of 65% (15).
The above observations suggest that the current programs need to be improved in their prediction of the exact boundaries of exons. Such an improvement is essential before attempts are made to predict alternative splicing, which is exhibited by at least 35% of human genes (16). For successful prediction of such splice variants, it is essential that the programs can predict not only a single set of optimal exons, but also reliable sub-optimal exons. It is recognised that the overall performance of the gene prediction programs depends upon the ability to pinpoint the correct splice sites (17). For the above reasons, we undertook to review the methods that predict all the potential splice sites and exons, rather than just the integrated methods that find a single best-predicted gene. We recently created a data set of EST-confirmed splice sites from human sequences (18). In this data set, 50 nt length regions upstream and downstream of real splice sites were checked for the absence of alternative splice sites. This high quality data set was used in this study.
The programs reviewed here are either stand-alone applications or are part of gene prediction tools. They use different degrees of discriminatory information conforming to one or more of the following steps of the current methodologies for gene prediction: (i) the donor and acceptor splice sites are predicted; (ii) combinations of the predicted donor and acceptor sites in conjunction with coding potential and length are used to predict putative exons; (iii) the in context (a term coined by Burge and Karlin; 17) information such as the compatibility in reading frame among adjacent exons and with other gene structural elements are used to identify the most probable exons; (iv) the optimal exons, which upon assembly give the single best-predicted gene that maximises the combined associated probabilities of constituent elements, are obtained.
Of the six splice site prediction programs tested in this study, a set of three programs that utilised coding potential in addition to splice signals emerged as the best performing programs. One in every three of their predicted false positive splice sites was found to be located in the vicinity of a real splice site. The results of another set of six programs that predict putative (including optimal and sub-optimal) exons were checked to see if this observation persisted. In a high proportion of the partially correct predicted exons (a major form of false positive), the incorrect splice sites were found to be located in the vicinity of real splice sites. Analysis of the distribution of proximal false positives indicated that the splice signals used by the algorithms are not strong enough to discriminate particularly those false predictions that occur within ± 25 nt around the real sites.
MATERIALS AND METHODS
Programs and test data sets used for splice site predictions
Programs. Six programs were used in this report: HMMgene (1,2), NetGene2 (19,20), NNSPLICE (21,22), HSPL (15,23), SpliceView (24,25) and GeneID-3 (4). Since HMMgene and GeneID-3 are gene prediction programs, they were executed with the option of listing all the potential splice sites. The programs can be classified as belonging to two classes: HMMgene, NetGene2 and HSPL use both splice signals and coding information while the other three programs use only splice signals. While SpliceView uses a classification approach based on a set of consensus sequences, other programs use methods such as discriminant functions, neural network approaches and hidden Markov models. NetGene2 differs from HSPL in that it is not truly a local splice predictor but uses a longer range of the surrounding sequences (extending as far as 200–600 nt) and also uses global coding potential information such as the distances between potential splice sites. HMMgene differs from NetGene2 and HSPL in that only those splice sites that can fit in one of the many possible gene structures are listed.
Test data set. We had earlier reported a set of human EST-confirmed splice sites comprising 619 donor and 623 acceptor sites (18). Gene sequences comprising these splice sites were considered as test sequences. Of these sequences, we ignored those that showed alternative functional splice sites in the vicinity (–50 to +50 nt region) of real splice sites. Since certain sequences possessed such splice variants at either the donor site or the acceptor site but not both sites, it resulted in separate test sets of sequences for studies dealing with donor sites or with acceptor sites. The test set for donor sites comprised 125 sequence entries with 474 annotated sites of which 414 had EST confirmation, and that for acceptor sites comprised 114 sequence entries with 452 annotated sites of which 382 had EST confirmation.
Measures of prediction performance. Performances of splice site prediction programs were assessed by the following parameters: (i) sensitivity (Sn), i.e. the proportion of true splice sites that are correctly predicted by the program; (ii) specificity (Sp), i.e. the proportion of predicted splice sites that are actually true splice sites; (iii) corrected specificity (CSp), i.e. the specificity as calculated by considering from every gene only those false positives that had a score greater than or equal to that of true positive splice sites of the gene.
Characterisation of positional distribution of false positive sites. The positional distribution of false positive sites along the gene was characterised by examining their relative locations on the gene with reference to real splice sites. A region of –50 to +50 nt around a real splice site was termed ‘proximal’ or ‘in the vicinity’ and the region outside these limits was termed ‘distal’. The total length of such proximal regions for the 474 test donor junctions was 47 400 bases and that for the 452 test acceptor junctions was 45 200. The total length of sequences used for donor site prediction was 557 287 and that for acceptor site prediction was 541 579. If the false positives are randomly distributed along the length of the gene, then 8.5% (= 47 400/557 287) of the predicted false positive donor sites would be expected to occur by chance in the vicinity of real donor sites. The equivalent figure in the case of acceptor sites is 8.4%.
Programs and test set used for predicting all potential exons independently of the method for finding the single best-predicted gene
Programs. Six different programs that can predict putative exons were used in this study. Of these, three are stand-alone exon prediction programs: FEXH (15,23), GRAIL2 (26,27) and MZEF (28,29). The other three are gene prediction programs: GeneID-3 (4), HMMgene (1,2) and GENSCAN (7,8). These three programs can also list either all the potential exons (e.g. GeneID-3), all the sub-optimal exons (e.g. GENSCAN) or the exons from a given number of best-predicted genes (e.g. HMMgene). MZEF can predict overlapping exons in addition to the set of most probable exons. MZEF was executed with the option of listing 10 overlapping exons, HMMgene with the option of listing the top five best-predicted genes, GENSCAN with the option of listing all the sub-optimal exons and GeneID-3 with the option of listing all the potential exons. FEXH and GRAIL2 do not allow users to input a threshold value for exon probability. MZEF lists only those exons with a posterior probability greater than 0.5. The general method adopted by the programs to predict the exons is to identify an open reading frame bounded by acceptor/donor sites. GeneID-3 first forms all possible exons using the previously predicted splice sites. Subsequently, the exons are ordered by using coding information. In the case of other programs, the coding information is an integral part of the exon prediction. The sub-optimal exons from GENSCAN and HMMgene are conceptually different from those listed by the other programs. These sub-optimal exons can participate in one of the many possible genes that can be predicted from the sequence and thus these exons have been checked for in-frame compatibility.
Test data set. From the EST-confirmed data set, we selected only those genes in which the proximal regions around a donor site as well as the corresponding acceptor site did not possess alternative splice sites. This resulted in 90 genes with a total number of 391 exons, of which only 198 had both the boundaries as coding. Since the above-mentioned programs identify only the coding exons, these 198 internal exons alone were used to measure prediction accuracy.
Programs and test data set used to assess the prediction of optimal exons as extracted from the single best-predicted gene
Five programs were considered in the assessment of exon prediction accuracy as extracted from the single best-predicted gene: GeneID-3, HMMgene, GENSCAN, FGENES (6) and FGENESH (6). The test data set is the same as that described above.
RESULTS
Performance of the splice site prediction programs
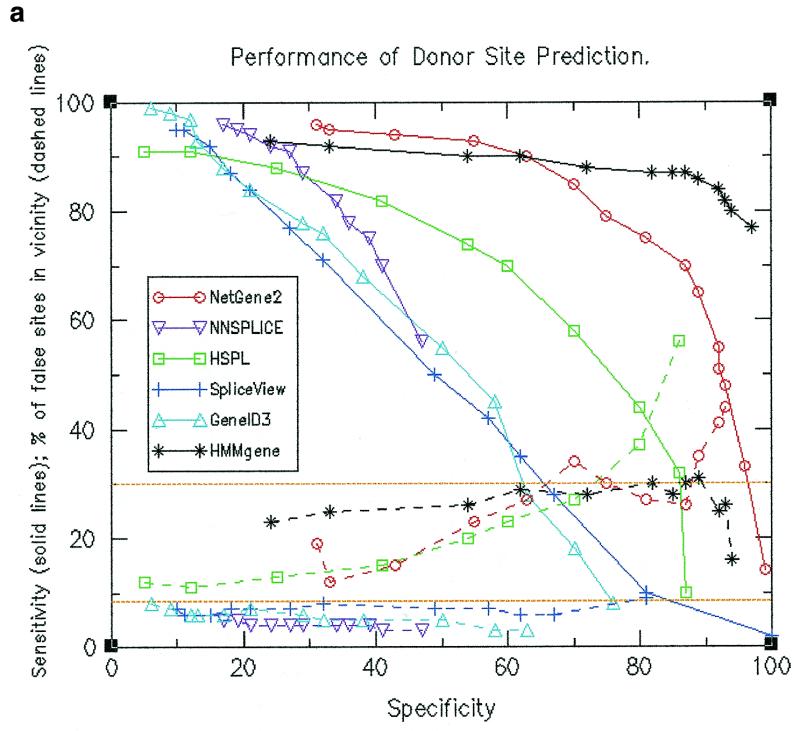
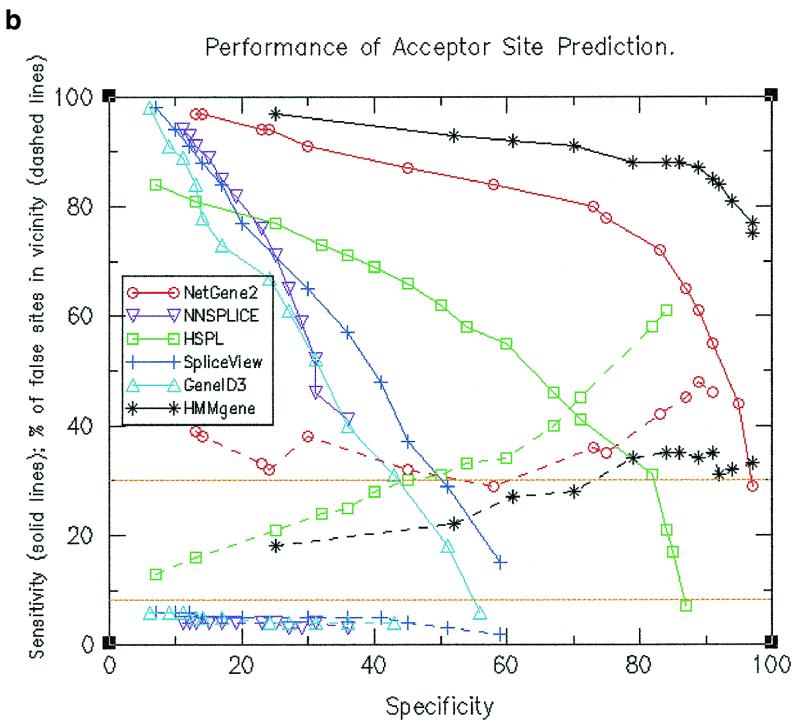
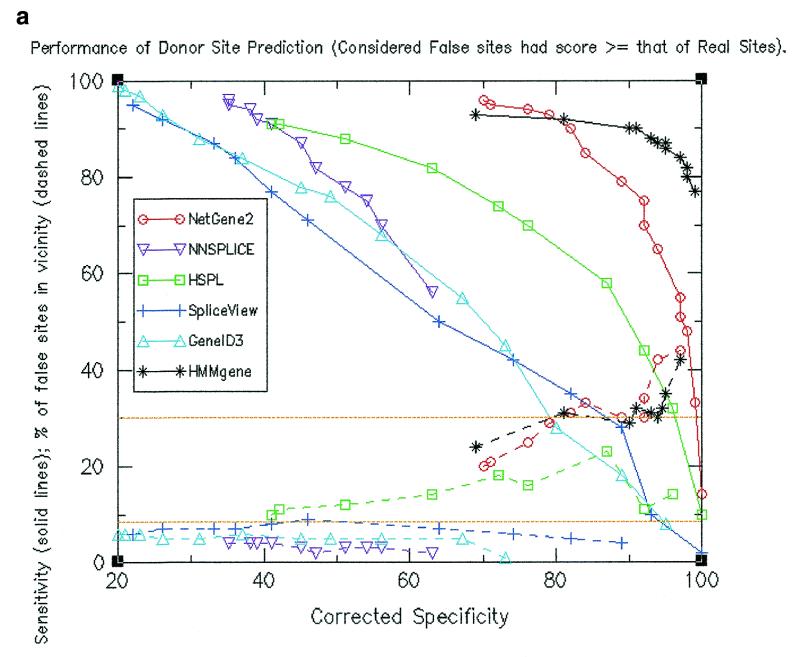
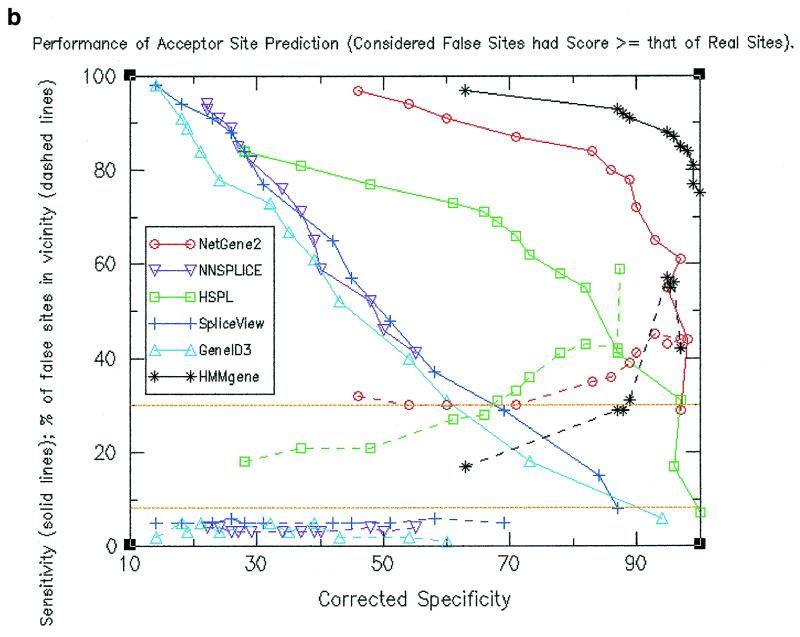
Sensitivity and specificity calculations were made at different threshold values. Resultant values are shown by solid lines in Figure 1a for donor site predictions and in Figure 1b for acceptor site predictions. The figures indicate that at a given specificity value, HMMgene and NetGene2 exhibited higher sensitivity values than the other four programs and (except at lower values of specificity) HSPL showed higher sensitivity as compared to the remaining three programs. HMMgene showed consistently high sensitivity values for a large range of specificity values. The data pertaining to sensitivity and specificity for donor site prediction are summarised below.
Figure 1.
(a) Performance of donor site prediction programs in terms of specificity and sensitivity (shown by solid lines). Also shown are percentage of false positive donor sites that are proximal (shown by dashed lines). (b) Performance of acceptor site prediction programs in terms of specificity and sensitivity (shown by solid lines). Also shown are percentage of false positive acceptor sites that are proximal (shown by dashed lines).
(i) NNSPLICE showed a maximum specificity of only 47% (at a sensitivity of 56%). At this sensitivity level, HMMgene exhibited a specificity close to 100% and NetGene2 exhibited as high as 92%, while HSPL had the next highest value of 70%.
(ii) At a sensitivity of 90%, HMMgene and NetGene2 showed a specificity of ~60% while other programs showed a maximum of 27% (for NNSPLICE). At a sensitivity of ~75%, HMMgene showed a specificity of 97%, NetGene2 showed 81%, while the other programs showed a maximum of 54% with HSPL.
Similar data for acceptor site prediction are summarised below.
(i) NNSPLICE attained a maximum specificity of only 36% (with a corresponding sensitivity of 41%). At this sensitivity level, HMMgene showed a specificity close to 100%, NetGene2 showed 95% and HSPL exhibited the next highest value of 71%.
(ii) At a sensitivity value of 84%, HMMgene had already attained a specificity of 92% and NetGene2 a specificity of 58%, while the other programs showed a maximum of only 17%. At a sensitivity level of 65%, HMMgene showed a specificity close to 100%, NetGene2 showed 87%, while the next highest value was 45% for HSPL.
Performance of splice site predictions in terms of scores attributed to real sites relative to false positives
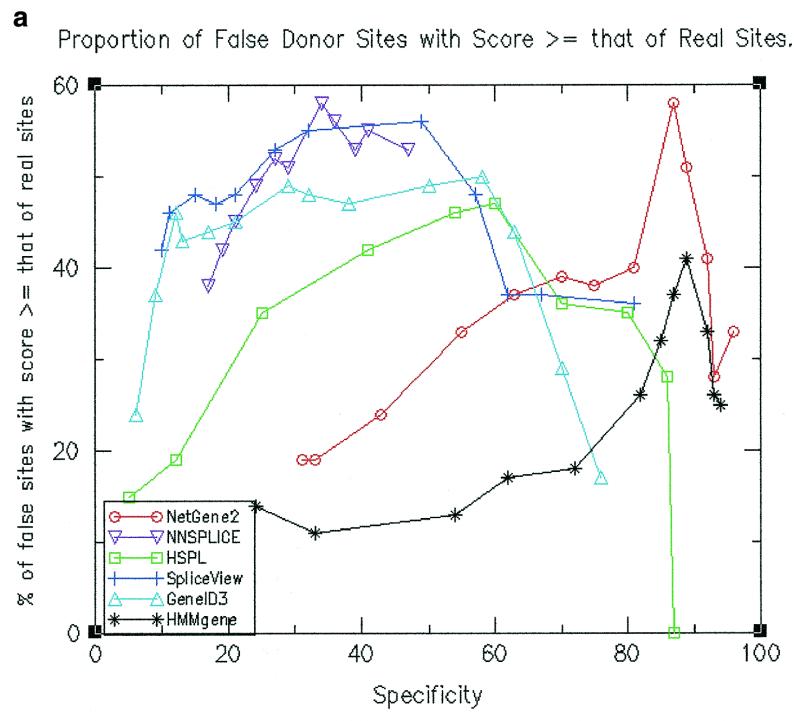
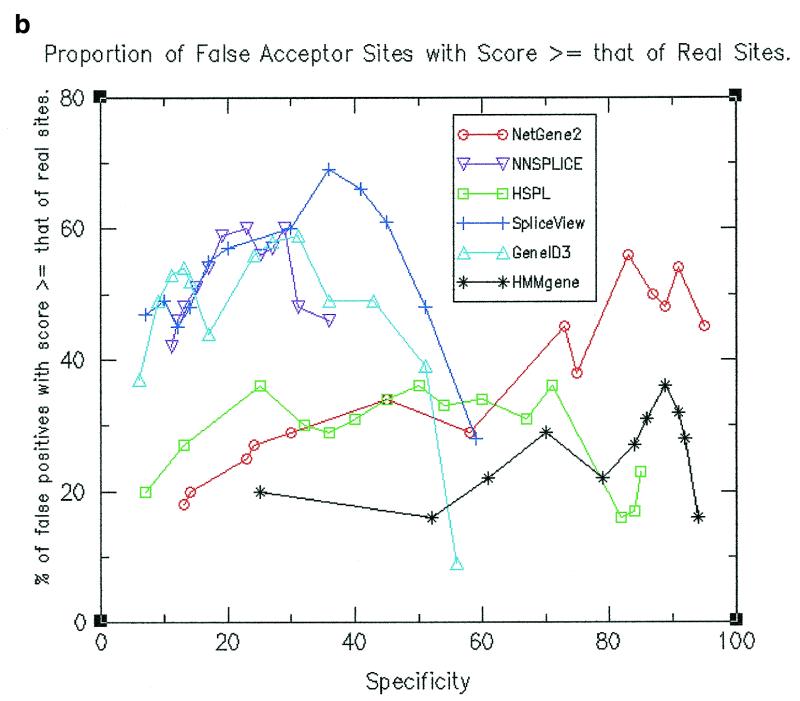
Above a given threshold value for splice site prediction, the predicted splice sites have different scores. One would typically be interested only in the top scoring predicted splice sites and hence it is appropriate to calculate the percentage of false sites that have scores at least that of real sites. Such values were calculated by considering for every gene only those false sites that have a score at least that of real splice sites in the gene. The values are shown in Figure 2a for donor site prediction and in Figure 2b for acceptor site prediction. It can be seen from the figures that the proportion is generally lower for HMMgene and NetGene2 followed by HSPL as compared to the other programs. Thus the assignment of scores for splice sites is more meaningful and decisive in the cases of HMMgene, NetGene2 and HSPL.
Figure 2.
(a) Proportion of false donor sites with a score ≥ that of real donor sites. (b) Proportion of false acceptor sites with a score ≥ that of real acceptor sites.
It is also appropriate to calculate a ‘corrected specificity’ by considering for every gene only those false positives that have a score at least that of real splice sites from the gene. Performance of the programs in terms of corrected specificity (as shown by solid lines in Fig. 3a and b) again pointed to HMMgene and NetGene2 as the best performing programs, followed by HSPL. At every given corrected specificity value, these programs showed higher sensitivity values than other programs.
Figure 3.
(a) Performance of donor site prediction programs in terms of corrected specificity and sensitivity (shown by solid lines). Also shown are corrected percentage of false positive donor sites that are proximal (shown by dashed lines). Only those false positive donor sites with a score ≥ that of real donor sites were considered. (b) Performance of acceptor site prediction programs in terms of corrected specificity and sensitivity (shown by solid lines). Also shown are the corrected percentage of false positive acceptor sites that are proximal (shown by dashed lines). Only those false positive donor sites with a score ≥ that of real acceptor sites were considered.
The data on corrected specificity and sensitivity for donor site prediction are summarised below.
(i) NNSPLICE obtained a maximum corrected specificity of only 63% at a sensitivity of 56%. At this sensitivity level, HMMgene and NetGene2 showed a corrected specificity close to 100%, with HSPL following suit with a corrected specificity of 87%. Other programs showed a value of ~65%.
(ii) At a high sensitivity of 90%, HMMgene showed a corrected specificity of 91%, NetGene2 showed 82% and HSPL showed 42%.
Similar data for acceptor site prediction are summarised below.
(i) Maximum corrected specificity as displayed by NNSPLICE was only 55% at a sensitivity of 41%. At this sensitivity level, HMMgene and NetGene2 showed a corrected specificity close to 100%, with HSPL following suit with a value of 87%. Other programs showed a value of ~55%.
(ii) At a high sensitivity of 91%, HMMgene showed a corrected specificity of 89%, NetGene2 showed 60%, while other programs showed a specificity of ~20%.
Top performing splice site prediction programs
The previous observations indicated that the three programs that use only the splice signals (i.e. NNSPLICE, SpliceView and GeneID-3) were grouped together (see Figs 1–3) and their performances were lower than the other three programs. Of the three programs that use coding information in addition to splice signals, HMMgene was the top performer, along with NetGene2, followed by HSPL. This is expected since they use a higher degree of information than the other three programs (see Materials and Methods). The observation that the programs that use coding information plus splice signals perform better than the programs that use only splice signals has been discussed earlier in the literature (17).
Positional location of false positive splice sites relative to that of real splice sites
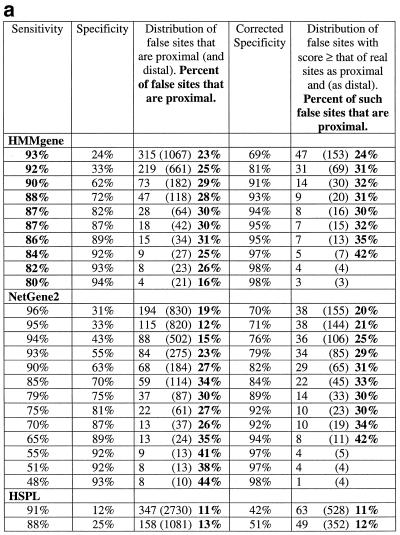
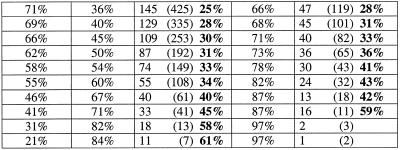
Locations of the predicted false positive sites along the gene were compared to those of true splice sites and were accordingly classified as either ‘proximal’ or ‘distal’. Percentages of false positives that are proximal at different specificity values were calculated (as shown by dashed lines in Fig. 1a and b). The expected percentage of proximal false sites is shown by a baseline at 8.5%. It can be observed in both donor site and acceptor site predictions that a higher than expected number of false positive sites as predicted by HMMgene, NetGene2 and HSPL are proximal. In the case of the other three programs that used only splice signals, a lower than expected number of false positives are proximal. The observation was persistent even when only those false positives having a score at least that of real sites were considered (see Fig. 3a and b). The values for the percentage of false sites that are proximal are shown in Table 1a and b and are summarised below.
Table 1. Proportion of false positive (a) donor sites and (b) acceptor sites that are ‘proximal’ to a real splice sitea.
aThe percentage of false positive donor sites that would occur in the vicinity by chance is 8.5%. The percentage of false positive acceptor sites that would occur in the vicinity by chance is 8.4%
(i) For each of the three programs, the average of the values for the percentage of false splice sites that are proximal was calculated by using the criteria that the specificity should be >30% and the observed number of false sites should be more than 25. Such values for donor site (or acceptor site) predictions were 28% (31%) for HMMgene, 25% (39%) for NetGene2 and 30% (35%) for HSPL. The values when only the false sites with a score at least that of real sites were considered were 30% (27%) for HMMgene, 28% (34%) for NetGene2 and 16% (35%) for HSPL.
(ii) In the case of donor site prediction with HMMgene, at specificity levels of 60–90% the percentage of proximal false sites ranged from 28 to 31% (average 30%). At corrected specificity levels of 90–95% the value ranged from 31 to 35% (average 33%).
(iii) In the case of acceptor site prediction with HMMgene, at specificity levels of 70–94% the percentage of proximal false sites ranged from 28 to 35% (average 33%). At corrected specificity levels of 87–95% the value ranged from 29 to 57% (average 43%).
(iv) In the case of donor site prediction with NetGene2, at specificity levels of 55–93% the percentage of proximal false sites ranged from 23 to 44% (average 33%). At corrected specificity levels of 76–94%, the value ranged from 25 to 44% (average 33%).
(v) In the case of acceptor site prediction with NetGene2, at specificity levels of 14–97% the percentage of proximal false sites ranged from 25 to 48% (average 36%). At corrected specificity levels of 46–97% the value ranged from 25 to 44% (average 36%).
(vi) In the case of donor site prediction with HSPL, at specificity levels of 41–86%, the percentage of proximal false sites ranged from 15 to 56% (average 30%). At the corresponding corrected specificity levels of 63–96% the value ranged from 14 to 23% (average 16%).
(vii) In the case of acceptor site prediction with HSPL, at specificity levels of 13–82% the percentage of proximal false sites ranged from 16 to 58% (average 32%). At the corresponding corrected specificity levels of 37–97% the value ranged from 21 to 59% (average 35%).
The above observations indicate that in the case of these three programs, a higher than expected proportion of the false positive splice sites were located in the vicinity of real splice sites and such a proportion increased as the specificity of prediction increased. This observation was more prominent in the case of acceptor site prediction. On average, one in every three false positive splice sites is located in the vicinity of a real one, while one in every 12 is expected to occur in the vicinity by chance.
Assessment of the observations with programs that predict all potential exons
All putative exons (not only those that form the single best optimal gene) as predicted by GENSCAN, HMMgene, GeneID-3, MZEF, FEXH and GRAIL2 were determined. The predicted exons were checked against the test set of 198 internal exons. Only those predicted exons with either one or both ends correct were considered further. The predicted exons with one end correct are termed ‘partially correct predicted exons’ and they were considered as illustrative examples of false positives. Since only the proximal regions in the test set had been checked for the absence of alternative splice sites, the other types of false positive (e.g. incorrectly predicted and overlapping exons) were not considered. The locations of the predicted incorrect ends in the false positive exons were compared to the correct exon positions along the gene. Accordingly, they were classified as proximal or distal false positives.
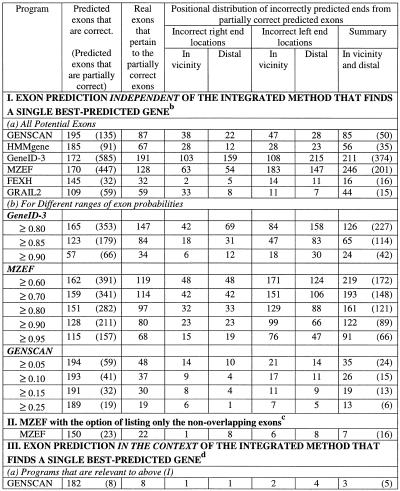
The results of the above positional characterisation are shown in Table 2 and the following observations could be made.
Table 2. Positional characterisation of predicted partially correct exonsa.
aThe test sequences contained 198 exons with both the boundaries as coding.
bThe gene prediction programs used can list all potential splice sites as well as different possible exons. For calculations under ‘independent’, all predicted potential exons (not necessarily from the single best-predicted gene) were considered. MZEF was executed with the option of listing up to 10 overlapping exons. The sub-optimal exons from GENSCAN differ from the potential exons as predicted by other programs in that they are somewhat dependent upon the context. The sub-optimal exon is in-frame in one of the possible valid parses of the sequence. The sub-optimal exons from HMMgene are from the top five best-predicted genes and thus they are dependent upon the context.
cIn the case of MZEF, the predicted exon has a posterior probability value of >0.50. Of a set of predicted overlapping exons, the one with the highest posterior probability is selected as the optimal exon.
dOnly the internal exons from the predicted optimal gene were considered.
(i) The percentage of exons (from the test set of 198 exons) that were predicted correctly varied from 55% for GRAIL2 to 99% for GENSCAN. The values for the other programs are 93% for HMMgene, 87% for GeneID-3, 86% for MZEF and 73% for FEXH.
(ii) The number of predicted exons that were partially correct varied from 32 to 585. The values for the individual programs were: 135 for GENSCAN (with a ratio of predicted exons being correct to predicted exons being partially correct of 1:0.7), 91 for HMMgene (with a ratio of 1:0.5), 585 for GeneID-3 (with a ratio of 1:3.4), 447 for MZEF (with a ratio of 1:2.6), 32 for FEXH (with a ratio of 1:0.2) and 109 for GRAIL2 (with a ratio of 1:0.5). Of the four top performing programs that had higher sensitivity, GENSCAN and HMMgene showed lower values for the ratio. This is due to these two programs listing only those exons that are in-frame for at least one valid parse of the sequence.
(iii) In the case of GeneID-3, 33% of the incorrect ends of partially correct predicted exons were located in the vicinity, while in the case of the other five programs as high as 50% or more were located in the vicinity. The observation that the incorrect ends of partially correct predicted exons were often located in the vicinity of real splice sites persisted for different ranges of exon probabilities (see Table 2).
Performance of optimal exon prediction programs
The sensitivity of exon prediction was reduced when only the optimal exons (as with MZEF) or the exons from a single best-predicted gene (as with GENSCAN, HMMgene and GeneID-3) were considered (see Table 2). While GENSCAN showed a sensitivity of 92%, the others showed only 83 (HMMgene), 75 (MZEF) and 64% (GeneID-3). The overall number of partially correct predicted exons was also reduced considerably in these cases. However, in the case of Gene-ID3, 21 of the 36 incorrect ends of partially correct predicted exons still occurred in the vicinity of real sites.
We further checked the predictions with two more gene prediction programs: FGENES (5,6) and FGENESH (6). These programs gave a higher sensitivity than GENSCAN. The values ranged from 91 to 95%.
DISCUSSION
Characterisation of the positional distribution of false positive sites obtained from programs that can predict splice sites and exons, independently of the method that finds a single best-predicted gene, was carried out. The programs that were used for splice site predictions were HMMgene, NetGene2, HSPL, NNSPLICE, SpliceView and GeneID-3. The programs that were used for exon predictions were GENSCAN, HMMgene, GeneID-3, MZEF, FEXH and GRAIL2. Genes containing EST-confirmed splice sites (whose proximal regions had been checked for the absence of alternative splice sites) were used as the test data set.
Splice site predictions
Performance of the programs was assessed under two situations: (i) all the predicted sites above a given threshold value were considered; (ii) only the top scoring sites for each gene, from the list of predicted sites above a given threshold, were considered. Under both situations, HMMgene and NetGene2 turned out to be the best performing tools, followed by HSPL. The comparatively poor performance of the other three tested programs is as expected because they use only splice signals, whereas the above-named programs use coding potential information in addition. Characterisation of the positional location of false positive sites from these three programs indicated that one in every three false positive sites occurred in the vicinity of real splice sites. Only one in 12 such sites was expected to occur in this vicinity by chance. The fraction of proximal false sites increased as the specificity of prediction increased. It is interesting to note that this observation with HSPL (which uses local coding information) persisted with NetGene2 (which uses global coding information) and with HMMgene (which further checks the suitability of the splice sites in the many possible gene structures).
Exon predictions
Predictions independent of the methods that find the single best-predicted gene. The stand-alone exon prediction programs that were used in this study were FEXH, GRAIL2 and MZEF. In addition, the gene prediction programs GeneID-3, HMMgene and GENSCAN were used with the option of listing all potential exons. The percentage of correctly predicted exons by these programs ranged from 55% for GRAIL2 to 99% for GENSCAN. The corresponding values for HMMgene, GeneID-3, MZEF and FEXH were 93, 87, 86 and 73%, respectively. The ratio of ‘predicted exons that are completely correct’ to ‘predicted exons that are partially correct’ was as high as 1:3.4 for GeneID-3. The ratios in the case of the other three best performing programs, namely GENSCAN, HMMgene and MZEF, were 1:0.7, 1:0.5 and 1:2.6, respectively. Since GENSCAN and HMMgene predict only those exons that are in-frame for at least one possible parse of the sequence, they showed lower values for the ratio. Positional characterisation of the incorrect ends of the partially correct predicted exons indicated that a high proportion of the false positives were located in the vicinity of real splice sites: 33% for GeneID-3 and >50% for MZEF, HMMgene and GENSCAN. Results from FEXH and GRAIL2 also pointed to similar observations.
Predictions using methods that find a single best-predicted gene. GENSCAN, HMMgene and GeneID-3, programs that can predict the optimal exons that assemble to form a single best-predicted gene, were assessed. The percentage of exons predicted correctly is lower than when all the potential exons are predicted. In the case of GeneID-3, the observed high proportion of false positives in the vicinity of real sites still persisted. The observed high performance with the prediction of the single optimal gene for GENSCAN, FGENES and FGENESH, which predicted 91–95% of the exons correctly, is to be considered with caution for the following reasons. (i) Only the predicted internal exons were checked in the study. (ii) It is quite possible that the test set used in the study and the training set used by these programs overlap. Thus, there is a possibility that these programs are tuned to some of the genes in the test set. (iii) As pointed out earlier, results of benchmarking with a newly determined genomic region of BRCA2 (15) indicated lower performances. (iv) In order to predict alternative spliced products, it is essential that the programs show similar performances with the prediction of sub-optimal exons.
Potential explanation for the observed clustering of false positives in the vicinity of true splice sites
The study has indicated that a higher than expected number of false positive sites as predicted by the splice site and exon prediction programs are located in the vicinity (–50 to +50 nt regions) of real splice sites. The average lengths of exons and introns from the data set used were respectively 150 and 900 nt, in agreement with the reports in the literature (30). Given such a length distribution, the above observation is significant.
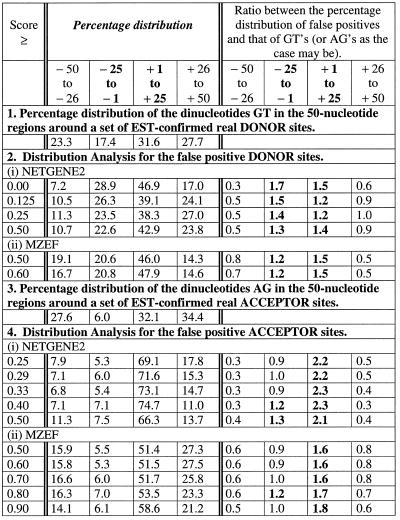
The two basic signals that are used to predict exons are those of coding potential and splice strength. Since the gene prediction programs perform better at detecting coding nucleotides rather than the exact ends of exons, it can be inferred that the coding potential signal often ends not too far from the exon ends. In order to scrutinise this, we examined the distribution of the proximal false positives by considering windows of 25 nt. The programs NetGene2 and MZEF were taken as illustrative examples. The results, presented in Table 3, indicated an uneven distribution and confirm the above opinion.
Table 3. Distribution of the proximal false positive sites in 25 nt windows from the 50 nt region around the real sites.
(i) On average, 67% of the proximal false positive donor sites occurred in the region –25 to +25. A major proportion (42%, NetGene2; 47%, MZEF) of the false positives occurred in the region +1 to +25.
(ii) On average, 71 (NetGene2) and 53% (MZEF) of the proximal false positive acceptor sites were located in the region +1 to +25.
(iii) Only 33% of false positive donor sites and 23% (42%, MZEF) of the false positive acceptor sites occurred in a region encompassing the –50 to –26 and +26 to +50 windows. Results with windows of 10 nt indicated that the number of false positives gradually reduced as we moved away from the real sites starting at ± 30 nt (data not shown).
In situations when the coding potential signal ends too far away, they are taken care of by the splice signals and other global information. This is substantiated by our findings that the reported observation on proximal false positives, made with the programs using only the coding potential information and splice signals, persisted as well as occurred more prominently with those that in addition use global information. This indicated that the distal false positives were somehow eliminated by the global information while the proximal false positives persisted. In order to examine such a proposition, we calculated the ratio between the percentage distribution of false positives and that of the dinucleotides GT (in the case of donor sites) or AG (in the case of acceptor sites) for each of the windows (see Table 3). The dinucleotides GT and AG constitute the invariant components of donor and acceptor splice signals, respectively. The value for such a ratio was substantially higher than 1.0 when the –25 to –1 or +1 to +25 windows were considered. The value was substantially lower than 1.0 in the case of the other two windows. Such an observation may lead to the following implications:
(i) the coding potential signal ends truly more often within ± 25 nt;
(ii) the splice signals used by the algorithms are not strong enough, particularly when the coding potential signal ends close to the exon boundaries, to eliminate such false predictions.
It is possible that the programs tend to pick up exon boundaries in the regions where the coding characteristics disappear. Small shifts due to false predictions around real sites do not change the characteristics that are normally associated with real splice site sequences much, except for the consensus dinucleotide sequences. Current programs are insensitive to such subtle changes.
CONCLUSION
The study has indicated that one in every three false positive splice sites, as predicted by programs that use coding information as well as splice signals, is located in the vicinity of a real splice site. In a similar manner, in 50% or more of the cases of partially correct predicted exons from programs that use splice signals, coding information, length, etc., the incorrect ends are located in the vicinity of a real splice site. This observation was also made with the prediction of sub-optimal exons by gene prediction programs. Analysis of the distribution of such proximal false positives indicated that the algorithms are misled to predict wrong splice sites more often when the coding potential ends within ± 25 nt than when it ends at farther positions. Thus it may be appropriate to incorporate additional specialised statistics that can discriminate real splice sites from proximal false sites in the current programs.
Acknowledgments
ACKNOWLEDGEMENTS
It is a pleasure for the author to thank Alan Robinson for his continued support and also for careful reading of the manuscript. The author would like to thank Moises Burset and Victor Solovyev for discussions on the manuscript. The author gratefully acknowledges Roderic Guigo and Moises Burset, Milanesi Luciano, Martin Reese and Victor Solovyev for either providing a copy of their programs or for executing their programs on the test sequences. In addition, the program authors are thanked for their Email correspondences to clarify any doubts on the methods.
REFERENCES
- 1.Krogh A. (1997) In Gaasterland,T. et al. (eds), Proceedings of the Fifth International Conference on Intelligent Systems for Molecular Biology. AAAI Press, Cambridge, UK, pp. 179–186.
- 2.Krogh A. (1998) http://www.cbs.dtu.dk/services/HMMgene/
- 3.Guigo R., Knudsen,S., Drake,N. and Smith,T. (1992) J. Mol. Biol., 226, 141–157. [DOI] [PubMed] [Google Scholar]
- 4.Burset M., Abrill,J.F. and Guigo,R. (1998) http://apolo.imim.es/geneid.html
- 5.Solovyev V.V., Salamov,A.A. and Lawrence,C.B. (1995) In Rawling,C., Clark,D., Altman,R., Hunter,L., Lengauer,T. and Wodak,S. (eds), Proceedings of the Third International Conference on Intelligent Systems for Molecular Biology. AAAI Press, Cambridge, UK, pp. 367–375.
- 6.Salamov A.A. and Solovyev,V.V. (1999) http://genomic.sanger.ac.uk/gf/gf.html
- 7.Burge C. and Karlin,S. (1997) J. Mol. Biol., 268, 78–94. [DOI] [PubMed] [Google Scholar]
- 8.Burge C (1998) http://gnomic.stanford.edu/GENSCANW.html
- 9.Kulp D., Haussler,D., Reese,M.G. and Eeckman,F.H. (1996) In States,D.J., Agarwal,P., Gaasterland,T., Hunter,L. and Smith,R.F. (eds) Proceedings of the Fourth International Conference on Intelligent Systems for Molecular Biology. AAAI Press, Cambridge, UK, pp. 134–142. [PubMed]
- 10.Kulp D., Reese,M. and Harris,N. (1998) http://www-hgc.lbl.gov/projects/genie.html
- 11.Snyder E.E. and Stormo,G.D. (1995) J. Mol. Biol., 248, 1–18. [DOI] [PubMed] [Google Scholar]
- 12.Milanesi L., D’Angelo,D and Rogozin,I,B. (1999) http://l25.itba.mi.cnr.it/~webgene/genebuilder.html
- 13.Li W. (1999) http://linkage.rockefeller.edu/wli/gene/
- 14.Burset M. and Guigó,R. (1996) Genomics, 34, 353–367. [DOI] [PubMed] [Google Scholar]
- 15.Hubbard T., Birney,E., Bruskiewich,R., Clamp,M., Gilbert,J., King,A., Pocock,M. and Wilming,L. (1999) Abstracts of Papers Presented at the 1999 Meeting on Genome Sequencing and Biology, May 19–May 23, 1999. Cold Spring Harbor Laboratory Press, Cold Spring Harbor, NY, pp. 114–114 [see also http://genomic.sanger.ac.uk/gf/gf.html ].
- 16.Mironov A.A. and Gelfand,M.S. (1998) In Proceedings of the First International Conference on Bioinformatics of Genome Regulation and Structure, BGRS’98, Institute of Cytology and Genetics, Novosibirsk, Russia. Institute of Cytology and Genetics, Novosibirsk, Russia, Vol. 2, pp. 249–250.
- 17.Burge C.B. and Karlin,S. (1998) Curr. Opin. Struct. Biol., 8, 346–354. [DOI] [PubMed] [Google Scholar]
- 18.Thanaraj T.A. (1999) Nucleic Acids Res., 27, 2627–2637. [DOI] [PMC free article] [PubMed] [Google Scholar]
- 19.Brunak S., Engelbrecht,J. and Knudsen,S. (1991) J. Mol. Biol., 220, 49–65. [DOI] [PubMed] [Google Scholar]
- 20.Brunak S. and Rouze,P. (1999) http://www.cbs.dtu.dk/services/NetGene2/
- 21.Reese M.G., Eeckman,F.H., Kulp,D. and Haussler,D. (1997) J. Comp. Biol., 4, 311–323. [DOI] [PubMed]
- 22.Reese M. and Harris,N. (1999) http://www-hgc.lbl.gov/projects/splice.html
- 23.Solovyev V.V., Salamov,A.A. and Lawrence,C.B. (1994) Nucleic Acids Res., 22, 5156–5163. [DOI] [PMC free article] [PubMed] [Google Scholar]
- 24.Rogozin I.B. and Milanesi,L. (1997) J. Mol. Evol., 45, 50–59. [DOI] [PubMed] [Google Scholar]
- 25.Rogozin I.B. and Milanesi,L. (1999) http://125.itha.mi.cnr.it/~webgene/wwwspliceview.html
- 26.Uberbacher E.C. and Mural,R.J. (1991) Proc. Natl Acad. Sci. USA, 88, 11261–11265. [DOI] [PMC free article] [PubMed] [Google Scholar]
- 27.Uberbacher E.C. and Mural,R.J. (1999) http://compbio.ornl.gov/ Grail-bin/EmptyGrailForm
- 28.Zhang M.Q. (1997) Proc. Natl Acad. Sci. USA, 94, 565–568. [DOI] [PMC free article] [PubMed] [Google Scholar]
- 29.Zhang M.Q. (1999) http://sciclio.cshl.org/genefinder/
- 30.Deutsch M. and Long,M. (1999) Nucleic Acids Res., 27, 3219–3228. [DOI] [PMC free article] [PubMed] [Google Scholar]


