Abstract
Acute lymphoblastic leukemia (ALL) has a striking propensity to metastasize to the central nervous system (CNS). In contrast to solid tumor brain metastases, ALL seldom involves the parenchyma but is isolated to the leptomeninges, an infrequent site for carcinomatous invasion. While CNS metastasis is characteristic across ALL subtypes, a unifying mechanism for invasion has not been determined. Here we show that ALL cells in circulation are unable to breach the blood brain barrier; instead, they migrate into the CNS along vessels that passage directly between vertebral or calvarial bone marrow (BM) and the subarachnoid space. The basement membrane of these bridging vessels is enriched in laminin, known to coordinate neuronal progenitor cell pathfinding in the CNS. The laminin receptor α6 integrin is expressed in most ALL cases. We found that α6/laminin mediated ALL migration toward cerebrospinal fluid (CSF) in vitro. ALL-xenografted mice treated with either a PI3Kδ inhibitor that decreased ALL α6 expression or specific α6 neutralizing antibodies showed significantly less ALL transit along bridging vessels, CSF blast counts and CNS disease symptoms despite minimally decreased BM disease burden. Our data suggest that α6 integrin expression, common in ALL, allows cells to coopt neural migratory pathways to invade the CNS.
In the absence of CNS-directed prophylactic treatment, CNS disease involvement occurs in 30-70% of ALL patients.1 CNS metastasis is observed in all subtypes of ALL, suggesting that lymphoblasts utilize a conserved molecular mechanism to invade the CNS. CNS ALL relapse predicts poor outcomes, but treatment options remain limited.2
The enzyme PI3K plays a critical role transducing extracellular signals that regulate cell growth and survival.3 The delta isoform of PI3K (PI3Kδ) is uniquely expressed in immune cells and neurons, and the PI3Kδ inhibitor idelalisib is approved to treat indolent B cell lymphomas.4,5 Idelalisib’s efficacy in acute B cell malignancies is not established; we therefore examined the role of PI3Kδ inhibition in the Nalm-6 model of ALL. The Nalm-6 pre-B ALL cell line was derived from a patient who suffered a CNS disease relapse. It generates a reproducible pattern of disease in SCID mice mimicking ALL development in patients, including CNS invasion. At approximately 40 days post-intravenous engraftment, all mice display symptoms of CNS involvement occurring prior to death from progressive BM disease, with lower extremity paresis the usual clinical endpoint for sacrifice.
PI3Kδ blockade reduces CNS disease burden
Using a PI3Kδ inhibitor tool compound, GS-649443, that has a suitable pharmacokinetic profile in mice, we treated Nalm-6 engrafted mice daily with vehicle or inhibitor beginning at day 1 or day 20 post-engraftment (Fig. 1a) and continuing until reaching a clinical endpoint for sacrifice. We observed an almost 50% prolongation of survival in early and late GS-649443 treatment arms, with most GS-649443-treated mice sacrificed secondary to BM failure (Fig. 1b). Strikingly, the incidence of CNS disease symptoms at time of sacrifice in treated mice was decreased by approximately 6- and 3-fold in the early vs. late treatment initiation groups respectively (Fig. 1c).
Figure 1: PI3Kδ inhibition blocks ALL CNS progression in vivo.
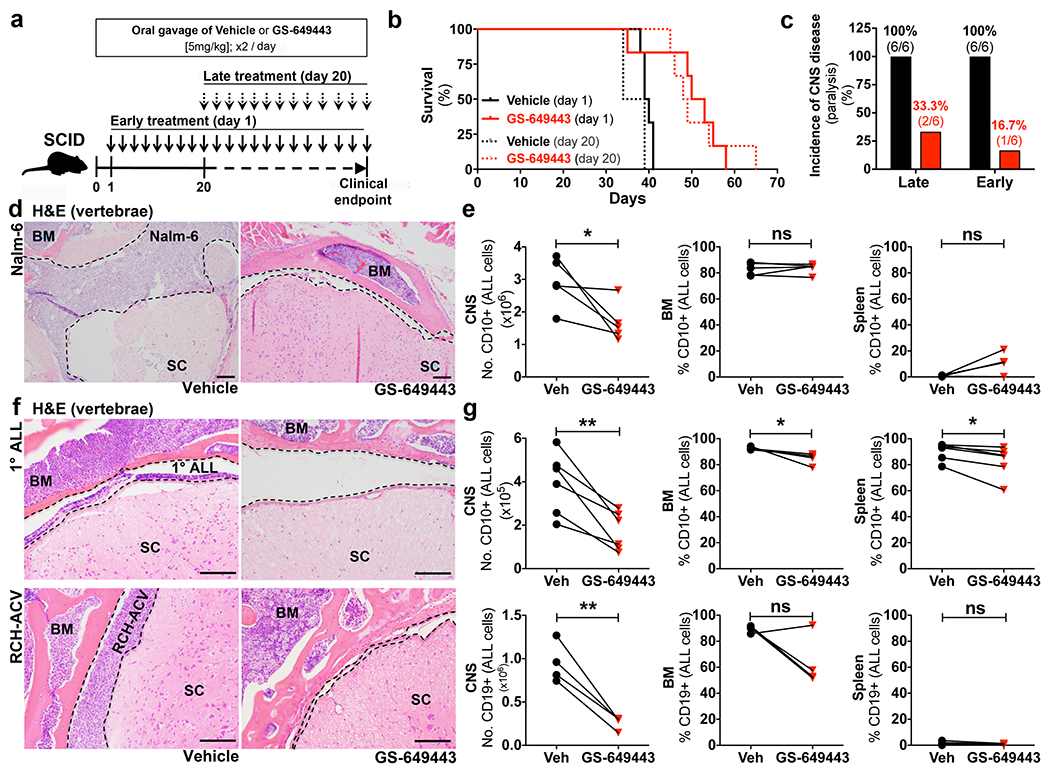
a, GS-649443 treatment schema. b, Kaplan-Meier survival curves (two-sided log rank Mantel-Cox, n = 6 mice per treatment group, Late treatment: P=0.0039, Early: P = 0.0146). c, Incidence of hind limb paralysis at time of sacrifice (n = 6 mice per treatment group). d, Nalm-6 ALL in subarachnoid space (dashed line) of spinal cord (SC) (n = 14 treated mice, 7 vehicle mice). e, Disease burden in vehicle and GS-649443-treated Nalm-6 mice sacrificed at matched time points (paired two-sided Student’s t-test, n = 5 mice per treatment group, P = 0.0473). f, Primary human and RCH-ACV ALL in subarachnoid space of SC (1° ALL: n = 6 treated mice, 7 vehicle mice, RCH-ACV: n = 4 mice per treatment group). g, Disease burden in vehicle or GS-649443-treated 1° human and RCH-ACV ALL-engrafted mice (paired two-sided Student’s t-test, 1° human: n = 5 mice per treatment group, RCH-ACV: n = 4 mice per treatment group, * P = <0.05, ** < 0.01). Scale bars, 100μm.
To determine whether the low incidence of CNS involvement in these mice reflected delayed disease progression in the periphery, we compared the tumor burden in BM, spleen and CNS of GS-649443 or vehicle-treated mice at matched time points. Paired PI3Kδ inhibitor and vehicle-treated mice were sacrificed simultaneously when either reached a clinical endpoint. As shown in Figs. 1d, e and Extended Data Fig. 1a,b, there was no significant difference between BM or splenic Nalm-6 disease burden or peripheral blood cell counts in inhibitor vs. vehicle-treated mice. In contrast, there was approximately a 50% decrease in CNS disease burden among paired mice (Fig. 1e and Extended Data Fig. 1c).
To confirm that our results were not isolated to the Nalm-6 cell line, we next tested the efficacy of PI3Kδ inhibition in the RCH-ACV ALL model, which exhibits symptomatic CNS involvement with similar frequency, and in NSG mice engrafted with primary human ALL. Similar to our results in Nalm-6 mice, single agent PI3Kδ inhibition markedly decreased CNS disease in these models, but only minimally diminished peripheral disease burden (Figs. 1f,g and Extended Data Fig. 1d–i). These findings suggested that GS-649443 inhibited ALL CNS progression independently of its effects on peripheral disease. Initially, we hypothesized that PI3Kδ signalling was necessary for ALL proliferation or survival in the CNS microenvironment. We therefore first examined whether the PI3Kδ inhibitor GS-649443 could penetrate the blood brain barrier (BBB) in healthy or leukemic mice. As shown in Fig. 2a and Extended Data Fig. 2a, mean serum concentrations of GS-649443 were approximately 200-350 nM, while compound concentrations in brain tissue of healthy or end-stage leukemic mice were less than 5 nM, well below inhibitory concentrations (Extended Data Fig. 2c,d). Analysis of CSF blasts isolated from GS-649443 vs. vehicle-treated mice revealed no differences in apoptotic or mitotic indices, further indicating that the dramatic effect of PI3Kδ inhibition on CNS disease progression did not occur through direct effects on ALL growth or viability (Extended Data Fig. 2e–g). This turned our attention to the potential function of PI3Kδ in ALL metastasis from the periphery to the CNS.
Figure 2: PI3Kδ regulates aspects of ALL cell motility and expression of the laminin receptor α6 integrin.
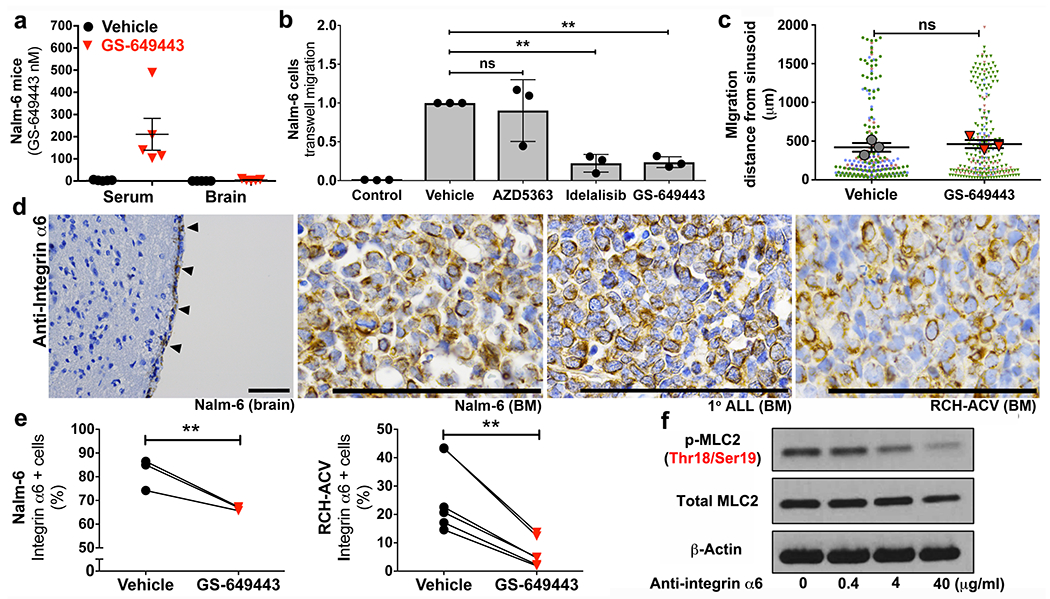
a, Serum and brain tissue concentrations of GS-649443 in leukemic mice (mean ± s.e.m., n = 5 mice per group). b, Effect of PI3Kδ and Akt inhibition on TW migration of ALL (mean ± s.e.m., ANOVA with Tukey, n = 3 biologically independent experiments, *P < 0.05, ** < 0.01). c, Nalm-6 migration in calvarial BM over 10 days in vehicle vs. GS-649443-treated mice (mean of the sample means ± s.e.m., n = 3 mice per treatment group, data points from individual mice distinguished by color, paired two-sided Student’s t-test). d, ALL α6 integrin expression in vivo by IHC (ALL in meninges, arrowheads) (Nalm-6 brain: n = 7 mice, Nalm-6 BM: n = 12 mice, 1° ALL BM: n = 4 mice, RCH-ACV BM: n = 11 mice). e, Flow cytometry of ALL α6 integrin expression following in vitro treatment with PI3Kδ inhibitors (paired two-sided Student’s t-test, Nalm-6: n = 3 biological replicates, P = 0.0088, RCH-ACV: n = 6 biological replicates, P = 0.0026). f, WB of MLC2 levels in Nalm-6 following treatment with α6 integrin neutralizing antibodies (n = 3 independent experiments). For gel source data, see Supplementary Figure 1. Scale bars, 100μm.
PI3K modulates ALL cell motility
In addition to its roles in cell growth, PI3K is a key mediator of migration, controlling actomyosin contractility through the downstream Rho and FAK pathways.6–8 We therefore evaluated the role of PI3Kδ in ALL cell motility in vitro. As shown in Fig. 2b and Extended Data Fig. 2b, PI3Kδ inhibition with either GS-649443 or idelalisib decreased chemotaxis of ALL cell lines and primary ALL cells in transwell (TW) migration assays. ALL migration was independent of both AKT and ROCK, yet highly dependent on MLCK activity, suggesting the FAK signaling pathway downstream of PI3K mediated the inhibition of ALL migration (Fig. 2b and Extended Data Fig. 2b,h,i).9 WB analysis indicated that myosin light chain (MLC) activity in GS-649443-treated ALL cells was reduced (Extended Data Fig. 3a), leading us to consider that PI3Kδ inhibition in vivo blocked CNS disease development by broadly paralyzing ALL cell motility. In previously published work, we showed that ALL and other tumor cells metastasize to the BM through sinusoidal vasculature located in specific anatomic regions.10 Proliferating cells migrate away from these sinusoidal vessels over time.11,12 We hypothesized that if ALL cell motility was broadly inhibited by PI3Kδ blockade, then proliferating Nalm-6 cells in the BM of treated mice would fail to migrate from the sites of initial engraftment. We used intravital microscopy to track the location of BM ALL cells at serial time points post-engraftment in mice, but surprisingly found no significant differences in intra-BM migration in treated vs. vehicle controls (Fig. 2c and Extended Data Fig. 3b). These data suggested that ALL cells had not lost all migratory potential in vivo as a consequence of PI3K inhibition, but that ALL migration into the CNS was regulated by a specific mechanism(s) upstream of MLCK. To identify candidate molecules, we performed a microarray analysis of blasts isolated from the BM and CSF of Nalm-6 mice. Both focal adhesion (FA) and contractility signaling pathway genes were strongly downregulated in the BM and CSF blasts of GS-649443-treated mice (Extended Data Fig. 4a–c). Among multiple genes within the FA pathway was ITGA6, intriguing for its dual relationship to cell migration and CNS development.13–15
PI3K regulates α6 integrin in ALL cells
ITGA6 encodes the α6 integrin, which dimerizes with β1 or β6 integrin to form receptors that specifically bind the extracellular matrix (ECM) molecule laminin.16 Interestingly, α6 knockout mice display developmental defects in cerebral cortical organization, with abnormal neurite outgrowths studding the surface of the brain.14 In vitro, neural stem/precursor cells (NSPCs) have been shown to migrate selectively along laminin matrices in an α6-dependent manner.15 α6 integrin has not been extensively studied in leukemia, but analysis of primary patient samples have demonstrated that it is expressed by the majority of B and T-ALL and that its expression is persistent or intensified in residual disease following chemotherapy.17–19
To examine whether α6 was a viable candidate regulator of ALL CNS invasion, we first assayed its expression in our xenograft models. As shown in Figs. 2d and Extended Data Figs. 4d and 5a,b, N6, RCH-ACV and primary human ALL cells are strongly positive for α6 membrane expression in vitro and in vivo. We next confirmed that PI3Kδ inhibition with GS-649443 decreases the cell surface expression of α6 by ALL cells (Fig. 2e). Moreover, treatment of Nalm-6 with α6 neutralizing antibodies decreased p-MLC2 levels, suggesting that α6 integrin signaling could directly modulate cytoskeletal responses in ALL cells (Fig. 2f). Taken together, these data suggest a feedforward pathway by which PI3Kδ and α6 control migration along laminin via regulation of actinomyosin contractility.
ALL cells fail to breach BBB
In the adult nervous system, laminin is localized to the ECM of parenchymal microvessels, meninges, the choroid plexus, and peripheral nerve sheaths.20 Since ALL cells can circulate in the vasculature in high numbers, we hypothesized that their CNS metastasis was hematogenous, mediated through the interaction of α6+ ALL cells with laminin+ brain microvessels. To test this, we engrafted fluorescently-labeled ALL cells intravenously in mice and used confocal microscopy to image brain tissue whole mounts at serial time points post-engraftment. The location of ALL cells with respect to the vasculature was determined by injecting a fluorescent vascular blood-pool agent immediately prior to imaging. As shown in Figs. 3a–c and Extended Data Fig. 6a–c, ALL cells quickly arrest at branch points of small microvessels, similar to the CNS metastatic process described in melanoma and lung cancer brain metastasis models.21 In contrast to solid tumor cells, however, ALL cells fail to enter the brain parenchyma and form proliferative lesions.22
Figure 3: ALL cells fail to breach the BBB.
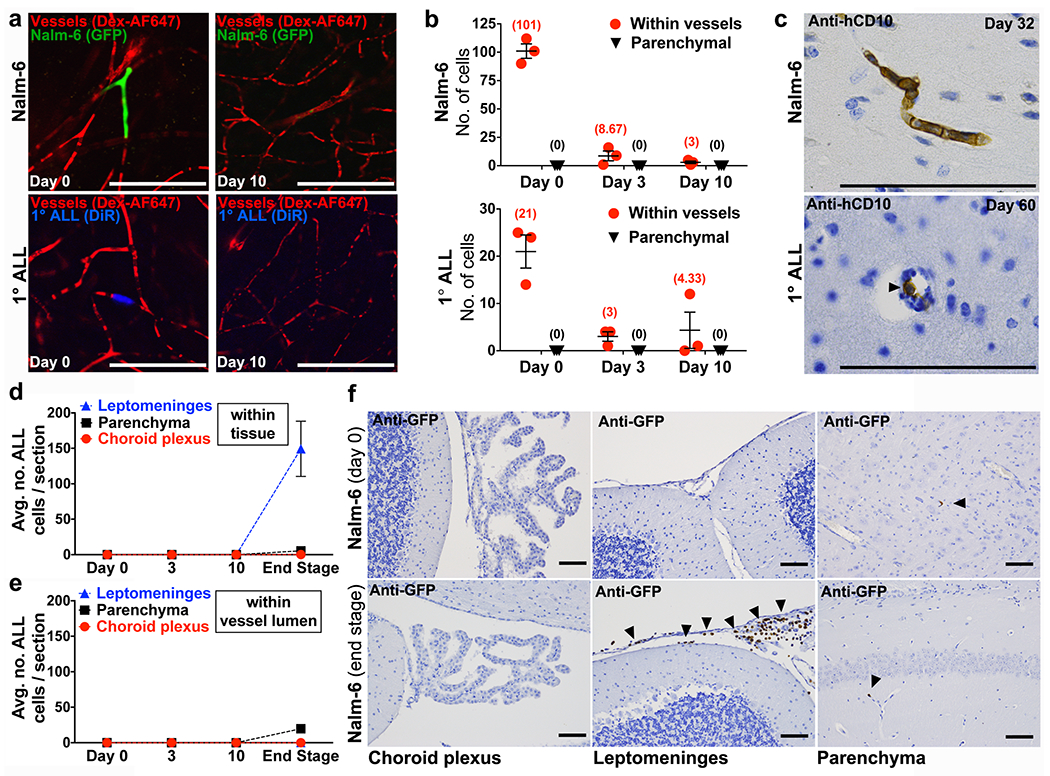
a, Representative confocal microscopy images and b, quantification of ALL cells located within brain microvessels or parenchyma at various time points post-intravenous engraftment (mean of sample means (cells per mouse) ± s.e.m., n = 3 mice per each cell line and time point, 12 micrographs per mouse). c, ALL cells (arrowhead) detected inside lumen of brain parenchymal vessels by IHC (Nalm-6: n = 4 mice, 1° ALL: n = 10 mice). e, Quantification of Nalm-6-GFP+ ALL cells within tissue or d, inside the lumen of blood vessels in the choroid plexus, leptomeninges, or brain parenchyma at various time points post-intravenous engraftment (mean of sample means (cells per section per mouse) ± s.e.m.; day 0, n = 3 mice, 19 sections; day 3, n = 3 mice, 20 sections; day 10, n = 3 mice, 17 sections; end stage disease, n = 5 mice, 46 sections). f, Representative GFP IHC staining of choroid plexus, leptomeninges, and brain parenchyma from Nalm-6-GFP mice on day 0 post-intravenous engraftment (n = 3 mice) or at end stage disease (n = 5 mice). Arrowheads indicate Nalm-6 ALL cells within leptomeninges or inside the lumen of brain parenchymal microvessels. Scale bars, 100μm.
To determine if ALL cells cross the BBB through leptomeningeal rather than cerebral parenchymal vasculature, we engrafted mice with fluorescent Nalm-6 cells and performed real time in vivo microscopy of the leptomeningeal vasculature through thinned skull windows (see Extended Data Fig. 7a–d,f and Supplementary Videos 1–5). While ALL cells circulated through and transiently arrested inside leptomeningeal vasculature on the day of intravenous engraftment, Nalm-6 did not breach the leptomeningeal BBB during this or subsequent post-engraftment time points (Extended Data Fig. 7b–d,f). In contrast, Nalm-6 rapidly diapedesed through BM vasculature soon after intravenous injection (Extended Data Fig. 7e). Histochemical staining of brain tissue sections confirmed that Nalm-6 were absent from leptomeningeal tissue until late disease stages (Fig. 3d–f and Extended Data Fig. 6d,e).
The choroid plexus vasculature has been reported as a site of entry for normal immune cell CNS trafficking and for hematogenous metastases of solid tumor cells to the meninges.23,24 We therefore analyzed histologic sections of the choroid plexus for Nalm-6 cells at multiple time points post-disease engraftment. Nalm-6 cells were very rarely detected within either choroid vessels or choroid tissue at time points ranging from the day of intravenous engraftment through end stage disease (Figs. 3d–f).
ALL enters CNS along emissary vessels
We then turned our attention to identifying an alternative route of invasion. Investigators interested in defining the earliest anatomic location of ALL CNS disease had studied histologic brain sections of patients and found the first identifiable ALL cells to be localized within the basement membrane of superficial arachnoid veins.25 Interestingly, arachnoid veins have been described to merge directly with emissary veins that passage between the meninges en route through the adjacent skull or vertebral bodies to BM (Fig. 4a).26 We thus hypothesized that, rather than metastasizing within the circulation, ALL cells migrated directly from the BM to the CNS surrounding the circulation, along the laminin+ ECM of emissary bridging vessels. We also hypothesized that directional migration of ALL cells from the BM through these bony channels was due to a potent chemoattractive stimulus within the CSF. Multiple chemokines are indeed present in CSF, and a wide variety of their cognate receptors are expressed by ALL cells.27 With the exception of the Notch-driven CCR7+ subset of T-ALL however, no specific chemokine receptor appears to be necessary or sufficient to drive CNS invasion, suggesting that CSF chemokines function additively, synergistically, or substitutively to attract ALL cells.27,28 Consistent with our model, we found that while CXCL12 is one of the most highly concentrated chemokines in the CSF (mean 646 pg/ml), in vitro invasion of ALL cells toward human CSF (hCSF) is only partially inhibited by AMD3100 blockade of the CXCL12 receptor, CXCR4 (Fig. 4b).29 Moreover, it has previously been shown that in vivo blockade of CXCR4 by continuous infusion AMD3100 does not decrease CNS disease development in ALL xenografts.27
Figure 4: ALL cells passage to the CNS subarachnoid space along the abluminal surface of laminin+ BM emissary vessels.
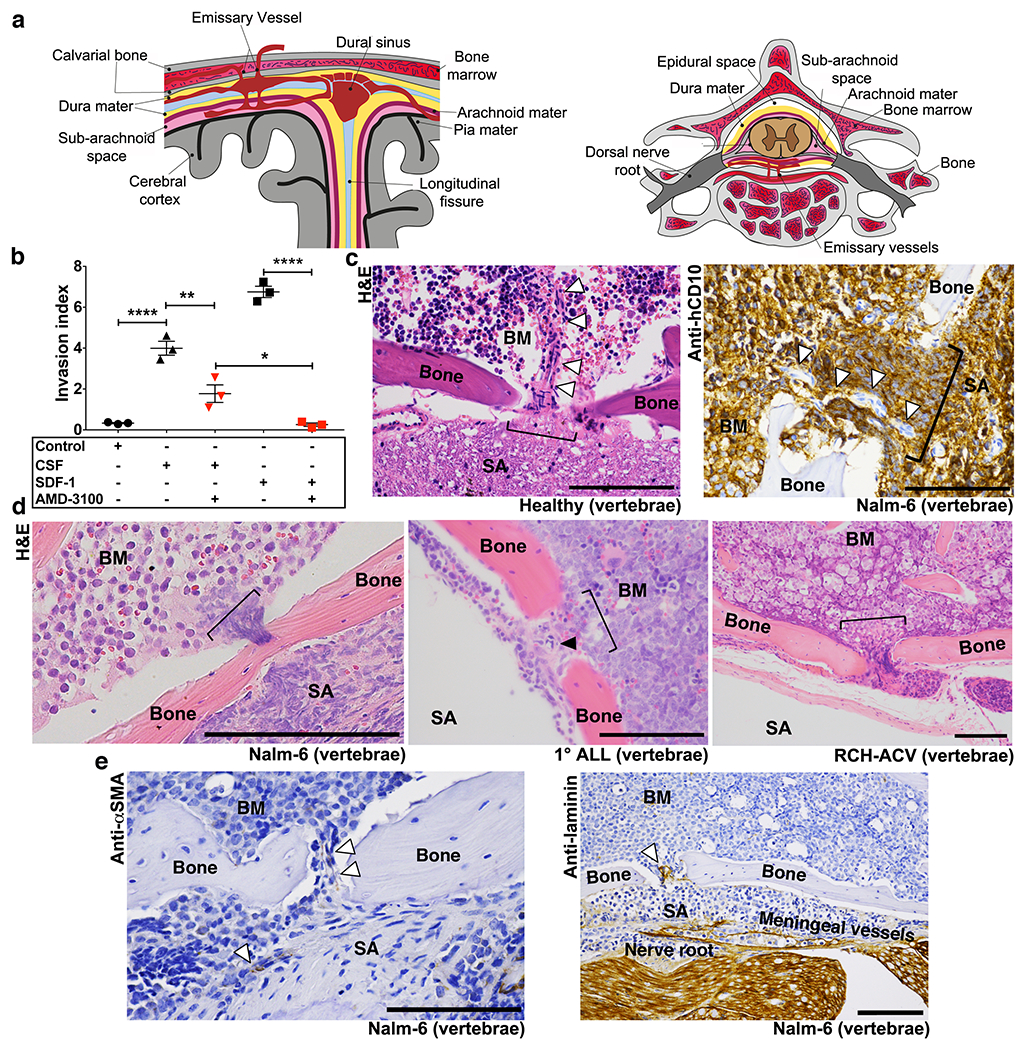
a, Anatomy of emissary vessels in calvarial and vertebral BM. b, ALL in vitro invasion toward hCSF or CXCL12 +/− CXCR4 blockade (mean ± s.e.m., ANOVA with Tukey, n = 3 biological replicates, * P <0.05, ** < 0.01, **** <0.0001). c, Bone channel (bracket) containing emissary vessel (arrowheads) connecting vertebral BM with subarachnoid space (SA) in histologic sections from healthy (n = 4 mice) and Nalm-6 (CD10+) leukemic mice (n = 3 mice). d, ALL in transit to CNS through bone channels (Nalm-6: n = 27 mice, 1° ALL: n = 13 mice, RCH-ACV: n = 10 mice). e, αSMA (vascular smooth muscle, n = 26 mice) and laminin (n = 7 mice) IHC staining of emissary vessels. Scale bars, 100μm.
We next sought to identify emissary bridging vessels in mice and determine whether ALL cells could be found in transit surrounding these, and whether these vessels were indeed laminin+. As shown in a histologic cross-section in Fig. 4c and Supplementary Videos 6–11, we detected small vessels transiting between the BM and subarachnoid space in control mice. In these locations in leukemic mice, we found numerous fenestrations in the vertebral cortical bone filled with ALL cells that appeared to be in transit between the involved BM and subarachnoid space (Figs. 4c,d and Supplementary Videos 8–11). Immunohistochemical (IHC) staining confirmed that these channels contained αSMA+ (vascular smooth muscle) and laminin+ vasculature (Fig. 4e).
Laminin substantially increases in vitro migration of NSPCs in comparison to other ECM substrates.15 We found that laminin similarly enhanced ALL motility in in vitro invasion assays (Extended Data Fig. 8a,b). Moreover, ALL migration to hCSF along laminin was α6-dependent and blocked by MLCK inhibition or GS-649443 treatment (Fig. 5a and Extended Data Fig. 8b). Providing further support that ALL migration utilizes α6/laminin-mediated mechanisms, we found that the frequency of ALL infiltrates along the BM-CNS vascular corridors was significantly decreased in mice treated with GS-649443 (Fig. 5b).
Figure 5: ALL cells use α6 integrin-laminin dependent interactions to invade the CNS.
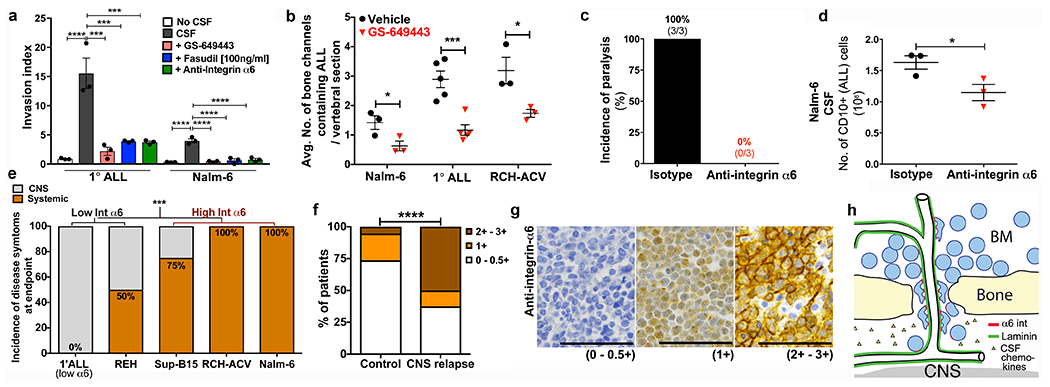
a, ALL invasion toward hCSF along laminin/collagen matrices following treatment with α6 integrin neutralizing antibodies, fasudil Rho-kinase inhibitor (at MLCK inhibitory dose), or GS-649443 (mean ± s.e.m., ANOVA with Tukey, n = 3 biological replicates, ***P < 0.001, **** < 0.0001). b, Frequency of ALL infiltrates within bony channels of spine in vehicle vs. GS-649443-treated mice (mean ± s.e.m., unpaired two-sided Student’s t-test, Nalm-6: n = 3 vehicle mice, 4 treated mice, minimum 24 vertebral sections per mouse, P = 0.0198, 1° human ALL: n = 5 mice per treatment group, minimum 10 vertebral sections per mouse, P = 0.0009, RCH-ACV: n = 4 mice per treatment group, minimum 8 vertebral sections per mouse, P = 0.0149). c, Incidence of hind limb paralysis at time of sacrifice. d, CNS disease burden in isotype control and α6 integrin neutralizing antibody-treated mice sacrificed at matched time points (mean ± s.e.m., unpaired two-sided Student’s t-test, n = 3 mice per treatment group, P = 0.0234). e, Incidence of CNS disease symptoms (hindlimb paralysis) at clinical endpoint in mice engrafted with ALL cells expressing low vs. high levels of integrin α6 (Fisher’s exact test, 1° human ALL α6 low, REH and RCH-ACV: n = 6 mice each, SUP-B15: n = 3 mice, Nalm-6: n = 10 mice, P = 0.0008). f, Association between BM blast α6 integrin expression and CNS disease relapse in ALL patients (Freeman-Halton extension of Fisher’s exact test, No CNS relapse n = 18 patients, CNS relapse n = 8 patients, P = 0.0282). g, Representative α6 integrin IHC of patient BM biopsy samples (0-0.5+: n = 17 patients, 1+: n = 4 patients, 2+-3+: n = 5 patients). h, Schematic of ALL CNS invasion model. Scale bars, 50μm.
α6 integrin enables abluminal invasion
To specifically examine the role of α6 integrin in ALL CNS invasion in vivo, Nalm-6 engrafted mice were treated with α6 neutralizing antibodies weekly beginning on day 1 post-engraftment through attainment of a clinical endpoint (Extended Data Fig. 9a). While there was no difference in peripheral disease burden between targeted and isotype control antibody-treated mice, anti-α6-treated mice showed a modest increase in survival, and none developed lower extremity paresis by the time of sacrifice (Extended Data Fig. 9b–d). In contrast, 100% of isotype control-treated mice required sacrifice due to paralysis (Fig. 5c). Consistent with this observation, CSF blast counts in treated mice were reduced by approximately one-third (Fig. 5d).
To further address the role of α6 integrin in CNS invasion, we studied the relationship between ALL cell α6 expression and the incidence of CNS disease in xenograft models and in a retrospective, case-control cohort of ALL patients with CNS relapse. Mice engrafted with ALL cells that express high surface α6 (>25% cells positive by flow and 2-3+ staining intensity by IHC) displayed a higher frequency of CNS disease at clinical endpoint compared to mice engrafted with α6 integrin-low (<10% cells positive by flow and 0-1+ staining intensity by IHC) ALL cells (Figs. 5e and Extended Data Fig. 5b,c). In archived BM biopsies from ALL patients who either did or did not develop CNS metastases, ALL cell α6 expression was associated with the occurrence of CNS relapse (Figs. 5f,g). α6 integrin expression in this patient cohort was independent of other variables considered to increase the risk of CNS disease involvement (Extended Data Table 1).
There are currently no molecularly targeted interventions to prevent or treat CNS disease in ALL, reflecting a limited understanding of the mechanisms of ALL CNS metastasis. Here we show that ALL cells co-opt a NSPC embryonic pathfinding mechanism in order to traverse the vascular channels connecting BM and meninges, the predominant site of CNS ALL disease in humans.14,30 Moreover, we show that this process can be intercepted in mouse xenograft models, providing a rationale for using clinically available PI3Kδ inhibitors to prevent CNS disease involvement in patients.
Leukemic cells have previously been shown to hijack hematopoietic stem cell trafficking mechanisms to metastasize within the BM microenvironment.10 Our new data demonstrate that this pattern of ALL cell molecular plagiarism extends across organ systems, potentially to exploit a path of least resistance into the CNS. By traveling along the external (abluminal) surface of vessels that are topologically contiguous with the CNS subarachnoid space, ALL cells migrate directly from the BM to the CNS, bypassing the need to enter and exit the CNS vasculature (Fig. 5h). In so doing, ALL cells phenocopy α6-dependent mechanisms used by NSPCs to migrate to the olfactory bulb along vessel ECM.31 In future studies, it will be important to examine whether ALL cells similarly utilize other integrin-ECM interactions that drive neuronal pathfinding and developmental organization in order to the metastasize to the CNS.32
Although the CNS is widely considered to be an immune-privileged site, the recent discovery in mice of a dura mater lymphatic system draining macromolecules and immune cells from the brain suggests that other unrecognized pathways might permit communication between the periphery and CNS.33 Future studies may reveal that this unique ALL trafficking pathway is involved in immune surveillance or inflammatory processes. Exploring the interactions between normal and malignant immune cells and these vascular scaffolds may thus reveal multiple points of intervention to treat CNS invasive processes.
Methods
Collection of BM, spleen and CSF cells.
Mouse femurs were collected and BM cells were aspirated with RPMI1640 containing 10% FBS. Murine spleen tissues were homogenized in RPMI1640 containing 10% FBS using a 15 ml syringe. The spine was removed from mice and carefully separated into individual vertebral bodies by cutting through the intervertebral discs. The spinal cord and meninges of each vertebral body were then washed with RPMI1640 containing 10% FBS to collect cells from the CSF. The BM, spleen and CSF cells were passed through 70 μm filters, washed with PBS and treated with ACK lysis buffer to remove red blood cells.
Flow cytometry analysis.
For in vitro cell surface receptor staining, 1 x 10⁶ cells/100 μl were stained with antibody for 30 minutes at room temperature at 4C in Automacs buffer (BD) + 3% BSA, washed with 3% BSA, and analyzed on a FACS Canto II cytometer. For apoptosis analysis, cells were resuspended in AnnexinV Binding Buffer (BD) and stained with anti-Annexin V-AF647 antibody and PI for 15 minutes at RT and analyzed. For cell cycle analysis, cells were first stained for CD10 and then fixed in 2% paraformaldehyde for 30 minutes at 4°C, permeabilized in 80% ethanol overnight at −20°C, washed and resuspended in Automacs buffer + 3% BSA and then incubated with anti-human-Ki67 for 1h at 4°C before washing with 3% BSA prior to analysis. In some experiments, cell cycle analysis was performed by staining 1 x 10⁶ cells/100 μl Automacs buffer + 1% FBS with Hoechst 34580 (Invitrogen) 4 μg/ml for 30 min at RT. An example of our gating strategy is shown in Supplementary Information Fig. 2.
Fluorescent dye cell labeling.
Cells were fluorescently labeled through incubation with “DiR” lipophilic dyes (DiIC1 8(7) (1,1’-Dioctadecyl-3,3,3’,3’-tetramethylindotricarbocyanine iodide, Invitrogen) as previously described.16 Briefly, cells were isolated at a density of 2.5×10⁶ cells / ml and resuspended in 25 μM DiR in culture medium + 10% FBS. Cells were protected from the light and rotated at room temperature for 30 minutes. After incubation, cells were washed twice in PBS, counted and resuspended at desired concentrations for engraftment. Dye labeling efficiency was tested by flow cytometry.
Mouse engraftment.
Specific pathogen-free 6- to 8-week old male and female SCID mice (Charles River Labs) were inoculated intravenously with 5×10⁶ Nalm-6-GFP, RCH-ACV or REH cells in phosphate-buffered saline through the tail vein. Similarly, primary ALL or SUP-B15 cells were engrafted into 6- to 8-week old male and female NSG mice (Charles River Labs) by intravenous injection. All experimental procedures involving mice were approved by the Animal Care and Use Committee of Duke University. The Institutional Review Board of Duke University approved the use of de-identified primary human ALL cells in this study (Protocol 00006268, 19-April-08). All experiments were performed in accordance with the relevant ethical guidelines and regulations.
Administration of GS-649443.
GS-649443 or vehicle (Gilead Sciences, Inc.) was administrated to Nalm-6-GFP, RCH-ACV, REH, SUP-B15 or primary ALL cell-engrafted mice by oral gavage from day 1 or day 20 after engraftment. Mice were dosed twice a day with 2 mg/kg GS-649443. Mice were monitored daily and sacrificed when they showed hind limb paralysis or other significant CNS symptoms, severe cachexia (≥20% weight loss), respiratory or other distress, or extreme lethargy. For paired-animal analysis, mice were from the vehicle and GS-649443 treated groups were paired at the beginning of the study. Both mice in each pair were sacrificed when either of them showed any of the symptoms outlined above.
Administration of α6 integrin neutralizing antibodies.
Anti-human α6 integrin neutralizing antibodies (Invitrogen) or isotype control antibodies (rat gamma globulin) (Jackson ImmunoResearch) were administrated intravenously in Nalm-6-GFP cell-engrafted mice. The mice were dosed with antibodies weekly at 3 mg/kg. Mice were monitored daily and sacrificed at the clinical endpoints described above.
Cell lines and culture.
The Nalm-6 (catalog #ACC-128) and RCH-ACV (catalog #ACC-548) cell lines were purchased from DSMZ. REH (catalog #CRL-8286) and SUP-B15 (catalog #CRL-1929) cell lines were purchased from ATCC. STR profiling is repeated routinely to authenticate cell lines. Mycoplasmae testing by PCR is performed every three months on all cell lines in culture. All mycoplasmae testing by PCR was negative during the entire duration of this study. The green fluorescent protein (GFP)-expressing clone of Nalm-6 was generated as described previously.11 Nalm-6, REH and RCH-ACV cells were cultured in RPMI1640 (Corning Inc.) supplemented with 10% fetal bovine serum (FBS; Gemini Bio-Products). Sup-B15 cells were cultured in Iscove’s modified Dulbecco’s medium (IMDM), supplemented with 20% FBS and 0.05mM 2-mercaptoethanol. All cultures were maintained at 37°C in a 5% CO2 humidified atmosphere.
Antibodies for flow cytometry.
Allophycocyanin (APC)-conjugated mouse antibody against human CD10, peridium chlorophyll protein complex with cyanin-5.5 (PerCP-Cy5.5)-conjugated mouse antibody against human CD10, phycoerythrin (PE)-conjugated rat antibodies against human CXCR4, APC-conjugated mouse antibody against human CXCR3, APC-conjugated mouse antibody against human CD44, PE-conjugated mouse antibodies against human CD24, APC-conjugated rat antibody against mouse CD45, PE-conjugated rat antibody against human CD49f, AF647 conjugated Annexin-V, PE-conjugated Ki-67 and PE-conjugated mouse antibody against human CD19 were purchased from BD Pharmingen (San Jose, CA).
Measurement of GS-649443 concentration in plasma and CNS.
Brain tissues were collected after perfusion of mice with saline. The thoracic cavity of the mouse was opened and saline was perfused at a rate of 5 ml/minute with a 23G needle through the left cardiac ventricle for 6 minutes. Collected brain tissues were homogenized, diluted three times and treated with acetonitrile. Plasma samples were diluted twice and treated with acetonitrile. The above mixtures were centrifuged at 4,275 rpm for 15 minutes and their supernatants were transferred to a 96-well plate for analysis by the API 5000 triple quadrupole mass spectrometer (AB Sciex, Foster City, CA).
Transwell migration assay.
Migration assays were performed using 24-well plates containing 0.3% FBS in medium. Nalm-6 GFP cells were treated with vehicle, GS-649443 (100nM), AZD5363 (10μΜ) or AMD3100 (5μg/mL) for 20 minutes in serum free media and seeded on uncoated polycarbonate membrane insert (6.5 mm in diameter with 8.0 μm pores) in a Transwell apparatus (Corning). The lower chamber of the Transwell plate was loaded with 600μl of media with 0.3% serum alone or CXCL12 (100ng/ml) as a positive control. After incubation for 3h at 37°C, the inserts were removed and cells that had migrated to the bottom were counted using a hemacytometer.
Western blot analysis.
Following treatment with GS-649443 or anti-α6 integrin, more than 1 x 10⁶ cells were collected by centrifugation and washed with ice-cold PBS. Ice-cold RIPA buffer (50 mM Tris-HCl [pH 7.4], 0.25 M NaCl, 5 mM EDTA, 20 mM NaF, 1% NP-40) containing fresh protease inhibitor cocktail (Sigma) and phosphatase inhibitor cocktail 2 and 3 (Sigma) was added to the cells. The suspension was transferred into a centrifuge tube and placed on ice for 3 minutes. The cell suspension was cleared by centrifugation at 14 000 x g for 3 min at 4°C. The supernatants (total cell lysate) were used immediately or stored at −80°C. Protein concentrations were determined using the DC Protein Assay (Bio-Rad Laboratories). Samples (20 μg of protein) were analyzed using the following primary antibodies, as indicated: anti-phospho-myosin light chain 2 (Thr18/Ser19) (Cell Signaling Technology), -myosin light chain 2 (Cell Signaling Technology), -β-actin (Abcam). Horseradish peroxidase (HRP)-coupled rabbit IgG (Cell Signaling Technology) and goat anti-mouse IgG-HRP (ThermoFisher) were used as secondary antibodies, and immunoreactive proteins were detected by enhanced chemiluminescence (ECL) (ThermoFisher).
3D invasion assays
Cells in 0.3% serum were treated with GS-649443 (100nM) for 16 hours, or cultured in 0.3% serum overnight prior to the addition of anti-human α6 integrin neutralizing antibodies for 3 hours (Invitrogen, 40 ug/ml) or AMD3100 (5μg/ml) for 20 minutes. Cells were resuspended in serum-free rat-tail collagen (Advanced Biomatrix #5153 at 3 mg/ml) alone or supplemented with laminin (Sigma-Aldrich, L2020) or fibronectin (Sigma, F1141). Wherever unspecified, cells were resuspended in collagen + laminin (0.01mg/ml). Resuspended cells were aliquoted into 96-well plates and spun down to the bottom of the plate. Collagen was allowed to polymerize for 2 hours and cell culture media or human CSF (LEE Biosolutions, 991-19-P) was added on top of the gel as a chemoattractant. After 16h of incubation at 37C, plates were fixed and stained with 5 μg/ml Hoechst 33258 (Molecular Probes–Life Technologies). Plates were imaged on a Zeiss 780 Inverted confocal microscope (Carl Zeiss, Germany) with Zen software. The 3D migration index was calculated as number of invading cells at 50 μm divided by the total number of cells.
Immunohistochemistry.
CD10, α-SMA, laminin, α6 integrin and GFP immunohistochemistry staining were performed under the following conditions: CD10: Antigen retrieval was performed using Dako “EDTA” Target Retrieval solution (Dako North America Inc., Carpinteria, CA). Slides were stained with anti-CD10 (clone EPR5904-110; Abcam) at 1:4000. Dako Envision System-HRP (DAB), for use with rabbit (#K4011; Dako), was used as a secondary antibody. α-SMA: No antigen retrieval was performed. Slides were stained with anti-β-actin, α-smooth muscle (clone 1A4; Sigma-Aldrich) at a concentration of 3 μg/mL. M.O.M.™ Biotinylated Anti-Mouse IgG Reagent, for use with mouse (#PK-2200; Vector Laboratories), was used as a secondary antibody. Laminin: Antigen retrieval was performed using Dako “Citrate” Target Retrieval solution (Dako North America Inc., Carpinteria, CA). Slides were stained with anti-laminin (clone ab11575; Abcam) at a concentration of 5 μg/mL. Dako Envision System-HRP (DAB), for use with rabbit (#K4011; Dako), was used as a secondary antibody. α6 integrin: Antigen retrieval was performed using Dako “EDTA” Target Retrieval solution (Dako North America Inc., Carpinteria, CA). Slides were stained with anti-integrin α6 (clone EPR18124; Abcam) at a concentration of 6 μg/mL. Dako Envision System-HRP (DAB), for use with rabbit (#K4011; Dako), was used as a secondary antibody. GFP: Slides were stained with anti-GFP (NB600-308; NOVUS Biologicals) at a concentration of 1 g/mL. Dako Envision System-HRP (DAB), for use with rabbit (#K4011; Dako), was used as a secondary antibody. Nalm-6-GFP+ ALL cell counts in individual GFP-stained brain sections were performed by a trained hematopathologist (C.M.M.). Scoring of ALL cell α6 integrin expression in mouse bone marrow specimens was performed in a blinded fashion by a trained hematopathologist (C.M.M.).
3D reconstructions
3D reconstructions of emissary vessels were acquired from 30μm sections of the spinal cord stained with eosin and hematoxylin. Consecutive images were acquired at regular intervals and assembled into movies using VirtualDub64 software.
Quantification of vertebral bone channels containing ALL cells
5μm sections of the spinal cord were stained with eosin and hematoxylin. Vertebral bone channels that contained ALL cells were identified and counted in each intact spinal section. This analysis was performed in a blinded fashion by two independent lab members.
Human samples
The study design and use of clinical BM biopsy samples was approved by the Institutional Review Board of Duke University (protocol #57532). A waiver of informed consent was granted as the research was considered to present no more than minimal risk of harm to participants. Electronic medical records of the Duke University Health System from 2009-2016 were searched using the Duke Enterprise Data Unified Content Explorer (DEDUCE) on-line query system in order to identify patients of any age with acute lymphoblastic leukemia diagnoses. Each patient’s chart was then reviewed to confirm the pathologic diagnosis as well as the availability of archived diagnostic and/or relapse BM biopsy specimens. ALL patients with CNS relapse confirmed through identification of malignant cells in the CSF by cytology and/or immunophenotyping were retrospectively enrolled. ALL patients who did not undergo bone marrow transplantation (BMT) and who were without relapse in the BM or CNS after more than 5 years of follow-up served as control patients. ALL patients who did not undergo BMT and who relapsed in the BM but had no clinical evidence of CNS relapse and confirmed negative CSF cytology/immunophenotyping served as additional control patients. Scoring of ALL cell α6 integrin expression in imunohistochemically stained bone marrow biopsies was performed by a trained hematopathologist.
Intravital microscopy.
SCID mice were anesthetized using isoflurane and a rectangular incision was made in the scalp, revealing the intact, underlying cortical bone. The region was washed with PBS and fluorescently labeled dextran (Dex-FITC or Dex-AF-647) administered via tail vein injection to highlight the vasculature. Dex-AF647 is a large molecular weight Dextrans molecule conjugated to the fluorophore AF647. Because it has a prolonged blood-pool half-life, it is a useful means of visualizing the vasculature in in vivo studies. Mice were placed in a specially designed restrictor and a cover slip was placed over the exposed calvarial bone. Mice remained anesthetized throughout the procedure. High-resolution images were obtained through the intact mouse skull using a Leica SP5 confocal and multiphoton microscope with a 20x/0.40 NA objective lens. The system utilizes a femto-second Titanium:sapphire laser (Chameleon) for multiphoton or single photon excitation and multiple cs lasers (including an Argon laser, a HeNe laser and 561 nm and 633 nm diode lasers) for single-photon excitation. Images were captured using Leica LAS-AF software using line and frame averaging. The calvarial bone marrow was subdivided into numbered anatomical areas and overlapping 20x images of the entire region were captured. Post procedure, these images were merged using Photoshop software v12.0.4 to generate a montage image of the entire calvarium. Cells were then enumerated using the cell counter function of ImageJ software.
Skull thinning.
SCID mice were anaesthetized using isoflurane and the cortical bone was exposed following a sagittal incision in the scalp. The mouse’s head was secured using a strereotactic apparatus. A drill (Hager and Meisinger GMBH size 1007, through Fine Surgical Tools) was used to thin the skull, creating a small, circular bowl-like area with a flat bottom. A microsurgical blade was used to delicately complete the thinning by hand (Surgistar, 38-6961). High-resolution images of the leptomeninges were obtained through the thinned skull window using a Leica SP5 confocal and multiphoton microscope with a 20x/0.40 NA objective lens.
Confocal microscopy brain whole-mounts imaging.
SCID mice were engrafted with 5x10⁶ DiR labeled cells and confocal imaging of the brain was performed at indicated time points post engraftment (Day 0 / 2hrs post engraftment; Day 3; Day 10). Mice were sacrificed at imaging time points, the brain was removed and then cut sagittally along the midline into thin sections for whole-mount imaging. High-resolution images of ALL cells in brain parenchymal spaces was obtained using a Leica SP5 confocal and multiphoton microscope with a 20Å~/0.40 NA (numerical aperture) objective lens. The system uses a femtosecond titanium:sapphire laser (Chameleon) for multiphoton or single-photon excitation and multiple Cs lasers (including an argon laser, a HeNe laser, and 561- and 633-nm diode lasers) for single-photon excitation. Images were captured with Leica LAS-AF software.
Microarray analysis.
Total RNA isolated from BM and CSF was sent for gene expression profiling using the Clariom D Human microarrays (Affymetrix, Santa Clara, USA) at the Duke Center for Genomic and Computational Biology. Raw cell intensity data was imported in to Expression Console (Affymetrix, Santa Clara, USA) and BM arrays (vehicle and GS-649443 samples), and CSF arrays (vehicle and GS-649443) were normalized using the RMA algorithm. Gene level differential expression analysis was performed using the Transcript Analysis Console (v3.1.0.5: Affymetrix, Santa Clara, USA) and ANOVA statistical analysis performed on the BM and CSF arrays separately. Transcripts identified to be differentially regulated in the BM, or CSF samples by ±1.5-fold with a p-value <0.05 were carried forward for pathway analysis.
Statistics and Reproducibility.
Microarray analysis was performed as described above. Kaplan-Meier curves with two-sided log rank Mantel-Cox analysis were used to assess in vivo survival. Two-sided paired Student’s t-test was used for analysis of vehicle versus inhibitor effects on tumor burden in mice, ALL BM migration in mice, GS649443 effects on α6 integrin expression in ALL cells in vitro. One-way ANOVA analysis with Tukey post-hoc testing for multiple comparisons was performed for invasion assays, transwell migration assays and comparison of tumor burden across BM, spleen, and CNS in vehicle vs. inhibitor-treated mice. Fisher’s exact test and the Freeman-Halton extension of the Fisher’s exact test were used to compare α6 staining levels on human biopsies and on CNS symptoms incidence levels. Nalm-6 migration along calvarial BM vessels was quantified using Image J software (NIH). The majority of statistical analysis was performed using GraphPad Prism version 7.0, while the VassarStats statistical computation website was used to perform the Freeman-Halton extension of the Fisher’s exact test. Significance P values were defined as follows: ns = not significant, * P < 0.05; ** P < 0.01; *** P < 0.001; ****P< 0.0001. Precise P values for data shown in the main figures using these ranges are as follows: Fig. 1e: Nalm-6 xenografts: P = 0.8142 (BM), P = 0.1014 (spleen); Fig. 1g: 1° ALL xenografts: P = 0.0052 (CNS), P = 0.0266 (BM), 0.0222 (spleen), RCH-ACV xenografts: P = 0.0067 (CNS), P = 0.0981 (BM), P = 0.2465 (spleen); Fig. 2b: P = 0.9657 (vehicle vs. AZD5363), P = 0.0035 (vehicle vs. idelalisib), P = 0.0040 (vehicle vs. GS649443); Fig. 2c: P = 0.1337 (vehicle vs. GS649443); Fig. 4b: P < 0.0001 (control vs. CSF), P = 0.0015 (CSF vs. CSF+AMD3100), P = 0.0201 (CSF+AMD3100 vs. SDF1+AMD3100), P < 0.0001 (SDF1 vs. SDF1+AMD3100); Fig. 5a: 1° ALL: P < 0.0001 (no CSF vs. CSF), P = 0.0001 (CSF vs. GS649443), P = 0.0003 (CSF vs. fasudil), P = 0.0003 (CSF vs. anti-α6), Nalm-6: P < 0.0001 (no CSF vs. CSF), P < 0.0001 (CSF vs. GS649443), P < 0.0001 (CSF vs. fasudil), P < 0.0001 (CSF vs. anti-α6). Mean +/− s.e.m. was graphed.
Extended Data
Extended Data Figure 1: PI3Kδ inhibition minimally decreases ALL peripheral disease burden.
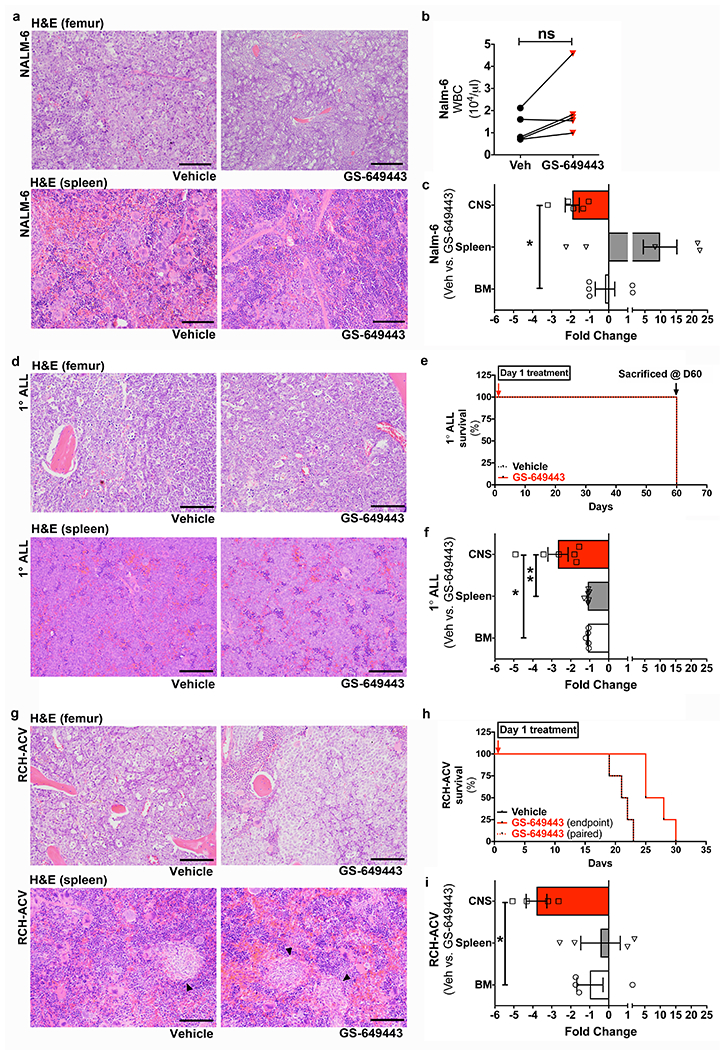
a, Representative H&E stained histologic sections showing Nalm-6 disease burden in the femoral BM and spleen of mice treated with vehicle or GS-649443, at matched time points (n = 6 mice per treatment group). b, Complete blood counts of vehicle and GS-649443-treated mice, at matched timepoints (paired two-tailed Student’s t-test, n = 5 mice per treatment group, P = 0.2158). c, Fold changes in CNS vs. systemic disease burden in vehicle and GS-649443-treated Nalm-6 mice (mean ± s.e.m., ANOVA with Tukey’s multiple comparison test, n = 5 mice per treatment group, P = 0.0314). d, Representative histologic sections showing 1°ALL disease burden in the femoral BM and spleen of mice treated with vehicle or GS-649443, at matched time points (n = 5 mice per treatment group). e, 1°ALL mice experimental plan. f, Fold changes in CNS vs. systemic disease burden in vehicle and GS-649443-treated 1°ALL mice (mean ± s.e.m., ANOVA with Tukey, n = 5 mice per treatment group, P = 0.00128 (CNS vs. BM), P = 0.0098 (CNS vs. spleen)). g, Representative histologic sections showing RCH-ACV disease burden in the femoral BM and spleen of mice treated with vehicle or GS-649443 (n = 4 mice per treatment group). Arrowheads indicate RCH-ACV blasts. h, Kaplan-Meier survival curve for RCH-ACV mice (two-sided log rank Mantel-Cox, n = 5 mice per treatment group, P = 0.0067). i, Fold changes in CNS vs. systemic disease burden in vehicle and GS-649443-treated RCH-ACV mice (mean ± s.e.m., ANOVA with Tukey, n = 4 mice per treatment group, P = 0.0244). Scale bars, 100 μm.
Extended Data Figure 2: PI3Kδ inhibition at levels achievable in murine CSF does not affect the apoptotic or cell cycle index of Nalm-6 cells; ROCK inhibition does not alter survival or disease burden in Nalm-6 leukemic mice, though .
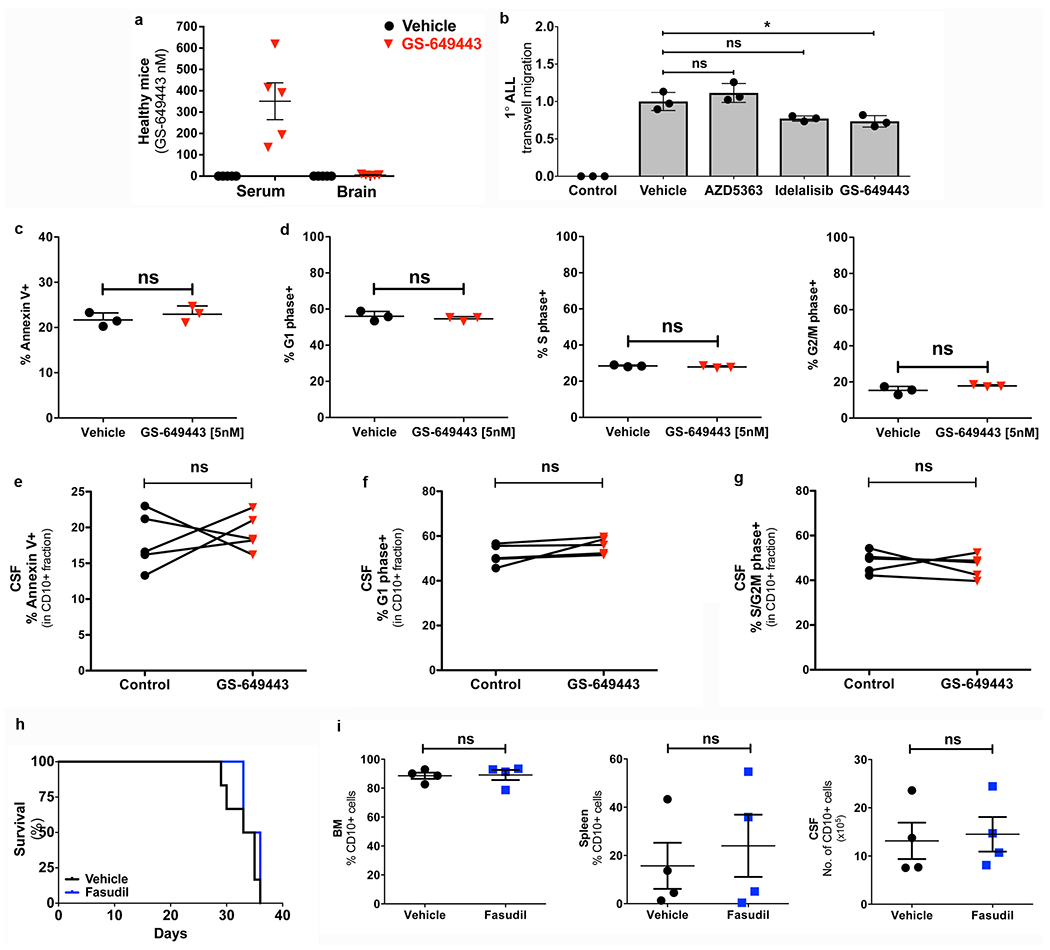
a, Serum and brain tissue concentrations of GS-649443 in healthy SCID mice (mean ± s.e.m., n = 5 mice per group). b, Effect of PI3Kδ and Akt inhibition on TW migration of 1° ALL (mean ± s.e.m., ANOVA with Tukey, n = 3 technical replicates per group, P = 0.5228 (vehicle vs AZD5363), P = 0.0549 (vehicle vs. idelalisib), P = 0.0245 (vehicle vs. GS649443). c, Percentage Annexin-V+ Nalm-6 cells following in vitro treatment (72h) with vehicle or GS-649443 (mean ± s.e.m., unpaired two-sided Student’s t-test, n = 3 biological replicates, P = 0.2038). d, Proportion of Nalm-6 cells in the G1, S or G2/M phase of the cell cycle following in vitro treatment (72h) with vehicle or GS-649443 (mean ± s.e.m., unpaired two-sided Student’s t-test, n = 3 biological replicates, P = 0.2216 (G1), P = 0.1405 (S), P = 0.0661 (G2/M)). e, Percentage Annexin-V+ cells in the CD10+ fraction of the CSF in vehicle or GS-649443 treated mice (paired two-sided Student’s t-test, n = 5 mice per treatment group, P = 0.6672). f, Percentage G1 phase cells in the CD10+ fraction of the CSF in vehicle or GS-649443 treated mice (paired two-sided Student’s t-test, n = 5 mice per treatment group, P = 0.1477). g, Percentage S/G2M phase cells in the CD10+ fraction of the CSF in vehicle or GS-649443 treated mice (paired two-sided Student’s t-test, n = 5 mice per treatment group, P = 0.5687). h, Kaplan-Meier survival curves for Nalm-6 mice treated +/− fasudil Rho-kinase (ROCK) inhibitor (two-sided log rank Mantel-Cox, P = 0.2843; n = 6 per treatment group). i, Disease burden (CD10+ cells) at endpoint in the BM, spleen and CSF of vehicle and fasudil treated SCID mice engrafted with Nalm-6 (mean ± s.e.m., paired two-sided Student’s t-test, n = 4 mice per treatment group, P = 0.4534 (BM), P = 0.3119 (spleen), P = 0.8026 (CSF)).
Extended Data Figure 3: PI3Kδ inhibition reduces myosin light chain activity but does not affect intra-bone marrow migration of Nalm-6 cells.
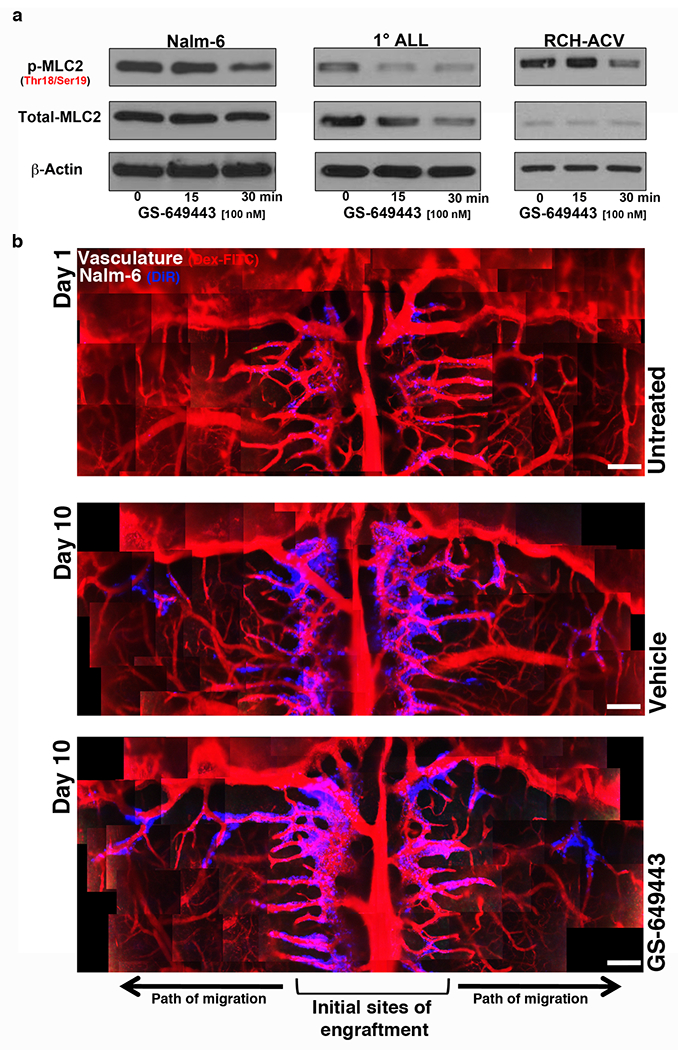
a, WB of MLC2 levels in ALL following GS-649443 treatment. For gel source data, see Supplementary Figure 1 (Nalm-6: n = 3 independent experiments, 1° ALL: n = 2 independent experiments, RCH-ACV: n = 3 independent experiments). b, Representative intravital microscopy images of ALL cell intra-BM migration over time in vehicle vs. GS-649443-treated mice (n = 3 mice per treatment group). Scale bars, 250 μm.
Extended Data Figure 4: Microarray analysis of focal adhesion and motility pathway genes in blasts from vehicle vs. GS-649443-treated mice and validation of key candidate.
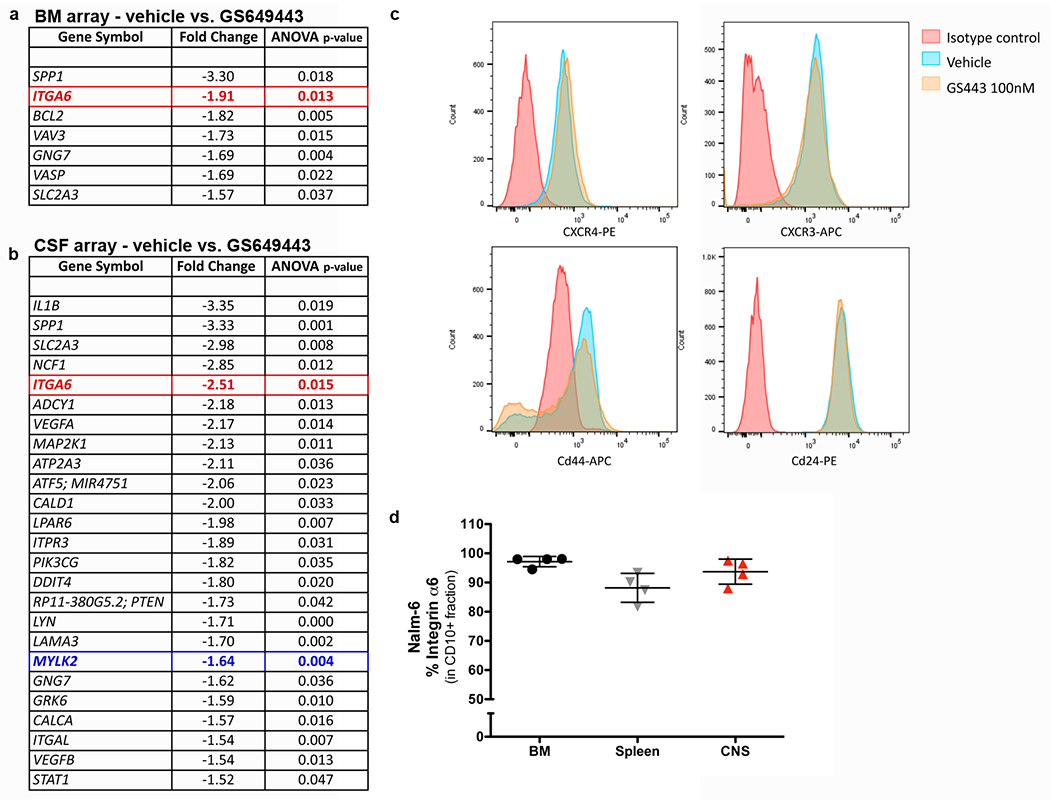
a-b, Differentially expressed focal adhesion and motility pathway genes identified by microarray analysis of blasts from vehicle vs. GS-649443-treated mice (n = 6 mice per treatment group). c, Microarray negative control validation: Representative flow cytometry analysis of Nalm-6 expression of CXCR4, CXCR3, CD44, CD24 following treatment with vehicle or GS-649443 (n = 3 independent experiments). d, ALL α6 integrin expression in vivo by flow cytometry (mean ± s.e.m, n = 4 mice).
Extended Data Figure 5: α 6 integrin cell surface expression is variable across a panel of ALL cell lines and primary human ALL cells in vitro and in vivo.
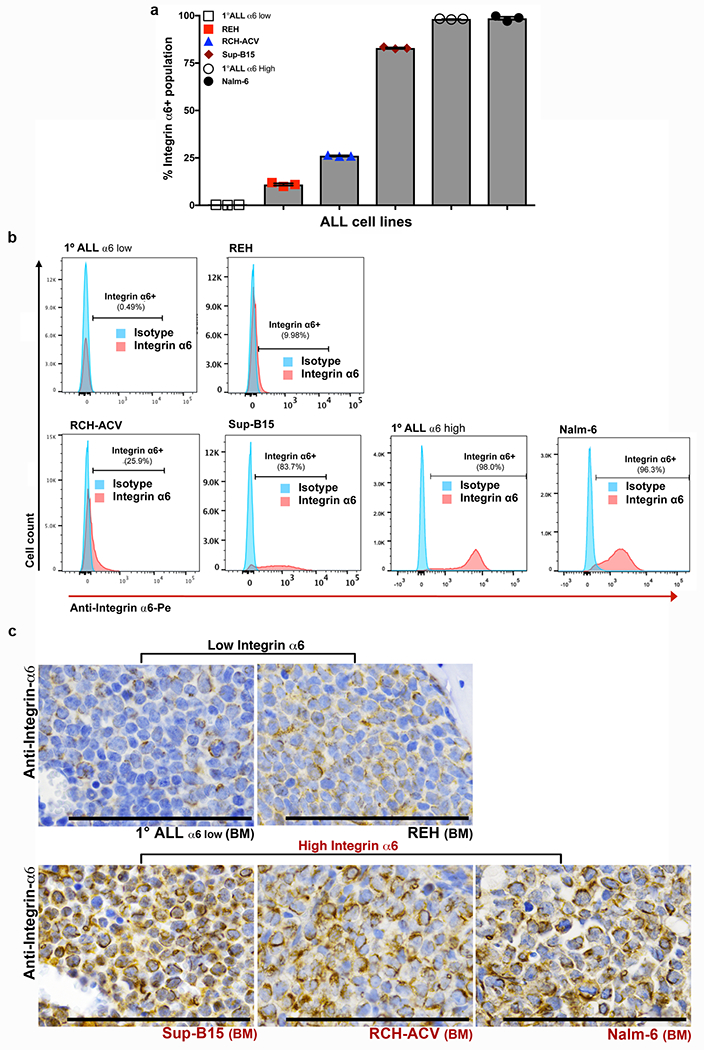
a, Flow cytometry analysis of the percentage α6 integrin+ populations in ALL cell lines and primary ALL cells (mean ± s.e.m., n = 3 independent experiments per cell line). b, Representative flow cytometry histograms of α6 integrin expression in ALL cell lines and primary ALL cells (n = 3 independent experiments). c, Representative α6 integrin IHC of femoral BM from mice engrafted with low α6 integrin-expressing vs. high α6 integrin-expressing ALL cells (α6 low 1° human ALL: n = 6 mice, REH: n = 6 mice, SUP-B15: n = 3 mice, RCH-ACV: n = 6 mice, Nalm-6: n = 10 mice).
Extended Data Figure 6: ALL cells do not diapedese through brain microvasculature.
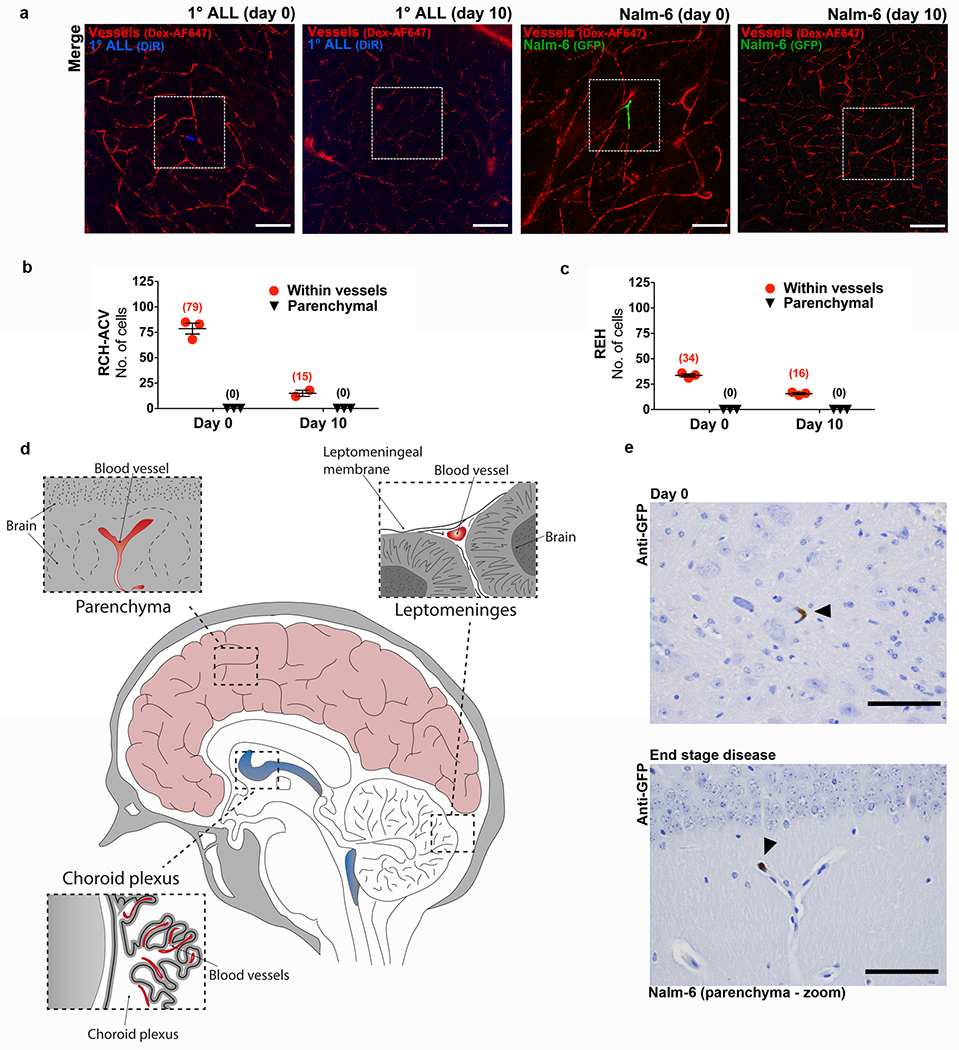
a, Representative confocal microscopy images of ALL cells located within brain microvessels at various time points post-intravenous engraftment (n = 3 mice per each cell line and time point, 12 micrographs per mouse). White boxes outline areas shown at higher magnification in Fig. 3a. b, Quantification of the number of ALL cells located in brain parenchymal tissue or within brain parenchymal microvessels at various time points post-intravenous engraftment of RCH-ACV and c, REH ALL cells (mean ± s.e.m., n = 3 biological replicates for each time point). d, Cartoon showing vasculature within the choroid plexus, leptomeninges, and brain parenchyma. e, Representative GFP IHC staining of brain parenchyma of Nalm-6-GFP mice on day 0 post-intravenous engraftment (n = 3 mice) or at end stage disease (n = 5 mice). Images show close-ups of the ALL cells that are highlighted by arrowheads in Fig. 3F. Scale bars, 100 μm.
Extended Data Figure 7: Nalm-6 cells do not diapedese through the leptomeningeal blood brain barrier.
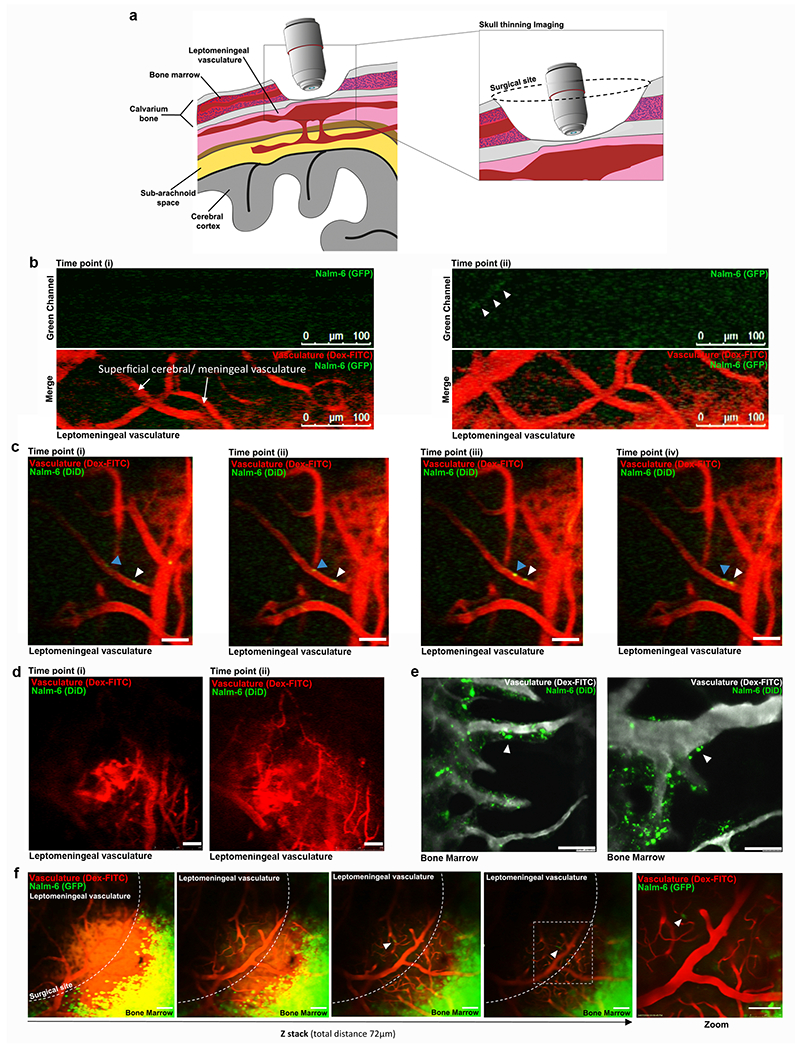
a, Graphic of thinned skull window and video-rate intravital confocal microscopy approach used to image the leptomeningeal vasculature at various time points post-ALL cell engraftment. b, Representative still images from video-rate intravital microscopy analysis of leptomeningeal and superficial cerebral vasculature (red) at 10 minutes post-intravenous Nalm-6 engraftment (full video presented in supplementary video 1 & 2). Nalm-6 cells (green) are observed in circulation (n = 12 mice imaged on day 0 post-engraftment). c, Series of still images of leptomeningeal and superficial cerebral vasculature at 45 min post-intravenous Nalm-6 engraftment. A Nalm-6 cell is observed adherent to the luminal side of a leptomeningeal vessel (white arrowhead). A second Nalm-6 cell is observed rolling along the luminal wall of a leptomeningeal vessel (blue arrowhead) (see Supplementary Video 3). No diapedesis was observed during the entirety of each 2-4 hour long imaging session on the day of engraftment (n = 12 mice imaged on day 0 post-engraftment). d, Still images of the leptomeningeal and superficial cerebral vasculature 12 days post-Nalm-6 engraftment. No Nalm-6 cells were observed in circulation or within the leptomeningeal tissue (see Supplementary Video 4; n = 4 mice, days 2, 4, 7 and 12 post-engraftment) e, Representative images from intravital confocal microscopy of the calvarial BM at 2 hours post Nalm-6 engraftment. Numerous Nalm-6 cells (white arrowheads) are seen to have diapedesed through the BM vasculature soon after intravenous engraftment (n = 15 mice). f, Series of still images of the Z-plane of the leptomeningeal and superficial cerebral vasculature of a Nalm-6 leukemic mouse at disease endpoint (n = 7 mice, days 37-39 post-engraftment). Nalm-6 cells are observed in circulation (white arrowheads), but no cells are observed to diapedese (see Supplementary Video 5).
Extended Data Figure 8: ALL cell invasion along laminin matrices is regulated by PI3K signaling and α6 integrin.
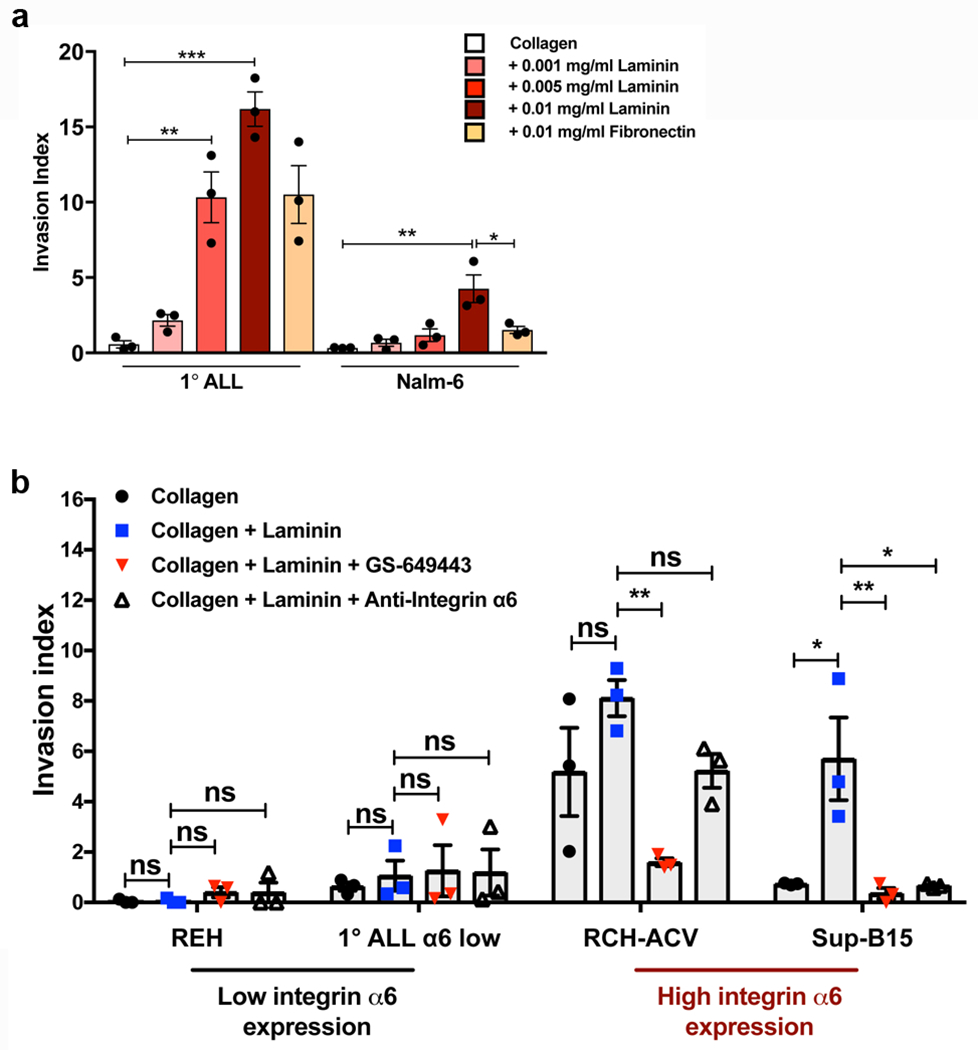
a, 1° ALL and Nalm-6 in vitro invasion toward hCSF along collagen, collagen + laminin, or collagen + fibronectin matrices (mean ± s.e.m., ANOVA with Tukey, n = 3 biologically independent experiments, 1° ALL: P = 0.8937 (collagen vs. 0.001mg/ml laminin), P = 0.0020 (collagen vs. 0.005 mg/ml laminin), P < 0.0001 (collagen vs. 0.01 mg/ml laminin), P = 0.0604 (0.01 mg/ml laminin vs. fibronectin), Nalm-6: P = 0.0012 (collagen vs. 0.01 mg/ml laminin), P = 0.0150 (0.01 mg/ml laminin vs. fibronectin). b, Comparative in vitro invasion of low α6 integrin-expressing ALL cells vs. high α6 integrin-expressing ALL cells towards hCSF along laminin matrices and effects of PI3Kδ inhibition or α6 integrin blockade (mean ± s.e.m., ANOVA with Tukey, n = 3 biologically independent experiments, REH: P > 0.9999 (collagen vs. laminin), P = 0.6967 (collagen+laminin vs. collagen+laminin+GS649443), P > 0.9999 (collagen+laminin vs. collagen+laminin+anti-α6), 1° ALL: P = 0.9758 (collagen vs. laminin), P = 0.9974 (collagen+laminin vs. collagen+laminin+GS649443), P = 0.9993 (collagen+laminin vs. collagen+laminin+anti-α6), RCH: P = 0.2446 (collagen vs. laminin), P = 0.0079 (collagen+laminin vs. collagen+laminin+GS649443), P = 0.2549 (collagen+laminin vs. collagen+laminin+anti-α6), SUP-B15: P = 0.0122 (collagen vs. laminin), P = 0.0080 (collagen+laminin vs. collagen+laminin+GS649443), P = 0.0112 (collagen+laminin vs. collagen+laminin+anti-α6). *P < 0.05, ** < 0.01, *** <0.001.
Extended Data Figure 9: Anti-α6 integrin blocking antibody treatment prolongs survival, but does not alter disease burden in the BM or spleen of Nalm-6 leukemic mice.
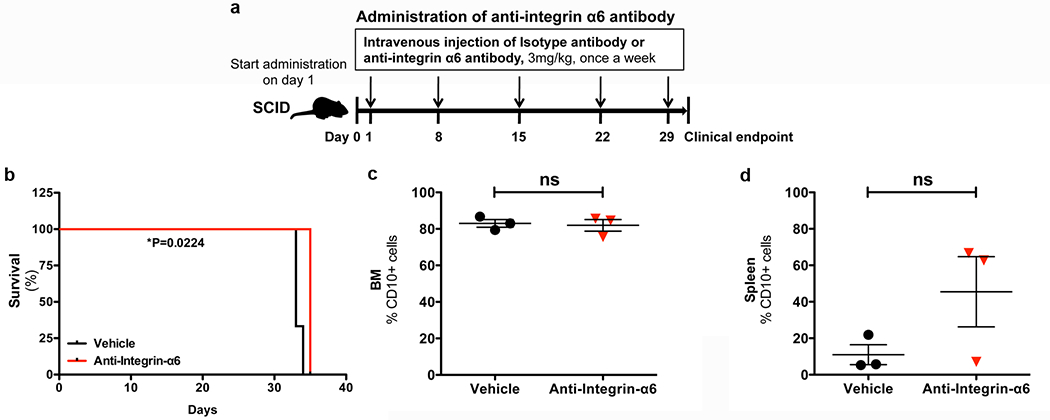
a, α6 integrin neutralizing antibody treatment schema. b, Kaplan-Meier survival curves for Nalm-6 mice treated +/− anti-integrin-α6 blocking antibodies (two-sided log rank Mantel-Cox, n = 3 mice per treatment group, P=0.0224). c-d, Disease burden at endpoint in the BM and spleen of vehicle and anti-integrin α6 antibody-treated Nalm-6 leukemic mice (mean ± s.e.m., paired two-sided Student’s t-test, n = 3 mice per treatment group, P = 0.7874 (BM), P = 0.1595 (spleen)).
Extended Data Table 1: Summary of ALL patient clinical data: α6 integrin expression is associated with CNS relapse independently of other known risk factors for CNS disease recurrence.
Abbreviations: BCR, Breakpoint cluster region; BCR/ABL1, Breakpoint cluster region / Abelson murine leukemia viral oncogene homolog 1; BM, Bone marrow; CNS, Central nervous system; CSF, cerebrospinal fluid; IGH, Immunoglobulin heavy locus; IHC, Immunohistochemistry; MLL, Mixed-lineage leukemia; Ph, Philadelphia chromosome; RUNX1, Runt-related transcription factor 1. Statistical testing was performed to determine potential associations between α6 integrin expression and known risk factors for CNS disease relapse (Fisher’s exact test, n = 19 patients without CNS relapse, n = 8 patients with CNS relapse, α6 integrin IHC score (0-0.5+, 1+, or 2+-3+) vs. age at diagnosis (pediatric < 15 years or adult): P = 0.8416; IHC score vs. WBC at diagnosis (low < 30 (109/L) or high > 30 (109/L), P = 0.8119; IHC score vs. Ph status: P = 0.4676; α6 integrin IHC score vs. CD56 status: P = 0.2332).
| Group | Patient # | Age at diagnosis | Gender | WBC (109/L) on presentation | Ph status | Other karyotypic abnormalities | Extra-medullary disease | CSF disease at diagnosis | CD56+ blasts | Relapse free survival (months) | Integrin α6 staining intensity by IHC |
|---|---|---|---|---|---|---|---|---|---|---|---|
| CNS relapse | 1 | 2 | male | 44 | neg | none | none | neg | pos | 42.00 | 2 |
| 2 | 19 | male | 40.2 | pos | monosomy 7 | none | neg | neg | 15.00 | 2 | |
| 3 | 42 | female | 3.3 | neg | unknown | none | neg | neg | 14.00 | 1 | |
| 4 | 28 | male | 1.8 | neg | none | none | neg | neg | 20.00 | 3 | |
| 5 | 57 | male | 268 | pos | none | none | neg | pos | 7.00 | 0.5 | |
| 6 | 63 | male | 21.8 | neg | Duplication 1q, gain of 8, deletion 9p and structural rearrangements of 2, 3, 6, 14 and 18 |
none | pos | neg | 1.00 | 0 | |
| 7 | 74 | male | 13.3 | neg | none | none | neg | neg | 25.00 | 0 | |
| 8 | 45 | female | 5.1 | pos | unknown | none | neg | neg | 10.00 | 3 | |
| BM relapse | 9 | 64 | female | 70.4 | neg | none | none | neg | neg | 28.00 | 0 |
| 10 | 3 | male | 106.3 | neg | none | testicular | neg | neg | 54.00 | 0 | |
| 11 | 7 | male | 9.1 | neg | Hyperdiploid clone with translocation 1;19, deletion 17p and multiple whole chromosome gains including 21, now with monosomy 7 in most cells | none | unknown | neg | 9.00 | 0.5 | |
| 12 | 42 | male | 3.2 | neg | none | none | neg | neg | 24.00 | 0.5 | |
| 13 | 64 | male | 5.3 | neg | 3 copies of the BCR locus (22q11.2); 3 intact copies of the MLL locus (11q23) | none | neg | neg | 12.00 | 2 | |
| 14 | 28 | male | 32.3 | neg | Deletion of p16 (CDKN2A) at 9p21 and rearrangement of the IGH locus. | none | neg | neg | 24.00 | 1 | |
| No relapse | 15 | 31 | male | 4.7 | pos | monosomy 7, additional material on the long (q) arm of chromosome 10 at 10q24 and the short (p) arm of chromosome 17 at 17p11.2 | none | neg | neg | 59.00 | 0.5 |
| 16 | 6 | male | 3.4 | neg | none | none | neg | neg | 82.00 | 0 | |
| 17 | 29 | male | 18.4 | neg | none | none | neg | pos | 46.00 | 1 | |
| 18 | 2 | female | 11.2 | neg | patient not found | none | neg | neg | 89.00 | 0 | |
| 19 | 5 | female | 15.4 | neg | Trisomy of chromosome 10, 17; Tetrasomy of chromosome 21 | none | neg | pos | 67.00 | 1 | |
| 20 | 21 | male | 1.2 | neg | none | none | neg | pos | 64.00 | 0.5 | |
| 21 | 3 | male | 18.6 | neg | none | none | neg | pos | 67.00 | 0 | |
| 22 | 31 | male | 4.2 | neg | none | none | neg | neg | 68.00 | 0 | |
| 23 | 9 | male | 12 | neg | Hyperdiploidy 4, 10, 17, tetrasomy 21 | none | neg | pos | 72.00 | 0.5 | |
| 24 | 6 | male | 4.5 | neg | Gain of chromosome 17 and 21 (gain of RUNX1) | none | neg | pos | 72.00 | 0 | |
| 25 | 55 | female | 1.8 | neg | none | none | neg | neg | 64.00 | 0.5 | |
| 26 | 62 | male | 31.4 | pos | BCR/ABL1 positive | none | neg | neg | 103.00 | 0.5 |
Correlations:
Integrinα6 staining vs Age at Diagnosis – p=0.9189 (one-way ANOVA)
Integrinα6 staining vs WBC on presentation (low<30 (109/L) vs high>30(109/L)) – p=0.7628 (Chi-squared) Integrinα6 staining vs Ph status – p=0.3060 (Chi-squared) Integrinα6 staining vs CD56+ status – p=0.2256 (Chi-squared)
Supplementary Material
Acknowledgements
We thank the Duke Sequencing and Genomic Technologies (Duke Cancer Institute) and Genomic and Computational Biology shared resources and Dr. Holly Dressman for gene array processing and analysis services and technical advice. We would like to thank Dr. M. Kelly Nicholas for providing expert opinions on neuro-oncology, Dr. Zhiguo Li for assistance with statistical analysis, and Dr. Christophe Queva for helpful discussions regarding PI3K inhibition.
Funding:
This work was supported by the Duke Cancer Institute and Gilead Sciences, Inc.
Author Information
The authors declare the following financial interests: D.A.S. received a grant award from Gilead Sciences, Inc. S.T. and J.T. are employees of Gilead Sciences, Inc.
Data Availability.
Source data for quantifications mentioned in the text or shown in the graphs plotted in Figs. 1–5 and Extended Data Figs. 1–9 are available in the online version of this paper. Full scans of Western blots are provided in Supplementary Fig. 1. Microarray gene expression data that support the findings of this study have been deposited in Gene Expression Omnibus (GEO) under accession number GSE114627. The authors declare that the data supporting the findings of this study are available within the paper and its supplementary information files or from the corresponding author upon reasonable request.
References
- 1.Garcia-Manero G, Kantarjian HM & Schiffer CA in Holland-Frei Cancer Medicine (eds Kufe DW et al.) (BC Decker, 2003). [Google Scholar]
- 2.Surapaneni UR et al. Central nervous system relapse in adults with acute lymphoblastic leukemia. Cancer 94, 773–779 (2002). [DOI] [PubMed] [Google Scholar]
- 3.Vanhaesebroeck B, Guillermet-Guibert J, Graupera M & Bilanges B The emerging mechanisms of isoform-specific PI3K signalling. Nat Rev Mol Cell Biol 11, 329–341 (2010). [DOI] [PubMed] [Google Scholar]
- 4.Lanutti BJ et al. CAL-101, a p110delta selective phosphatidylinositol-3-kinase inhibitor for the treatment of B-cell malignancies, inhibits PI3K signaling and cellular viability. Blood 117, 591–594 (2011). [DOI] [PMC free article] [PubMed] [Google Scholar]
- 5.Furman RR et al. Idelalisib and rituximab in relapsed chronic lymphocytic leukemia. N Engl J Med 370 (2014). [DOI] [PMC free article] [PubMed] [Google Scholar]
- 6.Hanna S & El-Sibai M Signaling networks of Rho GTPases in cell motility. Cellular Signaling 25, 1955–1961 (2013). [DOI] [PubMed] [Google Scholar]
- 7.Parri M & Chiarugi P Rac and Rho GTPases in cancer cell motility control. Cell Commun Signaling 8 (2010). [DOI] [PMC free article] [PubMed] [Google Scholar]
- 8.Reiske HR et al. Requirement of phosphatidylinositol 3-kinase in focal adhesion kinase-promoted cell migration. J Biol Chem 274, 12361–12366 (1999). [DOI] [PubMed] [Google Scholar]
- 9.Webb DJ et al. FAK-Src signalling through paxillin, ERK and MLCK regulates adhesion disassembly. Nature Cell Biology 6, 154–161 (2004). [DOI] [PubMed] [Google Scholar]
- 10.Sipkins DA et al. In vivo imaging of specialized bone marrow endothelial microdomains for tumour engraftment. Nature 435, 969–973 (2005). [DOI] [PMC free article] [PubMed] [Google Scholar]
- 11.Colmone A et al. Leukemic cells create bone marrow niches that disrupt the behavior of normal hematopoietic progenitor cells. Science 322, 1861–1865 (2008). [DOI] [PubMed] [Google Scholar]
- 12.Boyerinas B et al. Adhesion to osteopontin in the bone marrow niche regulates lymphoblastic leukemia cell dormancy. Blood 121, 4821–4831 (2013). [DOI] [PMC free article] [PubMed] [Google Scholar]
- 13.Mercurio AM, Rabinovitz I & Shaw LM The alpha6beta4 integrin and epithelial cell migration. Curr Opin Cell Biol 13, 541–545 (2001). [DOI] [PubMed] [Google Scholar]
- 14.Georges-Labouesse E, Mark M, Messaddeq N & Gansmuller A Essential role of alpha6 integrins in cortical and retinal lamination. Current Biology 8, 983–986 (1998). [DOI] [PubMed] [Google Scholar]
- 15.Flanagan LA, Rebaza LM, Derzic S, Schwartz PH & Monuki ES Regulation of human neural precursor cells by laminin and integrins. J Neurosci Res 83, 845–856 (2006). [DOI] [PMC free article] [PubMed] [Google Scholar]
- 16.Belkin AM & Stepp MA Integrins as receptors for laminins. Microsc Res Tech 51, 280–301 (2000). [DOI] [PubMed] [Google Scholar]
- 17.DiGiuseppe JA, Fuller SG & Borowitz MJ Overexpression of CD49f in precursor B-cell acute lymphoblastic leukemia: potential usefulness in minimal residual disease detection. Cytometry B Clin Cytom 76, 150–155 (2009). [DOI] [PubMed] [Google Scholar]
- 18.Coustan-Smith E et al. New markers for minimal residual disease detection in acute lymphoblastic leukemia. Blood 117, 6267–6276 (2011). [DOI] [PMC free article] [PubMed] [Google Scholar]
- 19.Terol M-J et al. Expression of beta-integrin adhesion molecules in non-Hodgkin’s lymphoma: correlation with clinical and evolutive features. J Clin Oncol 17, 1869–1875 (1999). [DOI] [PubMed] [Google Scholar]
- 20.Colognato H, ffrench-Constant C & Feltri ML Human diseases reveal novel roles for neural laminins. Trends in Neurosciences 28, 480–486 (2005). [DOI] [PubMed] [Google Scholar]
- 21.Kienast Y et al. Real-time imaging reveals the single steps of brain metastasis formation. Nature Medicine 16, 116–123 (2009). [DOI] [PubMed] [Google Scholar]
- 22.Takei H, Rouah E & Ishida Y Brain metastasis: clinical characteristics, pathological findings and molecular subtyping for therapeutic implications. Brain Tumor Pathology 33, 1–12 (2016). [DOI] [PubMed] [Google Scholar]
- 23.Wilson EH, Weninger W & Hunter CA Trafficking of immune cells in the central nervous system. Journal of Clinical Investigation 120, 1368–1379 (2010). [DOI] [PMC free article] [PubMed] [Google Scholar]
- 24.Boire A et al. Complement component 3 adapts the cerebrospinal fluid for leptomeningeal metastasis. Cell 168, 1101–1113 (2017). [DOI] [PMC free article] [PubMed] [Google Scholar]
- 25.Price RA & Johnson WW The central nervous system in childhood leukemia: I. The arachnoid. Cancer 31, 520–533 (1973). [DOI] [PubMed] [Google Scholar]
- 26.Leestma JE Forensic Neuropathology. Second edn, (CRC Press, 2008). [Google Scholar]
- 27.Williams TS et al. The ability to cross the blood-cerebrospinal fluid barrier is a generic property of acute lymphoblastic leukemia blasts. Blood 127, 1998–2006 (2016). [DOI] [PubMed] [Google Scholar]
- 28.Buonamici S et al. CCR7 signalling as an essential regulator of CNS infiltration in T-cell leukaemia. Nature 459, 1000–1004 (2009). [DOI] [PMC free article] [PubMed] [Google Scholar]
- 29.Kothur K, Wienholt L, Brilot F & Dale RC CSF cytokines/chemokines as biomarkers in neuroinflammatory CNS disorders: A systematic review. Cytokine 77, 227–237 (2015). [DOI] [PubMed] [Google Scholar]
- 30.Radmanesh F et al. Mutations in LAMB1 cause cobblestone brain malformation without muscular or ocular abnormalities. American Journal of Human Genetics 92, 468–474 (2013). [DOI] [PMC free article] [PubMed] [Google Scholar]
- 31.Bovetti S et al. Blood vessels form a scaffold for neuroblast migration in the adult olfactory bulb. J Neurosci 27, 5976–5980 (2007). [DOI] [PMC free article] [PubMed] [Google Scholar]
- 32.Wade A, McKinney A & Phillips JJ Matrix regulators in neural stem cell fuctions. Biochim Biophys Acta 1840, 2520–2525 (2014). [DOI] [PMC free article] [PubMed] [Google Scholar]
- 33.Louveau A et al. Structural and functional features of central nervous system lymphatic vessels. Nature 523, 337–341 (2015). [DOI] [PMC free article] [PubMed] [Google Scholar]
Associated Data
This section collects any data citations, data availability statements, or supplementary materials included in this article.
Supplementary Materials
Data Availability Statement
Source data for quantifications mentioned in the text or shown in the graphs plotted in Figs. 1–5 and Extended Data Figs. 1–9 are available in the online version of this paper. Full scans of Western blots are provided in Supplementary Fig. 1. Microarray gene expression data that support the findings of this study have been deposited in Gene Expression Omnibus (GEO) under accession number GSE114627. The authors declare that the data supporting the findings of this study are available within the paper and its supplementary information files or from the corresponding author upon reasonable request.


