

Abstract
Adolescence is marked by increased peer influence on risk taking; however, recent literature suggests enormous individual variation in peer influence susceptibility to risk‐taking behaviors. The current study uses representation similarity analysis to test whether neural similarity between decision‐making for self and peers (i.e., best friends) in a risky context is associated with individual differences in self‐reported peer influence susceptibility and risky behaviors in adolescents. Adolescent participants (N = 166, M age = 12.89) completed a neuroimaging task in which they made risky decisions to receive rewards for themselves, their best friend, and their parents. Adolescent participants self‐reported peer influence susceptibility and engagement in risk‐taking behaviors. We found that adolescents with greater similarity in nucleus accumbens (NACC) response patterns between the self and their best friend reported greater susceptibility to peer influence and increased risk‐taking behaviors. However, neural similarity in ventromedial prefrontal cortex (vmPFC) was not significantly associated with adolescents' peer influence susceptibility and risk‐taking behaviors. Further, when examining neural similarity between adolescents' self and their parent in the NACC and vmPFC, we did not find links to peer influence susceptibility and risk‐taking behaviors. Together, our results suggest that greater similarity for self and friend in the NACC is associated with individual differences in adolescents' peer influence susceptibility and risk‐taking behaviors.
Keywords: adolescent, individual difference, peer influence, representational similarity analysis (RSA), risk taking
This research found that adolescents with greater similarity in nucleus accumbens response patterns when making decisions for themselves and a best friend reported greater susceptibility to peer influences and increased risk‐taking behaviors in daily life. Our result suggests that greater neural similarity for the self and peers in the reward system may index peer influence susceptibility and risk‐taking behaviors during adolescence. This study may provide valuable information for identifying at‐risk youths and shed light on future prevention and intervention programs.

1. INTRODUCTION
Adolescence is characterized as a time of increased risk‐taking behaviors that can subsequently lead to health‐compromising outcomes such as reckless driving, delinquency, and problematic substance use (Steinberg, 2007; Telzer, Rogers, & Hoorn, 2017). One of the hallmarks of adolescent risk‐taking is that teens take more risks in the presence of peers, and those who are generally more susceptible to peer influence engage in more risk‐taking behaviors (Albert et al., 2013; van Hoorn et al., 2016). Yet, there is notable individual variation in adolescents' peer influence susceptibility in risk‐taking contexts (Brechwald & Prinstein, 2011; Do, Prinstein, & Telzer, 2020). For instance, some teens begin to initiate substance use when they perceive their close friends engaging in such behaviors; other teens are remarkably resilient to this peer socialization process (for review, Brechwald & Prinstein, 2011). Emerging neuroimaging research suggests that brain regions involved in reward valuation are associated with risk taking and peer influence (e.g., Chein et al., 2011). However, most of this prior work has focused on how peers may modulate adolescent brain activation at the group level. The current study uses representation similarity analysis to test whether neural similarity between decision‐making for self and peers (i.e., best friends) in a risky context is associated with individual differences in self‐reported peer influence susceptibility and risky behaviors in adolescents.
1.1. Theoretical perspectives on peer influence susceptibility and risk taking in adolescence
Several theoretical perspectives elucidate why and how adolescents may conform to their peers and engage in risky behaviors. According to Social Learning Theory, adolescents learn to adopt risk‐taking behaviors by observing and imitating the behaviors (i.e., gaining peer status) of their socially valued peers (Telzer, van Hoorn, et al., 2018). Such imitation is reinforced and internalized when teens gain affirmations of peer acceptance and other social rewards from high‐status peers (Kwon & Telzer, 2022). Social Identity Theory further suggests that conforming to perceived social norms within peer groups helps individuals achieve a favorable sense of self (Abrams & Hogg, 1990). It is thus intrinsically rewarding for adolescents to conform to peers' risk‐taking behaviors and to adjust their own behaviors to match perceived group norms. Critically, Social Identity Theory posits that once risk‐taking norms within peer groups are internalized, a shared sense of risk‐related norms determines how group members behave in future risk‐taking contexts. The result is behavioral homophily (i.e., similarity) over time via a depersonalization process, during which individuals often categorize themselves in relation to peers, mentalize how peers think and act in risk‐taking contexts, and subsequently change their risk‐related behaviors and attitudes to adhere to the norms endorsed by the peer group. Together, Social Learning and Social Identity theories suggest that adolescents who are more likely to imitate their peers, and whose self‐concept is more strongly aligned with that of their peers in risk‐taking contexts, may be more likely to adopt their peers' risk norms and change their own behaviors to match the risk‐taking social norms of their peers (for review, Kwon & Telzer, 2022). A recent theoretical framework—Representation and Incorporation of Close Others' Responses (RICOR) suggests that a wide range of others' social behaviors and attitudes are spontaneously represented by individuals, which results in self‐other overlap (i.e., similarity) that fundamentally primes one's behavioral conformity to others (Smith & Mackie, 2016). Notably, this RICOR theory suggests that this behavioral assimilation process is more likely to occur with those close to the perceivers, such as close friends. Indeed, recent developmental work shows that perceived norms from adolescents' best friends, but not from popular peers, are more significantly associated with adolescents' behaviors (Giletta et al., 2021), including risky behaviors such as substance use (Field & Prinstein, 2023).
Taken together, these theoretical perspectives demonstrate different mechanisms through which peers, particularly close friends, influence adolescents' risk‐taking behaviors and attitudes. Social rewards from peers, risk‐taking group norms, social connections, and perceptions of peers' risky behaviors may independently and synergistically influence adolescents' conformity to peer risk‐taking norms. A clear core feature of these theoretical frameworks is that peer conformity in risk‐taking contexts may manifest in a significant self‐peer overlap (i.e., similarity) in reward‐related processes. This self‐other overlap may be evinced in the similarity between neural responses from brain regions underlying reward processing. In addition, a greater self‐peer overlap in risk‐taking contexts may suggest an achieved consensus about risky behaviors among peer groups, which results in increased risk‐taking behaviors during adolescence. Therefore, according to these theories, a greater self‐other overlap, particularly with close peers, may be associated with increased susceptibility to peer influences and risk‐taking behaviors.
1.2. Neural sensitivity to peer influence and risk taking in adolescence
Although behavioral work examines individual differences in adolescents' peer influence susceptibility in risk‐taking contexts (Brechwald & Prinstein, 2011; Do, Prinstein, & Telzer, 2020), much still remains unknown about the neural correlates of individual differences in peer influence susceptibility in risk taking. Based on the aforementioned theories, the neural correlates of peer influence susceptibility in risk taking may be reflected in the similarity between neural representations of the self and peers when taking risks, particularly in neural regions involved in reward valuation including the nucleus accumbens (NACC) and ventromedial prefrontal cortex (vmPFC).
Adolescents' tendency to align their behaviors and attitudes with their peers may be driven by the desire to attain social rewards from their peers. The NACC is involved in value‐based learning and underlies reward‐seeking behaviors (Crone et al., 2016; van Duijvenvoorde et al., 2016; Hartley & Somerville, 2015; Telzer, 2016; Telzer, Rogers, & Hoorn, 2017). A rich neuroimaging literature has demonstrated that, on average, adolescents exhibit increased activation in the NACC during reward processing and risk taking, when compared to children and adults (Braams et al., 2014; Braams et al., 2015; Chein et al., 2011; Sherman et al., 2017). Importantly, the NACC is also sensitive to peer influence in risk‐taking contexts, such that adolescents exhibit greater activation in the NACC on average when taking risks in the presence of their peers compared to the absence of their peers (Chein et al., 2011; Smith et al., 2013). In addition, a recent neuroimaging meta‐analysis found that the NACC is robustly activated when adolescents make decisions that affect others (e.g., vicarious risk decisions), suggesting the NACC is hypersensitive to socio‐emotional influences (van Hoorn et al., 2019).
Another important region that may underlie adolescent risk taking is the vmPFC, which is heavily interconnected with the ventral striatum and plays a critical role in learning and representing the expected values from decisions (for review, Crone et al., 2016). A large body of neuroimaging work has revealed increased activation in the vmPFC during decision‐making and reward processing in adolescents, which is associated with more risk‐taking behaviors (Casey et al., 2008; Güroğlu & Veenstra, 2021; Hartley & Somerville, 2015). Importantly, research suggests that activation of the vmPFC is also hypersensitive to social influence, especially peer influence (for review, Telzer et al., 2018). For example, adolescents exhibit heightened activation in the vmPFC when conforming to their peers' attitudes compared to a control condition (e.g., no peer feedback) in social influence tasks (Do, McCormick, & Telzer, 2020; Welborn et al., 2016). Collectively, this extant literature suggests that the vmPFC may also underlie adolescents' peer influence susceptibility and risk‐taking behaviors.
1.3. The present study
According to the existing theories, the extent to which adolescents represent themselves as similar to their peers may be a correlate of their peer influence susceptibility and risk‐taking behavior. Unlike traditional activation magnitude methods of analyzing neuroimaging data, pattern‐based analytic techniques can reveal whether adolescents who show greater similarity in the neural patterns that represent their own and their peers' risk‐taking decisions are also more likely to be susceptible to their peers' risky attitudes and behaviors and more likely to engage in risk‐taking behaviors themselves. Representational similarity analysis (RSA) is a multivariate method that uses multivoxel pattern responses to represent stimuli and measures the psychological distance between stimuli (Kriegeskorte et al., 2008; Popal et al., 2020). This novel approach differs from previous neuroimaging work that has used univariate approaches to investigate the neural correlates of risk taking in adolescents, because it focuses on the similarity in neural patterns between conditions, as opposed to the magnitude of activation in a brain region. In addition, measuring individual differences in representational spaces with trial‐based multivoxel pattern analysis increases the reliability and predictive efficacy of task‐based fMRI measures by optimizing the high dimensionality inherent in neuroimaging data, which ultimately enhances the accuracy of examining neural correlates of behaviors (Elliott et al., 2020; Kragel et al., 2020). Our study findings may provide researchers with valuable information about the neural signature that can be used to identify those youths who are at risk.
In the current study, we used RSA to examine neural similarity in reward‐related regions including the NACC and vmPFC when adolescents made risk‐related decisions for themselves, their best friends, and their parents, with a particular focus on how individual differences in the neural similarity between the self and a peer (i.e., a best friend) may relate to individual differences in adolescents' peer influence susceptibility and risk‐taking behaviors. We used a vicarious decision‐making paradigm (e.g., making decisions for peers) as the literature has suggested that the perception of others' risky decisions is a more robust indicator of adolescents' risk‐taking behaviors than others' actual behavior (Prinstein & Wang, 2005). In addition, best friends of teenaged participants were used as the peer in the paradigm, as a rich body of literature has suggested that close friends, compared to other peers (e.g., popular peers), are a stronger source of influence on adolescents' risk‐taking behaviors (Field & Prinstein, 2023). We hypothesized that adolescents' greater neural similarity in the NACC and vmPFC when making decisions for themselves and their best friend would be associated with more self‐reported peer influence susceptibility, and greater neural similarity in the NACC and vmPFC when making decisions for themselves and their best friend would be associated with increased self‐reported risk‐taking behaviors. Finally, we examined the specificity of these effects by examining self‐other overlap with a parent, hypothesizing that neural similarity in the NACC and vmPFC when making decisions for themselves and their parent would not be associated with susceptibility to peer influence and risk‐taking behaviors.
2. METHODS
2.1. Participants
Adolescent participants were recruited from a large longitudinal study of 873 sixth‐ and seventh‐grade students mainly from three public middle schools in the southeast of the United States to participate in a longitudinal fMRI study. A total of 341 participant families who expressed interest in participating in a subsequent neuroimaging study were contacted for screening. A total of 126 participants were excluded during screening. Specifically, participants were excluded from scanning if they had any metal in their body including braces or permanent retainer, claustrophobia, history of seizure or head trauma, or developmental delays (e.g., learning disability). Out of the remaining 215 participants, 37 participants were eligible but did not participate due to scheduling difficulties or because they were no longer interested in participation. We recruited two cohorts of participants across the first 2 years of the study. Specifically, 148 adolescents participated at wave 1 of the study (cohort 1) and 30 participated at wave 2 of the study (cohort 2), which resulted in a total of 178 participants who completed the neuroimaging session. These adolescent participants were selected for the fMRI study because of their interest in participating and their ability to pass the MRI safety screening procedures, without regard for their demographics, behavioral performance, or survey responses in the larger longitudinal study. Seven participants were excluded due to exclusionary criteria before the scanning session (e.g., having braces). Two participants' data were not analyzable due to computer errors. Out of the remaining 169 participants, three participants were excluded due to excessive motion (i.e., more than 20% of time points with >0.9 mm framewise displacement [FD] in a run or average FD across each run >0.5 mm). The final sample size in the current study included 166 participants (M age = 12.89, SD = 0.58; 78 female adolescents). See Table 1 for demographic information about adolescent and parent participants. Participants were asked to do a 24‐h medication wash prior to the scan if they regularly took medications (e.g., ADHD medication). All participants and parents provided informed consent/assent prior to scanning and the Institutional Review Board at the University of North Carolina at Chapel Hill approved all aspects of the current study. All participants and parents were financially compensated for their participation.
TABLE 1.
Demographic information of adolescent participants
| Demographics variables | N = 166 (in analysis) | |
|---|---|---|
| n | % | |
| Biological sex | ||
| Female | 78 | 46.9 |
| Male | 88 | 53.1 |
| Race/ethnicity | ||
| White | 50 | 30.1 |
| Black/African American | 38 | 22.9 |
| Hispanic/Latinx | 59 | 35.5 |
| Multiracial | 14 | 8.4 |
| Other | 5 | 3.0 |
| Prescription medication | ||
| Using prescription | 34 | 20.5 |
| No prescription | 112 | 67.5 |
| Missing information | 20 | 12.0 |
| SES (family total annual income) | ||
| $0–$14,999 | 19 | 11.4 |
| $15,000–$29,999 | 33 | 19.9 |
| $30,000–$44,999 | 34 | 20.5 |
| $45,000–$59,999 | 19 | 11.4 |
| $60,000–$74,999 | 27 | 16.3 |
| $75,000–$89,999 | 9 | 5.4 |
| $90,000–$99,999 | 5 | 3.0 |
| $100,000–$119,999 | 4 | 2.4 |
| $120,000–$150,000 | 6 | 3.6 |
| >$150,000 | 6 | 3.6 |
| Missing information | 4 | 2.4 |
| Parent education (mother mostly) | ||
| <8th grade | 17 | 10.4 |
| 8th grade completed | 5 | 3.0 |
| Some high school | 19 | 11.6 |
| High school completed | 26 | 15.9 |
| Some college | 49 | 29.9 |
| Associate's degree | 25 | 15.2 |
| Bachelor's degree | 12 | 7.3 |
| Some graduate school | 3 | 1.8 |
| Graduate or professional degree | 8 | 4.8 |
| Missing information | 2 | 1.2 |
Note: Demographic information was reported by adolescent participants or their caregivers. Medication, family total annual income, and parent education were reported by adolescent caregivers. Biological sex, age, and race/ethnicity were reported by adolescents. All adolescent participants are fluent English speakers. Parent education was reported by teens' caregivers who visited for scanning (90.5% were mothers during visits). Most of the adolescents who reported taking prescriptions were taking medications for allergies.
2.2. Cups fMRI task
Adolescents completed a modified version of cups task (Levin & Hart, 2003), which has previously been used to examine risky decision‐making for self and others in developmental samples (Kwon et al., 2021). Participants completed three runs of the cups task: one in which participants made decisions for themselves (i.e., self condition), one for their parents (i.e., parent condition), and one for their best friend (i.e., best friend condition). The order in which participants completed each run was counterbalanced across participants.
On each trial, participants were presented with two scenarios of cups on the scanning screen: the cup on the left side always had one cup with a guaranteed 15 cents hidden under the cup, whereas on the right side, the number of cups (either two, three, or five cups) and the amount of potential reward (either 30, 45, or 75 cents) varied (see Figure 1). The money value on the right side was always larger than 15 cents; however, the money was only hidden under one of the cups on the right side. Participants were instructed that if they made the decision to choose the right side, then the computer would randomly select one of the cups on the right side, and they may earn a higher amount of money or 0 cents, whereas if they chose the left side, then they were guaranteed to gain 15 cents as a reward. Selecting the cup on the left side equates to making a safe decision, as it is always associated with a known outcome (i.e., 15 cents), whereas picking the right side represents making a risky decision since the potential rewards may be higher but they risk earning 0 cents. After each decision, participants were shown the outcomes of their decisions. The outcomes of each trial were added to the running total for that run, which was shown to the participant at the end of each run. Participants completed 45 trials for each run of the task. The rewards gained in each run were given to adolescent participants, their parents, and mailed to their best friends after the scan. Participants' parents and peers did not know that the adolescents were winning money for them until they received the monetary rewards.
FIGURE 1.

Example trial of the modified cups task during scan. In this example, participants chose the risky option and subsequently gained a reward of cents. Each trial consists of an intertrial jittered fixation, a decision‐making phase in which adolescents will make a response (risky or safe), an outcome jittered fixation, and an outcome phase in which adolescents will see the outcome of their decisions.
There were two phases in each trial: the decision‐making and outcome phases. On each trial, the cups were shown on the screen for 3000 ms, within which participants made their decision. Next, a fixation cross was jittered around an average of 2300 ms (range from 526.88 to 4017.12 ms), which was followed by the outcome for 1000 ms. Then, there was an intertrial fixation across that was jittered around an average of 2521.39 ms (range from 521.14 to 3913.31 ms). If participants did not make a decision within the given time, “too late” was shown on the screen to remind participants and there was no change in the total points.
2.3. Questionnaire measures
2.3.1. Susceptibility to peer influence
To examine susceptibility to peer influence in adolescents, we employed a revised version of the Resistance to Peer Influence Scale (Steinberg & Monahan, 2007) that included 10 items (e.g., “I go along with my friends just to keep my friends happy,” “It's pretty easy for my friends to get me to change my mind”). The original measure uses a two‐question tree‐structure for each item to derive final scores on a 4‐point Likert scale. To simplify readability for participants, items used in the current study were condensed into one question each on a 1 (really true) to 4 (not at all true) scale. A total mean score for all items was calculated. The values were reverse‐scored such that higher scores indicate greater peer influence susceptibility (i.e., lower resistance to peer influence), while lower scores indicate lower peer influence susceptibility (i.e., higher resistance to peer influence). The scale demonstrated good reliability in this study (Cronbach's alpha = .86).
2.3.2. Adolescent risk‐taking behavior
A modified version of the Adolescent Risk Taking Scale (Alexander et al., 1990) was used to measure how often adolescents engage in risky behaviors. Adolescents responded to 14 items using a 4‐point scale (never, once or twice, several times, and many times) to indicate the frequency with which they have engaged in risky behaviors. The scale included questions about rule breaking (e.g., “I have snuck out of my house without my parents knowing”), sexual activity (e.g., “I have had sex with someone I just met”), substance use (e.g., “I have gotten drunk or high at a party”), dangerous behavior (e.g., “I did something risky or dangerous on a dare”), and risky driving (e.g., “I have ridden in a car without wearing a seat belt”). A total mean score for all items was calculated. This modified ART scale demonstrated good reliability in the present study (Cronbach's alpha = .79).
2.4. Neuroimaging data acquisition and preprocessing
Imaging data were collected using a 3 Tesla Siemens Prisma MRI scanner at Biomedical Research Imaging Center on campus. The cups fMRI task was presented on a computer screen and projected through a mirror. A high‐resolution structural T2*‐weighted echo‐planar imaging (EPI) volume (TR = 2000 ms; TE = 25 ms; matrix = 92 × 92; FOV = 230 mm; 37 slices; slice thickness = 3 mm; voxel size 2.5 × 2.5 × 3 mm3) was acquired coplanar with a T2*‐weighted structural matched‐bandwidth (MBW), high‐resolution, anatomical scan (TR = 5700 ms; TE = 65 ms; matrix = 192 × 192; FOV = 230 mm; 38 slices; slice thickness = 3 mm). In addition, a T1* magnetization‐prepared rapid‐acquisition gradient echo (TR = 2400 ms; TE = 2.22 ms; matrix = 256 × 256; FOV = 256 mm; sagittal plane; slice thickness = 0.8 mm; 208 slices) was acquired. The orientation for the EPI and MBW scans was oblique axial to maximize brain coverage and reduce noise.
2.4.1. Anatomical data preprocessing
Anatomical data in this study were preprocessed using fMRIPrep 1.5.3 (Esteban et al., 2018; Esteban et al., 2020), a Nipype‐based tool (Gorgolewski et al., 2011). Each T1‐weighted (T1w) image was corrected for intensity nonuniformity with N4BiasFieldCorrection (Tustison et al., 2010) and used as T1W‐reference throughout the workflow. The T1w‐reference was then skull‐stripped with a Nipype implementation of the antsBrainExtraction.sh workflow (from ANTs), using OASIS30ANTs as target template. Brain tissue segmentation of cerebrospinal fluid (CSF), white matter (WM), and gray matter (GM) was performed on the brain‐extracted T1w using fast (FSL 5.0.9, RRID:SCR_002823, (Zhang et al., 2011). Brain surfaces were reconstructed using recon‐all (FreeSurfer 6.0.1, RRID:SCR_001847, Dale et al., 1999), and the brain mask estimated previously was refined with a custom variation of the method to reconcile ANTs‐derived and FreeSurfer‐derived segmentations of the cortical gray‐matter of Mindboggle (RRID:SCR_002438, Klein et al., 2017)). Volume‐based spatial normalization to one standard space (MNI152NLin2009cAsym) was performed through nonlinear registration with antsRegistration (ANTs 2.2.0), using brain‐extracted versions of both T1w reference and the T1w template. The following template was selected for spatial normalization: ICBM 152 Nonlinear Asymmetrical template version 2009c (Fonov et al., 2011, RRID:SCR_008796; Template Flow ID: MNI152NLin2009cAsym).
2.4.2. Functional data preprocessing
Functional data were also preprocessed using fMRIPrep 1.5.3 (Esteban et al., 2018; Esteban et al., 2020). For each of the BOLD runs, preprocessing of the functional data included slice time correction, motion correction, and co‐registration to the T1‐weighted image. First, a reference volume and its skull‐stripped version were generated using fMRIPrep. The BOLD reference was then co‐registered to the T1W reference using bbregister (FreeSurfer) which implements boundary‐based registration (Greve & Fischl, 2009) with six degrees of freedom. Head‐motion parameters with respect to the BOLD reference (transformation matrices, and six corresponding rotation and translation parameters) are estimated before any spatiotemporal filtering using mcflirt (FSL 5.0.9, Jenkinson et al., 2002). BOLD runs were slice‐time corrected using 3dTshift from AFNI (Cox & Hyde, 1997, RRID:SCR_005927). The BOLD time‐series were resampled to surfaces on the following spaces: fsaverage5. The BOLD time‐series (including slice‐timing correction) were resampled onto their original, native space by applying the transforms to correct for head‐motion. The BOLD time‐series were resampled into standard space, generating a preprocessed BOLD run in (“MNI152NLin2009cAsym”) space.
Several confounding time‐series were calculated based on the preprocessed BOLD: FD (i.e., FD), DVARS (i.e., the root mean square of the temporal change of the fMRI voxel‐wise signal at each time point), and three region‐wise global signals. FD and DVARS were calculated for each functional run, both using their implementations in Nipype (following the definitions by Power et al., 2014). The three global signals are extracted within the CSF, the WM, and the whole‐brain masks. Additionally, a set of physiological regressors were extracted to allow for component‐based noise correction (CompCor, Behzadi et al., 2007). High‐pass filtering was conducted in the preprocessed BOLD time‐series using a discrete cosine filter with 128 s cut‐off. The head‐motion estimates calculated in the correction step were also placed within the corresponding confounds file. The confound time series derived from head motion estimates and global signals were expanded with the inclusion of temporal derivatives and quadratic terms for each (Satterthwaite et al., 2013). Functional images were left unsmoothed to avoid autocorrelation between voxels. Quality checks included a visualization of output for all participants. Many internal operations for functional processing workflow of fMRIPrep use Nilearn 0.6.0 (Abraham et al., 2014, RRID: SCR_001362).
2.5. Region of interests selection
We focused on two brain regions related to reward processing during social decision‐making: NACC and vmPFC, which subserve adolescent risk taking and peer influence susceptibility (e.g., see van Hoorn et al., 2019). Because region of interest (ROI) selections are sometimes ambiguous in the literature (e.g., studies define the same region using different coordinates), traditional methods of identifying functionally defined ROIs always require subjective judgment calls about which cluster should be taken as the ROI in question, raising the possibility of bias from researchers. To minimize the subjectivity inherent in selecting ROIs, we conducted a meta‐analysis to functionally define ROIs using NeuroSynth (Yarkoni et al., 2011), a platform for large‐scale, automated synthesis of fMRI data extracted from published studies (https://neurosynth.org/). The ROIs were identified by searching “decision‐making” in NeuroSynth. The coordinates of bilateral NACC and vmPFC were identified from 506 published articles. A “uniformity test map” of voxel‐wise z‐scores was constructed to help identify regions consistently active across these studies (z = 3.1, false discovery rate [FDR] corrected p < .01). The uniformity test map displays the degree to which each voxel is consistently activated in studies. Activation maps were then downloaded and opened in FSLeyes to identify the peak Montreal Neurological Institute (MNI) coordinates for the bilateral NACC (left NACC: x = −7, y = 7, z = −6; right NACC: x = 8, y = 11, z = −5), and the coordinates for vmPFC (x = 0, y = 50, z = 10). We then constructed spherical ROIs (6 mm radius) centered on these coordinates (see Figure 2 for the selected ROIs), in line with previous studies (Cracco et al., 2018; Garcea & Buxbaum, 2019; O'Hearn et al., 2020).
FIGURE 2.

Regions of interest used for representational similarity analyses. NACC, nucleus accumbens; vmPFC, ventromedial prefrontal cortex. The NACC and vmPFC were meta‐analytically defined using NeuroSynth (https://neurosynth.org/). Meta‐analysis results were corrected using false discovery rate (FDR; p < .01). Peak coordinates for regions of interest were selected. All selected regions of interest (ROIs) were displayed using FSLeyes.
2.6. Representational similarity analysis
The RSA produces a “similarity score” (Kriegeskorte et al., 2008; Kriegeskorte & Kievit, 2013), which characterizes the representational properties underlying multivariate data within an ROI for a set of stimuli. We use the regression coefficients (β) from the general linear models (GLMs) to compute multivariate similarities at the voxel level in the ROIs. To individually compute the representation maps for vicarious decision‐making (i.e., self and best friend conditions), we took the trial‐based representational similarity matrix. First, we used a least‐squares analytical framework to obtain trial‐level estimates of the BOLD signal (Abdulrahman & Henson, 2016; Rissman et al., 2004). Here, we opted to use the least‐square separate to control the collinearity between BOLD responses to successive trials (Mumford et al., 2012; Turner et al., 2010). This method estimates a separate GLM for each trial. Within each GLM, the trial of interest (i.e., target trial) is modeled as a regressor while all the (i.e., nontarget) trials are collapsed into another regressor as confound. Given that slice time correction in fMRIPrep is referenced to the middle slice which leads to a time‐shift in the onsets by 0.5 TR (see https://mybinder.org/v2/gh/poldrack/SliceTimingCorrection/HEAD?filepath=SliceTimingSimulation.ipynb), we set a parameter in our Nilearn model to specify the reference slice, which ensures the GLM and data are aligned. Finally, a fixed‐effects GLM was created for the decision phase on each trial of the cups task within each participant. Decision phase was defined as the time between the onset of each trial and when participants pressed a button to make their decision (i.e., duration is equal to the response time). Single‐trial activity response (instead of average BOLD response) to each stimulus was extracted from each ROI in each participant using the Nilearn package (Abraham et al., 2014). Pandas package in Python was used to construct an individual‐level array of voxel‐wise estimates for each condition. With this array, we calculated individual voxel‐wise representational similarity coefficients using Pearson correlation while six motions were regressed out as confounds (e.g., Chikazoe et al., 2014; see Figure 3a). This resulted in an average voxel‐wise pattern similarity coefficient for each condition and each subject in each ROI. To compute the voxel‐wise representational similarity between decision‐making for the self and best friends, we conducted a pairwise correlation between the neural responses at the voxel level for each subject in each ROI (see Figure 3b). Similar method can be found in previous studies (Merchant et al., 2022; O'Hearn et al., 2020). Within each matrix, only the upper triangular portion of the voxel‐wise pattern similarity matrix was used for computing similarity coefficients, since the diagonal of a correlation matrix is uninformative, and the lower triangular portion is redundant with the upper. This procedure produced six similarity coefficients for each subject in each ROI including three similarity coefficients for each experimental condition (i.e., self, peer, and parent), as well as three coefficients for the neural similarity between conditions (i.e., self and peer, self and parent, parent and peer). We then normalized the similarity coefficients using Fisher r‐to‐z transformation before statistical analyses. Prior to analyses, normal distribution was examined, and values were Winsorized at 2 SD above or below the mean, as appropriate (Dixon, 1980). Results with non‐winsorized data are provided in the Supplemental Material for a robustness check. This study was not preregistered.
FIGURE 3.

Schematic of representational similarity analysis procedure. (a) The voxel‐wise similarity matrices of decision‐making for adolescents' selves and their best friends, respectively. Predefined right nucleus accumbens (NACC) in one subject was shown as an example here. (b) We conducted a pairwise correlation between the neural responses for the neural similarity for each subject in each region of interest (ROI). Note that this figure is only for illustration purpose (not actual heat maps), each cell in the matrices represents a trial‐based parameter estimate (i.e., beta weight) at voxel level.
3. RESULTS
3.1. Association between neural similarity and peer influence susceptibility and risk taking
We first examined whether patterns of activation across voxels within ROIs carry information about decision‐making for the self and best friends. To do so, we used one‐sample t‐tests to examine whether the neural representational similarity for each condition at the voxel level is significantly above zero. A similar analysis strategy can be found in previous studies (e.g., Chikazoe et al., 2014; Kriegeskorte et al., 2008; https://dartbrains.org/content/RSA.html). The neural similarity at the voxel level between decision‐making for the self and best friend (i.e., self‐peer overlap) was not significantly different from 0 in any ROI (left NACC: t = .12, p = .90; right NACC: t = .12, p = .90; vmPFC: t = −0.64, p = .52; two‐tailed). This result suggests there was substantial individual variation in the way adolescents' brains represented themselves and best friend while making decisions (see Figure 4 for distributions). Neural similarity between the self and best friend in each ROI was not associated with adolescents' self‐reported biological sex, self‐reported ethnicity/race, parent‐reported family income, and parent‐reported education (see Supplemental Material). Further, we used paired‐sample t‐tests to examine whether the voxel‐wise representation similarities are different while making risky decisions for the self and best friends (see Supplemental Figure 1 for results).
FIGURE 4.
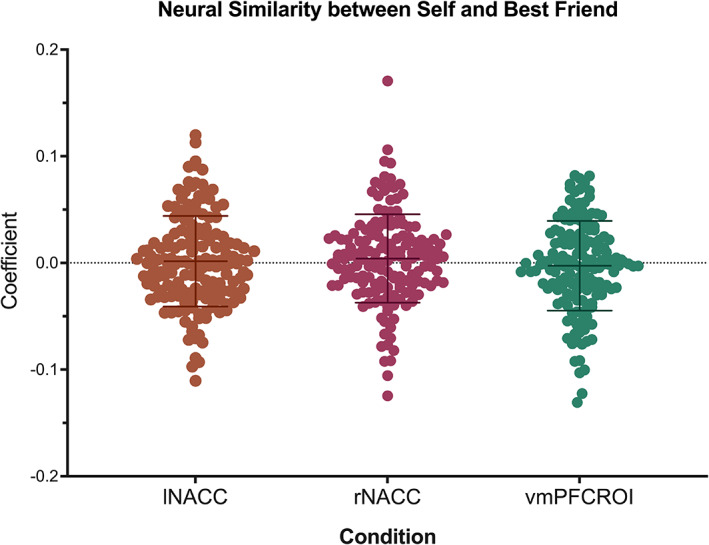
Distribution of the coefficients for the similarity between decision‐making for the self and best friend. lNACC and rNACC—left and right nucleus accumbens. Error bars represent the standard deviations (SD). As the figure shows, there is individual variation in the way adolescents similarly represent the self and their best friend while making decisions in risk‐taking contexts.
Our primary set of analyses focused on whether individual differences in neural similarity between self and a best friend while making decisions would be associated with adolescents' self‐reported susceptibility to peer influence and risk‐taking behaviors. To do so, we conducted correlation analyses between adolescents' neural similarity between decision‐making for the self and a best friend and self‐reported susceptibility to peer influence and risk‐taking behaviors. Results were Bonferroni corrected for the number of ROIs. Results demonstrate that adolescents with greater neural similarity in the right NACC for the self and a best friend during risk taking report being more susceptible to peer influence (r = .18, p = .04, CI = [.04, .22]; two‐tailed with correction, see Figure 5a). We also found that adolescents with greater neural similarity in the left NACC for the self and a best friend during risk taking report being more likely to engage in risk‐taking behaviors (r = .19, p = .04, CI = [.02, .38]; two‐tailed with correction, see Figure 5b). All p values reported here were Bonferroni adjusted. These correlational results were replicated while including self‐reported sex, self‐reported ethnicity/race, parent‐reported family income, and parent‐reported education as covariates (see Supplemental Material). No effects were found in the vmPFC for self‐friend neural similarity (see Supplemental Figure 2), suggesting the self‐friend overlap effect is specific to the NACC.
FIGURE 5.
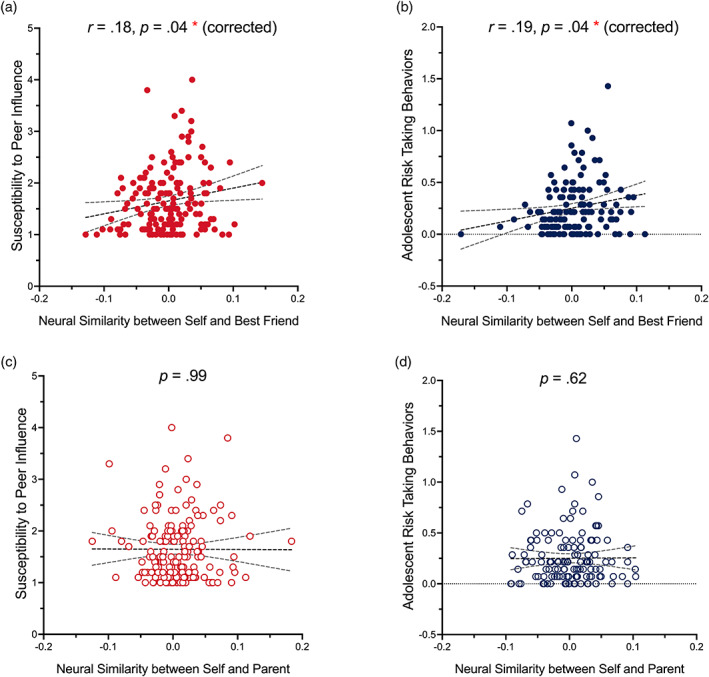
Regressions of susceptibility to peer influence and risk taking on the neural similarity in the nucleus accumbens (NACC). Neural similarity in the NACC between decision‐making for the self and a best friend is positively associated with adolescents' (a) Susceptibility to peer influence and (b) risk‐taking behavior. Neural similarity in the NACC between decision‐making for the self and a parent is not significantly associated with adolescents' (c) Susceptibility to peer influence susceptibility or (d) risk‐taking behavior. 95% confidence intervals (CIs) for the relations are displayed. All reported p values were Bonferroni adjusted.
Last, we tested the specificity of these effects of neural similarity between the self and a best friend. We included analyses testing whether neural similarity in the same ROIs when making decisions for the self and a parent would be associated with self‐reported susceptibility to peer influence and risk‐taking behaviors. We did not find that neural similarity between decision‐making for the self and a parent in the NACC or vmPFC was associated with adolescents' peer influence susceptibility or risk‐taking behaviors (see Figure 5c,d).
4. DISCUSSION
Adolescence is characterized by increased susceptibility to peer influence and risk‐taking behaviors. While emerging work suggests notable variabilities in adolescents' peer influence susceptibility and risk‐taking behaviors (Brechwald & Prinstein, 2011; Telzer et al., 2021), the neural mechanisms underlying these individual differences remain largely unknown. The main goal of this study was to examine whether variability in neural similarity between decision‐making for adolescents themselves and their best friend (i.e., self‐friend overlap) is associated with adolescents' self‐reported peer influence susceptibility and risk‐taking behaviors. Consistent with our hypothesis, our voxel‐wise RSA revealed that increased neural similarity in the NACC between decision‐making for the self and best friend was significantly associated with heightened self‐reported susceptibility to peer influence and increased risk‐taking propensity. Inconsistent with our hypothesis, however, we did not find such an effect in the vmPFC, suggesting this self‐friend overlap effect is specific to NACC. These findings suggest that the self‐friend overlap in the NACC during reward‐related decision‐making is associated with individual differences in peer influence susceptibility and risk‐taking behaviors during adolescence, an effect that is specific to the neural similarity between the self and best friend and not to a parent.
4.1. Neural similarity in the NACC between the self and a best friend is associated with peer influence susceptibility and risk‐taking propensity
Peer influence in risk‐taking contexts might be driven by adolescents' perception of their peers' risky behaviors and norms about risk (Do, McCormick, & Telzer, 2020; Do, Prinstein, & Telzer, 2020; Prinstein & Wang, 2005; Telzer et al., 2021). An emerging body of work has begun investigating the neural correlates of vicarious decision‐making for peers, during which adolescents perceive and mentalize about how their peers would act and are asked to enact decisions on behalf of their peers. Neuroimaging findings show that the brain regions that are important for self‐oriented decision‐making are also involved in vicarious decision‐making for peers (e.g., Braams & Crone, 2017; Kwon & Telzer, 2022). These findings indicate a potential overlap in the neuropsychological processes/psychological constructs for adolescents' self‐oriented and peer‐oriented risk taking. Indeed, according to Social Identity and Social Learning theories, the degree to which the representations of the self and peers overlap in risk‐taking contexts may reflect the extent to which adolescents reach a consensus about risks with their peers and internalize peers' attitudes toward risks (for review, Kwon & Telzer, 2022). In other words, the similarity between decision‐making for adolescents themselves and their peers may indicate an adolescent's level of perceived overlap between themselves and their peers, and this may be an important index of peer influence susceptibility in risk‐taking contexts.
Consistent with our hypothesis, we found that neural similarity in the NACC between risky decision‐making for the self and a best friend is associated with adolescents' greater self‐reported peer influence susceptibility. Given that those adolescents who are generally more susceptible to peer influence engage in more risks (e.g., van Hoorn et al., 2016), we also expected that the self‐friend overlap would be associated with adolescents' self‐reported risk‐taking propensity. In line with this hypothesis, we found that neural similarity in the NACC between self and a best friend was also associated with adolescents' self‐reported engagement in risk‐taking behaviors involving rule breaking, sexual activity, substance use, dangerous behavior, or risky driving. A substantial body of neuroimaging work has indicated that the NACC, an essential region for reward processing (Knutson et al., 2001), is implicated in adolescents' risky decision‐making in the lab and is associated with adolescents' actual risk‐taking behaviors in daily life (for review, Telzer, 2016; van Duijvenvoorde et al., 2008). Importantly, prior work has also shown that activation in the NACC during decision‐making is sensitive to peer influence during adolescence, which in turn, leads to more risky behaviors in teens (e.g., Albert et al., 2013; Chein et al., 2011). However, the mechanism by which peers influence risk taking via reward system regions such as NACC is not clear. Theoretical explanations for these effects are varied, and it is thought that NACC activity may reflect increased salience of risky decisions (e.g., Chein et al., 2011), sensitization of teens to immediate rewards (e.g., Albert et al., 2013; O'Brien et al., 2011), sensitivity to peer evaluation and acceptance (e.g., Falk et al., 2012; Somerville et al., 2012), and sensitivity to anticipated social rewards (e.g., Telzer et al., 2021). Therefore, it has been challenging to explain why and how neural sensitivity to peers in the reward system predicts adolescents' own risk‐taking behaviors. Our study adds to the developmental neuroimaging literature by suggesting that the self‐friend overlap in the NACC during reward‐related decisions is an important correlate of adolescents' peer influence susceptibility and risk‐taking behaviors. This self‐friend representational similarity in the NACC may indicate that adolescents' self‐identity is more aligned with their peers' identity in risk‐taking contexts and that they have taken on the norms and attitudes toward risks of their peers.
We found this self‐friend overlap effect in the NACC, but not the vmPFC. Although the functional specificity of vmPFC in adolescents' risk taking is less clear, neural evidence in the adult literature suggests that the vmPFC receives dopaminergic inputs (Hare et al., 2009; McClure & Bickel, 2014), and is involved in computing potential reward values (Bartra et al., 2013; Basten et al., 2010). Therefore, although speculative, the present finding may suggest the mechanism through which adolescents are influenced by their peers to engage in risky behaviors is due more to the impact of peers on reward sensitivity than on the computation of reward outcomes.
Moreover, we found that the effect of neural similarity in the NACC is specific to self‐friend overlap in reward‐related decision‐making. The neural similarity between decision‐making for adolescents themselves and their parents in the NACC was not associated with adolescents' self‐reported peer influence susceptibility or risk‐taking behaviors. This finding also rules out the possibility that adolescents who engage in more risk‐taking behaviors are just generally inclined to take risks and/or more sensitive to rewards across conditions. Therefore, the effect of self‐friend overlap at the neural level revealed in the current study is likely to reflect a peer influence process, rather than an individual difference related to reward processing, more generally. These findings further suggest the importance of peer socialization in adolescent risk taking (see Brechwald & Prinstein, 2011; Telzer et al., 2022). It is important to note that the lack of an effect for self‐parent overlap in the current study does not imply that parents are not important during adolescent development. Indeed, parents remain a constant and important role in many aspects of development during adolescence (Telzer et al., 2022). For instance, parental social buffering (e.g., physical presence) facilitates the neural regulation of emotion in appetitive social contexts (Rogers et al., 2020) and risky contexts (Telzer et al., 2015), which in turn, facilitates teens' safe decisions (Guassi Moreira & Telzer, 2018). One future direction is to investigate whether and how neural similarity between the self and parents in adolescents serves as a neural buffer that reduces adolescents' sensation‐seeking behaviors via the downregulation of affective processing in risky contexts.
Together, our findings indicate that similar sensitivity to rewards when representing them for oneself and a best friend, as found in greater similarity between brain activation patterns in the NACC while making risk‐related decisions for the self and a peer, is associated with heightened susceptibility to peer influence and increased risk‐taking behaviors in adolescents. This finding adds to the developmental neuroimaging literature investigating the neural correlates of adolescents' risk taking and peer influence susceptibility in risk‐taking contexts (e.g., Telzer et al., 2021).
4.2. Contributions and implications
Our study represents an important step toward characterizing the neural correlates associated with individual differences in peer influence susceptibility and risk‐taking behaviors during adolescence. While prior studies have examined the neural correlates of risk taking and peer influence in adolescents at the group level using univariate brain mapping techniques, our study offers a novel contribution to the literature by probing how individual differences in neural similarity when representing the self and a peer predicts adolescents' peer influence susceptibility and risk taking. Consistent with the notion that sensitivity to reward, as reflected by NACC activity, does not serve as a monolithic negative susceptibility marker (Telzer et al., 2021), our finding suggests that only those adolescents who exhibit a larger self‐friend overlap (i.e., more similar neural responses) in the NACC may be vulnerable to peer influences and risk taking. This finding may provide valuable information for identifying at‐risk adolescents in the future.
In addition to advancing our theoretical understanding of the neural mechanisms associated with individual differences in peer influence susceptibility and risk‐taking behaviors during adolescence, the current study also demonstrates the utility of pattern‐based RSA for unraveling the complexity of adolescents' social behaviors. Most developmental neuroimaging studies are premised on the presumed distinctiveness between social categories and tend to compare the neural activation between conditions of a study and conclude that relative differences in brain activation reveal functional dissociations (e.g., if a brain region shows more or less activation for self‐oriented versus peer‐oriented decision‐making, it is assumed to represent self‐ versus peer‐related functions). However, the world consists of continuous dimensions, and the human brain efficiently represents graded social information (Merchant et al., 2022; Popal et al., 2020; Weaverdyck et al., 2020). Using pattern‐based multivariate fMRI analysis such as the RSA can detect the psychological distance between many social categories in adolescents, furthering our understanding of individual differences in adolescent brain development and social behaviors in complex developmental contexts.
4.3. Limitations and future directions
The use of RSA offers advantages for addressing questions about why some adolescents may be more susceptible to peer influence and may engage in more risky behaviors. Nevertheless, this study has limitations. First, our study was cross‐sectional; therefore, we cannot identify the direction of effects. It is possible that adolescents inclined to take risks are generally more sensitive to risky decision‐making processes across task conditions, resulting in a larger similarity in the NACC. However, we did not find such a relation between the self‐parent overlap in the NACC and risk‐taking behaviors, suggesting this likely is not true. Nevertheless, investigating this question in a longitudinal study will help us better disentangle this relation in a causal way.
Second, we asked adolescent participants to make decisions for their best friend during scanning but did not include their best friend in our neuroimaging study. We did so because literature has suggested that the perception of peers' risky decisions is a stronger predictor of adolescents' risk‐taking behaviors than their peers' actual behaviors (Do, McCormick, & Telzer, 2020; Do, Prinstein, & Telzer, 2020; Prinstein & Wang, 2005). However, future studies will benefit from using dyadic design, which allows us to detect interbrain similarity while making decisions. Indeed, recent neuroimaging work suggests a coordinated neural activity (i.e., intersubject similarity) among social network members, which subserves similar social behaviors among friends (Baek et al., 2022; Finn et al., 2020; Parkinson et al., 2018). Combining the RSA with a dyadic design can shed light on the brain mechanisms underlying adolescents' peer influences and collective actions in complex social contexts.
In addition, the correlation magnitudes in the current study were relatively low, suggesting that NACC neural similarity only explains a portion of the variance in peer influence susceptibility and risky behaviors. Including measures capturing both teens' perceptions of their peers' behaviors as well as their peers' actual risky behaviors in future studies may further account for the variance and increase our understanding of the relationship between adolescent brains and peer influences in risk‐taking contexts.
Finally, we used self‐report questionnaires to measure adolescents' susceptibility to peer influences and risk‐taking propensity. Although previous studies suggest excellent validity and reliability in these surveys (Alexander et al., 1990; Steinberg & Monahan, 2007), future studies will benefit from using ecologically valid and real‐world paradigms to assess adolescents' risky behaviors and peer influence susceptibility. For instance, the Balloon Analogue Risk Task is an excellent behavioral paradigm measuring individual differences in risk‐taking behaviors (Lejuez et al., 2002). Ecological momentary assessment, which captures an individual's dynamic psychological functioning and daily‐life behaviors in naturalistic settings (e.g., peer‐based social contexts), will enhance our understanding of how changes in adolescent brains are associated with adolescents' social behaviors in daily life.
5. CONCLUSION
While an emerging body of work has suggested that adolescents are not all equally susceptible to peer influences and prone to taking risks, little is known about the neural mechanisms underlying these individual differences in adolescents. We used RSA technique to investigate how self‐friend overlap in decision‐making may underlie adolescents' peer influence susceptibility and risk‐taking behaviors. Our representational similarity approach provides a novel contribution to the study of individual differences in adolescent development by revealing that greater similarity in reward sensitivity to decision‐making involving both the self and a peer are related to peer influence susceptibility and risk‐taking behavior. Future longitudinal research examining the developmental trajectories and antecedents of self‐other overlap in risk‐taking contexts will further our understanding of adolescent development.
POSITIONALITY STATEMENT
We recognize that researchers' social identities can affect how they perceive, view, and interpret their social world and subsequently influence their research practices and interpretations of data (Roberts et al., 2020). We share our positionality as researchers to allow us and others to better understand how our identities and past work may impact our research. The team for this work includes one Asian cisgender man and woman, one White cisgender man, and two White cisgender women. Our research is broadly focused on how both peers and parents influence adolescents' brain development and behaviors in different contexts. Our past work finds that in some contexts (for review, Telzer et al., 2022), parents exert important effects on adolescents' neural activation and behavior, and in others, peers exert important effects on adolescents' neural activation and behavior. The present paper adds to this work by showing that neural similarity in the NACC with a best friend (but not with a parent) during a risky decision‐making task correlates with adolescents' self‐reported peer influence susceptibility and risk‐taking behavior.
Supporting information
DATA S1 Supporting Information
ACKNOWLEDGMENTS
This research was supported by the National Institutes of Health (R01DA039923 to E.H.T; R01DA051127 to E.H.T and K.A.L). The authors would like to thank the Biomedical Research Imaging Center (BRIC) at the University of North Carolina at Chapel Hill for assistance with data collection, as well as Carina Fowler, Nathan A. Jorgensen, Susannah Ivory, Amanda Benjamin, Virnaliz Jimenez, Emily Watlington, Emily Bibby, Rosario Villa, Melissa Burroughs, Kathy Do, Ethan McCormick, Paul Sharp, Lynda Lin, Christina Rogers, Jorien van Hoorn, and Tae‐Ho Lee for assistance with study design, data collection, and analysis.
Dai, J. , Kwon, S.‐J. , Prinstein, M. J. , Telzer, E. H. , & Lindquist, K. A. (2023). Neural similarity in nucleus accumbens during decision‐making for the self and a best friend: Links to adolescents' self‐reported susceptibility to peer influence and risk taking. Human Brain Mapping, 44(10), 3972–3985. 10.1002/hbm.26317
DATA AVAILABILITY STATEMENT
The data that support the findings of this study are not available to share but the analysis code is available from the corresponding author upon request. This study was not preregistered.
REFERENCES
- Abdulrahman, H. , & Henson, R. N. (2016). Effect of trial‐to‐trial variability on optimal event‐related fMRI design: Implications for Beta‐series correlation and multi‐voxel pattern analysis. NeuroImage, 125, 756–766. 10.1016/j.neuroimage.2015.11.009 [DOI] [PMC free article] [PubMed] [Google Scholar]
- Abraham, A. , Pedregosa, F. , Eickenberg, M. , Gervais, P. , Mueller, A. , Kossaifi, J. , … Varoquaux, G. (2014). Machine learning for neuroimaging with scikit‐learn. Frontiers in Neuroinformatics, 8, 14. 10.3389/fninf.2014.00014 [DOI] [PMC free article] [PubMed] [Google Scholar]
- Abrams, D. E. , & Hogg, M. A. (1990). Social identity theory: Constructive and critical advances. Springer‐Verlag Publishing. [Google Scholar]
- Albert, D. , Chein, J. , & Steinberg, L. (2013). Peer influences on adolescent decision making. Current Directions in Psychological Science, 22(2), 114–120. 10.1177/0963721412471347 [DOI] [PMC free article] [PubMed] [Google Scholar]
- Alexander, C. S. , Kim, Y. J. , Ensminger, M. , Johnson, K. E. , Smith, B. J. , & Dolan, L. J. (1990). A measure of risk taking for young adolescents: Reliability and validity assessments. Journal of Youth and Adolescence, 19(6), 559–569. 10.1007/bf01537176 [DOI] [PubMed] [Google Scholar]
- Baek, E. C. , Hyon, R. , López, K. , Finn, E. S. , Porter, M. A. , & Parkinson, C. (2022). In‐degree centrality in a social network is linked to coordinated neural activity. Nature Communications, 13(1), 1118. 10.1038/s41467-022-28432-3 [DOI] [PMC free article] [PubMed] [Google Scholar]
- Bartra, O. , McGuire, J. T. , & Kable, J. W. (2013). The valuation system: A coordinate‐based meta‐analysis of BOLD fMRI experiments examining neural correlates of subjective value. NeuroImage, 76, 412–427. 10.1016/j.neuroimage.2013.02.063 [DOI] [PMC free article] [PubMed] [Google Scholar]
- Basten, U. , Biele, G. , Heekeren, H. R. , & Fiebach, C. J. (2010). How the brain integrates costs and benefits during decision making. Proceedings of the National Academy of Sciences of the United States of America, 107(50), 21767–21772. 10.1073/pnas.0908104107 [DOI] [PMC free article] [PubMed] [Google Scholar]
- Behzadi, Y. , Restom, K. , Liau, J. , & Liu, T. T. (2007). A component based noise correction method (CompCor) for BOLD and perfusion based fMRI. NeuroImage, 37(1), 90–101. 10.1016/j.neuroimage.2007.04.042 [DOI] [PMC free article] [PubMed] [Google Scholar]
- Braams, B. R. , & Crone, E. A. (2017). Longitudinal changes in social brain development: Processing outcomes for friend and self. Child Development, 88(6), 1952–1965. 10.1111/cdev.12665 [DOI] [PubMed] [Google Scholar]
- Braams, B. R. , Peters, S. , Peper, J. S. , Gürolu, B. , & Crone, E. A. (2014). Gambling for self, friends, and antagonists: Differential contributions of affective and social brain regions on adolescent reward processing. NeuroImage, 100, 281–289. 10.1016/j.neuroimage.2014.06.020 [DOI] [PubMed] [Google Scholar]
- Braams, B. R. , van Duijvenvoorde, A. C. , Peper, J. S. , & Crone, E. A. (2015). Longitudinal changes in adolescent risk‐taking: A comprehensive study of neural responses to rewards, pubertal development, and risk‐taking behavior. The Journal of Neuroscience, 35(18), 7226–7238. 10.1523/JNEUROSCI.4764-14.2015 [DOI] [PMC free article] [PubMed] [Google Scholar]
- Brechwald, W. A. , & Prinstein, M. J. (2011). Beyond homophily: A decade of advances in understanding peer influence processes. Journal of Research on Adolescence, 21(1), 166–179. 10.1111/j.1532-7795.2010.00721.x [DOI] [PMC free article] [PubMed] [Google Scholar]
- Casey, J. B. , Jones, R. M. , & Hare, T. A. (2008). The adolescent brain. Annals of the New York Academy of Sciences, 1124(1), 111–126. [DOI] [PMC free article] [PubMed] [Google Scholar]
- Chein, J. , Albert, D. , O'Brien, L. , Uckert, K. , & Steinberg, L. (2011). Peers increase adolescent risk taking by enhancing activity in the brain's reward circuitry. Developmental Science, 14, F1–F10. 10.1111/j.1467-7687.2010.01035.x [DOI] [PMC free article] [PubMed] [Google Scholar]
- Chikazoe, J. , Lee, D. H. , Kriegeskorte, N. , & Anderson, A. K. (2014). Population coding of affect across stimuli, modalities and individuals. Nature Neuroscience, 17(8), 1114–1122. 10.1038/nn.3749 [DOI] [PMC free article] [PubMed] [Google Scholar]
- Cox, R. W. , & Hyde, J. S. (1997). Software tools for analysis and visualization of fMRI data. NMR in Biomedicine, 10, 4–5. [DOI] [PubMed] [Google Scholar]
- Cracco, E. , Keysers, C. , Clauwaert, A. , & Brass, M. (2018). Representing multiple observed actions in the motor system. Cerebral Cortex, 29(8), 3631–3641. 10.1093/cercor/bhy237 [DOI] [PMC free article] [PubMed] [Google Scholar]
- Crone, E. A. , Duijvenvoorde, A. C. K. , & Peper, J. S. (2016). Annual research review: Neural contributions to risk‐taking in adolescence—Developmental changes and individual differences. Journal of Child Psychology and Psychiatry, 57(3), 353–368. 10.1111/jcpp.12502 [DOI] [PubMed] [Google Scholar]
- Dale, A. M. , Fischl, B. , & Sereno, M. I. (1999). Cortical surface‐based analysis I. Segmentation and surface reconstruction. NeuroImage, 9(2), 179–194. 10.1006/nimg.1998.0395 [DOI] [PubMed] [Google Scholar]
- Dixon, W. J. (1980). Efficient analysis of experimental observations. Annual Review of Pharmacology and Toxicology, 20, 441–462. [DOI] [PubMed] [Google Scholar]
- Do, K. T. , McCormick, E. M. , & Telzer, E. H. (2020). Neural sensitivity to conflicting attitudes supports greater conformity toward positive over negative influence in early adolescence. Developmental Cognitive Neuroscience, 45, 100837. 10.1016/j.dcn.2020.100837 [DOI] [PMC free article] [PubMed] [Google Scholar]
- Do, K. T. , Prinstein, M. J. , & Telzer, E. H. (2020). Neurobiological susceptibility to peer influence in adolescence. In The Oxford handbook of developmental cognitive neuroscience. Oxford University Press: New York, NY. 10.1093/oxfordhb/9780198827474.013.27 [DOI] [Google Scholar]
- Elliott, M. L. , Knodt, A. R. , Ireland, D. , Morris, M. L. , Poulton, R. , Ramrakha, S. , … Hariri, A. R. (2020). What is the test‐retest reliability of common task‐functional MRI measures? New empirical evidence and a meta‐analysis. Psychological Science, 31(7), 792–806. 10.1177/0956797620916786 [DOI] [PMC free article] [PubMed] [Google Scholar]
- Esteban, O. , Ciric, R. , Finc, K. , Blair, R. W. , Markiewicz, C. J. , Moodie, C. A. , … Gorgolewski, K. J. (2020). Analysis of task‐based functional MRI data preprocessed with fMRIPrep. Nature Protocols, 15(7), 2186–2202. 10.1038/s41596-020-0327-3 [DOI] [PMC free article] [PubMed] [Google Scholar]
- Esteban, O. , Markiewicz, C. J. , Blair, R. W. , Moodie, C. A. , Isik, A. I. , Erramuzpe, A. , … Gorgolewski, K. J. (2018). fMRIPrep: A robust preprocessing pipeline for functional MRI. Nature Methods, 1–6, 111–116. 10.1038/s41592-018-0235-4 [DOI] [PMC free article] [PubMed] [Google Scholar]
- Falk, E. B. , Way, B. M. , & Jasinska, A. J. (2012). An imaging genetics approach to understanding social influence. Frontiers in Human Neuroscience, 6, 168. 10.3389/fnhum.2012.00168 [DOI] [PMC free article] [PubMed] [Google Scholar]
- Field, N. H. , & Prinstein, M. J. (2023). Reconciling multiple sources of influence: Longitudinal associations among perceived parent, closest friend, and popular peer injunctive norms and adolescent substance use. Child Development, 00, 1–17. 10.1111/cdev.13898 [DOI] [PMC free article] [PubMed] [Google Scholar]
- Finn, E. S. , Glerean, E. , Khojandi, A. Y. , Nielson, D. , Molfese, P. J. , Handwerker, D. A. , & Bandettini, P. A. (2020). Idiosynchrony: From shared responses to individual differences during naturalistic neuroimaging. NeuroImage, 215, 116828. 10.1016/j.neuroimage.2020.116828 [DOI] [PMC free article] [PubMed] [Google Scholar]
- Fonov, V. , Evans, A. C. , Botteron, K. , Almli, C. R. , McKinstry, R. C. , Collins, D. L. , & Brain Development Cooperative Group . (2011). Unbiased average age‐appropriate atlases for pediatric studies. NeuroImage, 54(1), 313–327. 10.1016/j.neuroimage.2010.07.033 [DOI] [PMC free article] [PubMed] [Google Scholar]
- Garcea, F. E. , & Buxbaum, L. J. (2019). Gesturing tool use and tool transport actions modulates inferior parietal functional connectivity with the dorsal and ventral object processing pathways. Human Brain Mapping, 40(10), 2867–2883. 10.1002/hbm.24565 [DOI] [PMC free article] [PubMed] [Google Scholar]
- Giletta, M. , Choukas‐Bradley, S. , Maes, M. , Linthicum, K. P. , Card, N. A. , & Prinstein, M. J. (2021). A meta‐analysis of longitudinal peer influence effects in childhood and adolescence. Psychological Bulletin, 147(7), 719–747. 10.1037/bul0000329 [DOI] [PubMed] [Google Scholar]
- Gorgolewski, K. , Burns, C. D. , Madison, C. , Clark, D. , Halchenko, Y. O. , Waskom, M. L. , & Ghosh, S. S. (2011). Nipype: A flexible, lightweight and extensible neuroimaging data processing framework in python. Frontiers in Neuroinformatics, 5, 13. 10.3389/fninf.2011.00013 [DOI] [PMC free article] [PubMed] [Google Scholar]
- Greve, D. N. , & Fischl, B. (2009). Accurate and robust brain image alignment using boundary‐based registration. NeuroImage, 48(1), 63–72. 10.1016/j.neuroimage.2009.06.060 [DOI] [PMC free article] [PubMed] [Google Scholar]
- Güroğlu, B. , & Veenstra, R. (2021). Neural underpinnings of peer experiences and interactions: A review of social neuroscience research. Merrill‐Palmer Quarterly, 67(4), 416–456. 10.1353/mpq.2021.0021 [DOI] [Google Scholar]
- Hare, T. A. , Camerer, C. F. , & Rangel, A. (2009). Self‐control in decision‐making involves modulation of the vmPFC valuation system. Science, 324, 646–648. 10.1126/science.1168450 [DOI] [PubMed] [Google Scholar]
- Hartley, C. A. , & Somerville, L. H. (2015). The neuroscience of adolescent decision‐making. Current Opinion in Behavioral Sciences, 5, 108–115. 10.1016/j.cobeha.2015.09.004 [DOI] [PMC free article] [PubMed] [Google Scholar]
- Jenkinson, M. , Bannister, P. , Brady, M. , & Smith, S. (2002). Improved optimization for the robust and accurate linear registration and motion correction of brain images. NeuroImage, 17(2), 825–841. 10.1006/nimg.2002.1132 [DOI] [PubMed] [Google Scholar]
- Klein, A. , Ghosh, S. S. , Bao, F. S. , Giard, J. , Häme, Y. , Stavsky, E. , … Keshavan, A. (2017). Mindboggling morphometry of human brains. PLoS Computational Biology, 13(2), e1005350. 10.1371/journal.pcbi.1005350 [DOI] [PMC free article] [PubMed] [Google Scholar]
- Knutson, B. , Adams, C. M. , Fong, G. W. , & Hommer, D. (2001). Anticipation of increasing monetary reward selectively recruits nucleus accumbens. The Journal of Neuroscience, 21(16), RC159. 10.1523/jneurosci.21-16-j0002.2001 [DOI] [PMC free article] [PubMed] [Google Scholar]
- Kragel, P. A. , Han, X. , Kraynak, T. E. , Gianaros, P. J. , & Wager, T. D. (2020). Functional MRI can be highly reliable, but it depends on what you measure: A commentary on Elliott et al. (2020). Psychological Science, 32(4), 622–626. 10.1177/0956797621989730 [DOI] [PMC free article] [PubMed] [Google Scholar]
- Kriegeskorte, N. , & Kievit, R. A. (2013). Representational geometry: Integrating cognition, computation, and the brain. Trends in Cognitive Sciences, 17(8), 401–412. 10.1016/j.tics.2013.06.007 [DOI] [PMC free article] [PubMed] [Google Scholar]
- Kriegeskorte, N. , Mur, M. , & Bandettini, P. (2008). Representational similarity analysis—Connecting the branches of systems neuroscience. Frontiers in Systems Neuroscience, 2, 4. 10.3389/neuro.06.004.2008 [DOI] [PMC free article] [PubMed] [Google Scholar]
- Kwon, S.‐J. , & Telzer, E. H. (2022). Social contextual risk taking in adolescence. Nature Reviews Psychology, 1–14, 393–406. 10.1038/s44159-022-00060-0 [DOI] [Google Scholar]
- Kwon, S.‐J. , Turpyn, C. C. , Prinstein, M. J. , Lindquist, K. A. , & Telzer, E. H. (2021). Self‐oriented neural circuitry predicts other‐oriented adaptive risks in adolescence: A longitudinal study. Social Cognitive and Affective Neuroscience, 17(2), 161–171. 10.1093/scan/nsab076 [DOI] [PMC free article] [PubMed] [Google Scholar]
- Lejuez, C. W. , Read, J. P. , Kahler, C. W. , Richards, J. B. , Ramsey, S. E. , Stuart, G. L. , … Brown, R. A. (2002). Evaluation of a behavioral measure of risk taking: The balloon analogue risk task (BART). Journal of Experimental Psychology: Applied, 8(2), 75. [DOI] [PubMed] [Google Scholar]
- Levin, I. P. , & Hart, S. S. (2003). Risk preferences in young children: Early evidence of individual differences in reaction to potential gains and losses. Journal of Behavioral Decision Making, 16(5), 397–413. 10.1002/bdm.453 [DOI] [Google Scholar]
- McClure, S. M. , & Bickel, W. K. (2014). A dual‐systems perspective on addiction: Contributions from neuroimaging and cognitive training. Annals of the New York Academy of Sciences, 1327(1), 62–78. 10.1111/nyas.12561 [DOI] [PMC free article] [PubMed] [Google Scholar]
- Merchant, J. S. , Alkire, D. , & Redcay, E. (2022). Neural similarity between mentalizing and live social interaction during the transition to adolescence. Human Brain Mapping, 43, 4074–4090. 10.1002/hbm.25903 [DOI] [PMC free article] [PubMed] [Google Scholar]
- Moreira, J. F. G. , & Telzer, E. H. (2018). Mother still knows best: Maternal influence uniquely modulates adolescent reward sensitivity during risk taking. Developmental Science, 21(1), e12484. 10.1111/desc.12484 [DOI] [PMC free article] [PubMed] [Google Scholar]
- Mumford, J. A. , Turner, B. O. , Ashby, F. G. , & Poldrack, R. A. (2012). Deconvolving BOLD activation in event‐related designs for multivoxel pattern classification analyses. NeuroImage, 59(3), 2636–2643. 10.1016/j.neuroimage.2011.08.076 [DOI] [PMC free article] [PubMed] [Google Scholar]
- O'Brien, L. , Albert, D. , Chein, J. , & Steinberg, L. (2011). Adolescents prefer more immediate rewards when in the presence of their peers. Journal of Research on Adolescence, 21(4), 747–753. 10.1111/j.1532-7795.2011.00738.x [DOI] [Google Scholar]
- O'Hearn, K. , Larsen, B. , Fedor, J. , Luna, B. , & Lynn, A. (2020). Representational similarity analysis reveals atypical age‐related changes in brain regions supporting face and car recognition in autism. NeuroImage, 209, 116322. 10.1016/j.neuroimage.2019.116322 [DOI] [PubMed] [Google Scholar]
- Parkinson, C. , Kleinbaum, A. M. , & Wheatley, T. (2018). Similar neural responses predict friendship. Nature Communications, 9(1), 332. 10.1038/s41467-017-02722-7 [DOI] [PMC free article] [PubMed] [Google Scholar]
- Popal, H. , Wang, Y. , & Olson, I. R. (2020). A guide to representational similarity analysis for social neuroscience. Social Cognitive and Affective Neuroscience, 14(11), 1243–1253. 10.1093/scan/nsz099 [DOI] [PMC free article] [PubMed] [Google Scholar]
- Power, J. D. , Mitra, A. , Laumann, T. O. , Snyder, A. Z. , Schlaggar, B. L. , & Petersen, S. E. (2014). Methods to detect, characterize, and remove motion artifact in resting state fMRI. NeuroImage, 84, 320–341. 10.1016/j.neuroimage.2013.08.048 [DOI] [PMC free article] [PubMed] [Google Scholar]
- Prinstein, M. J. , & Wang, S. S. (2005). False consensus and adolescent peer contagion: Examining discrepancies between perceptions and actual reported levels of friends' deviant and health risk behaviors. Journal of Abnormal Child Psychology, 33(3), 293–306. 10.1007/s10802-005-3566-4 [DOI] [PubMed] [Google Scholar]
- Rissman, J. , Gazzaley, A. , & D'Esposito, M. (2004). Measuring functional connectivity during distinct stages of a cognitive task. NeuroImage, 23(2), 752–763. 10.1016/j.neuroimage.2004.06.035 [DOI] [PubMed] [Google Scholar]
- Roberts, S. O. , Bareket‐Shavit, C. , Dollins, F. A. , Goldie, P. D. , & Mortenson, E. (2020). Racial inequality in psychological research: Trends of the past and recommendations for the future. Perspectives on Psychological Science, 15(6), 1295–1309. 10.1177/1745691620927709 [DOI] [PubMed] [Google Scholar]
- Rogers, C. R. , Perino, M. T. , & Telzer, E. H. (2020). Maternal buffering of adolescent dysregulation in socially appetitive contexts: From behavior to the brain. Journal of Research on Adolescence, 30(1), 41–52. 10.1111/jora.12500 [DOI] [PMC free article] [PubMed] [Google Scholar]
- Satterthwaite, T. D. , Elliott, M. A. , Gerraty, R. T. , Ruparel, K. , Loughead, J. , Calkins, M. E. , … Wolf, D. H. (2013). An improved framework for confound regression and filtering for control of motion artifact in the preprocessing of resting‐state functional connectivity data. NeuroImage, 64, 240–256. 10.1016/j.neuroimage.2012.08.052 [DOI] [PMC free article] [PubMed] [Google Scholar]
- Sherman, L. , Steinberg, L. , & Chein, J. (2017). Connecting brain responsivity and real‐world risk taking: Strengths and limitations of current methodological approaches. Developmental Cognitive Neuroscience, 33, 27–41. 10.1016/j.dcn.2017.05.007 [DOI] [PMC free article] [PubMed] [Google Scholar]
- Smith, A. R. , Chein, J. , & Steinberg, L. (2013). Impact of socio‐emotional context, brain development, and pubertal maturation on adolescent risk‐taking. Hormones and Behavior, 64(2), 323–332. 10.1016/j.yhbeh.2013.03.006 [DOI] [PMC free article] [PubMed] [Google Scholar]
- Smith, E. R. , & Mackie, D. M. (2016). Representation and incorporation of close others' responses: The RICOR model of social influence. Personality and Social Psychology Review, 4(20), 311–331. [DOI] [PubMed] [Google Scholar]
- Somerville, L. H. , Jones, R. M. , Ruberry, E. J. , Dyke, J. P. , Glover, G. , & Casey, B. J. (2012). The medial prefrontal cortex and the emergence of self‐conscious emotion in adolescence. Psychological Science, 24(8), 1554–1562. 10.1177/0956797613475633 [DOI] [PMC free article] [PubMed] [Google Scholar]
- Steinberg, L. (2007). Risk taking in adolescence: New perspectives from brain and behavioral science. Current Directions in Psychological Science, 16(2), 55–59. 10.1111/j.1467-8721.2007.00475.x [DOI] [Google Scholar]
- Steinberg, L. , & Monahan, K. C. (2007). Age differences in resistance to peer influence. Developmental Psychology, 43(6), 1531–1543. 10.1037/0012-1649.43.6.1531 [DOI] [PMC free article] [PubMed] [Google Scholar]
- Telzer, E. H. (2016). Dopaminergic reward sensitivity can promote adolescent health: A new perspective on the mechanism of ventral striatum activation. Developmental Cognitive Neuroscience, 17, 57–67. 10.1016/j.dcn.2015.10.010 [DOI] [PMC free article] [PubMed] [Google Scholar]
- Telzer, E. H. , Dai, J. , Capella, J. J. , Sobrino, M. , & Garrett, S. (2022). Challenging stereotypes of teens: Reframing adolescence as window of opportunity. American Psychologist, 77(9), 1067–1081. 10.1037/amp0001109 [DOI] [PubMed] [Google Scholar]
- Telzer, E. H. , Ichien, N. T. , & Qu, Y. (2015). Mothers know best: Redirecting adolescent reward sensitivity toward safe behavior during risk taking. Social Cognitive and Affective Neuroscience, 10(10), 1383–1391. 10.1093/scan/nsv026 [DOI] [PMC free article] [PubMed] [Google Scholar]
- Telzer, E. H. , Jorgensen, N. A. , Prinstein, M. J. , & Lindquist, K. A. (2021). Neurobiological sensitivity to social rewards and punishments moderates link between peer norms and adolescent risk taking. Child Development, 92(2), 731–745. 10.1111/cdev.13466 [DOI] [PMC free article] [PubMed] [Google Scholar]
- Telzer, E. H. , Rogers, C. R. , & Hoorn, J. V. (2017). Neural correlates of social influence on risk taking and substance use in adolescents. Current Addiction Reports, 4(3), 333–341. 10.1007/s40429-017-0164-9 [DOI] [PMC free article] [PubMed] [Google Scholar]
- Telzer, E. H. , van Hoorn, J. , Rogers, C. R. , & Do, K. T. (2018). Social influence on positive youth development: A developmental neuroscience perspective. Advances in Child Development and Behavior, 54, 215–258. 10.1016/bs.acdb.2017.10.003 [DOI] [PMC free article] [PubMed] [Google Scholar]
- Turner, I. W. , Belward, J. A. , & Oqielat, M. N. (2010). Error bounds for least squares gradient estimates. SIAM Journal on Scientific Computing, 32(4), 2146–2166. 10.1137/080744906 [DOI] [Google Scholar]
- Tustison, N. J. , Avants, B. B. , Cook, P. A. , Zheng, Y. , Egan, A. , Yushkevich, P. A. , & Gee, J. C. (2010). N4ITK: Improved N3 bias correction. IEEE Transactions on Medical Imaging, 29(6), 1310–1320. 10.1109/tmi.2010.2046908 [DOI] [PMC free article] [PubMed] [Google Scholar]
- van Duijvenvoorde, A. , Peters, S. , Braams, B. R. , & Crone, E. A. (2016). What motivates adolescents? Neural responses to rewards and their influence on adolescents risk taking, learning, and cognitive control. Neuroscience and Biobehavioral Reviews, 70, 135–147. 10.1016/j.neubiorev.2016.06.037 [DOI] [PubMed] [Google Scholar]
- van Duijvenvoorde, A. C. K. , Zanolie, K. , Rombouts, S. A. R. B. , Raijmakers, M. E. J. , & Crone, E. A. (2008). Evaluating the negative or valuing the positive? Neural mechanisms supporting feedback‐based learning across development. Journal of Neuroscience, 28(38), 9495–9503. 10.1523/jneurosci.1485-08.2008 [DOI] [PMC free article] [PubMed] [Google Scholar]
- van Hoorn, J. , van Dijk, E. , Meuwese, R. , Rieffe, C. , & Crone, E. A. (2016). Peer influence on prosocial behavior in adolescence. Journal of Research on Adolescence, 26(1), 90–100. 10.1111/jora.12173 [DOI] [Google Scholar]
- van Hoorn, J. , van Shablack, H. , Lindquist, K. A. , & Telzer, E. H. (2019). Incorporating the social context into neurocognitive models of adolescent decision‐making: A neuroimaging meta‐analysis. Neuroscience & Biobehavioral Reviews, 101, 129–142. 10.1016/j.neubiorev.2018.12.024 [DOI] [PMC free article] [PubMed] [Google Scholar]
- Weaverdyck, M. E. , Lieberman, M. D. , & Parkinson, C. (2020). Tools of the trade multivoxel pattern analysis in fMRI: A practical introduction for social and affective neuroscientists. Social Cognitive and Affective Neuroscience, 15(4), 487–508. 10.1093/scan/nsaa057 [DOI] [PMC free article] [PubMed] [Google Scholar]
- Welborn, L. B. , Lieberman, M. D. , Goldenberg, D. , Fuligni, A. J. , Galván, A. , & Telzer, E. H. (2016). Neural mechanisms of social influence in adolescence. Social Cognitive and Affective Neuroscience, 11(1), 100–109. 10.1093/scan/nsv095 [DOI] [PMC free article] [PubMed] [Google Scholar]
- Yarkoni, T. , Poldrack, R. A. , Nichols, T. E. , Essen, D. C. , & Wager, T. D. (2011). Large‐scale automated synthesis of human functional neuroimaging data. Nature Methods, 8(8), 665–670. 10.1038/nmeth.1635 [DOI] [PMC free article] [PubMed] [Google Scholar]
- Zhang, X. , Tokoglu, F. , Negishi, M. , Arora, J. , Winstanley, S. , Spencer, D. D. , & Constable, R. T. (2011). Social network theory applied to resting‐state fMRI connectivity data in the identification of epilepsy networks with iterative feature selection. Journal of Neuroscience Methods, 199(1), 129–139. 10.1016/j.jneumeth.2011.04.020 [DOI] [PMC free article] [PubMed] [Google Scholar]
Associated Data
This section collects any data citations, data availability statements, or supplementary materials included in this article.
Supplementary Materials
DATA S1 Supporting Information
Data Availability Statement
The data that support the findings of this study are not available to share but the analysis code is available from the corresponding author upon request. This study was not preregistered.