Abstract
T cell-based therapies like genetically modified immune cells expressing chimeric antigen receptors (CARs) have shown robust anti-cancer activity in vivo, especially in patients with blood cancers [1]. However, extending this approach to an “off-the-shelf” setting can be challenging as allogeneic T-cells carry a significant risk of graft-versus-host disease (GVHD). In contrast, allogeneic Natural Killer (NK) cells recognize malignant cells without the need for prior antigen exposure and have been used safely in multiple cancer settings without the risk of GVHD.
However, similar to T cells, NK cell function is negatively impacted by tumor-induced transforming growth factor (TGF-β)-secretion, which is a ubiquitous and potent immune suppressive mechanism employed by most malignancies. Allogeneic NK cells for adoptive immunotherapy can be sourced from Peripheral Blood (PB) [2, 3] or Cord Blood (CB) [4], and our group and others have previously shown that ex vivo expansion and gene engineering can overcome CB-derived NK cells’ functional immaturity and poor cytolytic activity, including in the presence of exogenous TGF-β. However, a direct comparison of the effects of TGF-β mediated immune suppression on ex-vivo-expanded CB-versus PB-derived NK cell therapy products has not previously been performed.
Here we show that PB- and CB- derived NK cells have distinctive gene signatures, which can be overcome by ex vivo expansion. Additionally, exposure to exogenous TGF-β resulted in an upregulation of inhibitory receptors on NK cells, a novel immune suppressive mechanism not previously described. Finally, we provide functional and genetic evidence that both PB- and CB- derived NK cells are equivalently susceptible to TGF-β mediated immune suppression. We believe our results provide important mechanistic insights to consider when using ex-vivo expanded, TGF-β resistant, PB or CB-derived NK cells as novel immunotherapeutic agents for cancer.
Keywords: Cord blood NK cells, Peripheral blood NK cells, TGF-β, NK cell immunotherapy
INTRODUCTION
Allogeneic “off-the-shelf” NK cell therapeutics have seen increased use as adoptive immunotherapy for blood cancers and solid tumors [5, 6]. These therapies recognize malignant cells due to the absence of self (preventing engagement of inhibitory receptors), while avoiding non-self healthy cells that do not express activating receptor ligands [6, 7]. NK cell therapy using peripheral blood from healthy donors has shown promising results in clinical trials targeting leukemia after allogeneic stem cell transplantation (SCT) [8–11], and is being actively explored in the blood cancer and solid tumor (including brain tumor) settings.
Although the majority of clinical studies evaluating Natural Killer (NK) cell immunotherapy have used peripheral blood (PB) derived NK cells, several alternative sources of NK cells exist, including human embryonic stem cells (hESCs), induced pluripotent stem cells (iPSCs), artificial NK cell lines, and umbilical cord blood (CB) [12–14]. Most of these are limited, however. For example, obtaining NK cells from PB by apheresis or from bone marrow (BM) can be invasive, with potential risks to healthy donors [15–17], and NK cell differentiation from hESCs or iPSCs is largely experimental [18, 19] with a few therapies entering clinical trials [20]. Artificial NK cell lines such as NK-92 [21–23], KHYG-1 [24], NKL, and NKG are derived from patients with NK cell lymphoma [25]; thus possess risk potential tumor engraftment following infusion. By contrast, CB is more amenable for “off-the-shelf” approaches because they are readily available from hundreds of cord blood banks globally [26–28].
Although no direct comparison of PB- and CB-derived NK cell antitumor efficacy has been performed in the clinical setting, in vitro studies have identified several differences between these sources. CB contains higher number of NK-cell progenitors than PB, which potentially can differentiate into mature NK cells during ex vivo expansion [29, 30]. However, resting CB-derived NK cells also show impaired ability to form F-actin immunological synapses (i.e., weaker conjugates with target cells) [8, 31, 32]. CB-derived NK cells also have low expression level of adhesion molecules, which may contribute to this low NK cell activity [32]. Furthermore, CB-derived NK cells have lower percentages of tumor necrosis factor- α (TNF-α) producing cells compared to PB derived NK cells [33]. Tightly regulated receptor signaling between NK cells and susceptible tumor cells is essential for NK cell-mediated cytotoxicity [7, 34, 35]. CB-derived NK cells are phenotypically and functionally immature [36, 37]. These limitations can be overcome by ex vivo activation of CB-derived NK cells by cytokines or K562-based artificial antigen presenting cells [8, 36, 38]. This expansion process reliably generates clinically relevant doses of NK cells from a CB unit for adoptive immunotherapy [39]. Expanded CB-derived NK cells show an increased level of eomesodermin (Eomes) and T-bet [40]. These two transcription factors play essential roles in developing and acquiring effector functions by NK cells [41–43]. However, so far, we have not seen studies that have evaluated the impact of immune suppression on expanded NK cells from CB versus PB sources. Transforming growth factor-beta (TGF-β) is a potent immunosuppressive cytokine released abundantly in the tumor microenvironment with inhibitory effects on NK-cell functions such as downregulation of interferon gamma (IFN-γ) production and expression of activating receptors like NKG2D [4, 44–46]. CB-derived NKs may potentially be more susceptible to the effects of TGF-β, as this cytokine is also critical in maintaining tolerance in the placental environment from which these cells are derived [47].
Here, we investigate CB- versus PB-derived NK cells derived from healthy individuals with and without ex vivo expansion and evaluate how these NK cell products respond to TGF-β mediated immune suppression. We hypothesized that TGF-β mediated immune suppression in ex vivo expanded CB-derived NK cells would be comparable to PB-derived NK cells in phenotype, functional activity, and gene expression signature.
RESULTS
Ex vivo expansion results in a similar surface marker phenotype for CB-derived and PB-derived NK cells.
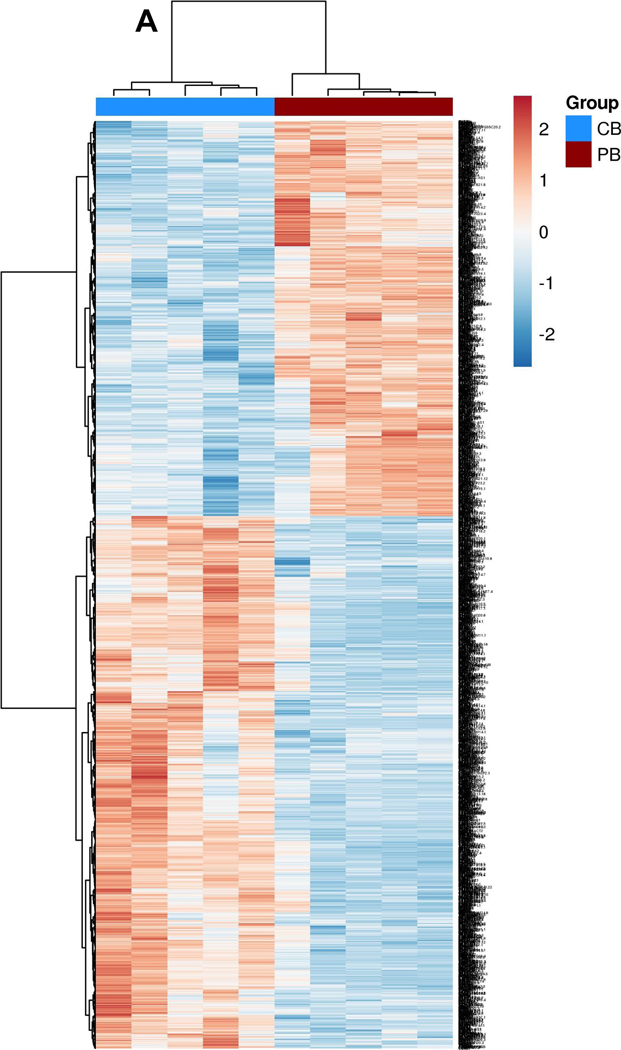
Following bulk RNA-seq experiments using mononuclear cells from the peripheral blood of five healthy donors (PB) and five umbilical cord blood (CB) samples (obtained under CNH IRB approved protocols Pro0004033, Pro00003896, Pro00009374, and Pro00003869), we initially observed that CB-derived mononuclear cells (MNCs) have distinct gene expression profiles from PB MNCs (Figure 1.A). Analysis of global transcriptional profiles demonstrated that the two sources have a broad difference in gene expression of MNCs (differentially expressed genes, 3422, false discovery rate, <0.05, fold change, >2), with 1,593 upregulated and 2,200 downregulated in PB MNCs as compared to CB MNCs (Supplemental Figure 1.A–D), similar to what we and others have previously observed [8, 48]. NK cell immune population-related pathways are significantly (p<0.05, n=5) downregulated in CB (Supplemental Figure 1.E). We acknowledge that the NK cell percentage is low in both CB and PB (10–20%)[49]; therefore, to ensure we have a more accurate resolution between two donors, we also compared NK cell mRNA expression following CD56+ cells selection from CB- and PB- derived MNCs using QPCR. Our QPCR panel consisted of 64 genes including NK cell activating receptors, inhibitory receptors, cytokines, and genes associated with effector function. Even though we observed a minor clustering within the donor source, the differential expression of these genes was not significant (p>0.05) (Supplemental Figure 1.F). We posit that the difference in results from the two methods might be because QPCR is not as sensitive as RNA sequencing or that our “n” for QPCR (n=3) is too small to make a significant conclusion.
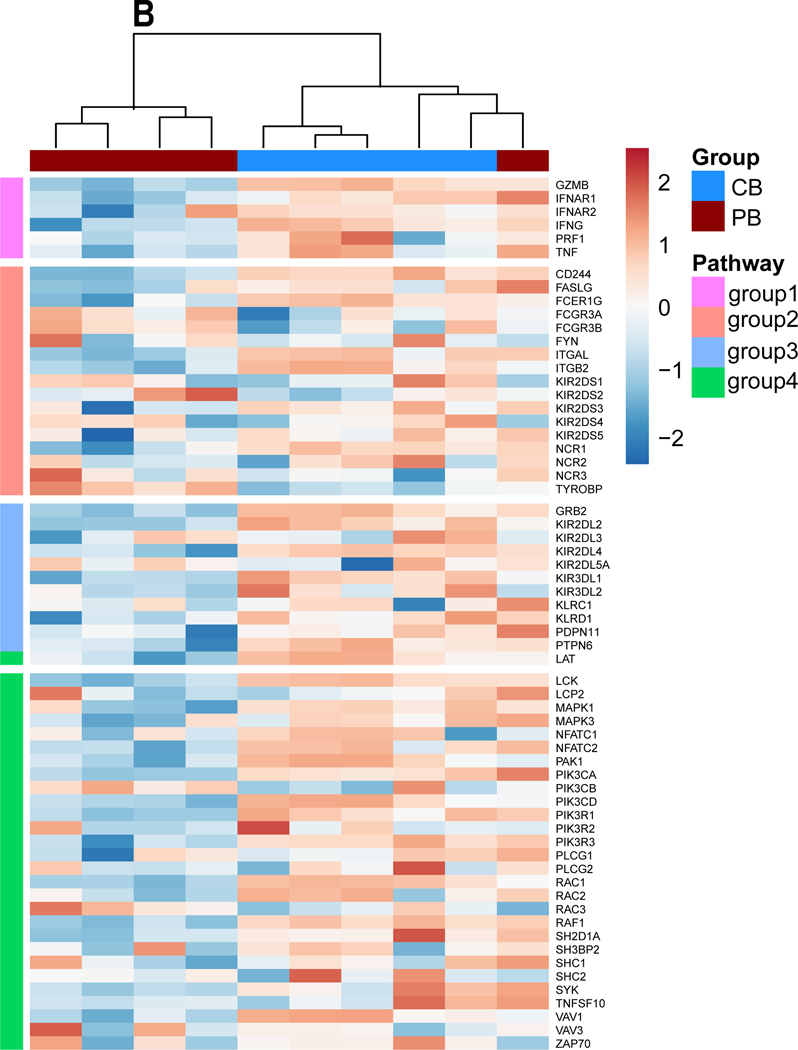
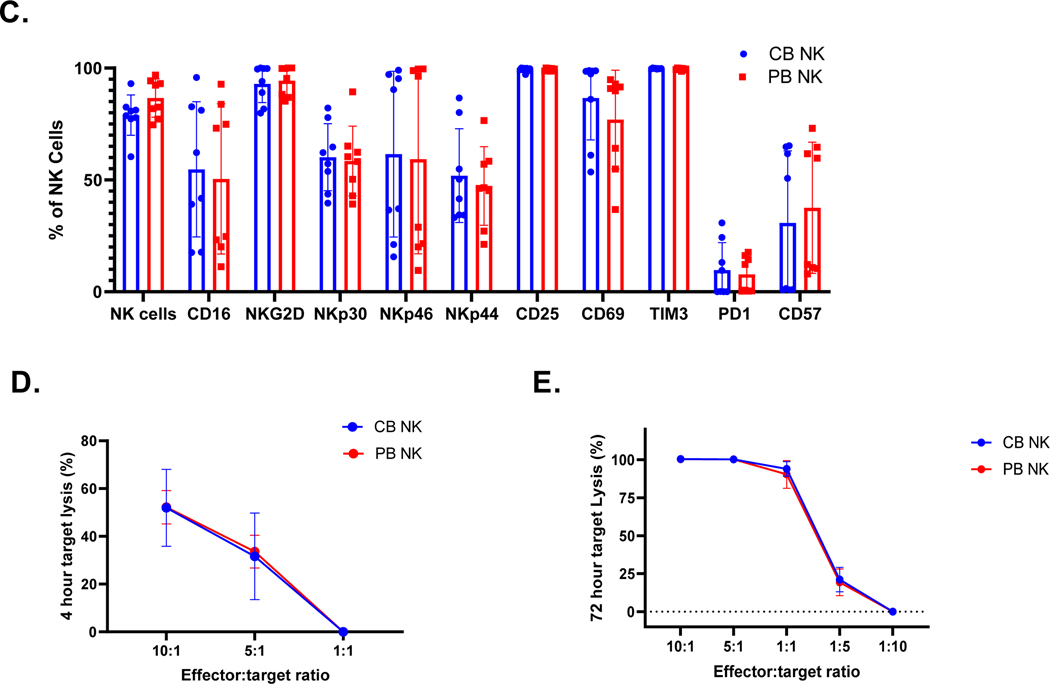
Figure 1. Transcriptional profiling of MNCs from peripheral blood and cord blood.
A. Heat map depicting all differentially expressed genes identified between cord blood (CB) and peripheral blood (PB) derived mononuclear cells (MNCs). Dendrograms show the hierarchical clustering (Pearson distance) between samples. CB donors are highlighted by blue and PB donors are denoted by red (n=5 per group). (B) Heat map of candidate gene expression measured by RT-qPCR in ex vivo expanded NK cells from CB and PB (Blue representing downregulation, red representing upregulation relative to the house keeping genes). Cells were expanded ex vivo as described in methods. All experiments were undertaken in triplicate. CB donors are highlighted by blue and PB donors are denoted by red. Pathways are categorized as NK cells effector function pathways (Orange) including, DAP signaling, Calcium signaling. NK cells Inhibition pathway genes (Blue). NK cells activation pathway genes and MAPK pathways (Green). Cytokines and Lytic enzymes pathway genes (Pink) (n=5). (C.) CB- and PB-derived NK cell phenotype, including NK cell activation, maturation, and exhaustion receptors. CD3 negative and CD56 positive cells were gated to quantify NK cells population and for further NK receptors analysis. Ex vivo expanded CB-derived NK cells (Blue bars) lacked any phenotypic evidence of exhaustion and maintained a similar phenotype to that of PB-derived NK cells (Red bars). Each dot represents individual donor and error bar represent standard deviation (n=8). (D-E). Anti-tumor function of PB- and CB- derived NK cells, as measured by luciferase-based cytotox assay, against U87 MG (n=6). (C.) CB-derived NK cells (Blue line) were equally efficient as PB-derived NK cells (Red line) in killing U87 MG targets at different E:T ratio (x-axis). (D) PB-and CB-derived NK cell’s 4 hrs cytotoxicity assay (n=6) target lysis (See methods). (E) PB-and CB-derived NK cell’s 72 hrs cytotoxicity assay (n=4) target lysis. Error bars represent standard deviation.
Following ex vivo expansion, these differential gene signatures remain mostly intact (Figure 1.B). In contrast, as observed in our previous study, the phenotypic signatures become more aligned between CB- and PB- derived NK cells post-expansion (Figure 1.C) [8]. Expanded NK cells showed equally high purity post-expansion: 78.98% for CB donors and 86.6% for PB donors (p>0.05, n>5; Figure 1.C). Staining for natural cytotoxicity receptors NKG2D, NKp44, NKp44 and NKp30 showed no significant difference in expression between PB and CB - derived NK cells: NKp44 CB 51.91% vs. PB 47.26%, p>0.05, NKp30: CB 60.14% vs. PB 58.49% p>0.05, NKG2D: CB 92.96% vs. PB 94.41.%, p>0.05 and NKp46: CB 61.51% vs. PB 59.29%, p>0.05. Similarly, no impairment in the expression of the NK-cell surface markers CD69, CD16, CD25, TIM3, or PD1 were noted (p>0.05, Figure 1.C). Luciferase based cytotoxicity assays with CB and PB- derived NK cells showed similar cytolysis of U87 MG cells at different E:T ratios for both in a 4 hour cytotoxicity assay (10 to 1: CB 51.93% vs. PB 52.21%, p>0.05; 5 to 1: CB 31.64% vs. PB 33.60%, p>0.05; Figure 1D) and 72 hrs cytotoxicity assay (10 to 1: CB 100.4%vs. PB 100.3%, p>0.05; 5 to 1: CB 100.2% vs. PB 100.2%, p>0.05; 1 to 1: CB 93.2% vs. PB 93.5%, p>0.05; Figure 1.E).
Ex- vivo expanded NK cells from CB and PB have comparable signaling following TGF-β treatment.
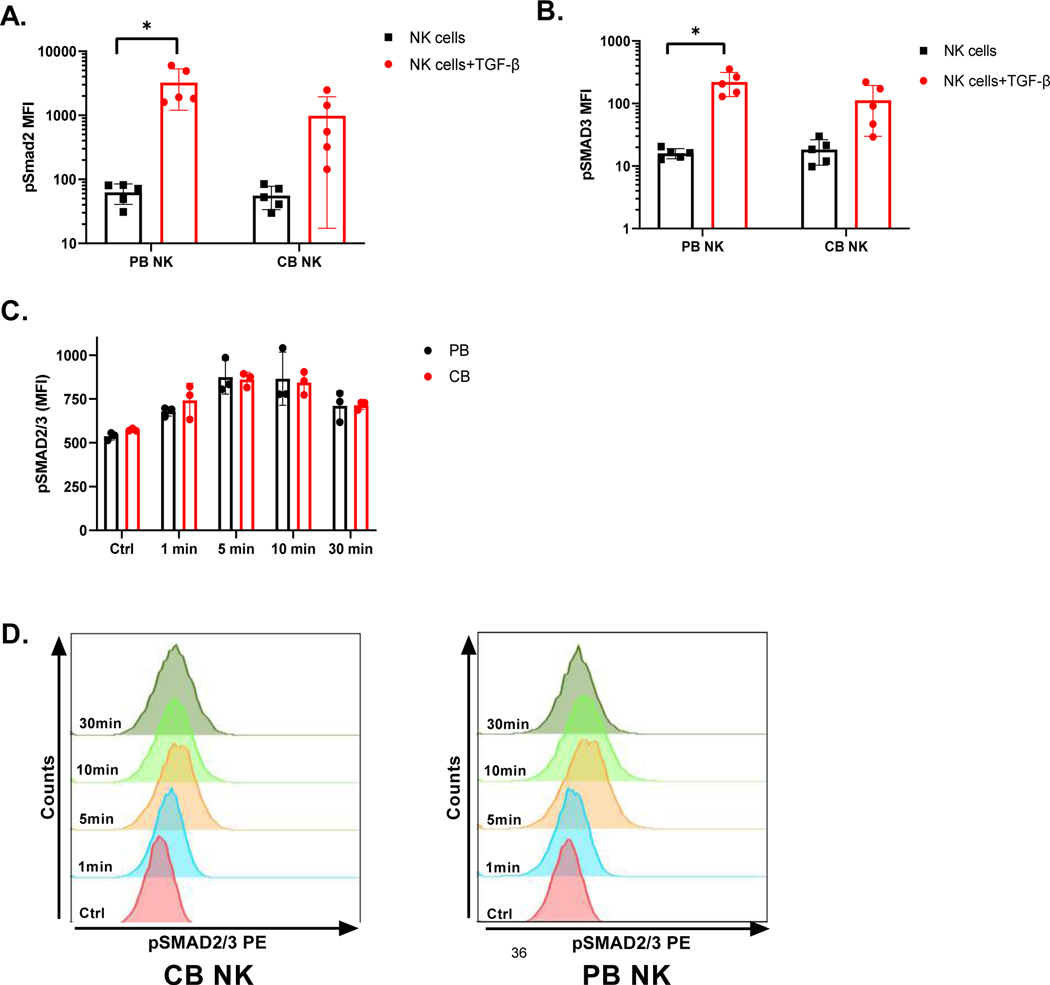
To determine whether CB- and PB-derived NK cells respond to TGF-β in a comparable manner, we evaluated TGF-β pathway activation in PB and CB - derived NK cells after they were treated with 5ng/ml TGF-β for 60 minutes (See Methods below for detailed description). As shown in Figure 2, pSMAD2 and pSAMD3 were comparably upregulated in both PB- and CB-derived NK cells in the presence of exogenous TGF-β (p<0.05, n=5). For PB NK cells, we observed an increase from a mean of 62.7±22.02 to 3246.38±2046.23 (p<0.05, n=5) for pSMAD2 and from a mean of 16.02±2.95 to 221.26±91.959 (p<0.05, n=5) for pSMAD3 as measured by ratio paired t-tests. Figures 2.A and B also showed upregulation of both pSMAD2 and pSMAD3 in CB-derived NK cells in the presence of TGF-β, from a mean of 55.78±22.1 to 983.48±97.21 for pSMAD2 and from a mean of 18.36±8.05 to 112.24±82.3 for pSMAD3. However, only upregulation of pSMAD3 was borderline significant in CB-derived NK cells in the presence of TGF-β, as measured by ratio-paired t-tests (p =0.057). Hence, these studies suggest that addition of exogenous TGF-β elicits a comparable increase in SMAD2 and 3 phosphorylation in both CB- and PB- derived NK cells, though upregulation in CB was not statistically significant. We also performed a pSMAD2/3 upregulation kinetics study at different incubation times (1min, 5 mins, 10 mins and 30 mins) with TGF-β to evaluate for any differences between the PB- and CB-derived NK cell response (Figure 2.C and D). Mean florescence intensity (MFI) of pSMAD2/3 for PB- derived NK cells increased from 537.33±21.39 (without TGF-β) to 678.67±26.72 at 1min, to 875±97.23 at 5 mins (p<0.05, n=3), maintaining at 865.33±152.13 by 10 mins (p<0.05, n=3) incubation with TGF-β. By 30mins TGF-β exposure, pSMAD2/3 expression dropped to 711±84.59 (Figure 2.C). CB derived NK cells showed the same trend. Specifically, pSMAD2/3 MFI increased from 573.33±7.51(without TGF- β) to 741.67±97.37 at 1 min, to 861.33±41.02 at 5mins (p<0.05, n=3) and maintained at 843.33±66.03 by 10mins (p<0.05, n=3). Following that pSMAD2/3 expression also dropped in CB derived NK cells to 714.67±23.96 by 30 mins. However, no significant differences were observed in pSMAD2/3 upregulation at different time intervals (p>0.05, n=3, Figure 2.D) irrespective of the donor source.
Figure 2. Signaling pathways in NK cells.
A. MFI (Median florescence intensity) of pSMAD2. CB-and PB-derived NK cells were treated with 5 ng/ mL TGF- β for 1 hour before assaying for differences in pSMAD2, as measured by Luminex (n=5). Red bar represent phosphorylated SMAD2 in NK cells in presence of TGF- β and black bar represent in absence of TGF- β. Each dot represents individual donor and error bar represent standard deviation. (* indicates p<0.05, all comparisons) B. MFI (Median florescence intensity) of pSMAD3. CB-and PB-derived NK cells were treated with 5 ng/ mL TGF- β for 1 hour before assaying for differences in pSMAD3, as measured by Luminex (n=5). Red bar represent phosphorylated SMAD3 in NK cells in presence of TGF- β and black bar represent in absence of TGF- β. C. pSMAD2/3 upregulation kinetics. CB-and PB-derived NK cells were treated with TGF-β (5 ng/ mL) for 1 min, 5 min, 10 min and 30 mins with TGF-β and assessed by phosphoflow for pSMAD2/3. Each dot represents individual donor and error bars represent standard deviation. Ratio paired t-tests were used to determine statistically significant differences. D. Representative pSMAD2/3 expression on CB- and PB-derived NK cells after incubation with TGF-β at different time points. Ctrl sample is NK cells incubated without TGF- β. 2-way ANOVA was used to determine the significance between the groups.
Ex- vivo expanded NK cells from CB and PB have similar gene expression signatures following TGF-β treatment.
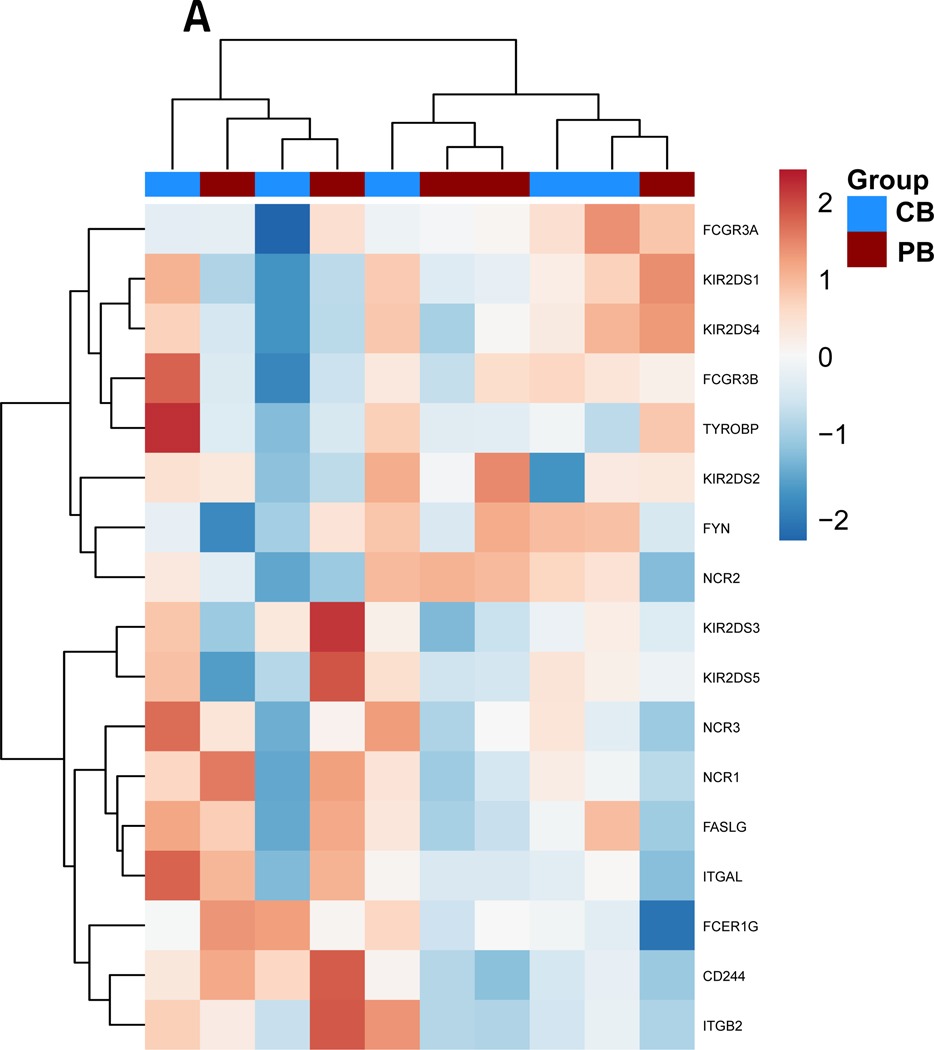
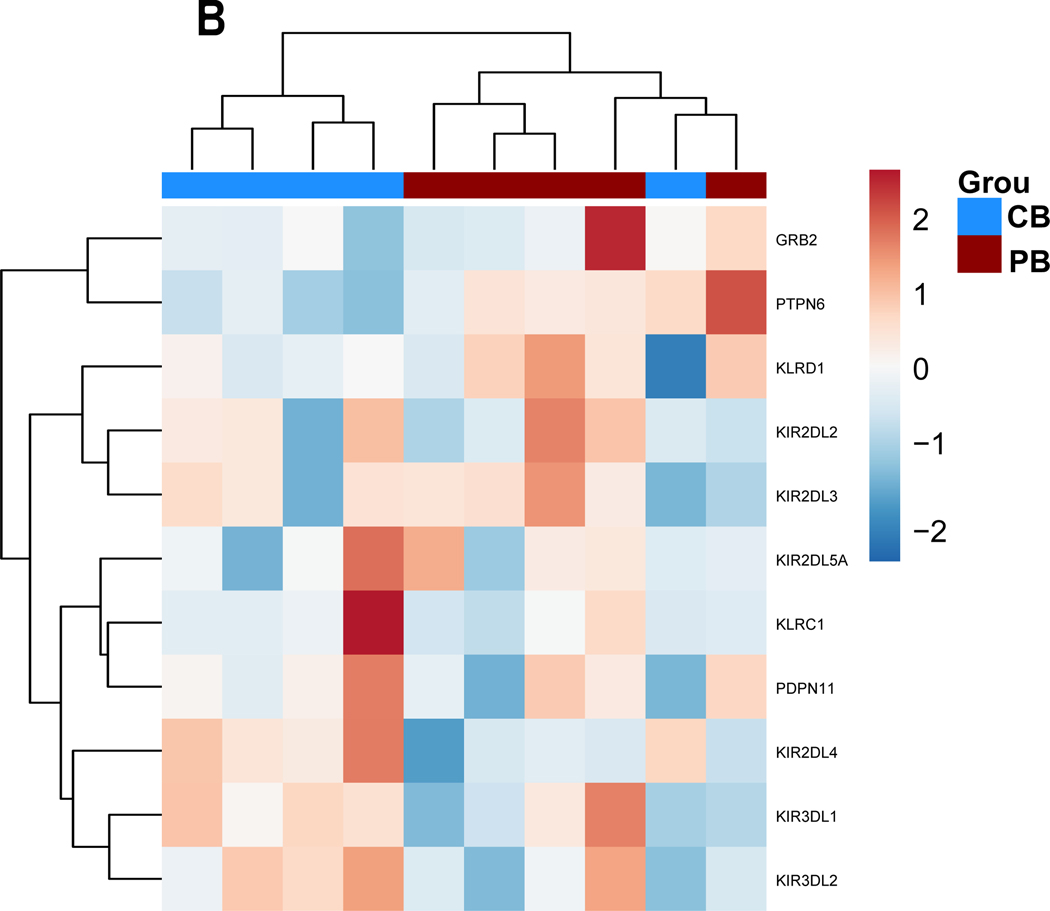
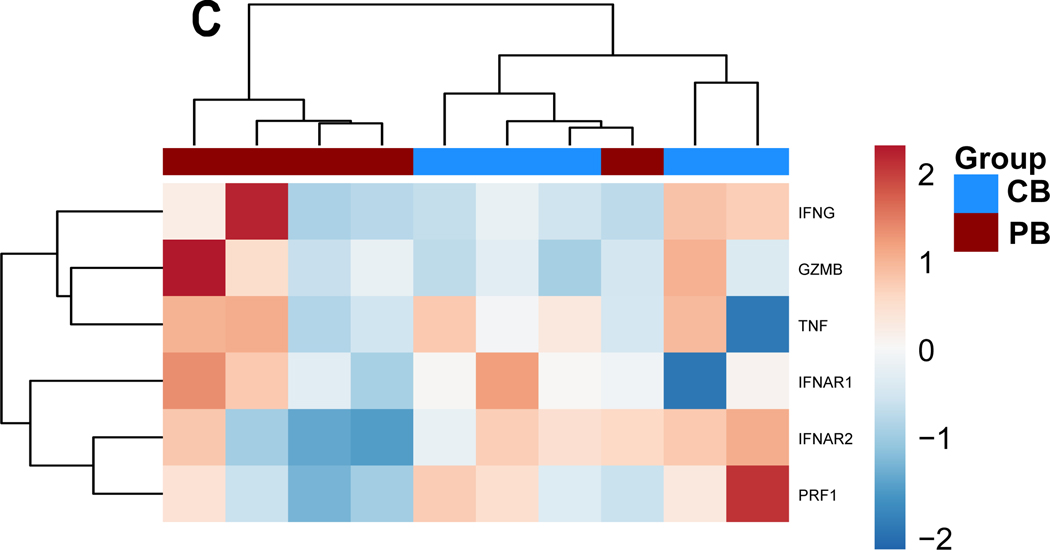
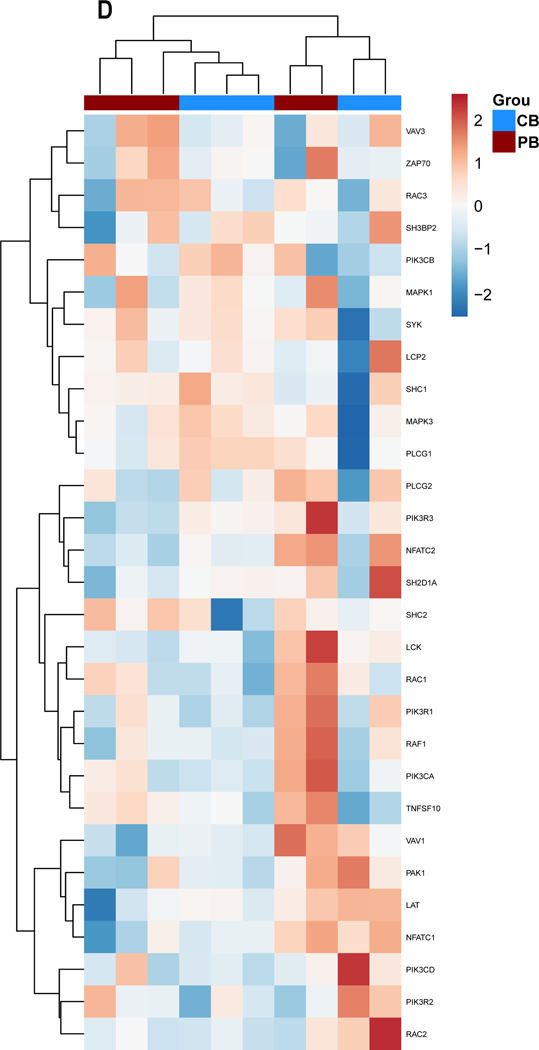
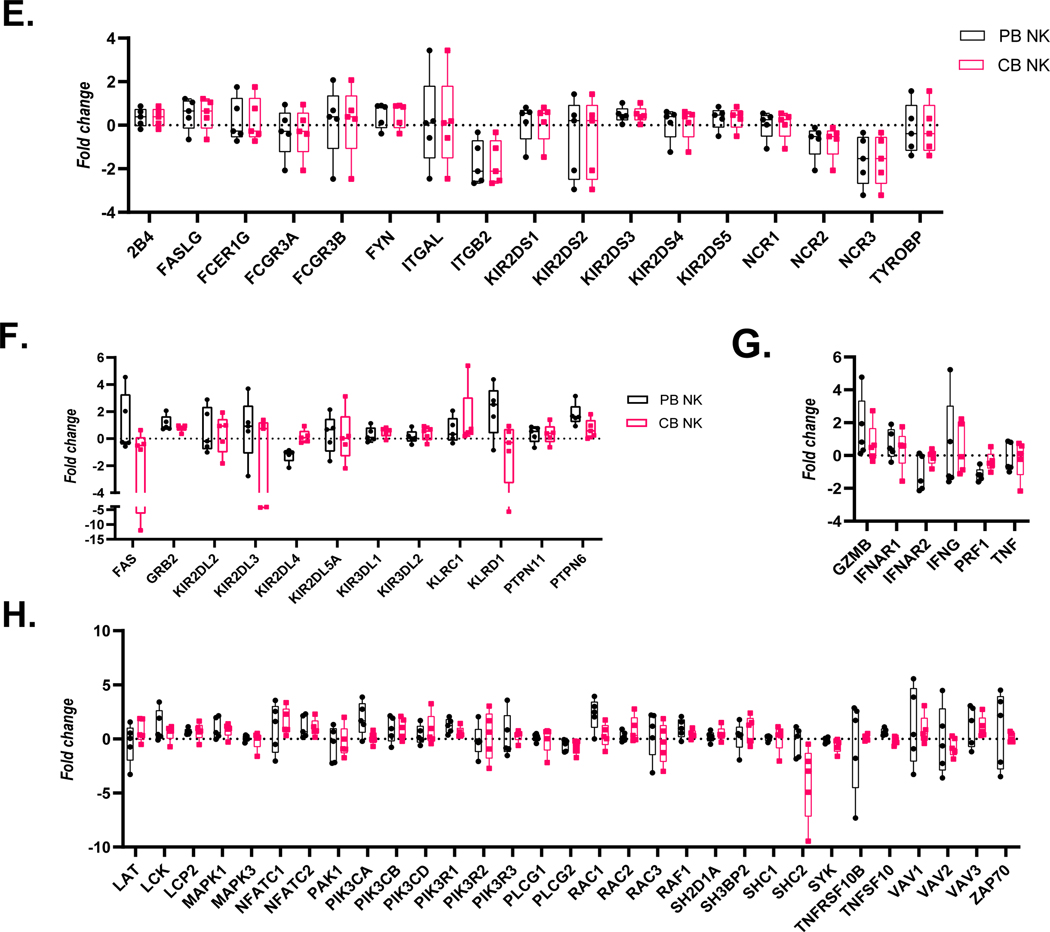
We next evaluated whether the addition of TGF-β resulted in different gene expression signatures in CB- versus PB-derived NK cells. As shown in Figure 3, the unbiased clustering of relative changes (log2 fold change) in individual gene expression (log2 fold change) in the presence of TGF-β revealed that ex-vivo expanded PB- and CB derived NK cells behave similarly in response to the cytokine (Figure 3.A–D). We do see a minor clustering of donors according to their source for inhibitory pathway group (Figure 3.B) and cytokines and lytic enzymes pathway genes (Figure 3.C), however analysis of the changes in gene expression between PB and CB donors sources was not found to be significant (p<0.05).
Figure 3. Gene expression alterations associated with exogenous TGF-ß treatment.
PB-and CB-derived NK cells were cultured in the absence and presence of TGF-ß for 5 days. The cells were then analyzed by qPCR to determine the change in NK cells effector function in response to TGF-ß treatment. (A-D) Expression results are presented as a hierarchical cluster heat map. Each row denotes a parameter, and each column denotes a cell culture condition, as indicated. The color scale indicates relative protein abundance as determined by fold change. Dendrograms denote the Euclidean distances between clustered conditions. (A) NK cell Activation pathway genes. (B.) NK cell Inhibition pathway genes. (C.) Cytokines and Lytic enzymes pathway genes (D.) NK cell effector function pathways. (E-H) Mean Gene expression change in NK cells in presence of TGF-ß relative to NK cells in absence of TGF-ß is shown in fold change (y axis). (E.) NK cell effector function pathways. (F.) NK cell Inhibition pathway genes. (G.) Cytokines and Lytic enzymes pathway genes (H.) NK cell Activation pathway genes. PB-derived NK cells are represented by black box, CB-derived NK cells are represented by red box and whisker extends from min to max value. Each dot represents individual donor. For gene annotation see abbreviation section. For gene annotation see abbreviation section.
We observed a trend of downregulation in genes associated with NK cell activation, specifically Natural Cytotoxicity Triggering Receptor 3 (NCR3) and Integrin Subunit Beta 2 (ITGB2) which were significantly downregulated for both CB and PB derived NK cells (p<0.05) (Figure 3.E, Supplemental Figure 3.A). Furthermore, we observed a trend for upregulation in the inhibitory genes, as shown in Figure 3.B and 3.F for both CB and PB NK cells upon exposure to TGF- β, including significant induction of Growth Factor Receptor Bound Protein 2 (GRB2) and Protein Tyrosine Phosphatase Non-Receptor Type 6 (PTPN6) (p<0.05, n=5, Supplementary (Figure 3.F). The upregulation of inhibitory pathways and downregulation of activating pathway genes reflects the loss of NK cell cytotoxicity frequently observed in the presence of exogenous TGF-β.
Cytokine pathway genes IFNAR1 (Interferon Alpha and Beta Receptor Subunit 1) demonstrated upregulation in response to exposure to TGF-β irrespective of donor source (Figure 3.C). Granzyme B (GZMB), Tumor Necrosis Factor (TNF) and Interferon-gamma (IFNG) expression change on exposure to exogenous TGF-β was inconclusive because of donor specific variation within the current sample size (n=5). The lytic enzyme perforin was downregulated in both PB and CB-derived NK cells in the presence of TGF-β (Figure 3.G), however it was only significantly downregulated for PB derived NK cells. Genes associated with NK cell effector functions showed a mixed response and no clustering as per the donor source (Figure 3.H). The majority of genes in this group showed a trend of upregulation for example: LCK proto-oncogene Src family tyrosine kinase (LCK), Lymphocyte cytosolic protein 2 (LCP2), Mitogen-activated protein kinase 1 (MAPK1), Nuclear factor of activated T-cells (NFATC) 1–2, Phosphatidylinositol-4,5-bisphosphate 3-kinase catalytic subunit (PIK3C) A-D, Phosphoinositide-3-kinase regulatory subunit 1 (PIKR1), Ras-related C3 botulinum toxin substrate 2 (RAC2), Raf-1 proto-oncogene, serine/threonine kinase (RAF1) and Vav guanine nucleotide exchange factor 3 (VAV3); (Figure 3.H). PIK3R1 and RAF1 were found to be significantly upregulated in both PB and CB derived NK cells, whereas LCP2, PIK3CA and RAC1 were found to be significantly upregulated in PB derived NK cells only and MAPK1 and NFATC1 genes were only upregulated in CB derived NK cells (p<0.05, n=5, Supplemental Figure 2).
The SHC adaptor protein 2 (SHC2) gene associated with cytokine production, the DAP12 signaling-related genes, the Spleen Associated Tyrosine Kinase (SYK) and Phospholipase C Gamma 2 (PLCG2) genes associated with NK cell cytotoxicity showed a downregulation of expression in both donor sources (Figure 3.H). Significant downregulation of PLCG2 was observed in both PB and CB derived NK cells, however SHC2 was only significantly downregulated in CB derived NK cells (p<0.05, n=5, Supplemental Figure 2).
We also observed that a few genes (KIR2DL4, KLRD1 and IFNAR2) showed an opposite trend depending on donor source. KIR2DL4 was significantly downregulated in PB-derived NK cells but showed a minor upregulation in CB-derived NK cells (Supplemental Figure 2.C). KLRD1 showed significant upregulation in PB-derived NK cells however showed downregulation in CB-derived NK cells (Supplemental Figure 2.C). Similarly, the IFNAR2 gene was significantly downregulated in PB- derived NK cells, whereas it was upregulated (although not significantly so) in CB-derived NK cells (Supplemental Figure 2.C). These results illustrate that some genes are indeed more susceptible to TGF-β exposure depending on the donor source.
Ex- vivo expanded NK cells from CB and PB have similar decreases in proliferation, activating receptor expression, and perforin secretion following TGF-β treatment.
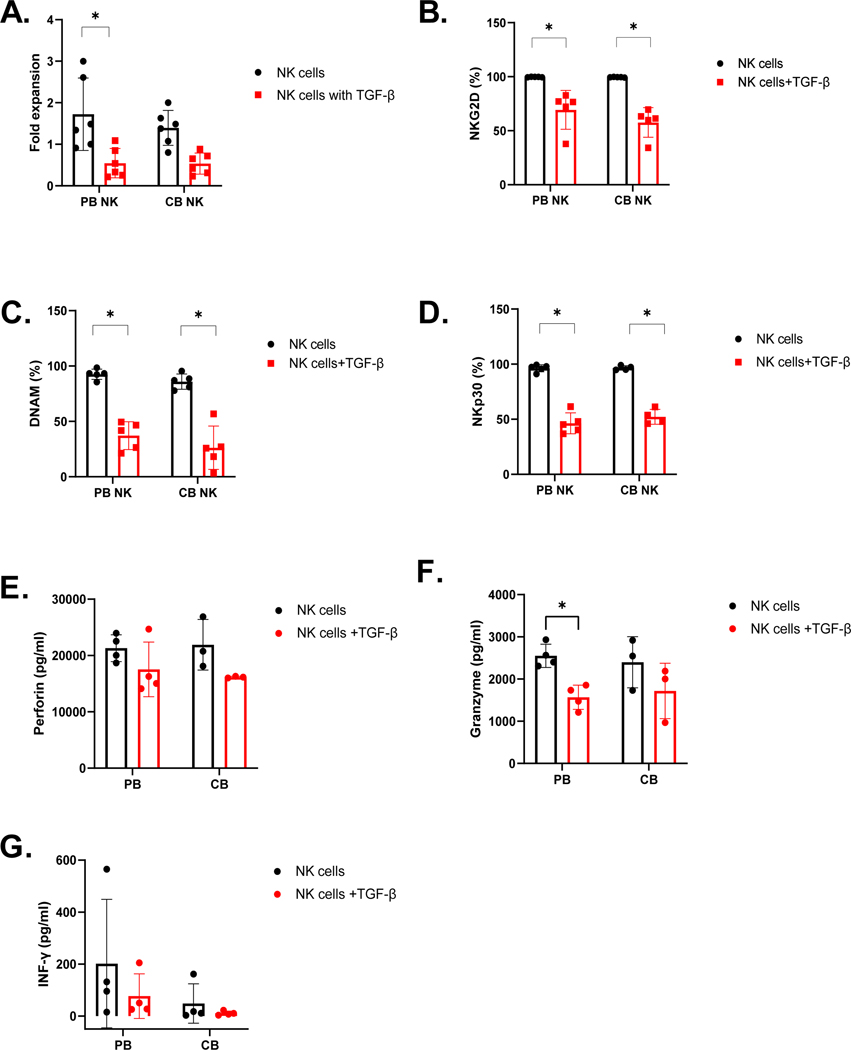
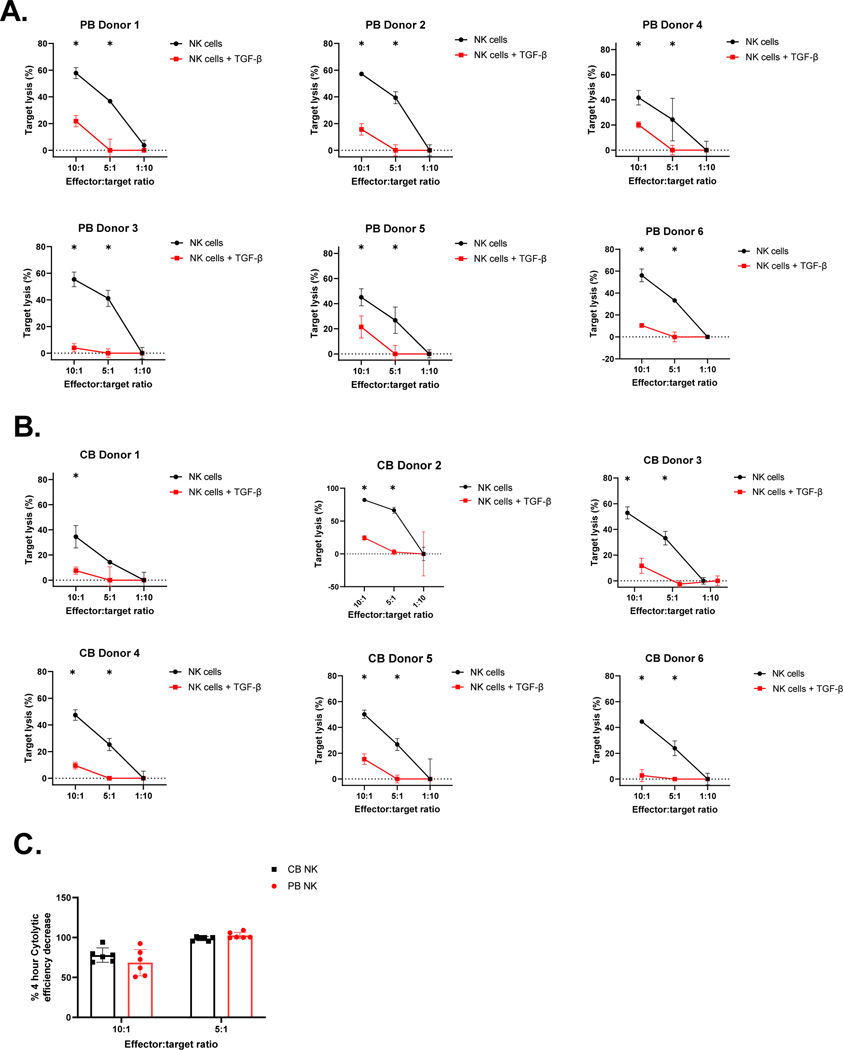
To assess the sensitivity of PB- and CB- derived NK cells functionality in response to exogenous TGF-β, treated and untreated NK cells were evaluated for their proliferation, activation marker expression, and cytolytic function in response to exogenous TGF-β and the U87 MG tumor cell line, which secretes TGF-β (Supplemental Figure 4) (See methods). NK cells were counted using a Luna fluorescence cell counter (Logos Biosystems) at the treatment’s beginning and end. Both CB and PB-derived NK cell cultures had reduced cell counts in the presence of 5ng/ml exogenous TGF-β (Figure 4.A). Specifically, as shown in Figure 4.A, PB-derived NK cells showed significantly decreased expansion (from 1.724 to 0.5457-fold (p<0.05, n=5)) in the presence of TGF-β. Similarly, CB-derived NK cells also showed reduced expansion in the presence of TGF-β (from 1.395 to 0.5361-fold (p=0.0642, n=5)). This effect of TGF-β on CB versus PB NK cell expansion was not significant (p>0.05, n=5; Figure 4.A). To test the effect of TGF-β on NK cell activating receptor expression in response to stimuli, we evaluated receptor expression by flow cytometry in the presence and absence of exogenous TGF-β. As shown in Figure 4.B and D, both PB- and CB-derived NK cells showed downregulation in NK cell receptor expression. Specifically, for NKG2D, there was a reduction from 99.71% to 69.25% expression on PB-derived NK cells (p<0.05, n=5) and a reduction from 99.51% to 57.61% on CB-derived NK cells (p<0.05, n=5) in the presence of TGF-β. No significant differences were found in TGF-β mediated downregulation of NKG2D between the two donor NK cell sources (p>0.05, n=5; Figure 4.B). NKp30 expression on PB NK cells reduced from 96.27% to 46.32% (p<0.05, n=4) with reduced expression in CB NK cells from 96.57% to 52.20% (p<0.05, n=5) in the presence of TGF-β. Again, no significant differences were found between donor sources (p>0.05, n=5; Figure 4.C). DNAM expression also fell from 92.59% to 37.14% (p<0.05, n=5) on PB-derived NK cells and from 85.98% to 26.22% on CB-derived NK cells (p<0.05, n=5). No significant differences were found in the TGF-β mediated downregulation of DNAM between the donor sources (p>0.05, n=5; Figure 4.D). We subsequently assessed whether cytokines- IFN-γ (Figure 4.E), Granzyme (Figure 4.F) and Perforin (Figure 4.G) secretion was similarly affected. Cytokine secretion showed a decrease in magnitude on exposure to TGF- β. Mean IFN-γ secretion decreased from 201.8 pg/ml to 76.97 pg/ml for PB-derived NK cells and 48.32 pg/ml to 10.72 pg/ml in CB-derived NK cells on exposure to exogenous TGF-β (n=4). IFN-γ secretion, even though not significant, still followed the same trend as mRNA expression following TGF-β exposure (Figure 4.E). Granzyme B secretion significantly decreased from 2551 pg/ml to 1568 pg/ml for PB-derived NK cells (p<0.05, n=4) and 2398 pg/ml to 1719 pg/ml for CB-derived NK cells in the presence of TGF-β (n=4). The change in Granzyme B secretion (decrease) on exposure to exogenous TGF-β was more predominant than what we observed with mRNA expression (Figure 4.F). Perforin secretion decreased from 21310 pg/ml to 17532 pg/ml for PB- derived NK cells and 21913 pg/ml to 16164 pg/ml for CB- derived NK cells (n=4). We found no significant difference in cytokine expression between donor source (p>0.05). The decrease in perforin secretion was in concordance with the downregulation observed in Perforin mRNA expression (Figure 4.G). TGF-β-treated and untreated NK cells were evaluated for their functionality by luciferase-based cytotoxicity assay against the TGF-β-secreting U87 MG cell line. Both PB- and CB-derived NK cells showed a significant decrease in their cytotoxicity potential in the presence of exogenous TGF-β (p<0.05, Figure 5.A and B). CB-derived NK cells showed a decrease of 77.89%, and PB-derived NK cells showed a decrease of 68.53%, killing at 10:1 E:T against U87 MG cells. PB and CB-derived NK cell products lost their killing ability at the 5:1 E:T ratio after exposure to exogenous TGF-β (Figure 5.A and B). However, there was no donor source difference in the TGF-β mediated abrogation of cytolytic activity between PB-and CB-derived NK cells showed (p>0.05, n=5; Figure 5.C).
Figure 4. Functional loss in ex vivo expanded PB-and CB-derived NK in presence of exogenous TGF-β.
A. Mean fold expansion of PB-and CB-derived NK cells in presence and absence of TGF-β (n=6). B – D. Expression of NKG2D, DNAM1, and NKp30 (% percentage) were evaluated by flow cytometry after 5 days of TGF-β Treatment (n=5). (E-G). Cytokines secretion by PB-and CB-derived NK cells after exposure to TGF-β (n = 4). Perforin (E), Granzyme (F) and IFN-Y (G) secretion was detected by multiplex after 5 days exposure to TGF-β (n = 4). Red bar represent NK cells in presence of TGF- β and black bar represent in absence of TGF- β. Each dot represents individual donor and error bars represent standard deviation. (* indicates p<0.05, all comparisons). Two-way ANOVA was used to determine statistically significant differences.
Figure 5. Exogenous TGF-β decreases the cytolytic activity of both PB- and CB-derived NK cells equivalently.
Ex vivo expanded PB- and CB-derived NK cells were cultured in the presence or absence of TGF-β (5 ng/mL) for additional 5 days. Specific lysis of the U87 MG targets was evaluated using luciferase based cytotox assay (n=6). Mean cytolytic ability (y- axis) of NK cells cultured with TGF-β for 5 days (Red line) compared to control NK cell (black line) at different E:T ratio (x-axis). Data is presented as target cell lysis (See methods). Error bars represent standard deviation. (A) Representative PB donors target lysis measured at 4 hrs. (B) Representative CB donors target lysis measured at 4 hrs. (C) The decrease in target lysis by PB- (Red bar) and CB-derived NKs (Black bar), measured at 4 hrs. Each dot represents individual donor and error bars represent standard deviation. The * indicates p<0.05, all comparisons. n=6 in each group. Two-way ANOVA was used to determine statistically significant differences.
Ex- vivo expanded NK cells from CB and PB demonstrate similar decreases in mammalian target of rapamycin (mTOR) signaling following TGF-β treatment.
Finally, evidence suggests that TGF-β-mediated inhibition of NK cell function is facilitated by repression of mTOR signaling [50]. We therefore, tested whether mTOR signaling is differentially affected in expanded CB- versus PB-derived NK cells by measuring mTOR-regulated expression of nutrient receptor CD71[51] and CD122 [52]. We observed comparable downregulation of CD71 in the presence of exogenous TGF-β for both PB- and CB-derived NK cells. PB derived NK cells showed a decrease in expression from 94.79% to 70.85% (p<0.05, n=5) and CB-derived NK cells showed 85.30% to 48.12% (p<0.05, n=5; Figure 6.A). CB-derived NK cells appeared more sensitive to TGF-β-mediated downregulation of CD71 compared to PB-derived NK cells (p<0.05, n=5; Figure 6.A). We also observed comparable downregulation in CD122 expression in the presence of exogenous TGF-β for both PB- and CB-derived NK cells. For PB-derived NK cells, CD122 expression decreased from 9.51% to 6.5% in presence of TGF-β, and for CB-derived NK cells, expression decreased from 8.966% to 4.317% in the presence of TGF-β. However, no specific difference was found on CD122 expression between the two NK cell donor sources (p>0.05, n=5; Figure 6.B).
Figure 6. Characterization of PB-and CB-derived NK cell downregulation of MTOR-regulated proteins in the presence of exogenous TGF-β.
Expression of CD71 (A) and CD122 (B) were evaluated on PB-and CB-derived NK cells by flow cytometry after 5 days exposure to TGF-β (n=5). Red bar represent NK cells in presence of TGF- β and black bar represent NK cells in absence of TGF- β. Each dot represents individual donor and error bars represent standard deviation. (* indicates p<0.05, all comparisons). Two-way ANOVA was used to determine statistically significant differences.
DISCUSSION
Despite promising pre-clinical results in the evaluation of NK cell as an anti-cancer therapy, its widespread clinical application has been somewhat limited due to several factors including difficulties maintaining their cytolytic activity in a TGF-β rich tumor microenvironment (TME) [4, 52–54]. Sham et. al. have demonstrated that the cytotoxic function of tumor infiltrated NK cells are significantly impaired, indicating their susceptibility to the immune suppressive TME. While the inhibitory effects of TGF-β on ex vivo expanded NK cells have been well described [4, 52–57], to our knowledge, the inherent differences between PB-and CB-derived NK cell responses to TGF-β, have not been studied in detail. This knowledge may be a critical factor in selection of the best allogeneic cell source. A few studies have demonstrated that NK cells isolated from CB are immature with decreased functional activity, impaired immunological synapse, and increased capacity for programmed cell death compared with NK cells isolated from PB [8, 37]. This study is the first to show the comparable effects of TGF-β mediated immune suppression between CB- and PB-derived NK cells.
Our study’s bulk RNA sequencing of CB- and PB- derived MNCs showed significant downregulation of activating and inhibitory receptors and NK cells expression in CB-derived MNCs, which agrees with other studies [37]. CB-derived NK cells appear to be immature in development, have decreased translational and transcriptional genes. An increase in activity of TGF-β and mTOR pathway further suggests that CB-derived NK cells may be more susceptible to TGF-β.
The impaired functionality of CB-derived NK cells can be successfully reversed with ex-vivo expansion in the presence of cytokines. Expanded CB-derived NK cells were comparable to PB-derived NK cells in regard to phenotype and cytolytic potential against TGF-β tumor cells (e.g., the U87 MG cell line). Both PB- and CB-derived NK cells showed similar upregulation of proximal mTOR signaling receptors pSMAD2/3. Furthermore, the decrease in SMAD signaling-dependent metabolites (CD71 and CD122) in response to exogenous TGF- β was not different between donor sources. It is also evident that exposure to a TGF-β rich microenvironment has an equivalent detrimental effect on the cytolytic activity of both PB- and CB-derived NK cell products.
TGF-β mediated downregulation of NK cell-activating receptors allows tumor cells to escape the immune surveillance as evidenced by the marked down-regulation of the activating receptors NKG2D, DNAM1, and NKp30 on both CB- and PB-derived NK cells [58]. Our results, demonstrate that there is a loss of effector function (i.e. cytotoxicity and activating receptor downregulation) after exposure to TGF-β, and this data concurs with earlier works published by our group and others, evaluating either CB-derived [4, 53, 54] or PB-derived [55, 57, 59] NK cells.
The unbiased clustering of individual gene expression changes in the presence of exogenous TGF-β revealed that ex vivo expanded NK cells showed only modest clustering according to donor source, further confirming that ex vivo expansion potentially neutralizes the inherent differences between CB- and PB-derived NK cells. Additionally, we observed an upregulation of inhibitory receptors (e.g. GRB2, KIR3DL1, KLRC1 and PTPN6) revealing a novel mechanism of TGF-β mediated immune suppression not previously reported. As expected, we observed the downregulation of many essential cytotoxicity pathways such as lytic enzyme perforin, NCR2, NCR3 and ITGB2 for expanded NK cells irrespective of donor source. We further observed that some essential pathways such as GZMB, IFNAR1, 2B4 and FCE31G associated with NK cells cytotoxicity are still upregulated with exposure to exogenous TGF-β, indicating that NK cells are not completely functionally impaired post exposure to TGF-β. This could explain the residual cytotoxicity observed after TGF-β exposure. The overall upregulation trend of the NK cell effector function pathways (specifically LCK, lCP2, MAPK1 and NFATC1) further confirms this assertion. Together, these results further suggest that TGF-β mediated immune suppression does not render NK cells completely dysfunctional.
It is important to point out that we have observed some discrepancies between the consistency of upregulation/downregulation between both NK cell donor sources. Some pathways were significantly upregulated (e.g. KIR2DS3, KIR3DL1, TNFSF10B, and LCP2) or downregulated (e.g. Perforin, KLRD1, and KIR2DL4) in one source but not in the other. We also observed a switch between an upregulation and downregulation trend between the two-donor sources. For example, both KIR2DL4 associated with NK cell’s inhibitory pathway gene was upregulated in CB-derived NK cells while it showed significant downregulation in PB-derived NK cells. Similarly, KLRD1 was significantly upregulated in PB-derived NK cells but showed downregulation in CB-derived NK cells. Further, IFNAR2, associated with cytokine pathways, showed a significant downregulation in PB-derived NK cells but was upregulated in CB -derived NK cells.
This data supports the development and translation of strategies to restore NK cell function in the presence of TGF-β, such as (i) the use of TGF-β neutralizing antibodies or (ii) a TGF-β signaling inhibitor like LY2157299 (TGF-β kinase inhibitors) [55] or (iii) NK cell gene engineering strategies using a dominant-negative TGF-β receptor to mitigate TGF- β signaling [4, 54, 60] or deleting TGFBR2 on NK cells [56]. In summary, these results indicate that some pathways may be more susceptible/sensitive to TGF-β exposure in one donor source over the other, underling some mechanistic differences between PB- and CB-derived NK cells. In addition to these intrinsic differences, we also observed a donor-dependent discrepancy in gene expression change on exposure to TGF-β. This indicates that some donors, irrespective of the donor source, are more resistant or sensitive to TGF-β mediated immune suppression than others. Further exploration of such “sensitive” donors could inform essential screening or release criteria to prepare more resistant NK cell products for cancer immunotherapy. Overall, the relative change in gene expression in both CB-and PB-derived NK cells was equivalent which further confirms our hypothesis that both donor sources are equally susceptible to TGF-β mediated immune suppression.
MATERIALS AND METHODS
Cell source and cell lines
Umbilical cord blood and Peripheral Blood were obtained under CNH IRB-approved protocols Pro0004033, Pro00003896, Pro00009374, and Pro00003869. CB- and PB- derived MNCs were harvested by density gradient separation with Lymphoprep (STEMCELL Technologies). K562 cell line (purchased from ATCC) were cultured with RPMI medium (Thermo Fisher Scientific) supplemented with 10% fetal bovine serum (FBS) (Gibco, Thermo Fisher Scientific), 1% penicillin-streptomycin, and 1% Glutamax (Gibco, Thermo Fisher Scientific). U87 MG cells were purchased from ATCC and were cultured in DMEM:F12 media (1:1) with 10% FBS and 1% Glutamax. All cell lines were tested regularly for mycoplasma contamination.
RNA-seq analysis
Total RNA from frozen MNCs was isolated using miRNeasy Mini Kit (QIAGEN). A KAPA RNA HyperPrep Kit with RiboErase (Roche Sequencing Solutions) was used for library preparation and sequenced on Illumina NovaSeq 6000 using 100 paired end sequencing. Quality control for raw reads was performed with FastQC [61]. Spliced alignment of the reads to the reference genome was done with STAR followed by a second round of quality control using RSeQC [62]. Samples were aligned to the human genome using reference build GRCh38.p7 and the corresponding GENCODE annotation version 25 (March 2016). Mapped reads were quantified at the gene level as a raw counts matrix using featureCounts from Subread [63] using fracOverlap 1 (only entire reads overlapping to annotation feature are counted). Raw feature counts were normalized, and differential expression analysis was carried out using DESeq2 [64]. Differential expression rank order was used for subsequent gene set enrichment analysis (GSEA), performed using the clusterProfiler package in R. Gene set variation analysis (GSVA) was applied on select gene sets using the GSVA package in R. Gene sets queried included the Hallmark, Canonical pathways, and GO Biological Processes Ontology collections available through the Molecular Signatures Database (MSigDB) [61].
Expansion of NK cells
NK cells were isolated by negative selection with the EasySep Human NK Cell Isolation Kit (StemCell Technologies). After 24 hours of activation with 10 ng/mL of human IL15 (R&D Systems), NK cells were stimulated with unmodified K562 feeder cells previously irradiated at 200 Gy. Irradiated K562 cells were cultured with NK cells at a 2:1 K562:NK-cell ratio. NK cells were expanded in Stem Cell Growth Medium (CellGenix) supplemented with 200 IU/mL human IL2, 10 ng/mL human IL15, 10% FBS (Gibco, Thermo Fisher Scientific), and 1% Glutamax (Gibco, Thermo Fisher Scientific). NK cells were stimulated again on day 12 of culture at a 2:1 (K562:NK-cell) ratio. Sample sizes (number of donor-derived lines) used for each experiment are specified in each figure legend.
Phenotypic assessment of expanded NK cells
NK cells were harvested from 21- or 28-day cultures, washed with FACS buffer, and incubated with human FcR Blocking Reagent (Miltenyi Biotech) for 5 minutes, followed by antibodies staining for 15 mins at room temp in the dark. NK cell phenotypes were assessed by flow cytometry using antibodies (Abs) specific to human CD3 (PE-cy7 and Bv421), CD16 (APC-cy7 and BV650), CD25 (BV421), CD56 (PerCp/Cyanine5.5 and APC), CD57(FITC), CD69 (APC-cy7 and BV650), NKp30(APC), NKp46(PE), NKp44 (FITC), NKG2D(BV421), TGF-βRII (APC and PE), TIM-3 (PE) and PD-1 (APC) from BD bioscience, Thermo Fisher, and BioLegend. To distinguish between live and dead population, samples were stained with Fixable Viability Dyes (Thermofischer). Following that, samples were fixed using BD Cytofix/Cytoperm™ Fixation/Permeabilization Kit (BD biosciences). Samples were acquired with CytoFLEX (Research Flow Cytometry - Beckman Coulter). For each sample, a minimum of 10,000 events were acquired, and data were analyzed using FlowJo 10 (Beckton Dickinson).
Signaling assessment of NK cells after exposure to TGF-β
PB-and CB-NK derived cell samples (2×10^6 cells) were starved of serum and cytokines for 4 hours and were then treated with 5 ng/mL TGF-β as previously described [4]. TGF-β Treated and untreated cells were lysed, and supernatant collected was assayed using the MILLIPLEX MAP TGF-β kit (EMD Millipore, Burlington, MA, USA), according to the manufacturer’s instructions, looking at levels of pSMAD2 and pSMAD3.
Phenotypic and functional assessment of NK cells after exposure to TGF-β
NK cells were cultured with 5 ng/mL TGF-β (activated with 4 mmol/L HCl) added on days 1 and 3. After five days of treatment, NK cells were examined by flow cytometry or cytotoxicity assays [4]. The cytolytic ability of the NK cell products after exposure to TGF-β was determined using luciferase-based biophotonic cytolytic assay[65, 66]. Briefly, NK cells were co-cultured with luciferase-expressing, TGF-β secreting U87 MG cells at a final concentration of 75 ug/ml. The plate was dark-adapted for 5–10 min, and luminescence was read using any plate reader (BMG LABTECH).
qPCR:
Total RNA was extracted using Monarch® Total RNA Miniprep Kit. RNA was reverse transcribed using AzuraFlex™ cDNA Synthesis Kit. Quantitative real-time PCR (qRT-PCR) was performed using AzuraView GreenFast qPCR Blue Mix Lo Rox master mix (Realtimeprimer.com) on Quant studio II (Thermo Fisher Scientific). The relative expression levels of target genes were measured and normalized against levels of housekeeping genes ACTB, B2M, GAPDH, GUSB, HPRT1, PGK1, PPIA, and RPL13A. Fold-difference (as relative mRNA expression) was calculated by the delta Ct method [67]. Human NK Cell Tox Primer Library was purchased from Realtimeprimer.com. To calculated significance of the gene expression we performed multiple t-test assuming that the housekeeping genes used for normalization do not vary between PB-and CB-derived NK cells. The relative change in gene expression is calculated as:
Quantification and statistical analysis
Two-way ANOVA was used to determine statistically significant differences between donor sources unless otherwise mentioned. Holm-Sidak test adjusted p-value < 0.05 indicated a significant difference. Experimental sample number (n) is also described in the individual figure legends. Graph generation and statistical analyses were performed using the GraphPad Prism software (GraphPad, La Jolla, CA).
Supplementary Material
Supplemental Figure1. Transcriptional profiling of MNCs from peripheral blood, cord blood. Pathway enrichment analysis identified biological pathways that are enriched in the gene list more than would be expected by chance. (A-B) Bubble chart of top 30 up-regulated (yellow dots) and downregulated DEGs. The x axis corresponds to normalized enrichment score (NES), while the y axis indicates the enriched pathways. Color of the bubble indicates the number of differentially expressed genes (DEGs) in the given pathway. Enrichment scores indicate up (red) or down (blue)regulation (positive or negative values, respectively). The size of the bubble indicates the −log10(lowest-p) value; the smaller the bubble is, the more significantly the pathway is enriched. (C) PCA analysis on gene expression data. PCA was performed on differentially expressed gene. PCA identified two distinct clusters in the data separated along the first principal component. Different coloring schemes revealed that clustering was associated with the MNCs donor source. (D) Volcano plots representing upregulated and downregulated transcripts between PB and CB MNCs. Size of each data point is calculated as −log10(p-value) × log2(FC), p-value cutoff p < 0.05, fold change cutoff > 2 or <1/2. Red dots represent upregulated transcripts, blue dots represent downregulated transcripts. (E) Box plot of the activity scores for some key NK cells pathway. Blue box represent CB MNCs and red box represent PB MNCs. Whiskers denote minimum-maximum score (n=5). (F) Heat map depicting mean Delta Ct values for NK cells isolated form cord blood (CB) and peripheral blood (PB). Dendrograms show the hierarchical clustering (Pearson distance) between samples. CB donors are highlighted by blue and PB donors are denoted by red (n=5 per group). (F) Heat map of candidate gene expression measured by RT-qPCR in ex vivo expanded NK cells from CB and PB (Blue representing downregulation, red representing upregulation relative to the house keeping genes). Cells were expanded ex vivo as described in methods. All experiments were undertaken in triplicate. CB donors are highlighted by blue and PB donors are denoted by red. Pathways are categorized as (1) Cytokines and Lytic enzymes pathway genes (Pink), (2) NK cells effector function pathways (Orange) including, DAP signaling, Calcium signaling, (3) NK cells Inhibition pathway genes (Blue) and NK cells activation pathway genes and MAPK pathways (Green). (n=5). (G) Anti-tumor function of PB and CB derived NK cells, as measured by luciferase based cytotox assay, against U87 at 72 hrs for individual donors. CB derived NK cells (Blue line) were equally efficient as PB derived NK cells (Red line) in killing U87 MG targets at different E:T ratio (x-axis) (n=4). Error bars represent standard deviation. 2-way ANOVA was used to determine the significance between the groups.
Supplemental Figure 2. Gene expression alterations associated with exogenous TGF-ß treatment. PB and CB derived NK cells were cultured in the absence and presence of TGF-ß for 5 days. The cells were then analyzed by qPCR to determine the change in NK cells effector function in response to TGF-ß treatment. (A-C) Relative change in PB and CB NK cells gene expression due to exposure to TGF-ß. The change in gene expression in presence of TGF-ß is normalized to gene expression in absence of TGF-ß and is shown in log2 fold change (y axis). (A.) Mean fold change for NK cells genes significantly changed on TGF-β exposure in both CB (Blue bar) and PB (Red bar) derived NK cells. (B.) Mean fold change for NK cells genes significantly changed on TGF-β exposure in CB derived NK cells. (C.) Mean fold change for NK cells genes significantly changed on TGF-β exposure in PB derived NK cells. For gene annotation see abbreviation section. Error bar represent standard deviation.
Supplemental Figure 3. NK cells FACS analysis gating strategies. (A.) NK cells Gate hierarchy: lymphocyte gate>Single cell gate>Live cell gate> NK cells gate (CD3-ve and CD56+ve). (B.) NK cells receptor markers gates compared to the blank population (cells without antibody).
Supplemental Figure 4. TGF- β secretion by U87 cells. U87 cells were co-cultured with and without M2 macrophages and supernatant was evaluated for TGF- β secretion using Elisa.
ACKNOWLEDGMENTS
This work was partially supported by Catamaran Bio, LLC, National Cancer Institute (NCI) grant (P30CA016056) involving the use of Roswell Park Comprehensive Cancer Center’s Genomic Shared Resource and the NIH Moonshot grant (5 U01 CA239258-02).
Footnotes
CONFLICT OF INTEREST
CRYC. is a consultant for Catamaran Bio NK cell company. CMB is a co-founder and scientific advisory board member for Catamaran Bio. CRYC, CS, and CMB have intellectual property related to developing NK cell therapies. All other authors declare no competing interests
Publisher's Disclaimer: This is a PDF file of an unedited manuscript that has been accepted for publication. As a service to our customers we are providing this early version of the manuscript. The manuscript will undergo copyediting, typesetting, and review of the resulting proof before it is published in its final form. Please note that during the production process errors may be discovered which could affect the content, and all legal disclaimers that apply to the journal pertain.
REFERENCES
- 1.Li D, et al. , Genetically engineered T cells for cancer immunotherapy. Signal Transduction and Targeted Therapy, 2019. 4(1): p. 35. [DOI] [PMC free article] [PubMed] [Google Scholar]
- 2.Herrera L, et al. , Adult peripheral blood and umbilical cord blood NK cells are good sources for effective CAR therapy against CD19 positive leukemic cells. Scientific Reports, 2019. 9(1): p. 18729. [DOI] [PMC free article] [PubMed] [Google Scholar]
- 3.Chaudhry K, Dowlati E, and Bollard CM, Chimeric antigen receptor-engineered natural killer cells: a promising cancer immunotherapy. Expert Rev Clin Immunol, 2021. 17(6): p. 643–659. [DOI] [PubMed] [Google Scholar]
- 4.Yvon ES, et al. , Cord blood natural killer cells expressing a dominant negative TGF-beta receptor: Implications for adoptive immunotherapy for glioblastoma. Cytotherapy, 2017. 19(3): p. 408–418. [DOI] [PubMed] [Google Scholar]
- 5.Pfefferle A. and Huntington ND, You Have Got a Fast CAR: Chimeric Antigen Receptor NK Cells in Cancer Therapy. Cancers, 2020. 12(3): p. 706. [DOI] [PMC free article] [PubMed] [Google Scholar]
- 6.Basar R, Daher M, and Rezvani K, Next-generation cell therapies: the emerging role of CAR-NK cells. Blood Advances, 2020. 4(22): p. 5868–5876. [DOI] [PMC free article] [PubMed] [Google Scholar]
- 7.Sanchez CE, et al. , NK Cell Adoptive Immunotherapy of Cancer: Evaluating Recognition Strategies and Overcoming Limitations. Biol Blood Marrow Transplant, 2020. [DOI] [PMC free article] [PubMed] [Google Scholar]
- 8.Xing D, et al. , Cord blood natural killer cells exhibit impaired lytic immunological synapse formation that is reversed with IL-2 exvivo expansion. J Immunother, 2010. 33(7): p. 684–96. [DOI] [PMC free article] [PubMed] [Google Scholar]
- 9.Miller JS, et al. , Successful adoptive transfer and in vivo expansion of human haploidentical NK cells in patients with cancer. Blood, 2005. 105(8): p. 3051–7. [DOI] [PubMed] [Google Scholar]
- 10.Passweg JR, et al. , Use of natural killer cells in hematopoetic stem cell transplantation. Bone Marrow Transplant, 2005. 35(7): p. 637–43. [DOI] [PubMed] [Google Scholar]
- 11.Hsu KC, et al. , Improved outcome in HLA-identical sibling hematopoietic stem-cell transplantation for acute myelogenous leukemia predicted by KIR and HLA genotypes. Blood, 2005. 105(12): p. 4878–84. [DOI] [PMC free article] [PubMed] [Google Scholar]
- 12.Matsuo Y. and Drexler HG, Immunoprofiling of cell lines derived from natural killer-cell and natural killer-like T-cell leukemia-lymphoma. Leuk Res, 2003. 27(10): p. 935–45. [DOI] [PubMed] [Google Scholar]
- 13.Woll PS, et al. , Human embryonic stem cells differentiate into a homogeneous population of natural killer cells with potent in vivo antitumor activity. Blood, 2009. 113(24): p. 6094–101. [DOI] [PMC free article] [PubMed] [Google Scholar]
- 14.Chouaib S, et al. , Improving the outcome of leukemia by natural killer cell-based immunotherapeutic strategies. Frontiers in immunology, 2014. 5: p. 95–95. [DOI] [PMC free article] [PubMed] [Google Scholar]
- 15.Winters JL, Complications of donor apheresis. J Clin Apher, 2006. 21(2): p. 132–41. [DOI] [PubMed] [Google Scholar]
- 16.Miller JP, et al. , Recovery and safety profiles of marrow and PBSC donors: experience of the National Marrow Donor Program. Biol Blood Marrow Transplant, 2008. 14(9 Suppl): p. 29–36. [DOI] [PubMed] [Google Scholar]
- 17.Yuan S, et al. , Moderate and severe adverse events associated with apheresis donations: incidences and risk factors. Transfusion, 2010. 50(2): p. 478–86. [DOI] [PubMed] [Google Scholar]
- 18.Knorr DA, et al. , Clinical-scale derivation of natural killer cells from human pluripotent stem cells for cancer therapy. Stem Cells Transl Med, 2013. 2(4): p. 274–83. [DOI] [PMC free article] [PubMed] [Google Scholar]
- 19.Ni Z, et al. , Expression of chimeric receptor CD4ζ by natural killer cells derived from human pluripotent stem cells improves in vitro activity but does not enhance suppression of HIV infection in vivo. Stem cells (Dayton, Ohio), 2014. 32(4): p. 1021–1031. [DOI] [PMC free article] [PubMed] [Google Scholar]
- 20.Shankar K, Capitini CM, and Saha K, Genome engineering of induced pluripotent stem cells to manufacture natural killer cell therapies. Stem cell research & therapy, 2020. 11(1): p. 234–234. [DOI] [PMC free article] [PubMed] [Google Scholar]
- 21.Suck G, et al. , NK-92: an ‘off-the-shelf therapeutic’ for adoptive natural killer cell-based cancer immunotherapy. Cancer Immunol Immunother, 2016. 65(4): p. 485–92. [DOI] [PMC free article] [PubMed] [Google Scholar]
- 22.Romanski A, et al. , CD19-CAR engineered NK-92 cells are sufficient to overcome NK cell resistance in B-cell malignancies. J Cell Mol Med, 2016. 20(7): p. 1287–94. [DOI] [PMC free article] [PubMed] [Google Scholar]
- 23.Oelsner S, et al. , Continuously expanding CAR NK-92 cells display selective cytotoxicity against B-cell leukemia and lymphoma. Cytotherapy, 2017. 19(2): p. 235–249. [DOI] [PubMed] [Google Scholar]
- 24.Kobayashi E, et al. , A chimeric antigen receptor for TRAIL-receptor 1 induces apoptosis in various types of tumor cells. Biochem Biophys Res Commun, 2014. 453(4): p. 798–803. [DOI] [PubMed] [Google Scholar]
- 25.Gong JH, Maki G, and Klingemann HG, Characterization of a human cell line (NK-92) with phenotypical and functional characteristics of activated natural killer cells. Leukemia, 1994. 8(4): p. 652–8. [PubMed] [Google Scholar]
- 26.Rezvani K. and Rouce RH, The Application of Natural Killer Cell Immunotherapy for the Treatment of Cancer. Front Immunol, 2015. 6: p. 578. [DOI] [PMC free article] [PubMed] [Google Scholar]
- 27.Dahlberg CI, et al. , Natural Killer Cell-Based Therapies Targeting Cancer: Possible Strategies to Gain and Sustain Anti-Tumor Activity. Front Immunol, 2015. 6: p. 605. [DOI] [PMC free article] [PubMed] [Google Scholar]
- 28.Mehta RS, Shpall EJ, and Rezvani K, Cord Blood as a Source of Natural Killer Cells. Frontiers in Medicine, 2016. 2. [DOI] [PMC free article] [PubMed] [Google Scholar]
- 29.Rutella S, et al. , Identification of a novel subpopulation of human cord blood CD34CD133-CD7-CD45+lineage- cells capable of lymphoid/NK cell differentiation after in vitro exposure to IL-15. J Immunol, 2003. 171(6): p. 2977–88. [DOI] [PubMed] [Google Scholar]
- 30.Mehta RS, Shpall EJ, and Rezvani K, Cord Blood as a Source of Natural Killer Cells. Frontiers in medicine, 2016. 2: p. 93–93. [DOI] [PMC free article] [PubMed] [Google Scholar]
- 31.Dalle J-H, et al. , Characterization of Cord Blood Natural Killer Cells: Implications for Transplantation and Neonatal Infections. Pediatric Research, 2005. 57(5): p. 649–655. [DOI] [PubMed] [Google Scholar]
- 32.Tanaka H, et al. , Analysis of natural killer (NK) cell activity and adhesion molecules on NK cells from umbilical cord blood. Eur J Haematol, 2003. 71(1): p. 29–38. [DOI] [PubMed] [Google Scholar]
- 33.Krampera M, et al. , Intracellular cytokine profile of cord blood T-, and NK- cells and monocytes. Haematologica, 2000. 85(7): p. 675–9. [PubMed] [Google Scholar]
- 34.Chan CJ, Smyth MJ, and Martinet L, Molecular mechanisms of natural killer cell activation in response to cellular stress. Cell Death & Differentiation, 2014. 21(1): p. 5–14. [DOI] [PMC free article] [PubMed] [Google Scholar]
- 35.Vivier E, et al. , Targeting natural killer cells and natural killer T cells in cancer. Nature reviews. Immunology, 2012. 12(4): p. 239–252. [DOI] [PMC free article] [PubMed] [Google Scholar]
- 36.Alnabhan R, Madrigal A, and Saudemont A, Differential activation of cord blood and peripheral blood natural killer cells by cytokines. Cytotherapy, 2015. 17(1): p. 73–85. [DOI] [PubMed] [Google Scholar]
- 37.Shereck E, et al. , Immunophenotypic, cytotoxic, proteomic and genomic characterization of human cord blood vs. peripheral blood CD56(Dim) NK cells. Innate immunity, 2019. 25(5): p. 294–304. [DOI] [PMC free article] [PubMed] [Google Scholar]
- 38.Shaim H. and Yvon E, Cord blood: a promising source of allogeneic natural killer cells for immunotherapy. Cytotherapy, 2015. 17(1): p. 1–2. [DOI] [PubMed] [Google Scholar]
- 39.Shah N, et al. , Antigen presenting cell-mediated expansion of human umbilical cord blood yields log-scale expansion of natural killer cells with anti-myeloma activity. PLoS One, 2013. 8(10): p. e76781. [DOI] [PMC free article] [PubMed] [Google Scholar]
- 40.Liu E, et al. , Cord blood NK cells engineered to express IL-15 and a CD19-targeted CAR show long-term persistence and potent antitumor activity. Leukemia, 2018. 32(2): p. 520–531. [DOI] [PMC free article] [PubMed] [Google Scholar]
- 41.Werneck MB, et al. , T-bet plays a key role in NK-mediated control of melanoma metastatic disease. J Immunol, 2008. 180(12): p. 8004–10. [DOI] [PMC free article] [PubMed] [Google Scholar]
- 42.Townsend MJ, et al. , T-bet regulates the terminal maturation and homeostasis of NK and Valpha14i NKT cells. Immunity, 2004. 20(4): p. 477–94. [DOI] [PubMed] [Google Scholar]
- 43.Pearce EL, et al. , Control of effector CD8+ T cell function by the transcription factor Eomesodermin. Science, 2003. 302(5647): p. 1041–3. [DOI] [PubMed] [Google Scholar]
- 44.Dasgupta S, et al. , Inhibition of NK cell activity through TGF-beta 1 by down-regulation of NKG2D in a murine model of head and neck cancer. J Immunol, 2005. 175(8): p. 5541–50. [DOI] [PubMed] [Google Scholar]
- 45.Meadows SK, et al. , Human NK cell IFN-gamma production is regulated by endogenous TGF-beta. Int Immunopharmacol, 2006. 6(6): p. 1020–8. [DOI] [PubMed] [Google Scholar]
- 46.Lee HM, Kim KS, and Kim J, A comparative study of the effects of inhibitory cytokines on human natural killer cells and the mechanistic features of transforming growth factor-beta. Cell Immunol, 2014. 290(1): p. 52–61. [DOI] [PubMed] [Google Scholar]
- 47.Yang D, et al. , Role of Transforming Growth Factor-β1 in Regulating Fetal-Maternal Immune Tolerance in Normal and Pathological Pregnancy. Frontiers in Immunology, 2021. 12. [DOI] [PMC free article] [PubMed] [Google Scholar]
- 48.Shereck E, et al. , Immunophenotypic, cytotoxic, proteomic and genomic characterization of human cord blood vs. peripheral blood CD56Dim NK cells. Innate Immunity, 2019. 25(5): p. 294–304. [DOI] [PMC free article] [PubMed] [Google Scholar]
- 49.Luevano M, et al. , The unique profile of cord blood natural killer cells balances incomplete maturation and effective killing function upon activation. Hum Immunol, 2012. 73(3): p. 248–57. [DOI] [PubMed] [Google Scholar]
- 50.Viel S, et al. , TGF-β inhibits the activation and functions of NK cells by repressing the mTOR pathway. Sci Signal, 2016. 9(415): p. ra19. [DOI] [PubMed] [Google Scholar]
- 51.Marçais A, et al. , The metabolic checkpoint kinase mTOR is essential for IL-15 signaling during the development and activation of NK cells. Nature immunology, 2014. 15(8): p. 749–757. [DOI] [PMC free article] [PubMed] [Google Scholar]
- 52.Viel S, et al. , TGF-β inhibits the activation and functions of NK cells by repressing the mTOR pathway. Science Signaling, 2016. 9(415): p. ra19–ra19. [DOI] [PubMed] [Google Scholar]
- 53.Burga RA, et al. , Engineering the TGFβ receptor to Enhance the Therapeutic Potential of Natural Killer Cells as an Immunotherapy for Neuroblastoma. Clinical Cancer Research, 2019: p. clincanres.3183.2018. [DOI] [PMC free article] [PubMed] [Google Scholar]
- 54.Powell AB, et al. , Medulloblastoma rendered susceptible to NK-cell attack by TGFβ neutralization. Journal of Translational Medicine, 2019. 17(1): p. 321. [DOI] [PMC free article] [PubMed] [Google Scholar]
- 55.Otegbeye F, et al. , Inhibiting TGF-beta signaling preserves the function of highly activated, in vitro expanded natural killer cells in AML and colon cancer models. PloS one, 2018. 13(1): p. e0191358-e0191358. [DOI] [PMC free article] [PubMed] [Google Scholar]
- 56.Shaim H, et al. , Targeting the αv integrin/TGF-β axis improves natural killer cell function against glioblastoma stem cells. The Journal of Clinical Investigation, 2021. 131(14). [DOI] [PMC free article] [PubMed] [Google Scholar]
- 57.Wilson EB, et al. , Human tumour immune evasion via TGF-β blocks NK cell activation but not survival allowing therapeutic restoration of anti-tumour activity. PloS one, 2011. 6(9): p. e22842-e22842. [DOI] [PMC free article] [PubMed] [Google Scholar]
- 58.Crane CA, et al. , TGF-β downregulates the activating receptor NKG2D on NK cells and CD8+ T cells in glioma patients. Neuro-Oncology, 2009. 12(1): p. 7–13. [DOI] [PMC free article] [PubMed] [Google Scholar]
- 59.Zhao Y, et al. , Enhanced NK cell adoptive antitumor effects against breast cancer in vitro via blockade of the transforming growth factor-β signaling pathway. Onco Targets Ther, 2015. 8: p. 1553–9. [DOI] [PMC free article] [PubMed] [Google Scholar]
- 60.Bollard CM, et al. , Adapting a transforming growth factor β–related tumor protection strategy to enhance antitumor immunity. Blood, 2002. 99(9): p. 3179–3187. [DOI] [PubMed] [Google Scholar]
- 61.Subramanian A, et al. , Gene set enrichment analysis: a knowledge-based approach for interpreting genome-wide expression profiles. Proc Natl Acad Sci U S A, 2005. 102(43): p. 15545–50. [DOI] [PMC free article] [PubMed] [Google Scholar]
- 62.Wang L, Wang S, and Li W, RSeQC: quality control of RNA-seq experiments. Bioinformatics, 2012. 28(16): p. 2184–2185. [DOI] [PubMed] [Google Scholar]
- 63.Liao Y, Smyth GK, and Shi W, The Subread aligner: fast, accurate and scalable read mapping by seed-and-vote. Nucleic acids research, 2013. 41(10): p. e108-e108. [DOI] [PMC free article] [PubMed] [Google Scholar]
- 64.Love MI, Huber W, and Anders S, Moderated estimation of fold change and dispersion for RNA-seq data with DESeq2. Genome Biol, 2014. 15(12): p. 550. [DOI] [PMC free article] [PubMed] [Google Scholar]
- 65.Brown CE, et al. , Biophotonic cytotoxicity assay for high-throughput screening of cytolytic killing. Journal of Immunological Methods, 2005. 297(1): p. 39–52. [DOI] [PubMed] [Google Scholar]
- 66.Karimi MA, et al. , Measuring Cytotoxicity by Bioluminescence Imaging Outperforms the Standard Chromium-51 Release Assay. PLOS ONE, 2014. 9(2): p. e89357. [DOI] [PMC free article] [PubMed] [Google Scholar]
- 67.Livak KJ and Schmittgen TD, Analysis of relative gene expression data using real-time quantitative PCR and the 2(-Delta Delta C(T)) Method. Methods, 2001. 25(4): p. 402–8. [DOI] [PubMed] [Google Scholar]
Associated Data
This section collects any data citations, data availability statements, or supplementary materials included in this article.
Supplementary Materials
Supplemental Figure1. Transcriptional profiling of MNCs from peripheral blood, cord blood. Pathway enrichment analysis identified biological pathways that are enriched in the gene list more than would be expected by chance. (A-B) Bubble chart of top 30 up-regulated (yellow dots) and downregulated DEGs. The x axis corresponds to normalized enrichment score (NES), while the y axis indicates the enriched pathways. Color of the bubble indicates the number of differentially expressed genes (DEGs) in the given pathway. Enrichment scores indicate up (red) or down (blue)regulation (positive or negative values, respectively). The size of the bubble indicates the −log10(lowest-p) value; the smaller the bubble is, the more significantly the pathway is enriched. (C) PCA analysis on gene expression data. PCA was performed on differentially expressed gene. PCA identified two distinct clusters in the data separated along the first principal component. Different coloring schemes revealed that clustering was associated with the MNCs donor source. (D) Volcano plots representing upregulated and downregulated transcripts between PB and CB MNCs. Size of each data point is calculated as −log10(p-value) × log2(FC), p-value cutoff p < 0.05, fold change cutoff > 2 or <1/2. Red dots represent upregulated transcripts, blue dots represent downregulated transcripts. (E) Box plot of the activity scores for some key NK cells pathway. Blue box represent CB MNCs and red box represent PB MNCs. Whiskers denote minimum-maximum score (n=5). (F) Heat map depicting mean Delta Ct values for NK cells isolated form cord blood (CB) and peripheral blood (PB). Dendrograms show the hierarchical clustering (Pearson distance) between samples. CB donors are highlighted by blue and PB donors are denoted by red (n=5 per group). (F) Heat map of candidate gene expression measured by RT-qPCR in ex vivo expanded NK cells from CB and PB (Blue representing downregulation, red representing upregulation relative to the house keeping genes). Cells were expanded ex vivo as described in methods. All experiments were undertaken in triplicate. CB donors are highlighted by blue and PB donors are denoted by red. Pathways are categorized as (1) Cytokines and Lytic enzymes pathway genes (Pink), (2) NK cells effector function pathways (Orange) including, DAP signaling, Calcium signaling, (3) NK cells Inhibition pathway genes (Blue) and NK cells activation pathway genes and MAPK pathways (Green). (n=5). (G) Anti-tumor function of PB and CB derived NK cells, as measured by luciferase based cytotox assay, against U87 at 72 hrs for individual donors. CB derived NK cells (Blue line) were equally efficient as PB derived NK cells (Red line) in killing U87 MG targets at different E:T ratio (x-axis) (n=4). Error bars represent standard deviation. 2-way ANOVA was used to determine the significance between the groups.
Supplemental Figure 2. Gene expression alterations associated with exogenous TGF-ß treatment. PB and CB derived NK cells were cultured in the absence and presence of TGF-ß for 5 days. The cells were then analyzed by qPCR to determine the change in NK cells effector function in response to TGF-ß treatment. (A-C) Relative change in PB and CB NK cells gene expression due to exposure to TGF-ß. The change in gene expression in presence of TGF-ß is normalized to gene expression in absence of TGF-ß and is shown in log2 fold change (y axis). (A.) Mean fold change for NK cells genes significantly changed on TGF-β exposure in both CB (Blue bar) and PB (Red bar) derived NK cells. (B.) Mean fold change for NK cells genes significantly changed on TGF-β exposure in CB derived NK cells. (C.) Mean fold change for NK cells genes significantly changed on TGF-β exposure in PB derived NK cells. For gene annotation see abbreviation section. Error bar represent standard deviation.
Supplemental Figure 3. NK cells FACS analysis gating strategies. (A.) NK cells Gate hierarchy: lymphocyte gate>Single cell gate>Live cell gate> NK cells gate (CD3-ve and CD56+ve). (B.) NK cells receptor markers gates compared to the blank population (cells without antibody).
Supplemental Figure 4. TGF- β secretion by U87 cells. U87 cells were co-cultured with and without M2 macrophages and supernatant was evaluated for TGF- β secretion using Elisa.


