


Abstract
Phenobarbital induction of transcription of CYP2B genes is mediated by an enhancer, termed a phenobarbital responsive unit (PBRU), ~2000 bp 5′ of the transcription start site. To further delineate the mechanism of phenobarbital induction, protein binding in native chromatin and the nucleosomal structure of the PBRU and proximal promoter were examined in liver and kidney, in which the CYP2B1/2 genes are expressed and not expressed, respectively. Protein binding to the PBRU in kidney chromatin was not detected even though in vitro DNase I footprints were not detectably different with nuclear extracts from liver and kidney. Likewise, protein binding to regulatory motifs was not detected in the proximal promoter region in kidney chromatin. In liver chromatin, however, DNase I hypersensitivity and partial protection of the regulatory motifs from DNase I digestion or reaction with dimethyl sulfate was observed and phenobarbital treatment increased the hypersensitivity but only modestly affected protection. Low resolution Southern analysis of micrococcal nuclease-digested chromatin from untreated rats revealed micrococcal nuclease hypersensitive regions in the proximal promoter and PBRU regions in liver, but not in kidney. Phenobarbital treatment increased hypersensitivity in liver in both regions. Micrococcal nuclease hypersensitivity in the PBRU was largely restricted to a linker region between phased nucleosomes while in the proximal promoter hypersensitivity extended over ~200 bp suggesting disruption of a nucleosome in this region. These data indicate that in liver phenobarbital treatment substantially alters protein binding to regulatory motifs in the PBRU, while not greatly affecting such binding in the proximal promoter, and substantially alters chromatin structure in both regions, presumably as a result of chromatin modifying factors recruited to the PBRU. In the kidney, chromatin is probably in a closed conformation that prevents binding of regulatory factors.
INTRODUCTION
Cytochromes P450 (P450s) are a superfamily of heme proteins that metabolize many foreign and endogenous compounds (1,2). The activities of subsets P450s are induced by a variety of agents, primarily at the level of gene transcription (3). Phenobarbital (PB) is a prototypic inducer of P450s in the CYP2B, CYP2C and CYP3A subfamilies, of which the CYP2B genes are most highly induced (4). In the rat, CYP2B1/2 encode closely related proteins that have only 14 differences in the 490 amino acids in their sequence (5). These genes are expressed at high levels in liver only after treatment with phenobarbital-like inducers and neither gene is expressed in most other tissues including the kidney (6).
The regulation of basal and PB-induced CYP2B1/2 gene expression is not well understood, but a PB-responsive unit (PBRU) has been identified at about –2.2 kb in rat CYP2B1/2 (7,8), and an analogous region is present in mouse Cyp2b10 (9). The PB responsive region is centered on a nuclear factor-1 (NF-1) site, and two nuclear receptor-like motifs, designated NR-1 and NR-2, flank the NF-1 site (9–12). Additional flanking sites, a glucocorticoid responsive element (GRE)-like motif and a motif termed an accessory factor site, may contribute to transcriptional activation (10). Although protein binding studies in vitro by gel shift assays or DNase I footprinting revealed little or no changes in protein binding to this region after PB treatment (7,9,11,13), DNase I footprinting studies demonstrated that PB treatment altered nuclear protein binding to the PBRU region of the CYP2B1/2 in native liver chromatin by increasing the binding to a core region centered on the NF-1 site and extending the protection in both the 5′ and 3′ directions (13). In addition, binding of a heterodimer of retinoid X receptor (RXR) and constitutive androstane receptor (CAR) to the NR-1 site was observed only with nuclear extracts from PB-treated animals (14).
Several potential regulatory sites in the proximal promoter have been identified by protein binding assays and functional analysis in vitro. Functional analyses in cultured cells or by direct injection in liver in situ identified a CAAT/enhancer binding protein (C/EBP) site and a basal transcription element (BTE) motif that contribute to basal transcription of the CYP2B2 gene (8,15,16). An NF-1 site at about –128 was detected by DNase I footprinting and additional sites were present to the 5′ side of –160 (15–18). Analysis within 6 h of PB treatment, by which time transcriptional activation is maximal (19), did not result in changes in the binding in vitro (15,16,18). The binding of proteins to the proximal promoter has not been analyzed in native chromatin so that it is not known whether chromatin structure might contribute to changes in binding in response to PB as was observed in the PBRU region. The proximal promoter region of CYP2B1/2, as well as a region mapping near the PBRU, are hypersensitive to DNase I digestion of nuclei in untreated animals and PB treatment alters the level of sensitivity (15). These results suggest that changes in the chromatin structure occur in these two regions in response to PB treatment.
To better understand the mechanism by which PB treatment induces CYP2B1/2 genes, the nucleosomal structure and protein binding in native chromatin have been analyzed in the promoter and the PBRU regions. Transcriptionally silent genes in liver of untreated rats and kidney of untreated or PB-treated rats, and the activated gene in liver of PB-treated rats have been examined. Our data indicate that the basis for the inhibition of transcription in the liver and kidney is fundamentally different and PB treatment primarily alters binding of regulatory proteins to the PBRU with modest effects on the proximal promoter in the liver, but alters chromatin structure in both regions.
MATERIALS AND METHODS
Reverse transcriptase-mediated polymerase chain reaction (RT–PCR)
Rats were injected i.p. with either 100 mg/kg PB or isotonic saline and were sacrificed 6 h later. Total RNA was isolated from the liver or kidney tissues using RNeasy spin columns (Qiagen Corp.) according to the manufacturer’s directions. Reverse transcriptase-mediated cDNA synthesis followed by amplification by PCR was carried out as described (20) using primers based on the sequence of the CYP2B1/2 gene (18,21,22). As an internal control, primers for rat β-actin were included in the PCR reaction.
Nuclei isolation and DNase I, dimethyl sulfate (DMS) and micrococcal nuclease treatment
Rats were injected i.p. with either 100 mg/kg PB or isotonic saline and were sacrificed 6 h later. The methods for in vitro DNase I footprinting have been described previously (13). For chromatin studies, nuclei were isolated from 2.5 g of rat liver and kidney as described (13), adjusted to 1 mg/ml DNA concentration based on A260, and incubated with 90–120 µg/ml DNase I for 10 min on ice, 2.5–25 U/ml of micrococcal nuclease for 5 min at 37°C, or 0.03–0.10% of DMS at room temperature for 3 min. The reaction was stopped by addition 3.33 vol of 20 mM Tris–HCl, pH 8.0, 20 mM NaCl, 20 mM EDTA, 1% SDS, 600 µg/ml proteinase K. After incubation at 37°C for 3 h, the sample was then extracted twice with phenol and phenol:chloroform (1:1), and the genomic DNA was precipitated with ethanol. For the DMS-treated samples, the precipitated DNA was dissolved in 10% piperidine and incubated for 30 min at 90°C. The sample was frozen in dry ice and piperidine was removed by repeated freeze–drying. The DNA was further purified by treatment with 2.8 mg/ml pancreatic RNase for 1 h at 37°C, followed by extraction twice with phenol:chloroform (1:1). For control digestions of purified DNA, 100 µg of genomic DNA in 100–200 µl was digested in a volume of 100–200 µl with 1–5 × 10⁻⁵ U/µg DNA of DNase I at 37°C for 5 min, with 0.0025–0.01 U/µg DNA of micrococcal nuclease (MNase) at 37°C for 5 min, or with 0.03–0.06% DMS at room temperature for 2 min. The DNA was purified as described for the nuclear digestion samples. Five pairs of untreated and PB-treated animals were examined independently for in vivo footprinting and genomic Southern analyses.
Indirect end-labeling genomic Southern analysis
Low resolution analysis of nucleosomal structure in chromatin was performed by indirect end-labeling genomic Southern analysis as described (23,24). Isolated nuclei from liver and kidney were digested with MNase concentrations from 2.5 to 25 U/ml and samples in which nucleosomal ladders extended up to five to eight nucleosomes were chosen for further analysis. Genomic DNA was digested with the restriction enzymes BamHI or HindIII for the proximal promoter or PBRU regions, respectively, and transferred to Nylon membranes and hybridized to probes as described (23,24). For probes, either a BamHI/PstI or a HindIII/HincII DNA fragment from the 5′ flanking region of CYP2B1/2 was labeled with [α-32P]dATP by the random hexamer priming method according to the manufacturer’s directions (Stratagene).
Ligation-mediated PCR (LMPCR) analysis for in vivo footprinting and high resolution mapping of nucleosomal structure
Analysis of genomic DNA by LMPCR was carried out as described (13,25). Primer sets and conditions for LMPCR of the CYP2B1/2 PBRU region were the same as described previously (13). To analyze the promoter region, nested sets of primers were used. For the sense-strand analysis primer 1 corresponded to CYP2B1 nucleotides +109 to +89, primer 2 to nucleotides +93 to +67, and primer 3 to nucleotides +60 to +29. For the antisense strand, primer 1 corresponded to nucleotides –230 to –209, primer 2 to nucleotides –214 to –189, and primer 3 to nucleotides –194 to –162. Annealing temperatures were 42°C for primer 1, 60°C for primer 2 and 65°C for the primer 3. After LMPCR, the PCR products were precipitated and separated by electrophoresis in an 8% polyacrylamide gel containing 7 M urea. The gel was dried and radioactivity was detected by either autoradiography or scanning with a phosphorimager (Molecular Dynamics).
RESULTS
Tissue-specific induction of CYP2B1/2 mRNA by PB
To ensure that the rats used in these studies had not been inadvertently exposed to PB-like inducers in the environment, the mRNA concentrations in the liver and kidney were determined by RT–PCR. A DNA fragment of 180 bp, which is the expected PCR product for CYP2B1/2 mRNA, was detected only in the liver of PB-treated rats and the amount of product was proportional to the number of cycles (Fig. 1). CYP2B1/2 mRNA was not detectable in the liver in untreated animals nor in the kidney with or without treatment. β-actin mRNA was present at about the same concentration in all samples. Therefore, CYP2B1/2 genes are not detectably active in the liver of untreated animals and in the kidney.
Figure 1.
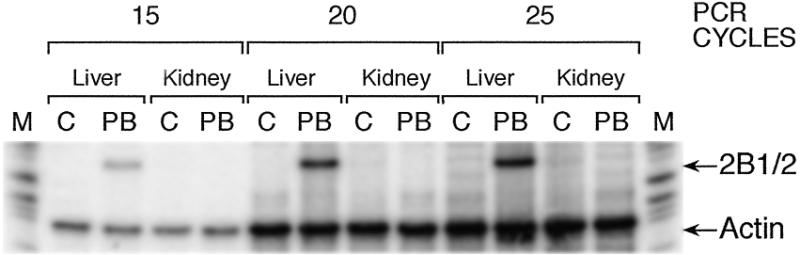
Expression of CYP2B1/2 mRNA in liver and kidney. RNA was isolated from liver or kidney of rats treated with isotonic saline (C) or 100 mg/kg PB for 6 h. After cDNA synthesis by reverse transcription, the cDNA was amplified by PCR with γ-32P-labeled primers for CYP2B1/2 or for β-actin and the products were analyzed by electrophoresis in polyacrylamide gels and detected by autoradiography. The PCRs were for 15, 20 or 25 cycles as indicated. The positions of the expected PCR products for CYP2B1/2 and actin are indicated which are based on molecular size markers (M).
Protein binding and nuclease hypersensitivity patterns in PBRU chromatin are tissue specific
To determine whether protein binding in the transcriptionally silent gene in the kidney is the same as that in the silent gene in untreated liver (13) we have examined protein binding in vitro and in chromatin. In vitro footprints from the liver or kidney were not detectably different (Fig. 2A, lanes 2 and 4) and binding in the NF-1 regions was effectively competed by the addition of oligonucleotides containing a consensus NF-1 site (Fig. 2A, lanes 3 and 5). In contrast to the in vitro footprints, protein binding to chromatin was distinctly different in liver and kidney. As was observed previously (13), a core of protection for DNase I cleavage centered on the NF-1 site was present in liver chromatin from untreated animals (Fig. 2B, lane 2) which was extended in both directions beyond the NR-1 and NR-2 sites which flank the NF-1 site by PB treatment (Fig. 2B, lane 3). In contrast, there was no apparent protection of this region in the kidney chromatin in which the pattern of cleavage was more similar to that of purified DNA than that of liver chromatin, which indicated that regulatory proteins were not bound in this region in kidney (Fig. 2B, lane 1 versus lanes 4 and 5). Differences between the liver and kidney chromatin were also illustrated by several hypersensitive sites (indicated with asterisks) in the liver compared to kidney or purified DNA (Fig. 2B).
Figure 2.
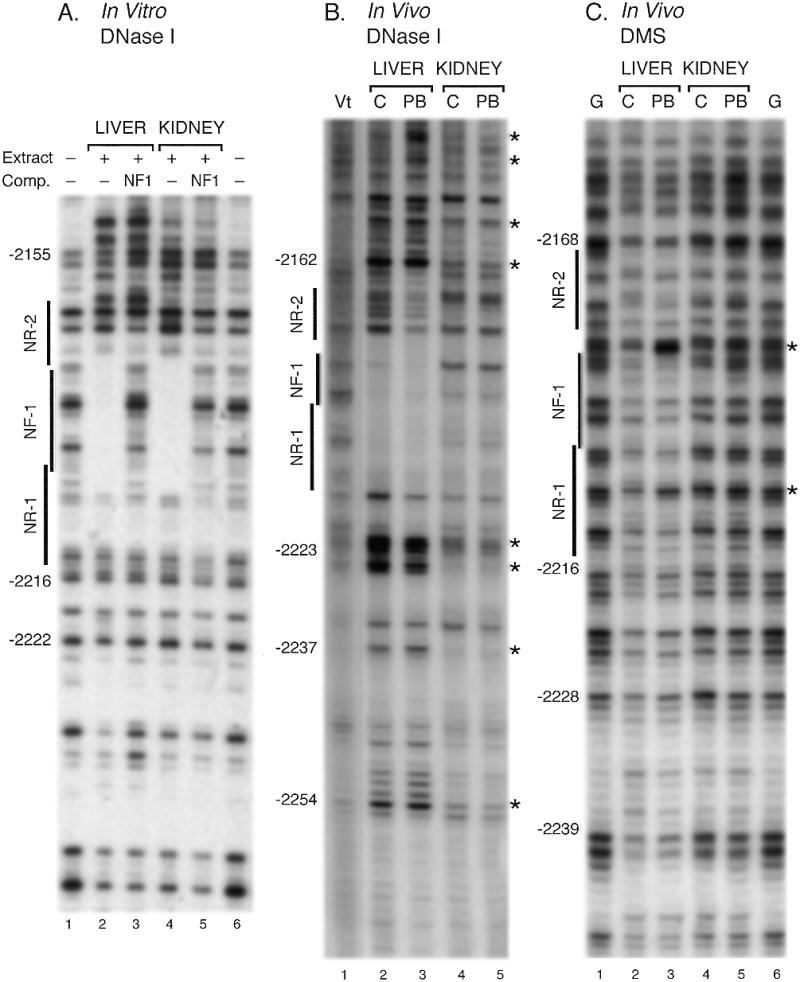
Tissue specificity of protein binding in vitro and in native chromatin to the PBRU region. Autoradiograms of DNA fragments separated by gel electrophoresis are shown. The positions of the NF-1 site and the flanking NR-1 and NR-2 sites, which form the core of the PBRU, are shown. The numbers along the side indicate the position relative to the RNA start site. Positions of hypersensitivity to DNase I or DMS are indicated by asterisks. (A) In vitro DNase I footprinting of the PBRU. DNA fragments containing the PBRU region were incubated with nuclear extracts from liver or kidney, digested with DNase I, and separated by electrophoresis as described (13). As indicated, 100-fold excesses of oligonucleotides containing binding sites for NF-1 were added to the binding reactions. (B) DNase I footprinting of native chromatin. Liver or kidney nuclei were isolated from either untreated (C) rats or rats treated with 100 mg/kg PB for 6 h (PB) and incubated with DNase I as described in Materials and Methods. DNA was isolated and subjected to LMPCR using primers for the sense strand of the PBRU region. Purified DNA treated with DNase I (Vt) or with DMS, followed by piperidine cleavage (G), was also amplified by LMPCR. (C) DMS footprinting of native chromatin. Sample were prepared as those for DNase I footprints except that nuclei were incubated with DMS, and after purification, the DNA was treated with piperidine.
Protection of chromatin DNA from reaction with DMS was also examined (Fig. 2C). In contrast to DNase I studies, weak protection in liver and little protection in kidney chromatin was observed in untreated or PB-treated rats. Increased DMS reactivity was observed at single nucleotides between the NR-2 and NF-1 sites and within the NR-1 site in liver after PB treatment which is consistent with changes in protein binding or chromatin structure (Fig. 2C, asterisks). The decreased protection by DMS in the PBRU region contrasts with protection observed in the proximal promoter region using the same samples of DNA for analysis (see below). Decreased protection against a small molecule like DMS compared to a large protein like DNase I suggests either that the proteins bound to the PBRU region were not tightly associated with the DNA or that non-DNA binding proteins, such as co-activators or co-suppressors, contributed to steric hindrance of DNase I but not of DMS.
The CYP2B1/2 proximal promoter is occupied by proteins in untreated animals
Representative data analyzing protein binding to chromatin in the proximal promoter region are shown in Figure 3. Within the region studied, in vitro DNase I footprints were observed in previous studies at –45 to –64, a C/EBP site, and at –119 to –138, an NF-1 site, and a BTE site from –67 to –82 was shown to be a positive regulatory element by transient transfection studies, but did not exhibit a footprint (15–18). The C/EBP site was partially protected on both strands and PB treatment increased the protection modestly. Protection within the TATA region, primarily in the 3′ portion of the element (Fig. 3B) was observed, most clearly on the sense strand in which this region was best resolved. PB treatment had a modest effect although this effect was more pronounced on the antisense strand in which this region was compressed. A hypersensitive site on the sense strand between the TATA and C/EBP sites at –40 also indicated that proteins bind to one or both these sites and PB treatment increased the cleavage at this site. Weak protection of bands within the BTE site (–67 to –82) was observed on both strands and PB treatment had little effect. Hypersensitivity to the 5′ side of the BTE site was present which was increased substantially by PB. Similarly, weak protection of bands within the NF-1 site (–119 to –138) was observed and hypersensitive sites were present in its 5′ region. Overall, compared to the PBRU region, protection of regulatory sites in the proximal promoter was weaker, except for the C/EBP site, and PB treatment had modest effects on the protection. Hypersensitive sites, also indicative of protein binding, were present and hypersensitivity was increased substantially for some of these sites. Strand specificity in sensitivity to DNase I treatment was observed first with hypersensitivity from –85 and –100 on the antisense strand over a larger region than on the sense strand and secondly with a larger difference in the sensitivity between control and PB-treated samples in the TATA region on the antisense strand compared to the sense strand. Strand-specific cleavages in chromatin have been observed previously. For example, the first 50 nt from the 5′ end of DNA in nucleosomes are more sensitive to DNase I than the 50 nt at the 3′ end resulting in strand-specific cleavage at either end of the DNA wrapped around the nucleosome (26). The reasons for the strand-specific cleavage are not entirely clear, but Tanaka et al. (26) suggested several possibilities: DNA conformation or bending mediated by nucleosome binding; steric occlusion by bound proteins which directs DNase I binding in only one direction; or protein binding that is strand-specific and affects DNase I cleavage of one strand but not the other. Similarly, it is not clear which of these explanations applies to the strand-specific sensitivities observed in the CYP2B1/2 proximal promoter. Common to the explanations, however, is protein binding which underlies protection or conformational change of the DNA and, thus, strand-specific cleavage provides additional evidence for binding of proteins to the proximal promoter region in the liver.
Figure 3.
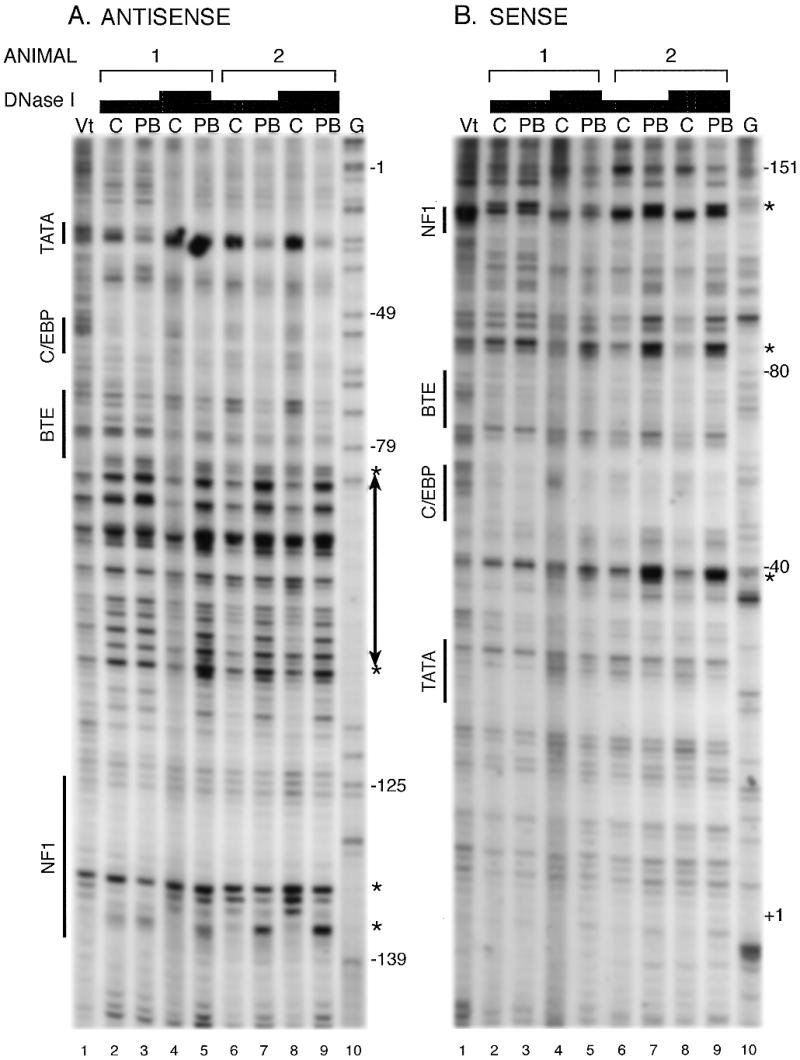
DNase I footprinting in native chromatin of the CYP2B1/2 proximal promoter region. Samples were analyzed as described in the legend to Figure 2 except that primers specific for the proximal promoter region were used in the LMPCR. Results from two sets of animals, with two concentrations for the DNase I treatment, are shown as indicated. The positions of regulatory protein binding motifs are indicated. The numbers along the side refer to the position relative to the RNA start site of CYP2B1 based on the G-ladder. Positions of hypersensitivity to DNase I cleavage are indicated by asterisks.
Protein binding and nuclease hypersensitivity patterns in the proximal promoter are tissue specific
The pattern of protection in the proximal promoter region from DNase I in kidney chromatin was distinctly different from that in liver, with lack of protection in the C/EBP region and the absence of hypersensitive sites 5′ of the NF1 site and between C/EBP and TATA motifs in kidney chromatin (Fig. 4A). The kidney chromatin pattern differed from purified DNA controls (Vt) primarily in having sites more sensitive to cleavage with a spacing of ~10 bp throughout most of the proximal promoter region (Fig. 4A, lanes 5–7), which may reflect a nucleosomal structure (27). Similarly, the pattern of kidney chromatin cleavage after DMS treatment was nearly the same as that observed with purified DNA regardless of PB treatment (Fig. 4B, lanes 4, 5 and 6). Reactivity of guanines with DMS in liver compared to kidney chromatin was decreased in a broad region that included the TATA, C/EBP and BTE regions. The TATA motif, –28 GCATAAAAG –21, is flanked by guanines and in the liver G(–21) is protected from cleavage as are guanines at +4 and +7 (Fig. 4B, lanes 2 and 3). In contrast, A(–23), becomes atypically sensitive to modification and cleavage in both the liver and kidney which, therefore, may be related to chromatin structure. PB treatment, as in the DNase I footprints, only modestly increased the protection from methylation by DMS in the proximal promoter region.
Figure 4.
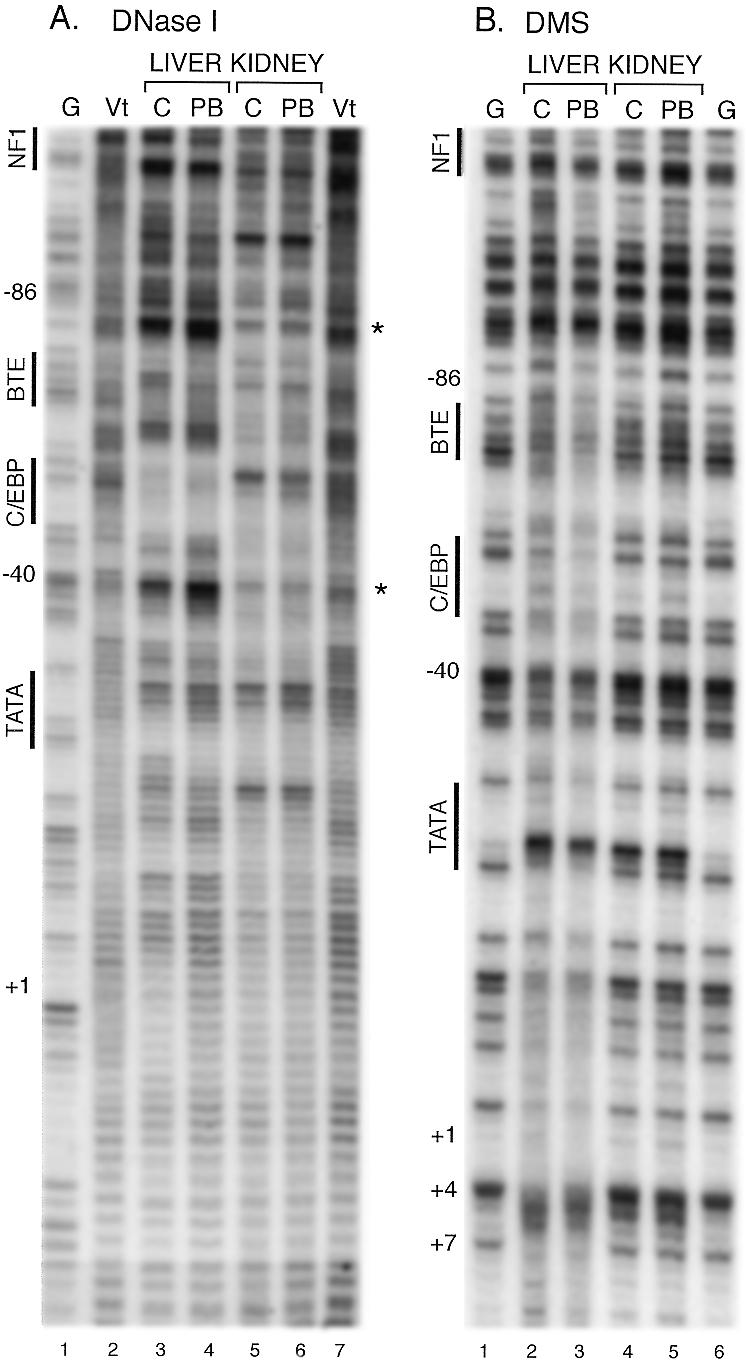
DNase I and DMS footprinting in native chromatin from kidney and liver of the proximal promoter. Samples were analyzed as described in the legend to Figure 2. Nuclei were incubated with either DNase I (A) or DMS (B). Hypersensitive sites are indicated by asterisks.
Nucleosomal structure of the CYP2B1/2 PBRU region
Proteins binding to DNA may alter nucleosomal structure which provides an architectural framework for eukaryotic transcription and contributes one level of regulation of gene expression (27,28). To characterize the nucleosomal structure of the CYP2B1/2 PBRU region, sensitivity to digestion with MNase, which cleaves DNA preferentially at linker regions between nucleosomal cores (29), was analyzed. Electrophoretic analysis of the partial digestion products of increasing amounts of MNase revealed the expected nucleosomal repeat of ~170 bp in bulk genomic DNA (Fig. 5A). The positions of cleavage in the PBRU region were mapped by indirect end-labeling genomic Southern analysis from a HindIII site ~750 bp from the PBRU (Fig. 5C). In the kidney sample, a ladder of bands increasing in size by ~200 bp was observed up to about six nucleosomes (Fig. 5B), with some cleavages between the linker regions suggesting some heterogeneity in the nucleosomal phasing. In the liver, a similar ladder was observed, but the third linker was hypersensitive to MNase and PB treatment increased the sensitivity. The third linker region from the HindIII site maps to the 3′ side of the PBRU region. The nucleosomal phasing in the PBRU region, however, appears to be largely intact since the hypersensitivity was mainly restricted to the linker region and faint bands above the hypersensitive band corresponded to the nucleosomal ladder. These results suggest that the gross nucleosomal structure in the PBRU region was retained but that the structure of the nucleosome core, or the linker region, was perturbed so that the linker was much more accessible to MNase.
Figure 5.
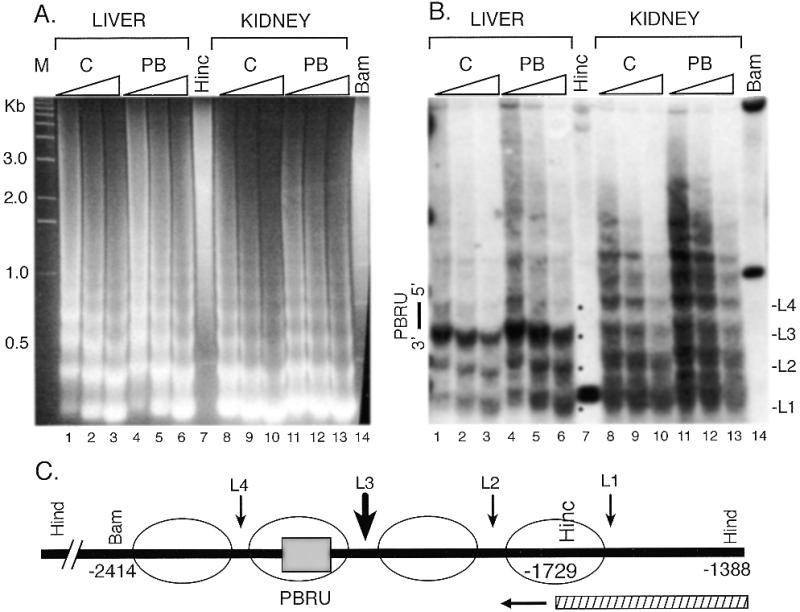
Low resolution analysis of MNase digested chromatin from liver and kidney for the PBRU. Nuclei were treated with varying concentrations of MNase indicated by the triangles in (A) and (B), DNA was purified, digested with HindIII, and separated by electrophoresis in a 1.5% agarose gel. The gel was stained with ethidium bromide (A) or transferred to a nylon membrane and probed by hybridization to a HincII/HindIII fragment followed by autoradiography (B). Genomic DNA digested with HindIII and either BamHI (Bam) or HincII (Hinc) and a 1 kb ladder (M) were used as markers. The black dots indicate the areas of cleavage by MNase in the liver samples corresponding to linker regions (L1–L4, on right). In (C), a schematic diagram of the PBRU region is shown with the positions of the PBRU (shaded box), the restriction sites used, and the probe (stripped bar) indicated. The circles indicate the approximate positions of nucleosomes in the PBRU and L1–L4 indicate the positions of linkers based on sensitivity to MNase cleavage.
Nucleosomal structure of the CYP2B1/2 proximal promoter region
The nucleosomal structure of the proximal promoter region of CYP2B1/2 was also examined by MNase digestion of isolated nuclei followed by indirect end-labeling genomic Southern analysis. The expected nucleosomal ladder was observed in bulk DNA with similar digestion patterns for both the liver and kidney samples (Fig. 6A). The proximal promoter region was analyzed by indirect end-labeling Southern analysis from a BamHI site 791 bp to the 5′ of the RNA initiation site. In contrast to the PBRU region, nucleosomal structure was less well defined in the proximal promoter region. In the kidney, some selective cleavage at intervals of ~170 bp (L1–L3, Fig. 6B) could be discerned, but there was considerable cleavage between the expected linkers. In the liver, selective cleavage at similar intervals also could be discerned (L1–L4) but the periodicity was not as regular or pronounced as in the PBRU region. The most remarkable result was the increased sensitivity to MNase in the region 5′ of the TATA site in the untreated liver compared to kidney and the increase in sensitivity in the liver after PB treatment. This increased sensitivity was also observed in the region –1 to –180 by high resolution LMPCR analysis of the proximal promoter region (data not shown). The increased sensitivity indicates that the nucleosomal structure in this region is disturbed in the liver and PB treatment enhances the disruption.
Figure 6.
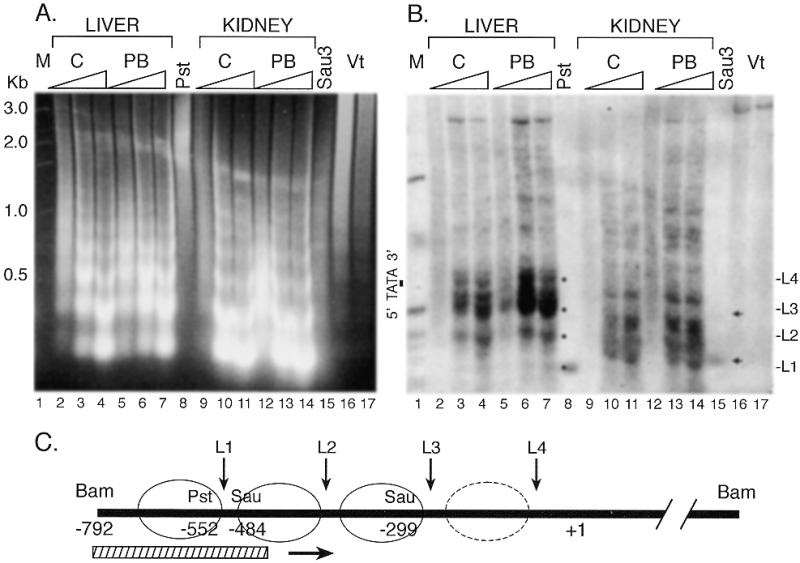
Low resolution analysis of MNase digested chromatin from liver and kidney for the proximal promoter. Nuclei were treated with varying concentrations of MNase indicated by the triangles in (A) and (B), DNA was purified, digested with BamHI and separated by electrophoresis in a 1.5% agarose gel. The gel was stained with ethidium bromide (A) or transferred to a nylon membrane and probed by hybridization to a BamHI/PstI fragment followed by autoradiography (B). A 1 kb ladder (M) and genomic DNA digested with BamHI and either PstI (Pst) or Sau3AI (Sau3) were used as markers. The position of the TATA sequence is shown in (B). The small arrowheads within the autoradiogram in (B) indicate the positions of fragments generated by a partial Sau3A digestion which could be detected in longer exposures than shown. The black dots indicate the areas of cleavage by MNase in the liver samples corresponding to linker regions (L1–L4, on the right). In (C), a schematic diagram of the proximal promoter region is shown with the positions of the restriction sites used, and the probe (stripped bar) indicated. The circles indicate the approximate position of nucleosomes in the promoter region and L1–L4 indicate the positions of linkers based on sensitivity to MNase cleavage. The circle with a dashed line represents the region hypersensitive to MNase in the liver presumably as a result of disruption of this nucleosome.
DISCUSSION
Functional analyses by transient transfections and protein binding studies in vitro have led to a plausible model by which PB treatment induces the transcription of CYP2B genes. Increased binding of an RXR/CAR heterodimer to the NR-1 site in the human and mouse genes and to the NR-2 site in the human gene after PB treatment have been demonstrated (14) and expression of CAR activates cotransfected CYP2B6 and Cyp2b10 promoter-reporter genes as well as the endogenous CYP2B6 in human HepG2 cells (30). Treatment with PB causes a redistribution of CAR from the cytoplasm to nucleus in hepatic cells (31). Other sites may bind accessory factors which contribute to maximum transcriptional response (9–11,32), but are not directly PB-responsive, including an NF-1 site between the NR1 and NR2 sites and possibly an unknown factor that binds to the 3′ side of the NR2 site. Regulatory sites within the proximal promoter also appear to play only an accessory role in contributing to the maximum PB response (8,10). This work leads to a model in which PB treatment results in translocation of CAR to the nucleus, binding of CAR/RXR to the NR1 and NR2 sites, and recruitment or activation of accessory regulatory proteins bound to the PBRU and proximal promoter which leads to initiation of transcription. In vitro studies do not always accurately reflect the expression of genes in vivo, but our studies, presented previously (13) and in this study on native chromatin, provide important supporting evidence for this model. In the untreated liver, a core of protection from DNase I treatment in the NF-1 region is observed and after treatment with PB, this protected region expands to the flanking regions as would be expected if CAR/RXR, and their presumed co-regulators, bind to the NR-1 and NR-2 sites. Binding of proteins to the proximal promoter region chromatin, in contrast, is not greatly affected by PB which is consistent with a role for regulatory proteins in this region as accessory factors not directly affected by PB treatment. The presence of proteins binding to the PBRU and proximal promoter region in the untreated animals further suggests that the effect of CAR/RXR binding is to activate the pre-bound factors by alterations in chromatin structure or some other mechanism.
PB treatment has substantial effects on the nucleosomal and chromatin structure of CYP2B1/2. Low resolution mapping of DNase I sensitivity indicated hypersensitivity in the PBRU region in both untreated and PB-treated animals (15). This result is consistent with the observation that proteins are bound to the PBRU chromatin even in untreated animals. Low resolution mapping with MNase has revealed a hypersensitive region corresponding to that of DNase I in the PBRU region (15). In the PBRU, nucleosomes are relatively well phased based on the MNase cleavage pattern and hypersensitivity in a linker region to the 3′ side of the PBRU is increased by PB treatment. This result indicates that chromatin structure, already disturbed in the untreated animal, may be further perturbed by PB treatment which increases access to the linker region without disrupting the basic nucleosomal structure. In the proximal promoter region, an MNase hypersensitive region is observed at approximately the same position as that observed for DNase I (15). Nucleosomes in the proximal promoter region appear to be less well phased than in the PBRU based on MNase digestion, but again hypersensitivity present in the untreated animal is substantially increased after PB treatment and extends over ~200 bp. This indicates that the nucleosomal structure is perturbed in the untreated animal and is further disrupted after phenobarbital treatment. Nucleosomal disruption is consistent with DNase I hypersensitivity in the proximal promoter region which is increased after PB treatment in contrast to the PBRU region (15). These results suggest that binding of CAR/RXR to the PBRU is accompanied by a loosening of the chromatin structure in the PBRU and that chromatin changes are induced in the proximal promoter region which further disrupt nucleosomal structure. Such changes are likely mediated by co-activators of CAR/RXR with histone modifying activities which affect chromatin structure and activate transcription (33), such as steroid receptor coactivator-1 which has been shown to interact with CARβ (34).
CYP2B1/2 are transcriptionally silent in the liver in untreated animals and in the kidney even after PB treatment, but the mechanism for the suppression is distinctly different. In the untreated liver, chromatin structure in the PBRU and proximal promoter is perturbed based on sensitivity to DNase I and MNase, and proteins are bound to regulatory motifs. The suppression of CYP2B1/2 in the liver must either be due to binding of proteins with negative transcriptional activity to DNA or, more likely, to the presence of co-repressors, or lack of co-activators, so that the chromatin is maintained in an inactive state for transcription. In contrast, protein binding to the regulatory motifs in the PBRU and proximal promoter was not detected in kidney chromatin, even though binding of proteins in vitro was not detectably different in liver and kidney. Hypersensitivity to DNase I and MNase was also not observed in kidney chromatin. Suppression of CYP2B1/2 transcription in the kidney, therefore, probably results from a closed inactive chromatin structure. During or after differentiation of hepatic tissue, hepatic-specific factors presumably alter the chromatin conformation in liver to an open, potentially inducible form. The basis of the altered chromatin structure is not known but there are several possible mechanisms. Hepatic-specific proteins might bind to motifs in the proximal promoter region and disrupt nucleosomal binding, or proteins which bind to the PBRU or proximal promoter might alter nucleosomal structure by catalyzing acetylation or phosphorylation of histones in the nucleosome or methylation of DNA (33,35,36). Alternatively, induction may require hepatic-specific factors and the perturbed chromatin structure observed may reflect a ‘memory’ effect that is retained after an earlier induction episode. Such memory has been shown by altered kinetics of secondary induction compared to primary induction of the vitellogenin gene by estrogen (37) and the altered chromatin conformation may be analogous to altered forms of nucleosomes that persist after remodeling in vitro (38,39).
Acknowledgments
ACKNOWLEDGEMENTS
We greatly appreciate technical suggestions and helpful discussion by Dr Steve Okino (Stanford University). This work was supported by grant GM39360 from the National Institutes of Health.
REFERENCES
- 1.Gonzalez F.J. (1990) Pharmac. Ther., 45, 1–38. [DOI] [PubMed] [Google Scholar]
- 2.Nelson D.R., Kamataki,T., Waxman,D.J., Guengerich,F.P., Estabrook,R.W., Feyereisen,R., Gonzalez,F.J., Coon,M.J., Gunsalus,I.C., Gotoh,O., Okuda,K. and Nebert,D.W. (1996) Pharmacogenetics, 6, 1–42. [DOI] [PubMed] [Google Scholar]
- 3.Kemper B. (1993) In Ruckpaul,K. and Rein,H. (eds), Frontiers in Biotransformation, Vol. 8. Akkademie Verlag, Berlin, pp. 1–58.
- 4.Waxman D.J. and Azaroff,L. (1992) Biochem. J., 281, 577–592. [DOI] [PMC free article] [PubMed] [Google Scholar]
- 5.Suwa Y., Mizukami,Y., Sogawa,K. and Fujii-Kuriyama,Y. (1985) J. Biol. Chem., 260, 7980–7984. [PubMed] [Google Scholar]
- 6.Omiecinski C.J. (1986) Nucleic Acids Res., 14, 1525–1539. [DOI] [PMC free article] [PubMed] [Google Scholar]
- 7.Trottier E., Belzil,A., Stoltz,C. and Anderson,A. (1995) Gene, 158, 263–268. [DOI] [PubMed] [Google Scholar]
- 8.Park Y., Li,H. and Kemper,B. (1996) J. Biol. Chem., 271, 23725–23728. [DOI] [PubMed] [Google Scholar]
- 9.Honkakoski P. and Negishi,M. (1997) J. Biol. Chem., 272, 14943–14949. [DOI] [PubMed] [Google Scholar]
- 10.Stoltz C., Vachon,M.-H., Trottier,E., Dubois,S., Paquet,Y. and Anderson,A. (1998) J. Biol. Chem., 273, 8528–8536. [DOI] [PubMed] [Google Scholar]
- 11.Liu S., Park,Y., Rivera-Rivera,I., Li,H. and Kemper,B. (1998) DNA Cell Biol., 17, 461–470. [DOI] [PubMed] [Google Scholar]
- 12.Honkakoski P., Moore,R., Washburn,K.A. and Negishi,M. (1998) Mol. Pharmacol., 53, 597–601. [DOI] [PubMed] [Google Scholar]
- 13.Kim J. and Kemper,B. (1997) J. Biol. Chem., 272, 29423–29426. [DOI] [PubMed] [Google Scholar]
- 14.Honkakoski P., Zelko,I., Sueyoshi,T. and Negishi,M. (1998) Mol. Cell. Biol., 18, 5652–5658. [DOI] [PMC free article] [PubMed] [Google Scholar]
- 15.Luc P.-V., Adesnik,M., Ganguly,S. and Shaw,P.M. (1996) Biochem. Pharm., 51, 345–356. [DOI] [PubMed] [Google Scholar]
- 16.Park Y. and Kemper,B. (1996) DNA Cell Biol., 15, 693–701. [DOI] [PubMed] [Google Scholar]
- 17.Shephard E.A., Forrest,L.A., Shervington,A., Fernandez,L.M., Ciaramella,G. and Phillips,I.R. (1994) DNA Cell Biol., 13, 793–804. [DOI] [PubMed] [Google Scholar]
- 18.Sommer K.M., Ramsden,R., Sidhu,J., Costa,P. and Omiecinski,C.J. (1996) Pharmacogenetics, 6, 369–374. [DOI] [PubMed] [Google Scholar]
- 19.Hardwick J.P., Gonzalez,F.J. and Kasper,C.B. (1983) J. Biol. Chem., 258, 8081–8085. [PubMed] [Google Scholar]
- 20.Coen D.M. (1995) In Ausubel,F.M., Brent,R., Kingston,R.E., Moore,D.D., Seidman,J.G., Smith,J.A. and Struhl,K. (eds), Current Protocols in Molecular Biology. Wiley Interscience, Boston, pp. 15.0.1–15.8.8.
- 21.Hoffmann M., Mager,W.H., Scholte,B.J., Civil,A. and Planta,R.J. (1992) Gene Exp., 2, 353–363. [PMC free article] [PubMed] [Google Scholar]
- 22.Jaiswal A.K., Rivkin,E. and Adesnik,M. (1987) Nucleic Acids Res., 15, 6755. [DOI] [PMC free article] [PubMed] [Google Scholar]
- 23.Kim J. and Kemper,B. (1991) Biochemistry, 30, 10287–10294. [DOI] [PubMed] [Google Scholar]
- 24.Boyes J. and Felsenfeld,G. (1996) EMBO J., 15, 2496–2507. [PMC free article] [PubMed] [Google Scholar]
- 25.Okino S.T. and Whitlock,J.P.,Jr (1995) Mol. Cell. Biol., 15, 3714–3721. [DOI] [PMC free article] [PubMed] [Google Scholar]
- 26.Wolffe A.P. and Kurumizaka,H. (1998) Prog. Nucleic Acid Res. Mol. Biol., 61, 379–423. [DOI] [PubMed] [Google Scholar]
- 27.Wallrath L.L., Lu,Q., Granok,H. and Elgin,S.C.R. (1994) Bioessays, 16, 165–170. [DOI] [PubMed] [Google Scholar]
- 28.Kornberg R.D., LaPointe,J.W. and Lorch,Y. (1989) Methods Enzymol., 170, 3–14. [DOI] [PubMed] [Google Scholar]
- 29.Sueyoshi T., Kawamoto,T., Zelko,I., Honkakoski,P. and Negishi,M. (1999) J. Biol. Chem., 274, 6043–6046. [DOI] [PubMed] [Google Scholar]
- 30.Kawamoto T., Sueyoshi,T., Zelko,I., Moore,R., Washburn,K. and Negishi,M. (1999) Mol. Cell. Biol., 19, 6318–6322. [DOI] [PMC free article] [PubMed] [Google Scholar]
- 31.Ramsden R., Beck,N.B., Sommer,K.M. and Omiecinski,C. (1999) Gene, 228, 169–179. [DOI] [PubMed] [Google Scholar]
- 32.Tanaka S., Lovingstone-Zatchej,M. and Thoma,F. (1996) J. Mol. Biol., 257, 919–934. [DOI] [PubMed] [Google Scholar]
- 33.Kadonaga J. (1998) Cell, 92, 307–315. [DOI] [PubMed] [Google Scholar]
- 34.Forman B.M., Tzameli,I., Choi,H.-S., Chen,J., Simha,D., Seol,W., Evans,R.M. and Moore,D.D. (1998) Nature (Lond.), 395, 612–615. [DOI] [PubMed] [Google Scholar]
- 35.Spencer V.A. and Davie,J.R. (1999) Gene, 240, 1–12. [DOI] [PubMed] [Google Scholar]
- 36.Dou Y., Mizzen,C.A., Abrams,M., Allis,C.D. and Gorovsky,M.A. (1999) Mol. Cell., 4, 641–647. [DOI] [PubMed] [Google Scholar]
- 37.Baker H.J. and Shapiro,D.J. (1978) J. Biol. Chem., 253, 4521–4524. [PubMed] [Google Scholar]
- 38.Lorch Y., Cairns,B.R., Zhang,M. and Kornberg,R.D. (1998) Cell, 94, 29–34. [DOI] [PubMed] [Google Scholar]
- 39.Schnitzler G., Sif,S. and Kingston,R.E. (1998) Cell, 94, 17–27. [DOI] [PubMed] [Google Scholar]