Abstract
Gene networks have yielded numerous neurobiological insights, yet an integrated view across brain regions is lacking. We leverage RNA-sequencing in 864 samples representing 12 brain regions to robustly identify 12 brain-wide, 50 cross-regional and 114 region-specific co-expression modules. Nearly 40% of genes fall into brain-wide modules, while 25% comprise region-specific modules reflecting regional biology, such as oxytocin signaling in the hypothalamus, or addiction pathways in the nucleus accumbens. Schizophrenia and autism genetic risk is enriched in brain-wide and multi-regional modules, indicative of broad impact; these modules implicate neuronal proliferation and activity-dependent processes, including endocytosis and splicing in disease pathophysiology. We find that cell-type-specific lncRNA and gene isoforms contribute substantially to regional synaptic diversity and that constrained, mutation intolerant genes are primarily enriched in neurons. We leverage these data using an omnigenic-inspired network framework to characterize how co-expression and gene regulatory networks reflect neuropsychiatric disease risk, supporting polygenic models.
Introduction
Neuropsychiatric diseases are genetically complex, adhering to a polygenic architecture consisting of thousands of risk-conferring variants and genes.1 In contrast to Mendelian disorders – where generalizable mechanistic insight can be obtained from the analysis of a single gene – the etiology of complex genetic disorders is organized around functional groups of genes, or pathways.1 Genes within these groups are expected to be co-regulated and expressed at levels that permit the pathway to function.2,3 RNA co-expression and protein-protein interaction (PPI) networks provide a powerful conceptual framework for understanding how such groups of genes are organized, with predictive power to prioritize disease-associated variation in polygenic disorders.4,5,6 This framework aids in characterizing relevant biological pathways by arranging genes into smaller, tractable and coherent sets of modules for experimental analysis. Additionally, gene co-expression networks can further our understanding of complex, polygenic disorders by linking together genes that co-vary across prevalent cell types and cell states within the tissue of interest.7,8
To inform our understanding of molecular mechanisms in human brain, and their disease relevance, we create an atlas of co-expression networks across 12 human brain regions from GTEx.9 We compare different network construction methods and demonstrate that the co-expression relationships defined in these networks are robustly identified using multiple methods and orthogonal brain data sets. These networks comprise a new resource for understanding convergent pathways and brain regions affected by disease-associated variation in adult brain. We use this resource to address several biological questions. We show that co-expression is hierarchically organized into signatures ranging from those that are brain-wide, to those that are multi-region and region-specific. For both ASD and SCZ, three major types of genetic or genomic signals – differential expression, rare high-impact variants, and common low-effect variants – converge on cross-regional networks that implicate neuronal and neural progenitor cell types. Lastly, we incorporate our networks into a model of genetic architecture, asking whether these networks exhibit a core-periphery structure that follows the recently-framed omnigenic hypothesis.10 We provide a web browser, HUBgene, to facilitate access to these data.
Results
Building robust human co-expression networks
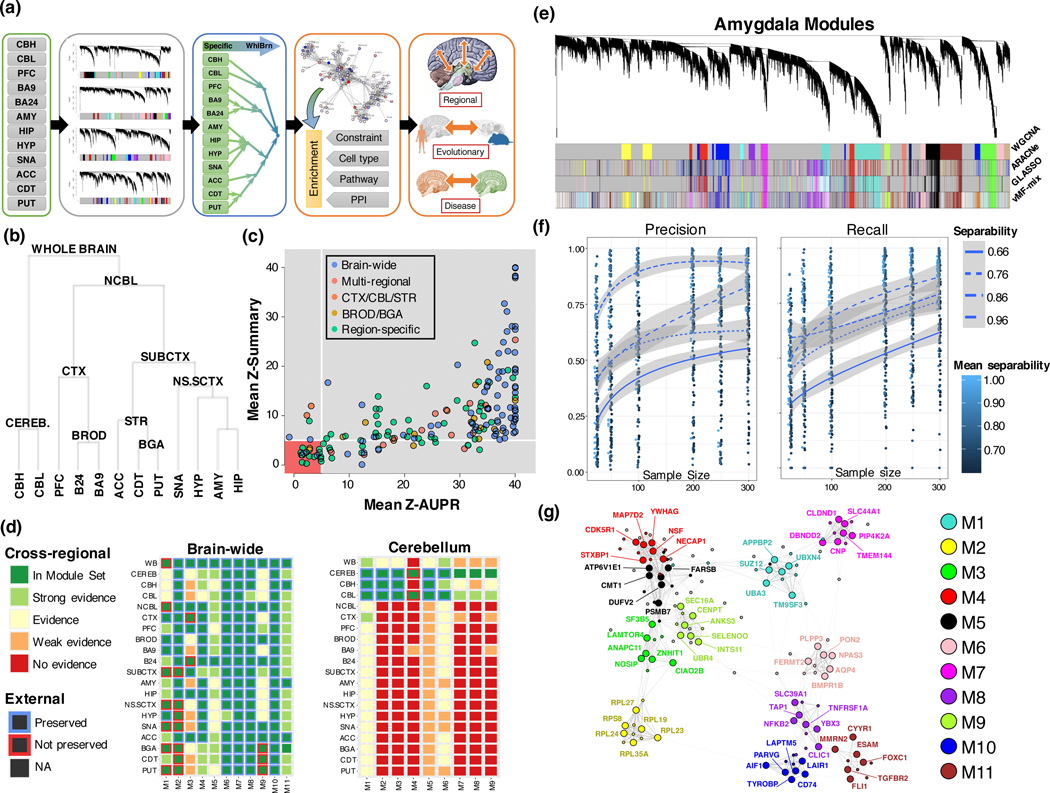
To explore the molecular anatomy of the human brain, we utilized RNA-sequencing data from the Genotype-Tissue Expression Consortium (GTEx v7), focusing on the 12 major brain regions profiled: Cerebellum (CBL), cerebellar hemisphere (CBH), dorso-lateral pre-frontal cortex (PFC), Brodman area 9 (BA9), Brodman area 24 (BA24), hippocampus (HIP), amygdala (AMY), hypothalamus (HYP), substantia nigra (SNA), nucleus accumbens (ACC), caudate nucleus (CDT), and putamen (PUT) (figure 1a). Using a tissue hierarchy to structure consensus co-expression (figure 1b, Methods), we used robust WGCNA to create 311 co-expression modules for 20 hierarchical expression categories: 12 brain region specific categories (corresponding to each sampled region), 7 multi-regional categories (corresponding to multiple, structurally-linked regions, figure 1b), and a brain-wide category, correcting for known technical factors (Extended Data Fig. 1), sample outliers, and brains impacted by inflammation at time of death (Methods). We found that 87% (173/199) of the region-level modules were highly preserved in independent datasets (figure 1c, Supplementary Note) and that region-specific networks showed low preservation in other brain regions (figure 1d). To further demonstrate the robustness of co-expression relationships to methodological factors, we show that modules were robust to multiple alternative network methods (figure 1e), and aggregation methods (figure S1, Supplementary Note). By down-sampling our dataset, we establish that we have power to identify all module hub genes (Extended Data Fig. 1), and that the co-membership of gene pairs is identified with reasonable accuracy (figure 1f,g).
Figure 1:
Human whole-brain co-expression atlas. (a) Overview of module construction, annotation and downstream analysis (b) Hierarchical merging hierarchy based on median within-region expression (c) Module preservation in external datasets, with the area containing weakly and not-preserved modules highlighted in red () (d) Module evidence across all regions of the human brain, for brain-wide and cerebellar module sets. Strong evidence: , Evidence: , Weak evidence , No evidence . (e) Dendrogram from rWGCNA in amygdala, showing high degree of overlap between four methods of network construction and module identification. Colors under the dendrogram are default WGCNA colors, ordered by module size. (f) Precision and recall of co-clustering a gene with the hub gene of its true module, as a function of module separability and sample size. Lines: mean, bands: 95% CI. (g) Example hub gene network of whole-brain modules. The top 6 hub genes by module kME are extracted (large circles, labeled) along with 80 randomly-selected genes to inform the embedding (small circles, unlabeled). The edges are the topological overlap, and the network is embedded using the Fruchterman-Reingold algorithm.
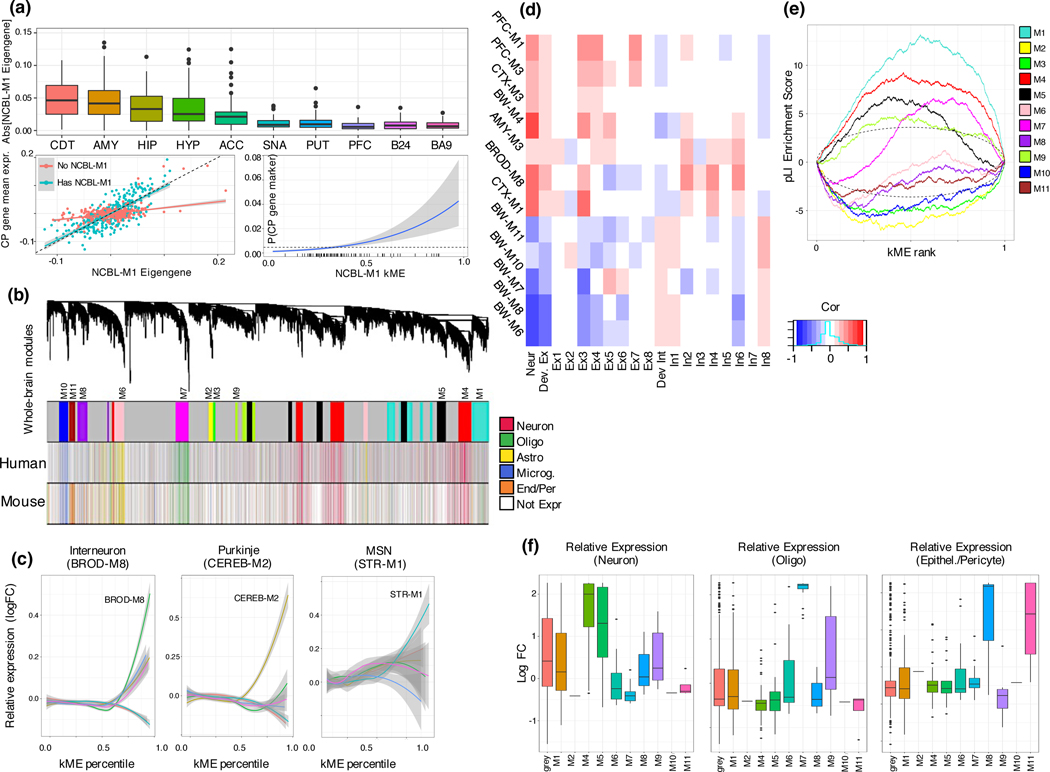
We summarize our analyses at the whole-brain, multi-regional, and region-specific levels, structuring our analysis in terms of 48 module sets, based on merging modules – within the tissue hierarchy – by their similarity (Methods; table S1). As expected, the most physiologically distinct regions, HYP, CBL, and SNA show the largest number of region-specific modules (figure 1d). We were also able to identify modules representing components shared between specific regions, such as ependymal and choroid epithelial cells comprising the choroid plexus, which is juxtaposed in striatum and parts of the telencephalon, providing evidence that our modules reflect the biologically correct placement of this cell-type module (CP - figure 2a).
Figure 2:
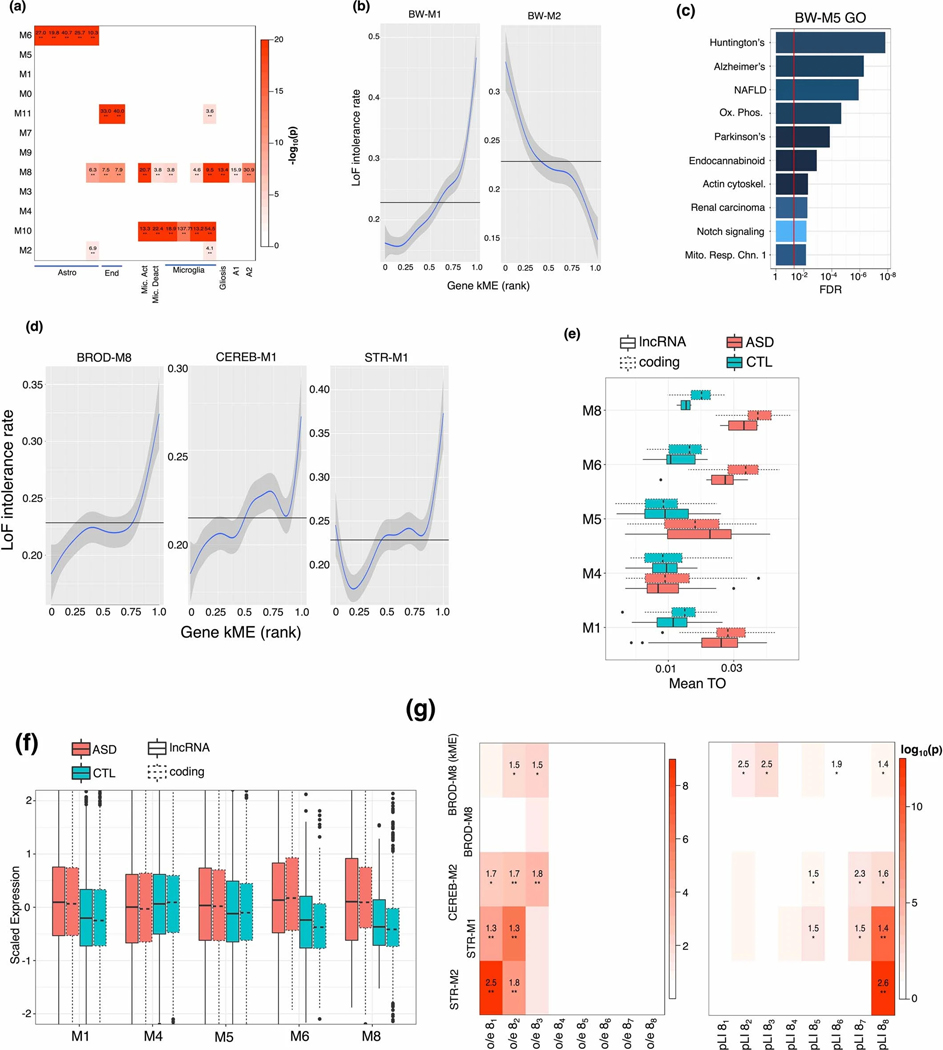
Cell-type heterogeneity relates to co-expression modules, mutation intolerance, and evolution. (a) top: Standard boxplot (box: quartiles, whiskers: 1.5xIQR) of absolute value of the eigengene of module NCBL.M1 plotted across regions, showing higher variance in regions adjacent to or accessible through ventricles. Region sample sizes as specified in main text. left: Relationship between NCBL.M1 eigengene and mean expression of choroid-plexus marker genes in regions with and without an NCBL-M1 module (solid: least-squares fit, band: 95% CI). Right: Marginal probability (via logistic regression) of a gene being a choroid plexus marker, as a function of NCBL-M1 soft membership. (b) Brain-wide modules largely correspond to cell class. WGCNA dendrogram at the whole-brain level, labeled by module, and colored by human cell type markers, and mouse cell type markers (key: right) (c) Relative expression (y-axis, Methods) of neuronal marker genes for modules BW-M4, BROD-M8, CEREB-M2, and STR-M1 within interneurons from cortical single-cell sequencing, Purkinje neurons from cerebellar single-cell sequencing, and medium spiny neurons from mouse striatal single-cell sequencing, as a function of module kME (x-axis, Methods). (d) GSEA enrichment plots for LoF-intolerant genes16 (pLI > 0.9) for all whole-brain modules. (e) Factorization-based decomposition of bulk expression from aggregated cortical single-cell sequencing (Methods) Pearson correlations between module eigengenes and cell type factors for BW, CTX, and PFC modules come from decomposition of DLPFC expression; AMY from decomposition of AMY bulk expression, and BROD from decomposition of B24 bulk expression (Methods), blue negatively correlated and red positively correlated. (f) Standard boxplot (box: quartiles, whiskers: 1.5xIQR) of lncRNA relative expression in single-cell data, grouped by the imputed module in RNAseq data from BA9. Overlapping module sizes (number of lncRNA): grey (518), M1 (116), M2 (1), M4 (68), M5 (46), M6 (16), M7 (17), M8 (4), M9 (13), M10 (1), M11 (4).
Module sets reflect brain cell types and processes
Previous work has shown that cellular composition is a major driver of gene expression in tissue.11,12 We therefore expect whole-brain co-expression modules to represent major cell classes, and multi-regional or regional modules to represent more specialized cell subtypes. We find that five of 11 whole-brain modules (M4, M6, M7, M10, M11) represent the 5 canonical brain cell classes (figure 2b; table S2; Methods), and two additional modules (M1, M8) reflect neuronal differentiation and glial activation (both microglia and astrocyte), respectively (Extended Data Fig. 2). The most significantly cell-type-enriched module, BW-M1, enriches for markers of neural progenitor cells, neuronal migration, and differentiation, and is most preserved in neurogenic regions, suggesting that it corresponds to adult neural progenitor cells (NPCs). BW-M5, another neuronal module, enriches for neurodegenerative disease pathways (Extended Data Fig. 2). Modules in the nucleus accumbens enrich for morphine addiction and alcoholism terms (table S2; Supplementary Note), and the region-specific module BRNHYP-M7 enriches for the oxytocin signaling pathway, meeting prior expectations. Thus, we hypothesized that region-specific modules may reflect region-specific biology, such as unique cellular subtypes. We use single cell data to confirm (Supplementary Note) that the region-specific modules BROD-M8, CEREB-M1, and STR-M2 correspond to regional cell classes: cortical interneurons, Purkinje cells, and medium spiny neurons, respectively (figure 2c; table S2). We identify three region-specific excitatory neuron modules (CTX-M3, PFC-M1, PFC-M3), and an inhibitory neuronal module (figure 2e): BROD-M8 (neuropeptide signaling, perception of pain), while PFC-M1 (serine/threonine kinase activity) and PFC-M3 (circadian rhythm) both enrich for a specific excitatory cell-type (table S3).
Signatures of mutational intolerance
Brain expressed genes are under higher levels of purifying selection than average13 and genes intolerant to loss-of-function (LoF) mutations are expressed disproportionately in brain.14,15 But, whether mutation intolerance is a general feature of brain expressed genes is not known, so we explored the relationship of mutation intolerance to specific cell types. Across all modules, the whole brain module BW-M1 is the most significantly enriched for LoF intolerant genes (defined as pLI16 > 0.9), followed by BW-M4 and closely related BW-M5 (figure 2d, Extended Data Fig. 2), all of which are neuronal. Several of the regional or cell type specific modules such as BROD-M8, CEREB-M2, STR-M1, were also enriched in LoF intolerant genes. Notably only one glial module, BW-M7 (oligodendrocytes) enriches for LoF-intolerant genes, but its degree of enrichment is lower than that of neurons (table S4). The concentration of LoF-intolerance within neuronal modules suggests that genetic disruption of microglia and astrocyte enriched genes is buffered.
Identifying cell-type-specific lncRNA
Long non-coding RNA (lncRNA) are diverse species that play roles in neurodevelopment and neuropsychiatric disease, yet only 52 known lncRNA species were quantified in the initial GTEx analysis.9 We use Gradient Boosted Trees to learn module signatures (Methods), assigning 286 lncRNA, the majority of which associate with neuronal module BW-M4 (66) or the NPC module BW-M1 (109) (Table S5). Notably, more than 20% (61/286) of our cell-type specific lncRNAs were previously shown to be dysregulated in neuropsychiatric disease, augmenting previous work on differential expression of lncRNA in ASD (Table S5).17
Identifying cell-type-specific gene isoforms
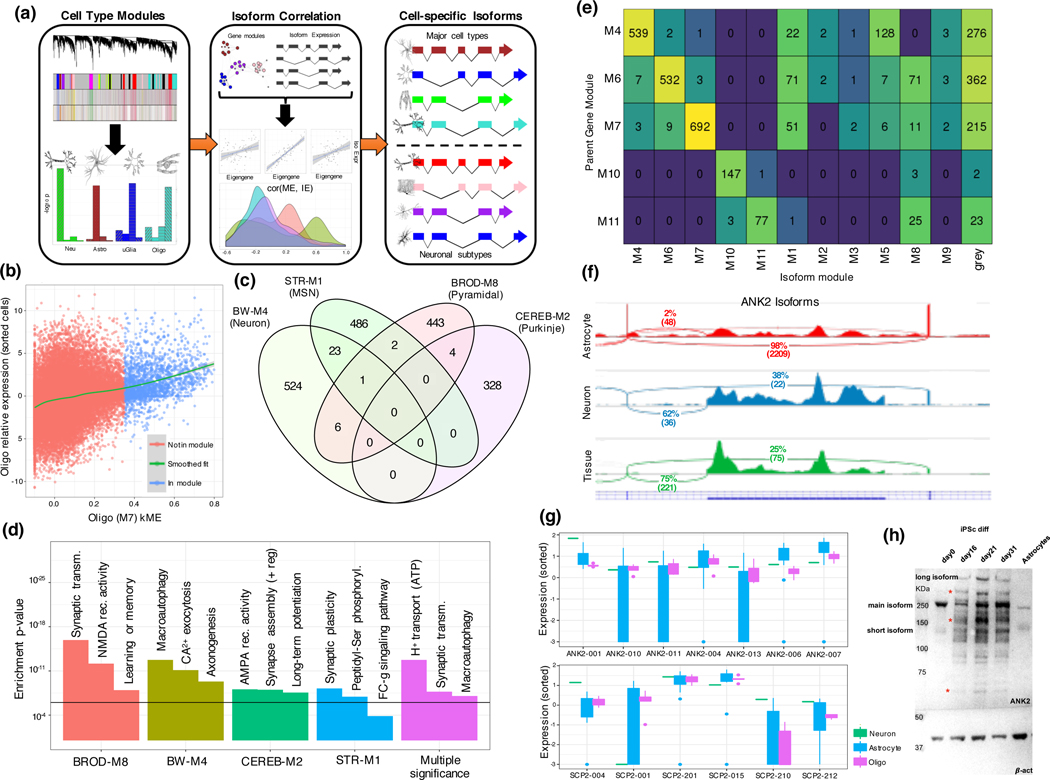
We next integrate isoform-level expression with cell type modules (figure 3a; Methods), identifying 1,987 isoforms showing specificity to major cell types, of which 549 are neuronal, 543 astrocytic, and 696 oligodendroglial (table S6). We validate a subset of these findings in sorted cells, quantified at the isoform-level (Supplementary Note; figure 3b) and build cell-specific isoform maps for D1/D2 medium spiny neurons, Purkinje cells, basket cells, and inhibitory neurons - cells for which we have strong enrichments and region-specific modules (figure 3c, table S6). All modules enrich for synapse-related functions, indicating that splicing plays a major role in regional cell type synapse diversity (figure 3d).
Figure 3:
Creating a catalogue of cell-specific isoforms (a) Overview of isoform assignment on the basis of kME to cell-type modules. Isoforms are correlated with module eigengenes to identify cell type specific isoforms. (b) Isoform relative expression (log-FC of TPM) in oligodendrocytes plotted against isoform kME to BW-M7 showing significant positive relationship (, linear regression LRT, two-sided). (c) Venn diagram of isoforms assigned to neuronal subtypes showing extremely high specificity (d) GO enrichment of parent genes of cell subtype-specific isoforms identifies cell type specific pathways. Top module-specific terms are shown, followed by terms that are significant across multiple subtypes (min p-value shown). (e) Assignment of daughter isoforms of genes with membership to a whole-brain cell type module, showing that most daughter isoforms are either assigned to the parent gene module, or to the grey (un-clustered) module. (f) IGV visualization of the event differentiating the astrocyte and neuron isoforms of ANK2, the inclusion of the giant exon, in sorted cell data. (g) Standard boxplot (box: quartiles, whiskers: 1.5xIQR) of expression of ANK2 and SCP2 transcripts in sorted-cell data, showing isoform switching between neurons and astrocytes. (h) Western blot of ANK2 across iPSC differentiation into neurons (first 4 columns), and within astrocytes (column 5), demonstrating the presence of two long isoforms specific to neurons (red asterisk).
A subset of ASD risk genes switch isoforms across cell types
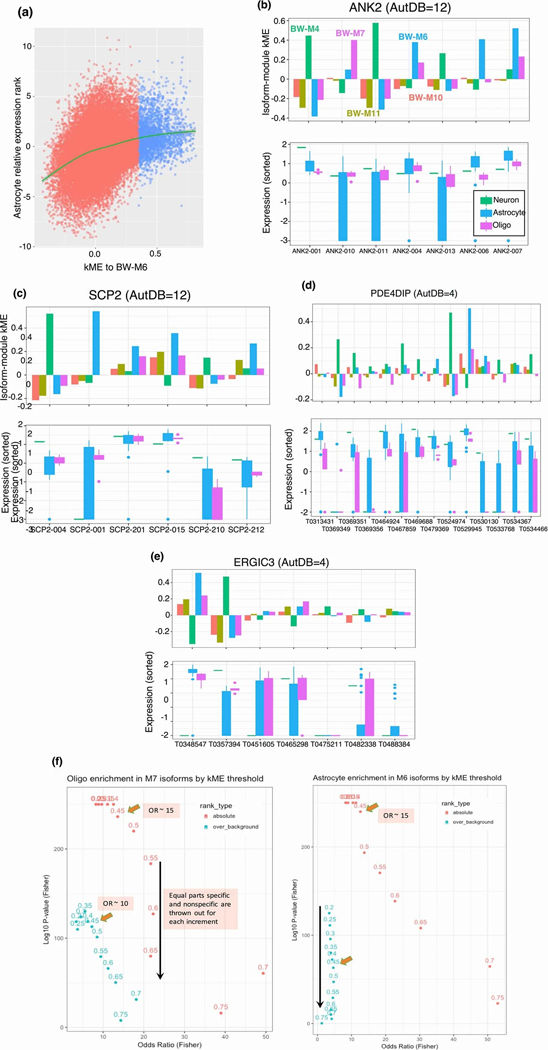
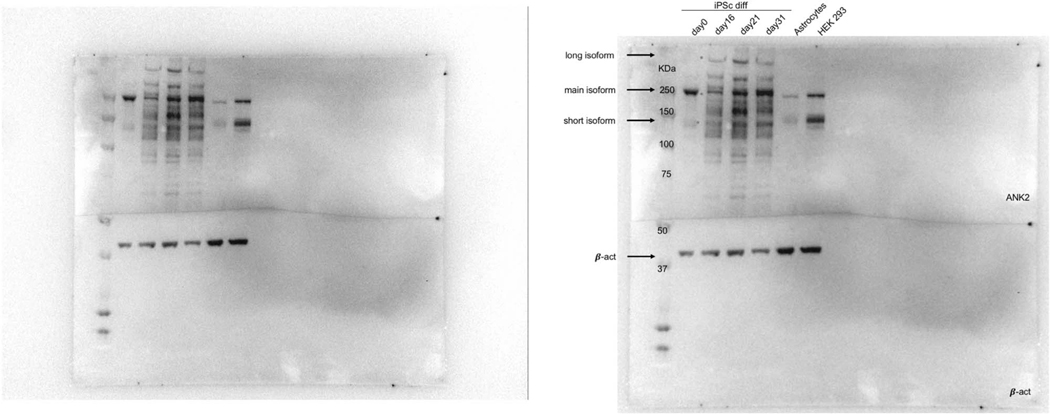
We observed that in 7% of cases, the parent gene of an isoform differs in co-expression relationships from an alternatively spliced derivative (figure 3e). We identify 52 genes exhibiting switching between cell type modules, 11 of which show neuron/astrocyte switching (BW-M4/BW-M6), and 8 of which show neuron/oligodendrocyte switching (BW-M4/BW-M7), trends validated in sorted cells (Extended Data Fig. 3). Of the 11 neuron/astrocyte switching genes, ANK2 and SCP2 are known autism susceptibility genes (figure 3f,g), while two others, ERGIC3 and PDE4DIP, are weaker candidates (AutDB score 4; Extended Data Fig. 3; p < 0.01, Fisher’s exact test). We validate previous observations of isoform switching of ANK2 in ASD and SCZ18 at the protein level, establishing that the long isoform is primarily neuronal (figure 3h, Extended Data Fig. 4). The neuronal ANK2 transcript includes a giant exon which is an organizer of initial axon segments and a stabilizer of GABA-A synapses,19 confirming a neuron-specific role for this ANK2 variant.
Ribosomal genes are down-regulated across the cortex
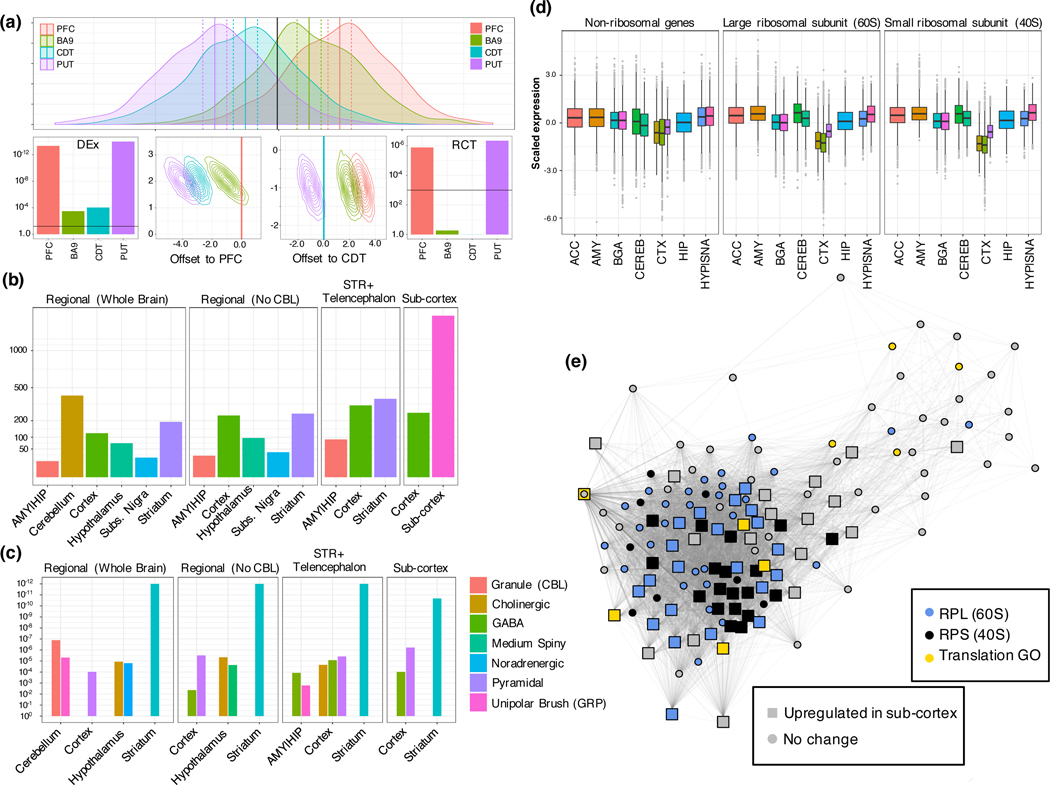
We next sought to understand module-level regulation and its relationship with differential gene expression across brain regions. We developed a Regional Contrast Test (RCT, figure 4a) to test a gene’s regional enrichment (methods; table S7), which we examined at varying degrees of granularity (figure 4b). Genes up-regulated in subcortical regions enrich for non-neuronal cell-type modules ( for BW-M11, BW-M6, BW-M8, BW-M10, and BW-M7), consistent with a higher glia/neuron ratio (figure 4c). Conversely, we find BW-M4 (neuronal) to enrich for the genes up-regulated in cortex compared with sub-cortical regions. Interestingly, we observe a significant enrichment in BW-M2 (), a module dominated by small- and large-ribosomal subunit RNA (figure 4d, e), for sub-cortical upregulated genes. This is consistent with the observation that that ribosomal turnover drastically increases in cultures with higher glial proportion.20
Figure 4:
Region-specific gene up-regulation reflects region-specific cell types and ribosomal turnover. (a) Overview of the regional contrast test (Methods): Example of heterogeneous data where mean expression within each region differs from the global mean (top panel, x-axis: gene expression, y-axis: density; vertical lines correspond to regional means – solid – and ± two standard errors – dashed). With only 50 samples, all regions are significantly differentially expressed in a global manner (bottom left, line at p=0.01). Visualization of the RCT statistic for PFC and CDT (bottom middle panels). The PFC mean (set to 0; red vertical bar) overlaps only a small amount of the confidence region for one other region, while confidence regions straddle the CDT mean, demonstrating that PFC shows extremal expression while CDT does not. The RCT statistic identifies the two most distinct tissues (PFC and PUT) as differentially up- and down-expressed compared to all other regions (right panel) (b) Count of genes (y-axis) significantly up-regulated within brain regions, across four contrast backgrounds (labeled top of each panel) (; FDR-corrected signed regional contrast test) (c) Cell-type enrichments for the up-regulated genes from the corresponding comparisons in (b). (d) Standard boxplot (box: quartiles, whiskers: 1.5xIQR) of scaled expression (per gene across tissues) for all genes in BW-M2, showing CTX-specific down-regulation of ribosomal subunits. (e) PPI co-expression network (edge: gene-expression correlation only for known InWeb interactors, Supplementary Note) for genes in WB-M2, embedded by Fuchterman-Reingold. Large squares: genes up-regulated in sub-cortical regions compared to cortical regions; colors: ribosomal subunits (blue, black) and GO regulation of translation (yellow), showing a sizeable fraction of the module core, a substantial fraction RPL and nearly all RPS mRNA are up-regulated in sub-cortical regions.
Regional specificity of neuropsychiatric disorder networks
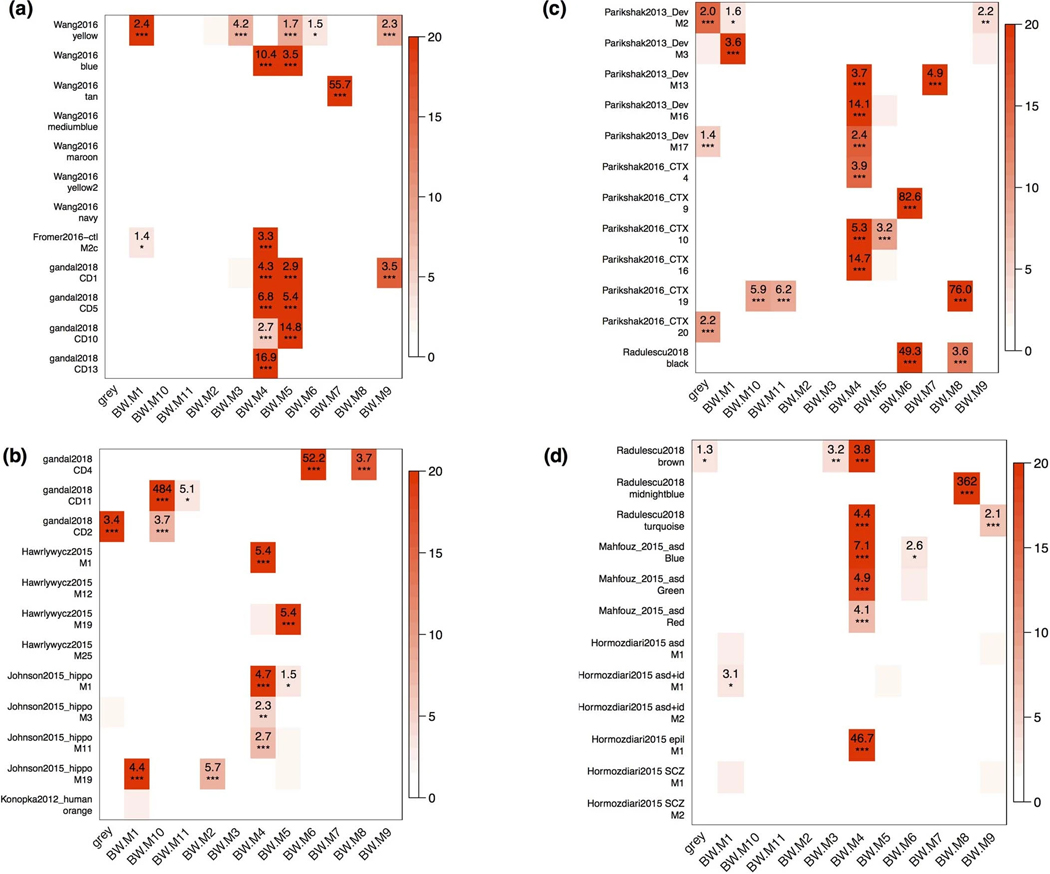
We next assess the regional specificity of disease associated transcriptomic modules by re-evaluating changes identified in post mortem tissue from 11 publications representing multiple childhood and adult brain disorders (Supplementary Note). We find that a common set of modules are involved in overlaps across every co-expression study: BW-M1, BW-M3, BW-M4, BW-M6, and BW-M10 (Extended Data Fig. 5). At least one – and in some cases every – disease-significant module overlaps with at least one of our whole-brain or multi-regional modules (table S8). Thus, although each study was performed in a specific brain region, the modules that associate with disease largely reflect brain-wide co-expression signatures. While this definitely does not rule out region-specific components for each disease, it does suggest that genetic risk has brain-wide impact in neuropsychiatric disorders.
Brain-wide and regional pathways in neuropsychiatric disease
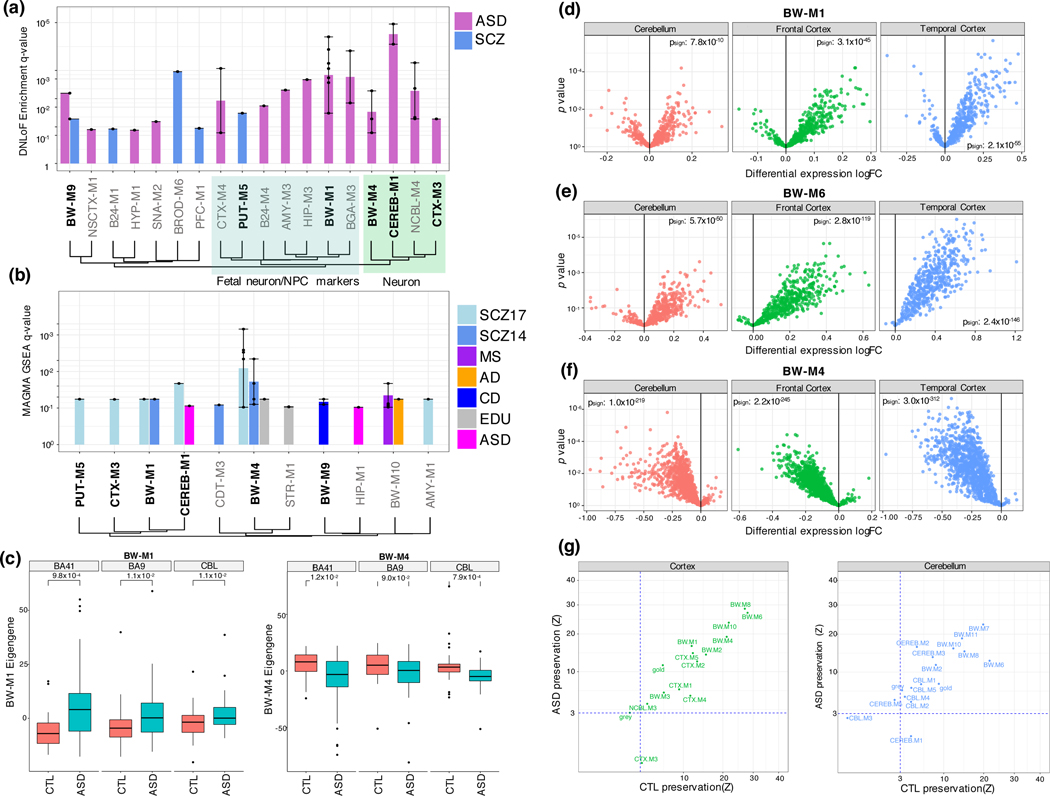
We next investigate whether genetic risk for neuropsychiatric disease converges onto region-specific or cross-regional modules, identifying two whole-brain modules, BW-M4 (neuron) and BW-M1 (neural progenitor) that enrich for ASD-linked rare variants (figure 5a), SCZ GWAS signal (figure 5b), and that manifest disrupted expression in ASD post mortem brain relative to controls (figure 5c-g). We also identify two regional modules, CTX-M3 (activity-dependent regulation and endocytosis) and CEREB-M1 (mRNA binding), that show ASD rare-variant and SCZ GWAS enrichment. Remarkably, both modules show significant preservation in control brain, but not in ASD post mortem brain (figure 5g), consistent with the disruption of these modules in ASD.
Figure 5:
Gene-level module enrichments for de novo PTVs, GWAS summary statistics, and differential expression. (a) FDR values (Fisher’s exact test) for enrichment of de novo loss-of-function variants from ASD and SCZ within modules, summarized to module sets. Bar height gives geometric mean of FDR, and whiskers the range of significant FDR values for modules within the module set. Modules with bold labels on x-axis show enrichment from GWAS summary statistics (see b, Methods). Module sets are ordered by Jaccard similarity between their index modules. Green region: These modules enrich for neuronal markers. Blue region: These modules enrich for fetal neuron, mitotic progenitor, or outer radial glia markers. (b) FDR values (MAGMA; Methods) for GWAS summary statistics within modules. Method of ordering identical to (a). (c) Standard boxplot (box: quartiles, whiskers: 1.5xIQR) of module eigengene expression for BW-M1 and BW-M4 in ASD cases and control brains across three regions and associated p-values from a prior ASD sequencing study. P-values: T-test (unsided) (d-f). Volcano plots for individual genes in modules BW-M1 (NPC), BW-M6 (astrocyte) and BW-M4 (neuron) in a prior ASD sequencing study; x-axis: log fold-change, y-axis: p-value (linear mixed model), sign-test p-values are inset demonstrating an overabundance of up-regulated genes in BW-M1, BW-M6, and down-regulated genes in BW-M4 (Methods) (g) Module preservation statistics for ASD and controls calculated separately for cortical and cerebellar modules shows highly consistent patterns, except for CTX-M3 and CEREB-M1, which are differentially preserved.
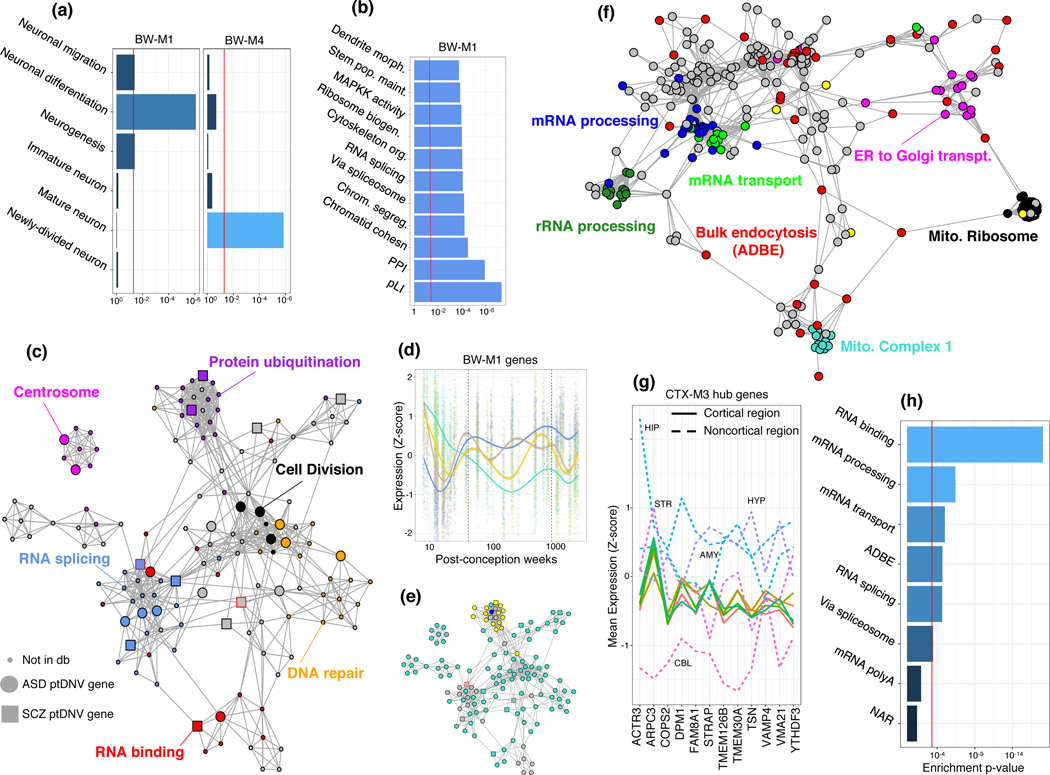
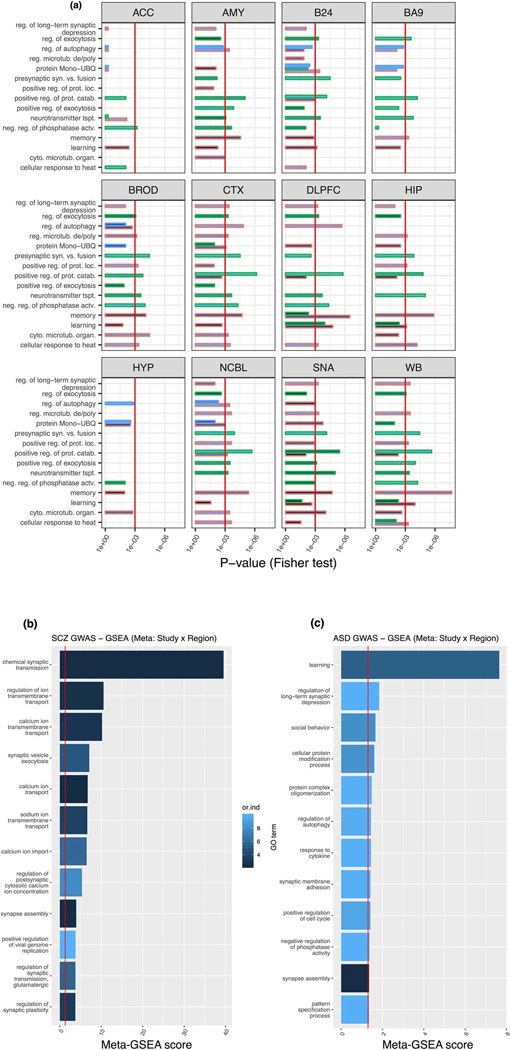
BW-M4 enriches for GO terms related to membrane organization and ion transport consistent with convergence of risk onto synaptic signaling pathways 21,22 (Extended Data Fig. 6, Supplementary Note). BW-M1 contains genes and pathways corresponding to neurogenesis, differentiation, migration (figure 6a), and RNA splicing (figure 6b,c). Genes within BW-M1 are strongly loss-of-function intolerant, and the genes in this module are up-regulated in ASD cortex (figure 5d), including the TGF-beta signaling pathway (FDR=0.0047, STRING),23 key REST co-repressors CTDSPL and RCOR1, as well as differentiation repressors ADH5, TLR3, SOX5, SOX6, PROS1, and SPRED1.24 Module trajectories show prenatal upregulation, with continuing postnatal expression into early adulthood (figure 6d,e), evidence that one component of ASD may be brain-wide changes in neuronal proliferation/differentiation/maturation balance beginning in early development and that persist.25,26,27
Figure 6:
Ontologies, PPI networks, and expression profiles of ASD-associated modules. (a) Enrichment p-values (Fisher exact test) for neuron-related ontologies in two ASD-associated whole-brain modules. (b) Combined (geometric mean) enrichment p-values of ontologies for all modules in module set BW-M1 that showed enrichment for ASD-implicated de novo loss of function mutations. (c) Co-expression-PPI network of BW-M1(edge: gene-expression correlation only for known InWeb interactors, embedded with Fuchterman-Reingold) highlighting de novo loss of function mutations (large nodes) and ontologies (colors). (d) Expression of BW-M1 across developmental time-points, sub-clustered into four component modules using WGCNA (Supplementary Note) showing a cluster of genes down-regulated after conception (teal). The scattered grey module is not shown. (e) Assignment of network nodes in (c) to the subclusters in (d) via label propagation, demonstrating that the ubiquitination-related component of BW-M1 is maintained into adulthood (yellow), but that the bulk of the module is down-regulated (teal). (f) Coexpression-PPI network for CTX-M3, colored by enriched gene ontology sets. (g) Expression profile of CTX-M3 hub genes across brain regions, demonstrating tight co-regulation in cortical regions (solid lines) by virtue of small variance, and highly variable co-expression across non-cortical regions (dashed lines). (h) Enrichment p-values (Fisher exact test) of the CTX-M3 module for gene ontologies, including bulk endocytosis genes.
CTX-M3 and CEREB-M1 also show an enrichment for de novo LoF variants linked to ASD, enrichment for SCZ GWAS risk variants, and are disrupted in post mortem brain from ASD subjects (figure 5). Both modules show region-specific co-expression (Extended Data Fig. 7), enrich for PPI (CEREB-M1 , CTX-M3 ), as well as LoF-intolerant genes, indicating that they contain essential biological pathways. CTX-M3 enriches for RNA processing and mitochondrial complexes28 (figure 6f). Despite these broad terms, we confirmed the cortical specificity of the co-expression of CTX-M3 hub genes in the Allen Human Brain Atlas (figure 6g). The presence of FMR1, ATRX and others involved in activity dependent gene regulation in CTX-M3 highlights this process in disease pathophysiology.29 Indeed, 10% of activity dependent genes from a published study30 fall into CTX-M3 (, figure 6h, Supplementary Note), as does the mitochondrial ribosome (21 genes, ). Other components of this module include alternative polyadenylation and alternative splicing, endocytosis regulation, and sorting nexins, consistent with their likely role in supporting neuronal activity dependent processes that are disrupted in ASD.
Networks and omnigenics in neuropsychiatric disorders
Complex disorders are influenced by large numbers of genetic variants and genes. Gene networks from disease-relevant tissues can capture interactions between these genes and have been hypothesized to inform disease heritability. We sought to incorporate network distance, as defined by brain-wide and regional co-expression networks, into a model of genetic architecture, and examine the role that co-expression networks play in the genetic architecture of neuropsychiatric disorders.
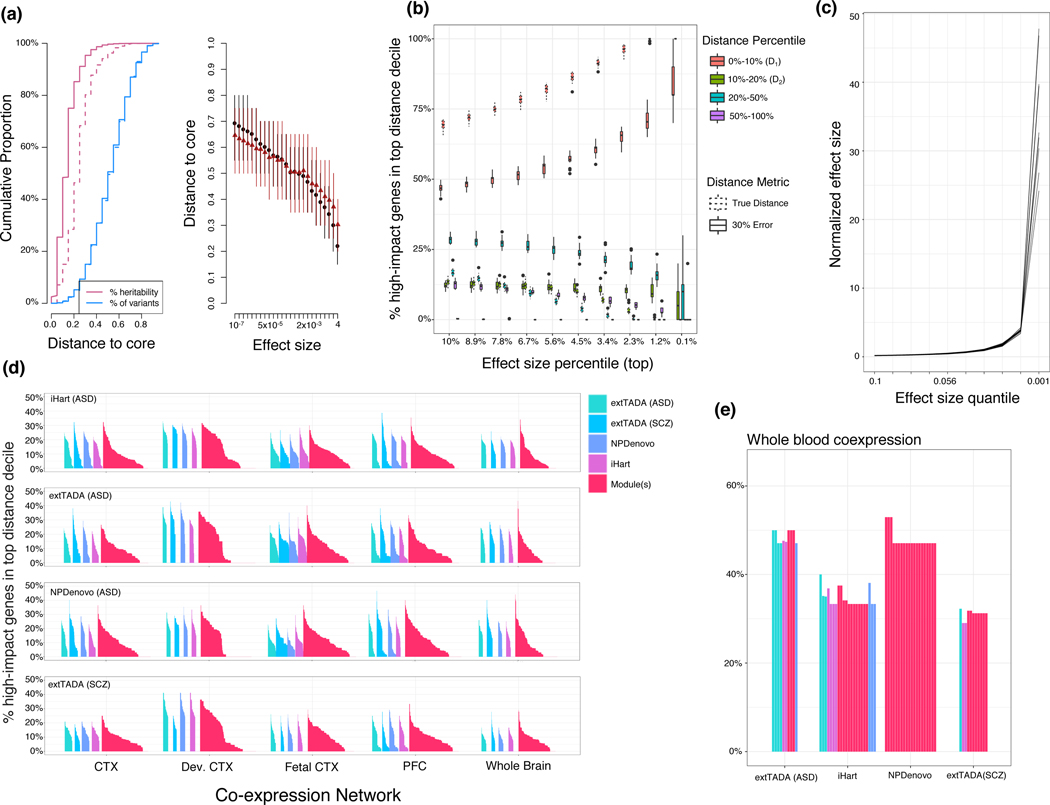
Motivated by the recently proposed omnigenic model of disease,10 wherein disease risk is conferred by the (potentially indirect) disruption of a small number of core genes, we construct a model whereby allelic effect size is a function of network distance to simulated core genes (network genetic architecture, Methods). We simulated variants to generate a frequency-effect-distance distribution (Methods), observing that the resulting effect size and heritability distributions resemble those derived from the omnigenic hypothesis (figure 7a,b),10 such that high-effect variants fall very near to core genes. We next asked how central genes capture a core-periphery structure for two common neuropsychiatric disorders: ASD and SCZ. We evaluated whether either: 1) network-central genes or 2) rare-variant implicated genes behave as “core” genes under this model (Methods).
Figure 7:
Characterizing core-periphery structure of high-impact neuropsychiatric disease genes across multiple networks. (a) Example simulation of network genetic architecture, where the variant effect size decays rapidly with distance to core. Left: Cumulative proportion of genes (blue) and heritability (pink) along the distance distribution. Dotted line shows the cumulative heritability when true distance is replaced by a corrupted (30% error) distance. Right: The relationship between core distance and effect size results in high-effect variants only appearing very close to core genes as predicted by the omnigenic model. Points indicate the mean, and lines extend to the minimum and maximum, simulated distance from 50 simulations. (b) High-impact genes are defined by the effect-size percentile on the x-axis, and the % of genes falling into the core-distance decile (phi) is plotted on the y-axis. This plot encompasses 20 simulations. Dotted boxes represent the expected values for when the distance is error-free, while solid boxes represents the case where distance is 30% corrupted by error. Boxes are standard (box: quartiles, whiskers: 1.5xIQR). (c) Validation of the effect size distribution: the effect size of each quantile is normalized to the effect size for which a balanced GWAS of 10,000 samples has 80% power; the highest-impact variants are only 20–50x stronger than empowered variants. (d) All values of across distance metrics, core set size, module definitions, and brain co-expression networks, demonstrating that no value of exceeds 50%. (e) top 10 values (per core set) for the GTEx whole-blood co-expression network, demonstrating that co-expression networks from brain have similar values to non-brain networks, reinforcing the notion that brain co-expression networks fail to reflect an omnigenic-like structure.
We evaluated network-central genes across multiple networks, using whole blood co-expression as a comparison (Methods). We observed that even the largest observed value in blood indicated that only 52% of the likely high-impact genes fall near network core genes – below the simulated baseline (figure 7). The largest observed value across cortical networks was even lower: 0.44 (figure 7). We do observe a significant enrichment for brain (FDR < 0.05, Fisher’s exact test) and blood network distances (table S9), demonstrating that the genetic architecture of these diseases reflects network distances, but still does not clearly separate core and peripheral genes, as defined by co-expression.
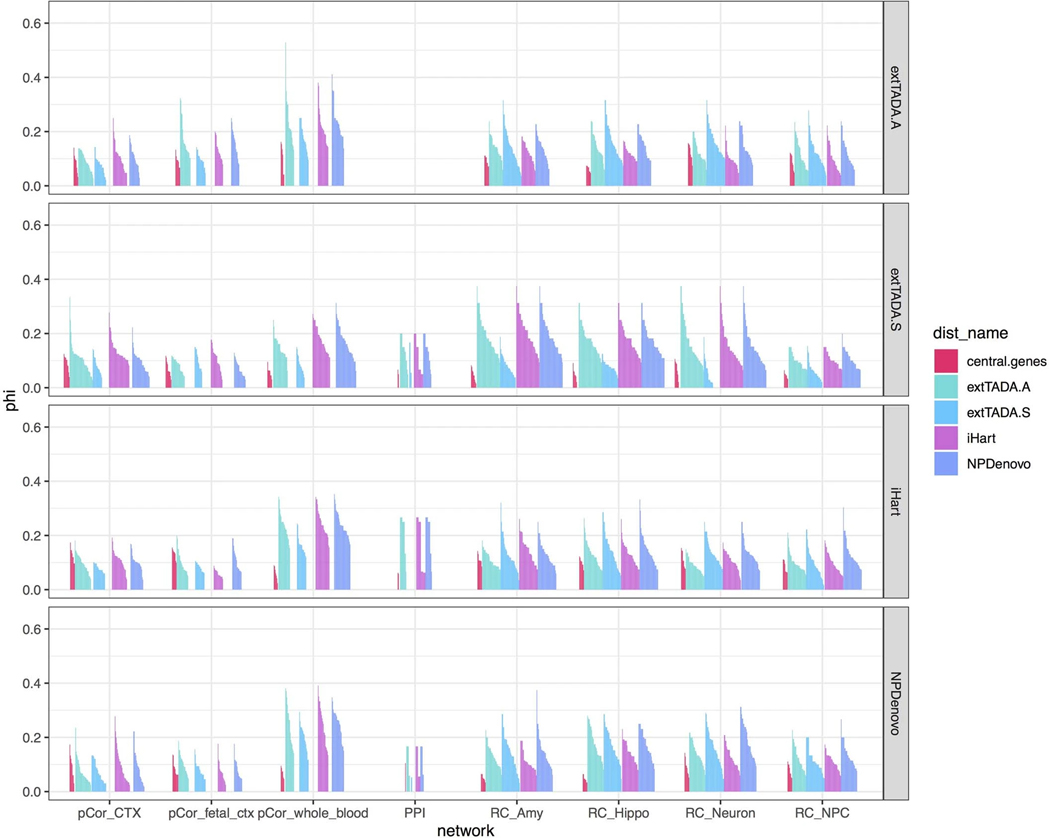
It may be that co-expression networks capture the correct notion of gene-gene distance, but network-central genes are not the correct core genes. We therefore used genes implicated by major effect size rare variants both to define core gene sets and to compute the test statistic (Methods). As in the network-central gene analysis, we find that the core genes defined in this manner are not clearly separated from periphery (figure 7d). It also is possible that bulk co-expression data fail to capture the appropriate core-periphery relationships. Therefore, we utilized the InWeb PPI network from brain, empirical gene regulatory (Tf-driven) networks (eGRNs) from brain tissue and cell types (Methods),31 and co-expression methods based on partial correlation (Supplementary Note), repeating the analyses above using high-connectivity genes as central genes. We find that the core/periphery structures in these other networks also do not mirror the expectations of our omnigenic-like model (Extended Data Fig. 8).
The inability of the co-expression networks to separate a core and periphery according to our test may reflect any of several explanations: i) that the disorders assessed do not have a core/peripheral gene structure, indicating that the omnigenic model does not explain their architecture;32 ii) or that peripheral master regulators are somewhat common among the candidate core genes (e.g. de novo LoF genes) tested above, but are not an appropriate core set. However, in our analysis, we exclude known transcription factors, DNA binding proteins, and RNA binding proteins and non-coding genes, so master regulators present among the candidate core genes would need to regulate expression without directly binding DNA or RNA (Methods). Finally, it could be that network degree centrality is not the correct property for assessing omnigenic architecture. While we cannot definitively assert which of these influences our results, it is clear that genetic effects appear to be more continuously spread across co-expression, PPI, or transcriptional regulatory networks, most consistent with polygenic models, rather than clearly separating “core” genes from a periphery.
Discussion
Gene co-expression networks provide a powerful organizing framework for studying the nervous system.33,34,35,36 That gene expression markers for major cell classes can be identified from bulk tissue co-expression is now well-established.37,38 However, most studies have not assessed whether such networks were specific to the brain regions studied, or more generalizable. Here, we construct a robust resource aimed at establishing common and region-specific aspects of gene co-expression within the brain. We identified 11 whole-brain co-expression modules, corresponding to common cellular components such as major neuron and glial types, and regional modules capturing signatures of cell subtypes. We demonstrated that: i) the convergence of genetic risk in ASD and SCZ is primarily reflected in pathways common across brain regions, rather than specific to a single region; ii) disease risk in ASD and SCZ is enriched in down-regulated neuronal and neurogenesis modules; several of these modules implicate down-regulation of activity dependent transcriptional programs in the cerebral cortex, a broad regional effect; iii) cell-type-specific lncRNA and isoform co-regulation are included in networks, and isoform-level analysis is likely essential to interpret disease associations; and iv) brain RNA co-expression, PPI, and co-regulatory networks do not cleanly capture the dichotomous core/periphery structure proposed by the omnigenic model, but rather support a continuous model. We provide a browser, HUBgene, to facilitate access to these networks and permit their broader exploration (http://geschwindlab.org/gclabapps/hubgene/home).
We developed two methods for imputing co-expression networks in new data, and applied these to lncRNA and isoform quantification to identify cell-type specific expression from bulk tissue measurements. Here, we provide a first generation set of 1,987 cell-type specific isoforms for major cell classes in the brain, of which 549 are neuronal, 543 astrocytic, and 696 oligodendrocytic. Remarkably, several of these isoforms, including 4 ASD risk genes, manifest isoform switching between neurons and glia. We showed that synaptic isoforms represent a major source of regional transcriptomic diversity among neuronal subtypes, and that neuropsychiatric risk genes are expressed at the synapse of multiple neuronal subtypes. 39
Our findings that ASD-linked dnLoF mutations as well as SCZ GWAS signal enrich in brain-wide neuronal and neurogenesis modules underscore previous findings linking both common and de novo variation to synaptic genes,40,41 neuronal genes,42,43 developmentally-expressed genes,44,45 and neurogenesis pathways.46,47 We show that the pattern of enrichment in most cases is not region-specific, implying likely widespread effects of these genetic risk variants on brain function.
The only region-specific modules with convergent evidence across disease and modality were CTX-M3 and CEREB-M1, which appear to reflect activity-dependent transcriptional profiles identified in previous studies. VAMP4 – present in CTX-M3 – encodes an essential molecule for activity-dependent bulk endocytosis (ADBE),48 and several module proteins overlap with the ADBE proteome.49 This suggests a parsimonious explanation that this module reflects the maintenance of organelles and proteins required for long-term neuronal activity, (i.e., mitostasis and ADBE proteostasis), through activity-dependent mRNA transcription and neuropil targeting.50
Incorporating gene networks into models of genetic architecture remains a major challenge. The omnigenic hypothesis does not specify a concrete network model, but to practically use the model to understand the etiology of disease, it would seem useful to connect it to quantifiable relationships between genes. Our approach comes from a unifying hypothesis: that there is a relationship between mutational effect size and network distance – with omnigenic and polygenic architectures representing the strong and weak extremes of that relationship. For the three distinct network types tested we find that the network structures do not strongly distinguish peripheral genes from core genes as predicted by an omnigenic model. However, there are many other natural network topologies to test, and it will be important to further explore cellular-level or other types of gene networks. The model underlying our analysis is broadly applicable as it provides a means to relate total effect – direct and indirect – to network structure. Future work extending this model provides a means of assessing the proportion of heritability explained by network interactions to characterize the network architecture of disease.
Finally, we acknowledge limitations, including the need for extending these studies to include single-cell, multi-regional and multi-omic data. Based on our observation that methods for removing unwanted variance also remove co-expression signal, development of novel methods for hidden artifact correction would be useful. Another limitation of network algorithms is that they can produce qualitatively different modules. Although we compared four distinct approaches to show that our findings are stable across methods, we strongly support additional work to benchmark network methods and to develop new methods. Capturing the broadest scope of functionally-relevant co-expression relationships will definitely require application of a diverse set of network approaches.
Methods
Ethical Statement
As a retroactive re-analysis of data obtained from dbGAP, this study does not require direct formal consent.
Statistics & Reproducibility
This study was designed as a retrospective study of bulk RNA expression from human brain. As such, no power analysis was performed to determine sample size, nor was any blinding or randomization applied. All brain regions were profiled with sufficiently many samples for a standard WGCNA analysis (>30), and some subjects were excluded on the basis of potentially confounding biological or technical factors (see below).
Data availability
Processed data is available at http://geschwindlab.org/gclabapps/hubgene/home
Code availability
Supporting code for network construction, and network genetic analysis, is available at https://github.com/dhglab/multiregional-networks
Expression quantification, QC, and covariate correction
Reads were aligned using STAR51 in standard two-pass fashion. Gencode v25 transcripts (hg19/b37) were used as the reference transcriptome and genome for alignment. Transcripts were quantified using RSEM to produce gene and isoform level TPMs. The analyzed TPMs are log-transformed resulting in approximate normality. A gene was included in the network analysis if it met the following criteria across brain regions:
The gene must be non-missing in all regions
The median read count must be >12 in at least one region
In all regions, 80% of samples must have at least 1 count
In all regions, the variance of gene expression must be >0
These thresholds resulted in 15,895 genes; of which 929 have a mean TPM < 0.5, as such an additional TPM threshold was not applied.
We examined known co-expression artifacts for potential contamination with non-brain tissues52 and found that pancreas-specific genes PRSS1 (ENSG00000204983), PNLIP (ENSG00000175535), CLPS (ENSG00000137392), and/or CELA3A (ENSG00000142789) do not pass our coverage thresholds. Further, the genes KRT4 (ENSG00000170477) and GP2 (ENSG00000169347), listed as “inappropriate” for brain, also are not sufficiently covered. We therefore regard these specific instances of cross-tissue contamination as non-existent in our analyses. While there may be a more general and subtle effect of contamination from non-pancreas tissues, it does not appear strong enough to generate sample outliers or modules related to non-brain cell types.
Sample and individual-specific covariates were downloaded from the GTEx53 website, and supplemented with technical alignment information from the STAR alignment and PicardTools QC of the resulting .bams.
Individuals were excluded if they were positive for any of the following phenotypes: ‘MHALS’, ‘MHALZDMT’, ‘MHDMNTIA’, ‘MHENCEPHA’, ‘MHFLU’, ‘MHJAKOB’, ‘MHMS’, ‘MHPRKNSN’, ‘MHREYES’, ‘MHSCHZ’, ‘MHSEPSIS’, ‘MHDPRSSN’, ‘MHLUPUS’, ‘MHCVD’, ‘MHHIVCT’, ‘MHCANCERC’, ‘MHPNMIAB’, ‘MHPNMNIA’,’MHABNWBC’, ‘MHFVRU’, ‘MHPSBLDCLT’, ‘MHOPPINF’. The individual-specific covariates ‘GENDER’, ‘AGE’, ‘RACE’, ‘ETHNCTY’, ‘TRISCH’, ‘TRISCHD’, ‘DTHCODD’, ‘SMRIN’, ‘SMNABTCH’, ‘SMGEBTCH’, ‘SMTSISCH’, ‘SMTSPAX’ were extracted. The `DTHCODD` variable was binned into the following categories: ‘UNKNOWN’, ‘0to2h’, ‘2hto10h’, ‘10hto3d’, ‘3dto3w’, ‘3wplus’. Individuals were also excluded if they appeared as outliers for expression principal components (if the sum of the square of the scaled principal components were less than 6). The final sample counts after this process were: Nucleus Accumbens (85), Amygdala (52), Cerebellar Hemisphere (78), Cerebellar Cortex (91), Caudate Nucleus (85), Prefrontal Cortex (85), Cortex BA24 (60), Cortex BA9 (76), Hippocampus (71), Hypothalamus (67), Putamen (74), Substantia Nigra (43). While small, all counts are above the recommended size (30) for WGCNA; and in many regions of the brain the GTEx data reflects the largest available sample sizes for sequenced data.
STAR alignment metrics and PicardTools QC metrics were subset to non-excluded samples, outliers were flagged and removed via a chi-squared test (p < 10−5). The PicardTools metrics were log-scaled, and the top 5 principal components extracted using the PCA class from scikit-learn54 (“seq-PC”). The STAR alignment covariates were subset to those with “splice” in the feature name, and the top 3 principal components similarly extracted (“STAR-PC”).
Given the gene expression and covariate matrices, features that explain a significant proportion of expression variance in a non-trivial subset of genes were extracted using a forward-backward regression approach (see next section). This approach identified the features “seq_pc1”, “seq_pc2”, “seq_pc3”, “SMRIN”, “SMEXNCRT”, “Number_of_splices_GT/AG”, “TRISCHD” and “DTHCODD” (categorical encoding) as significant features, with no significant interactions between these features or between any of these covariates and tissue type.
While there were no significant cross-terms between tissue and covariate, in our comparisons to latent-factor based approaches (see below), we found that hidden factors were not (nearly) orthogonal rotations of one another, leading us to run all correction methods within each tissue. Following this approach we used a linear model (expr ~ covariates − 1) to remove covariate effects from within each region. Because we correct for covariates within each brain region, we do not model individual-specific (cross-regional) effects.
Tissue hierarchy
The median expression of all genes across a given tissue is taken as the exemplar of said tissue. These exemplars (12 in all) are hierarchically clustered into the tissue hierarchy observed in figure 1 using Euclidean distance and single-linkage hierarchical clustering.
Module construction
Robust WGCNA:
Robust rWGCNA55 was applied to each brain tissue independently. Briefly, the power parameter is selected as the smallest power (between 6 and 20) which achieves a truncated r^2 of >0.8 and a negative slope. Then, 50 signed co-expression networks are generated on 50 independent bootstraps of the samples; each co-expression network uses the same estimated power parameter. These 50 topological overlap matrices are then combined edge-wise by taking the median of each edge across all bootstraps.
The topological overlap matrices are then clustered hierarchically using average linkage hierarchical clustering (using `1 – TOM` as a dis-similarity measure). The boostraps are used to determine cut height as follows: multiple cut-heights are considered (0.9 to 0.999, by 0.005); and for each cut the within-module correlation of TOMs is considered. For the top 8 modules by size (fewer if fewer modules are produced), the consensus and each bootstrap TOM is subset to the genes within each module, and the correlation between bootstrap and consensus is computed. The median (within module, across bootstraps) of these consensuses is computed, and the mean of these summaries is taken to be a measure of `goodness` for the cut. The cut height which maximizes this metric is taken to define the initial modules.
These initial modules are then merged via `mergeCloseModules` in WGCNA, which hierarchically re-clusters modules based on the module eigengenes, using the correlation-based adjacency as a dis-similarity matrix. Modules with a distance of < 0.35 are merged together into a combined module.
Aggregating co-expression:
At each merge of the hierarchy, a single round of consensus topological overlap is performed. Each pair of genes has two descendent edges, and the parent edge is estimated as the 80th percentile between the two (i.e. for ; )). This process proceeds up the tissue hierarchy until a single network TOM remains.
Consensus labeling:
After construction of co-expression networks from all tissues and splits, modules have been defined for a total of 21 groups (BRNACC-BRNSNA, BROD, CTX, CBL, BGA, STR, NS-SCTX, SCTX, NCBL, WHOLE-BRAIN), yielding over 300 overlapping modules. The overlapping nature of these modules motivates labeling each module in terms of a hierarchy group, allowing one to identify (say) BRNHYP-M2 and BRNCTX-M7 with the module group WHOLE-BRAIN-M3.
To perform this labeling, similarity matrices are computed. First, the module eigengenes for all modules (regardless of origin) are computed within every tissue, and the correlation matrix (using `bicor’) is computed for each module for each tissue. This produces an (all modules) x (all modules) matrix for each tissue. The consensus eigengene similarity (“E”) between two modules is chosen as the component-wise maximum of all of these matrices. The second similarity matrix is the standard Jaccard similarity (“J”) between module gene lists. These similarities are combined into a dis-similarity matrix , which is used to hierarchically cluster (average linkage) these modules.
Module groups are defined by cutting the dendrogram at a height of 0.35. This process results in a set of module clusters, each of which has a “level” in the brain tissue hierarchy (for instance, a cluster of BRNCTXBA9-M4, BRNCTXB24-M2, CTX-M7 would have the level “CTX” as the top-level of the tree represented is CTX). The “representative” of the module group is taken to be the module at the highest (most rootward) level of the tree – and if there are two, the larger of the two. A second round of clustering is performed by removing all modules in the group (except for its representative) from the dissimilarity matrix, and re-clustering only the group representatives. This process repeats until there are no additional merges. Finally, each module is labeled with its group representative; for instance “BRNCTXBA9-M4” would receive the label “CTX-M7”, because it shares its highest similarity with the consensus cortex module M7.
In addition, we re-named and abbreviated modules: “BW” for brain-wide, “NCBL” for non-cerebellar, “NS.SCTX” for non-striatal subcortex, “CEREB” for Cerebellum; and the GTEx tissue names were abbreviated to clear region codes: ACC, AMY, B24, BA9, CBH, CBL, CDT, HIP, HYP, PFC, PUT, SNA.
Preservation
We consider two module preservation statistics: the classical Z-summary56 and a leave-one-gene-out neighbor statistic. For the classical Z-summary; module statistics such as the mean gene-gene correlation in the module, the correlation-of-correlations across datasets, the variance explained by the first module PC, and other metrics are computed for each module (in both the original and comparison dataset); and compared to 100 random (via permutation) modules of identical size. Each observed statistic is converted to a Z-score, and these are averaged to generate a final summary, for which large Z-scores are indicative of replication of the underlying biological signal.
The neighbor statistic (“Z-AUPR”) is strongly influenced by the single-cell statistic MetaNeighbor57. Briefly, a -nearest-neighbor network is built in the comparison dataset (we use ), and we impose the module labels from the reference dataset. For each gene, we compute the proportion of its neighbors (again, in the comparison dataset) whose labels match its own. Note that if this proportion is > 0.5, then this gene would be assigned the same label in the comparison dataset as the reference dataset under a neighbor-voting scheme. Using these scores, we can compute an AUPR for each module. We repeat this approach for 100 permuted modules (and, unlike the WGCNA permutation, we split genes into connectivity deciles, and permute only within decile), and use this baseline to convert observed AUPR to Z-scores. As with the classical Z-summary, high Z-AUPR is indicative of replication of underlying biological signal.
Learning curves
To examine how module identification and specificity changes as a function of the number of samples, we combined samples from similar tissues to increase the maximum N: we combined the cerebellar samples into one larger group (), and we also grouped the cortical samples (PFC, B24, BA9) together with hippocampal samples into a second group ().
“Reference” modules for these groups were determined by applying rWGCNA to the full dataset. We down-sampled the group to a smaller set of samples of size and performed rWGCNA on the smaller set. We repeated this process 10 times, generating 10 networks and module assignments for each sub-sampling of the full dataset.
Because two clusterings should be considered identical up to renaming the labels in one or the other datasets, we use module co-clustering as a measure for accuracy, precision, and recall. Within the reference (whole group) dataset, we extract the top ‘hub’ gene from each of the modules, and the list of genes co-clustered with that hub gene (i.e. the other members of its module). For a given reference module, within a sub-sampled dataset, we have
Recall = (# ref hub co-clustered genes also co-clustered in subsample)/(# ref hub co-clustered genes)
Precision = (# ref hub co-clustered genes also co-clustered in subsample)/(# subsample co-clustered genes)
In effect, these are precision/recall statistics for the hub gene co-clustering indicators. If two reference modules fail to separate in a sub-sample (a typical failure mode), the result is slightly higher recall, but far worse precision.
Regional contrast test
The Regional Contrast Test is a multivariate test of significance for
This statistic corresponds to a multidimensional integral, with infinite limits on all coefficients other than , and taking . Because of the large numbers of degrees of freedom in this regression, we treat the variance-covariance matrix of the vector as giving the true sampling covariance of these parameters, and perform Monte-Carlo integration by drawing 50,000,000 samples from the multivariate normal distribution using the R package fastmvn.
The above statistic works for testing each tissue against all others. A grouped version of the test is a simple extension, which considers several in tandem. For simplicity we assume the indexes for the group are the first k coefficients, then the comparison becomes:
This only changes the integration limits to (for ) to ; and we use the same Monte-Carlo approach as before.
Western Blot Isoform Analysis
Human iPS cells were differentiated into cortical glutamatergic-pattern neurons (GPiN) according to Nehme 2018,58 and samples extracted at days 0, 16, 21, and 31. Human astrocytes were used as an outgroup. IP was performed using an ANK2-specific monoclonal antibody S105-17.
De-novo variant enrichment
Denovo-DB59 was used to extract lists of genes harboring de novo variation linked to ASD and Schizophrenia. The v1.5 of the database was obtained on 02–17-2018, and we filter for “PrimaryPhenotype=autism” (or, separately, “PrimaryPhenotype=schizophrenia”) and “FunctionClass” as one of “frameshift”, “frameshift-near-splice”, “splice-acceptor”, “splice-donor”, “start-lost”, “stop-gained”, “stop-gained-near-splice”, or “stop-lost.”
Module enrichments are calculated via Fisher’s Exact Test, using the contingency table formed by cross-tabulating module presence/absence with presence/absence on the denovo-db gene list.
As the denovo-db is a broad collection of de novo mutations in affected individuals and does not curate these variant lists on the basis of total evidence, we consider two additional data sources for alternative enrichment scores. First, we consider the curated list of SFARI genes of rank S, 1, 2, or 3; and perform enrichment on the resulting likst. Second, recent work from our lab60 computes transmission and de-novo association Bayes Factors for 18,472 genes. We regress the log Bayes Factor against module presence/absence and look for a significant, positive coefficient.
GWAS variant enrichment
Enrichment for GWAS signal was performed through the use of MAGMA61 gene set analysis. Briefly, variants were mapped to genes on the basis of genomic distance, while taking chromatin contact maps from adult brain Hi-C62 into account. MAGMA was used to generate gene scores and LD-based covariances. Subsequently, MAGMA’s gene set analysis was used to compare the distribution of gene scores between modules and the background set of ‘grey’ genes.
8 GWAS studies were considered in this analysis: The iPsych and PGC cross-disorder GWAS studies (accounting for ASD, SCZ, and cross-disorder), Alzheimer’s disease, multiple sclerosis, and educational attainment.63,64,65,66,67
Defining genes likely to harbor high-impact rare variants
We identified sets of genes likely to harbor high-impact rare variation for both ASD and SCZ by using the top implicated genes from each of three previous rare and de novo studies of neuropsychiatric disease: extTADA,68 iHART,69 and NPDenovo70. These studies produce Bayes Factors for confidence of association for a particular gene. We use the Bayes Factors as a ranking, see empirical core genes, below.
Core/periphery enrichment within networks
Simulation of network genetic architecture
Simulation:
10,000 causal variants are simulated with frequency parameters estimated from human populations,71 and distances drawn from a binned Beta distribution:
is arbitrary and set to 1; is arbitrary so long as it is greater than about 5, and is set to ; , , , , and are model parameters. Recent results from the UK Biobank suggest that a value of is reasonable for a polygenic trait (height=−0.45, education=−0.32, blood pressure = −0.39) and is fixed to this value. Architectures were simulated on a grid of , ; ; . Notably for any values of , , and can be found such that explains >40% of the heritability. Errors-in-distance: Here the above simulation of distance is replaced by a normal copula (where 20% error corresponds to – this is a purposeful under-estimate, as so the latent error is more like 36%):
When simulated from a network, first a set of hub genes are simulated with the constraint that no pair can be directly connected by an edge. These form initial communities of size 1. For the remaining 40 core genes, a community is selected at random, a community member is selected at random, and a neighbor is selected at random and added to the community and to the set of core genes. These form the basis of , which is taken as the minimal path distance to any core gene. For the communities are distorted by removing core genes at random; or by adding non-core genes at random.
Normalized effect sizes:
Identifying the effect size of an empowered 5% frequency GWAS variant happens through three steps: (i) Estimating the liability distribution; (ii) Mapping case/control frequency differences to effect sizes (iii) Estimating power.
Liability Distribution: A 5000×10,000 genotype matrix is sampled independently, with frequencies given by the previously-simulated vector , and 5,000 genetic liabilities are generated by . These liabilities are used to estimate parameters for a T-distribution using ‘fitdist’ from the R package ‘MASS’; the degrees of freedom are reduced by 25% to account partially for rare variants not sampled in this population of 5,000; and these parameters used to generate 400,000 genetic liability scores. These are converted to total liability scores by adding noise ; with chosen so that the heritability is 0.85.
Frequency-ratio-to-effect: The goal is to estimate the ratio for a variant with a frequency and effect . The genetic liabilities with are computed for 400,000 simulated individuals. As 10,000 variants contribute to , the addition of is assumed to have a minimal effect on heritability. Case/control labels are defined by so that the disease prevalence is 5%, and the empirical frequency is taken as an estimate of the ratio . Fixing and varying produces an empirical and invertible map from variant effect to frequency ratio.
Estimating power: Given an effect size , the case and control frequencies for a variant are obtained from (ii). 5000 case and 5000 control genotypes are sampled according to the corresponding frequencies, and a two-sided T-test performed by ‘t.test’ in R. 1,000 simulations are performed, and the number of times the T-test p-value achieved a Bonferroni-corrected p-value of 0.1/10,000 (the number of causal variants) was tabulated.
Network construction and computation of d(G)
Co-expression Networks
Within co-expression networks, the raw co-expression (cosine) distance is used to define gene-gene distances. In addition, a sparse graph is calculated as follows: the cosine distance graph is subset to only the 2.5% smallest edges, and any singleton genes are connected to their closest neighbor. This graph is treated as unweighted, and not necessarily connected. Cross-component distances are treated as 1 + the maximum observed within-component distance. This is referred to as “sparse distance.”
Module hub genes are defined as the 2.5% of module genes with largest kWithin values (minimum 5). Distances between a gene and a module is computed as (i) 1 – kME; (ii) mean cosine distance to a module hub; (iii) minimum cosine distance to a module hub; (iv) mean sparse distance to a module hub; (v) minimum sparse distance to a module hub. When using arbitrary gene sets as core genes, (ii)-(iv) are be computed with respect to the gene set in place of module hubs.
Other network types:
Hub genes and empirical core genes
Core gene sets which define distance (“proposal set”) are taken to be either collections of network hub genes, or the top 10 or 20 genes (by Bayes factor) from each of the three studies (separately). The core gene sets which define the statistic (“evaluation set”) are taken to be the top 25, 35, 50, 75, or 100 genes from each of the three studies. To restrict attention to directly causal (e.g. non-regulatory) genes, as the omnigenic model suggests, the core genes are also filtered to remove known transcription factors,72 DNA-binding proteins, RNA-binding proteins, and non-coding RNA. Without this filtering, values of still fall below 50% for brain co-expression networks, but achieve 70% for blood co-expression. statistics are calculated for only for evaluation sets where, after excluding those genes also in the proposal set, noncoding genes, DNA-binding proteins, known transcription factors, and RNA binding proteins, at least 15 genes remain.
Extended Data
Extended Data Figure 1:
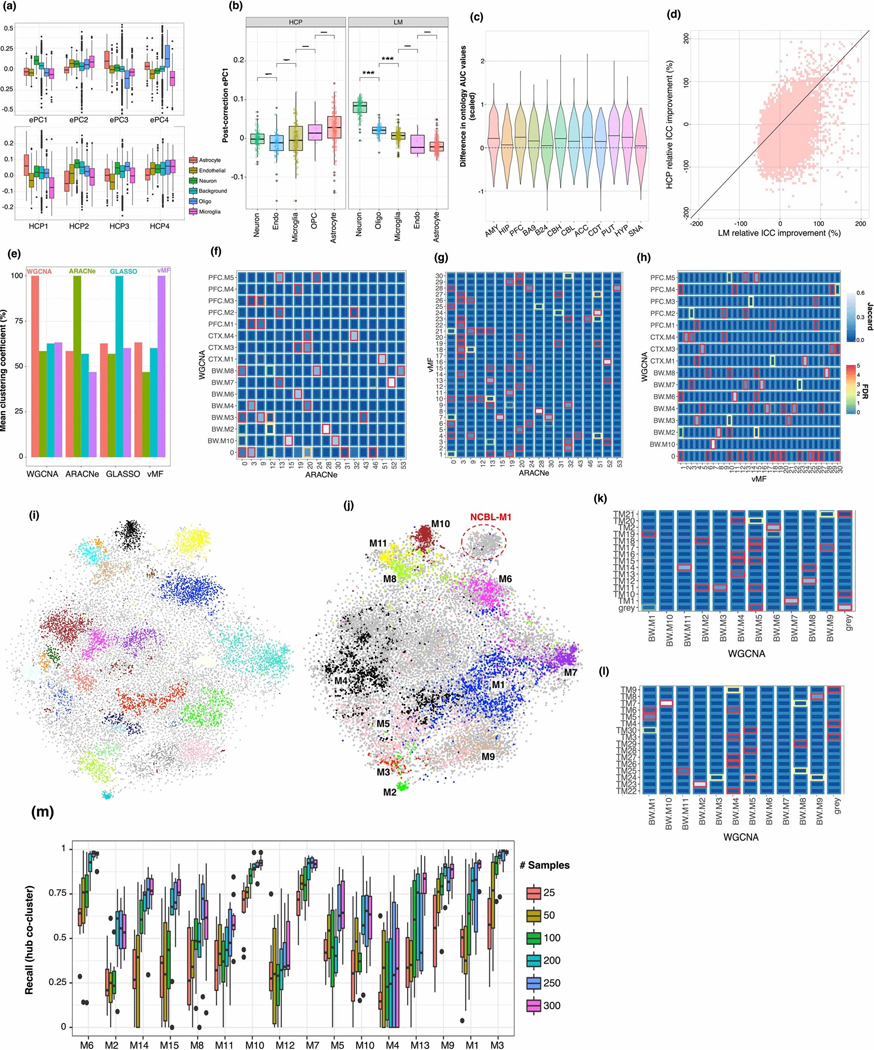
(a) Standard boxplot (box: quartiles, whiskers: 1.5xIQR) of expression PC and HCP loadings onto canonical cell type genes, showing significant heterogeneity of loadings across cell types, (Neuron), 79 (Astrocyte), 242 (Microglia), 103 (Oligodendrocyte), 176 (Endothelial). (b) Standard boxplot (box: quartiles, whiskers: 1.5xIQR) of ePC loadings after covariate correction using HCP and LM base correction, showing that cell type heterogeneity of the 1st component of expression is lost after HCP correction. Gene set sizes as in a; significance (two-sided T-test) ***: < 0.001. (c) Network-based GO prediction accuracy for each brain region. The same gene holdouts are used in 10-fold cross validation, generating 10 values for the AUC difference of each GO category, which are used to generate a Z-score for the expected AUC difference. (d) Relative improvement to the integrated correlation coefficient for BRNHYP genes, for linear model and HCP based corrections. (e) Pairwise co-clustering statistics for the 4 algorithms compared in figure 1. X-axis denotes which modules are taken as the reference set. (f-h) Pairwise module overlaps between 3 of the 4 algorithms compared in figure 1 (GLASSO yielded too many modules to visualize here). (i) t-SNE embedding of gene features from whole-brain tensor decomposition, colored by DBSCAN clusters. (j) As (i), but colored and annotated with whole-brain modules. (l,m) Overlap between whole-brain consensus and tensor-decomposition + DBSCAN modules. Color scheme as in (f-h). (n) Standard boxplot (box: quartiles, whiskers: 1.5xIQR, bootstrap re-samplings) of within-module recall values for hub-gene co-clustering, demonstrating that at 100 samples, the recall is above 50% for most modules.
Extended Data Figure 2:
(a) Cell-type marker enrichment for brain-wide modules, extended with markers of microglial activation and deactivation, and markers of reactive gliosis and A1/A2 reactive astrocytes. (b) Plots of the marginal rate (solid: mean, shade: 95% CI of GAM) of LoF-intolerant (pLI>0.9) genes, as a function of BW-M1 (most enriched) and BW-M2 (most depleted) kME. (c) Gene ontology enrichment for BW-M5. (d) Marginal LoF-intolerance rates (solid: mean, shade: 95% CI of GAM), by gene kME, for neuronal subtype modules. (e,f) Standard boxplots (box: quartiles, whiskers: 1.5xIQR) of module mean topological overlap, and gene expression, for 5 whole-brain modules in ASD cases and matched controls (Parikshak 2016). The case/control difference in lncRNA is closely matched by the same difference in randomly-selected, matched coding genes. (g) LoF-intolerance enrichment for neuronal subtype modules, using pLI and o/e bins as response variables, and a linear model correcting for gene GC and length (logit link, p-values: coefficient T-test). All modules except BROD-M8 show strong enrichment, and BROD-M8 shows enrichment when using soft-membership instead of hard membership.
Extended Data Figure 3:
(a) Replicate of main figure 3(b) in astrocytes, showing a strong positive relationship between astrocyte module membership, and relative expression in astrocyte cells. (b-e) Relationship between module kME and cell type relative expression for transcripts across 4 neuron/astrocyte isoform switch genes, demonstrating concordance between high kME, and high relative expression. (f) Unsigned Fisher’s exact test of the contingency of “assigned to module” and “top-ranked cell type marker” for varying kME thresholds for (left) oligodendrocytes and (right) astrocytes; for marker rankings based on both absolute and relative expression within the cell-sorted data. Thresholds in the range 0.45–0.55 appear to balance significance and odds ratio across absolute and relative rankings.
Extended Data Figure 4:
(left) Unmodified Western Blot corresponding to figure 3 (right) Same blot, annotated with source of input material
Extended Data Figure 5:
(a-d) Overlaps between published modules and the consensus whole-brain co-expression modules identified in this paper, demonstrating that the majority of modules show a high overlap, particularly to the neuronal module BW-M4. P-values: signed Fisher’s exact test. These modules were selected because of published enrichment for neuropsychiatric disease risk genes. (see methods).
Extended Data Figure 6:
(a) Signed gene ontology enrichments (logistic regression controlling for gene length and GC, p-value from coefficient T-test) for module set BW-M4 across all regions in which a BW-M4 module is present. (b) Meta-GSEA scores for significant MAGMA genes in BW-M4 across all tissues, implicating synaptic transmission and calcium transport as neuronal dysfunctions in SCZ.
Extended Data Figure 7:
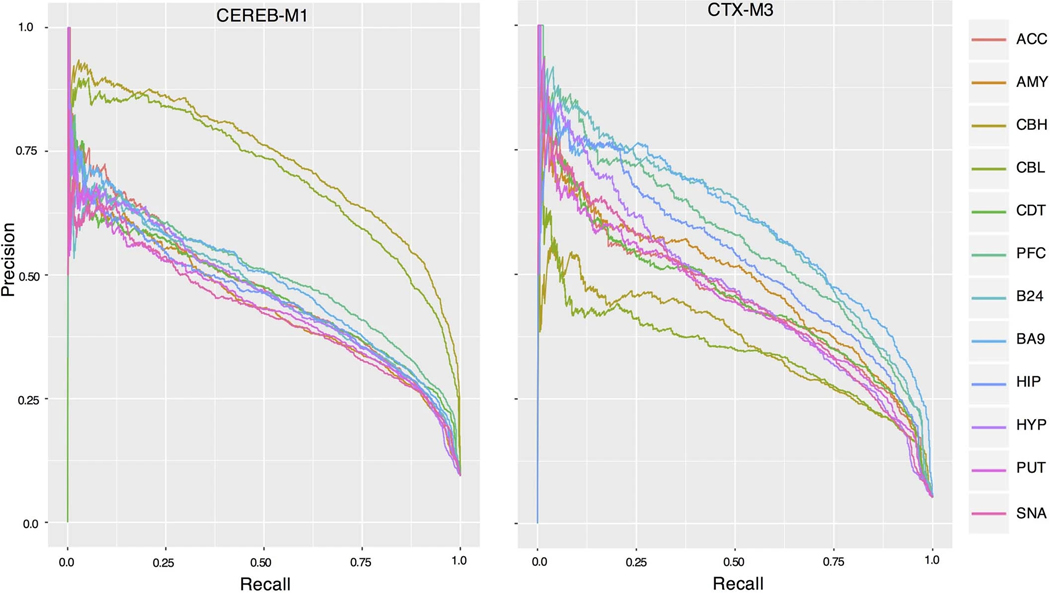
Nearest-neighbor precision-recall curves for CEREB-M1 labels across all region-level co-expression networks; showing significantly higher AUPR for cerebellar regions, but substantial AUPR for all remaining regions. Right. Nearest-neighbor precision-recall curves for CTX-M3.
Extended Data Figure 8:
Plot of Phi statistics for InWeb brain PPI network (“PPI”) and four regulatorycircuits.org (“RC”) networks: Hippocampus (“Hippo”), amygdala (“Amy”), NEU+ neurons, astrocytes, and neuroprogenitor cells (“NPC”). Vertical breaks represent the study used to calculate phi, while the colors represent those studies used to define proposal core genes, or network central genes.
Supplementary Material
Acknowledgements
DHG, CH and GR were supported by NIMH R01MH110927 and U01MH115746 as well as the Simons Foundation Autism Research Initiative and GR was supported by NIMH 1F32MH114620. KL and GP are supported by institutional funding from the Stanley Center for Psychiatric Research at the Broad Institute, the National Institute of Mental Health (R01 MH109903 and U01 MH121499), the Simons Foundation Autism Research Initiative (awards 515064 and 735604), the Lundbeck Foundation (R223-2016-721 and R350-2020-963). AB AS and PP were supported by NIMH R01MH110927. We thank members of the Geschwind, Lage and Battle labs for stimulating discussions. We are also grateful for data made publicly available by the GTEx consortium and Sandeep Deverasetty for creating the HUBgene web browser.
Footnotes
Competing interests statement
The authors declare that they have no competing interests.
References Cited
- 1.Smoller JW; Andreassen OA; Edenberg HJ; Faraone SV; Glatt SJ & Kendler KS Psychiatric genetics and the structure of psychopathology. Mol. Psychiatry, 2018 [DOI] [PMC free article] [PubMed]
- 2.Félix M-A & Barkoulas M. Pervasive robustness in biological systems. Nature Reviews Genetics 16, 483–496 (2015). [DOI] [PubMed] [Google Scholar]
- 3.Parikshak NN, Gandal MJ & Geschwind DH Systems biology and gene networks in neurodevelopmental and neurodegenerative disorders. Nature Reviews Genetics 16, 441–458 (2015). [DOI] [PMC free article] [PubMed] [Google Scholar]
- 4.Gandal MJ et al. Shared molecular neuropathology across major psychiatric disorders parallels polygenic overlap. Science 359, 693–697 (2018). [DOI] [PMC free article] [PubMed] [Google Scholar]
- 5.Horn H. et al. NetSig: network-based discovery from cancer genomes. Nature Methods 15, 61–66 (2017). [DOI] [PMC free article] [PubMed] [Google Scholar]
- 6.Mostafavi S. et al. Parsing the Interferon Transcriptional Network and Its Disease Associations. Cell 164, 564–578 (2016). [DOI] [PMC free article] [PubMed] [Google Scholar]
- 7.Oldham MC et al. Functional organization of the transcriptome in human brain. Nature Neuroscience 11, 1271–1282 (2008). [DOI] [PMC free article] [PubMed] [Google Scholar]
- 8.Parikshak NN, Gandal MJ, & Geschwind DH Systems biology and gene networks in neurodevelopmental and neurodegenerative disorders. Nature Reviews Genetics, 16(8), 441–458 (2015) [DOI] [PMC free article] [PubMed] [Google Scholar]
- 9.GTEx Consortium. Genetic effects on gene expression across human tissues. Nature 550, 204–213 (2017). Nature 2017 [DOI] [PMC free article] [PubMed] [Google Scholar]
- 10.Boyle EA, Li YI & Pritchard JK An Expanded View of Complex Traits: From Polygenic to Omnigenic. Cell 169, 1177–1186 (2017). [DOI] [PMC free article] [PubMed] [Google Scholar]
- 11.Kelley KW, Nakao-Inoue H, Molofsky AV & Oldham MC Variation among intact tissue samples reveals the core transcriptional features of human CNS cell classes. Nature Neuroscience 21, 1171–1184 (2018). [DOI] [PMC free article] [PubMed] [Google Scholar]
- 12.McKenzie AT et al. Brain Cell Type Specific Gene Expression and Co-expression Network Architectures. Scientific Reports 8, (2018). [DOI] [PMC free article] [PubMed] [Google Scholar]
- 13.Wang H-Y et al. Rate of Evolution in Brain-Expressed Genes in Humans and Other Primates. PLoS Biology 5, e13 (2006). [DOI] [PMC free article] [PubMed] [Google Scholar]
- 14.Shohat S, Ben-David E. & Shifman S. Varying Intolerance of Gene Pathways to Mutational Classes Explain Genetic Convergence across Neuropsychiatric Disorders. Cell Reports 18, 2217–2227 (2017). [DOI] [PubMed] [Google Scholar]
- 15.Shohat S, Ben-David E. & Shifman S. Varying Intolerance of Gene Pathways to Mutational Classes Explain Genetic Convergence across Neuropsychiatric Disorders. Cell Reports 18, 2217–2227 (2017). [DOI] [PubMed] [Google Scholar]
- 16.Lek M. et al. Analysis of protein-coding genetic variation in 60,706 humans. Nature 536, 285–291 (2016). [DOI] [PMC free article] [PubMed] [Google Scholar]
- 17.Parikshak NN; Swarup V; Belgard TG; Irimia M; Ramaswami G; Gandal MJ; Hartl C; Leppa V; de la Torre Ubieta L; Huang J; Lowe JK; Blencowe BJ; Horvath S. & Geschwind DH Genome-wide changes in lncRNA, splicing, and regional gene expression patterns in autism. Nature, 2016 [DOI] [PMC free article] [PubMed]
- 18.Gandal MJ, Zhang P, Hadjimichael E, Walker RL, Xia Y, et al. Transcriptome-wide isoform-level dysregulation in ASD, schizophrenia, and bipolar disorder. Science, 362(6420) (2018) [DOI] [PMC free article] [PubMed] [Google Scholar]
- 19.Bennett V. & Lorenzo DN An Adaptable Spectrin/Ankyrin-Based Mechanism for Long-Range Organization of Plasma Membranes in Vertebrate Tissues. in Current Topics in Membranes 143–184 (Elsevier, 2016). [DOI] [PubMed] [Google Scholar]
- 20.Dörrbaum AR, Kochen L, Langer JD & Schuman EM Local and global influences on protein turnover in neurons and glia. eLife 7, (2018). [DOI] [PMC free article] [PubMed] [Google Scholar]
- 21.Schizophrenia Working Group of the Psychiatric Genomics Consortium. Biological insights from 108 schizophrenia-associated genetic loci. Nature, 511(7510), 421–427. (2014) [DOI] [PMC free article] [PubMed] [Google Scholar]
- 22.Pardiñas AF et al. Common schizophrenia alleles are enriched in mutation-intolerant genes and in regions under strong background selection. Nature Genetics 50, 381–389 (2018). [DOI] [PMC free article] [PubMed] [Google Scholar]
- 23.Battista D, Ferrari CC, Gage FH & Pitossi FJ Neurogenic niche modulation by activated microglia: transforming growth factor β increases neurogenesis in the adult dentate gyrus. European Journal of Neuroscience 23, 83–93 (2006). [DOI] [PubMed] [Google Scholar]
- 24.Phoenix TN & Temple S. Spred1, a negative regulator of Ras-MAPK-ERK, is enriched in CNS germinal zones, dampens NSC proliferation, and maintains ventricular zone structure. Genes & Development 24, 45–56 (2010). [DOI] [PMC free article] [PubMed] [Google Scholar]
- 25.Parikshak N; Luo R; Zhang A; Won H; Lowe J; Chandran V; Horvath S. & Geschwind D. Integrative Functional Genomic Analyses Implicate Specific Molecular Pathways and Circuits in Autism Cell, 2013 [DOI] [PMC free article] [PubMed]
- 26.Selimbeyoglu A, Kim CK, Inoue M, Lee SY, Deisseroth K, et al. Modulation of prefrontal cortex excitation/inhibition balance rescues social behavior inCNTNAP2-deficient mice. Science Translational Medicine, 9(401), eaah6733 (2017) [DOI] [PMC free article] [PubMed] [Google Scholar]
- 27.Nelson SB, & Valakh V. Excitatory/Inhibitory Balance and Circuit Homeostasis in Autism Spectrum Disorders. Neuron, 87(4), 684–698 (2015). [DOI] [PMC free article] [PubMed] [Google Scholar]
- 28.Wang D; Liu S; Warrell J; Won H; Shi X; Navarro FCP; Clarke D; Gu M; Emani P; Yang YT; Xu M; Gandal MJ; Lou S; Zhang J; Park JJ; Yan C; Rhie SK; Manakongtreecheep K; Zhou H; Nathan A; Peters M; Mattei E; Fitzgerald D; Brunetti T; Moore J; Jiang Y; Girdhar K; Hoffman GE; Kalayci S; Gümüş ZH; Crawford GE; Roussos P; Akbarian S; Jaffe AE; White KP; Weng Z; Sestan N; Geschwind DH; Knowles JA & Gerstein MB Comprehensive functional genomic resource and integrative model for the human brain. Science, 2018 [DOI] [PMC free article] [PubMed]
- 29.Boulting GL, Durresi E, Ataman B, Sherman MA, Greenberg ME, et al. Activity-dependent regulome of human GABAergic neurons reveals new patterns of gene regulation and neurological disease heritability. Nature Neuroscience (2021). [DOI] [PMC free article] [PubMed]
- 30.Schanzenbächer CT, Langer JD & Schuman EM Time- and polarity-dependent proteomic changes associated with homeostatic scaling at central synapses. eLife 7, (2018). [DOI] [PMC free article] [PubMed] [Google Scholar]
- 31.Marbach D. et al. Tissue-specific regulatory circuits reveal variable modular perturbations across complex diseases. Nature Methods 13, 366–370 (2016). [DOI] [PMC free article] [PubMed] [Google Scholar]
- 32.Wray NR, Wijmenga C, Sullivan PF, Yang J. & Visscher PM Common Disease Is More Complex Than Implied by the Core Gene Omnigenic Model. Cell 173, 1573–1580 (2018). [DOI] [PubMed] [Google Scholar]
- 33.Miller JA, Oldham MC, & Geschwind DH A Systems Level Analysis of Transcriptional Changes in Alzheimer’s Disease and Normal Aging. Journal of Neuroscience, 2008. [DOI] [PMC free article] [PubMed]
- 34.Voineagu I, Wang X, Johnston P, Lowe JK, Tian Y, Horvath S, et al. Transcriptomic analysis of autistic brain reveals convergent molecular pathology. Nature, 2011. [DOI] [PMC free article] [PubMed]
- 35.Fromer M, Roussos P, Sieberts SK, Johnson JS, Kavanagh DH, Perumal TM, et al. Gene expression elucidates functional impact of polygenic risk for schizophrenia. Nature Neuroscience, 2016. [DOI] [PMC free article] [PubMed]
- 36.Wang Q, Zhang Y, Wang M. et al. The landscape of multiscale transcriptomic networks and key regulators in Parkinson’s disease. Nat Commun. 2019 [DOI] [PMC free article] [PubMed]
- 37.Kelley KW, Nakao-Inoue H, Molofsky AV & Oldham MC Variation among intact tissue samples reveals the core transcriptional features of human CNS cell classes. Nature Neuroscience 21, 1171–1184 (2018). [DOI] [PMC free article] [PubMed] [Google Scholar]
- 38.Miller JA, Horvath S. & Geschwind DH Divergence of human and mouse brain transcriptome highlights Alzheimer disease pathways. Proceedings of the National Academy of Sciences 107, 12698–12703 (2010). [DOI] [PMC free article] [PubMed] [Google Scholar]
- 39.Howrigan DP, Rose SA, Samocha KE, Fromer M, Neale BM, et al. Exome sequencing in schizophrenia-affected parent–offspring trios reveals risk conferred by protein-coding de novo mutations. Nature Neuroscience, 23(2), 185–193 (2020) [DOI] [PMC free article] [PubMed] [Google Scholar]
- 40.Pers TH et al. Comprehensive analysis of schizophrenia-associated loci highlights ion channel pathways and biologically plausible candidate causal genes. Human Molecular Genetics 25, 1247–1254 (2016). [DOI] [PMC free article] [PubMed] [Google Scholar]
- 41.Sanders SJ, He X, Willsey AJ, Ercan-Sencicek AG, State MW, et al. Insights into Autism Spectrum Disorder Genomic Architecture and Biology from 71 Risk Loci. Neuron, 87(6), 1215–1233. (2015) [DOI] [PMC free article] [PubMed] [Google Scholar]
- 42.Skene NG et al. Genetic identification of brain cell types underlying schizophrenia. Nature Genetics 50, 825–833 (2018). [DOI] [PMC free article] [PubMed] [Google Scholar]
- 43.Ruzzo EK, Pérez-Cano L, Jung J-Y, Wang L, Geschwind DH, Wall DP, et al. Inherited and De Novo Genetic Risk for Autism Impacts Shared Networks. Cell, 178(4), 850–866.e26 (2019) [DOI] [PMC free article] [PubMed] [Google Scholar]
- 44.Wang Q. et al. A Bayesian framework that integrates multi-omics data and gene networks predicts risk genes from schizophrenia GWAS data. Nature Neuroscience 22, 691–699 (2019). [DOI] [PMC free article] [PubMed] [Google Scholar]
- 45.Walker RL, Ramaswami G, Hartl C, Mancuso N, Geschwind DH, et al. Genetic Control of Expression and Splicing in Developing Human Brain Informs Disease Mechanisms. Cell, 179(3), 750–771.e22. (2019) [DOI] [PMC free article] [PubMed] [Google Scholar]
- 46.Satterstrom FK, Kosmicki JA, Wang J, Breen MS, Walters RK, et al. Large-Scale Exome Sequencing Study Implicates Both Developmental and Functional Changes in the Neurobiology of Autism. Cell, 180(3), 568–584.e23 (2020) [DOI] [PMC free article] [PubMed] [Google Scholar]
- 47.Polioudakis D, de la Torre-Ubieta L, Langerman J, Elkins AG, Geschwind DH, et al. A Single-Cell Transcriptomic Atlas of Human Neocortical Development during Mid-gestation. Neuron, 103(5), 785–801.e8 (2019) [DOI] [PMC free article] [PubMed] [Google Scholar]
- 48.Nicholson-Fish JC, Kokotos AC, Gillingwater TH, Smillie KJ & Cousin MA VAMP4 Is an Essential Cargo Molecule for Activity-Dependent Bulk Endocytosis. Neuron 88, 973–984 (2015). [DOI] [PMC free article] [PubMed] [Google Scholar]
- 49.Kokotos AC, Peltier J, Davenport EC, Trost M. & Cousin MA Activity-dependent bulk endocytosis proteome reveals a key presynaptic role for the monomeric GTPase Rab11. Proceedings of the National Academy of Sciences 115, E10177–E10186 (2018). [DOI] [PMC free article] [PubMed] [Google Scholar]
- 50.Doll CA & Broadie K. Impaired activity-dependent neural circuit assembly and refinement in autism spectrum disorder genetic models. Frontiers in Cellular Neuroscience 8, (2014). [DOI] [PMC free article] [PubMed] [Google Scholar]
- 51.Dobin A; Davis CA; Schlesinger F; Drenkow J; Zaleski C; Jha S; Batut P; Chaisson M & Gingeras T. STAR: untrafast and universal RNA-seq aligner Bioinformatics, 2013 [DOI] [PMC free article] [PubMed]
- 52.Nieuwenhuis TO, Yang SY, Verma RX, Pillalamarri V, Arking DE, Rosenberg AZ, McCall MN, & Halushka MK Consistent RNA sequencing contamination in GTEx and other data sets. Nature Communications, 2020 [DOI] [PMC free article] [PubMed]
- 53.Battle A; Brown CD; Engelhardt BE & Montgomery SB Genetic effects on gene expression across human tissues Nature, Nature Publishing Group, 2017 [Google Scholar]
- 54.Pedregosa F; Varoquax G; Gramfort A; Michel V; Thirion B; Grisel O; Blondel M; Prettenhofer P; Weiss R; Dubourg V; Vanderplas J; Passos A & Cournapeu D Scikit-learn: Machine Learning in Python JMLR, 2011
- 55.Langfelder P. & Horvath S. WGCNA: an R package for weighted correlation network analysis BMC Bioinformatics, 2008 [DOI] [PMC free article] [PubMed]
- 56.Langfelder P; Luo R; Oldham M & Horvath S. Is My Network Module Preserved and Reproducible? PLoS Comp. Biol, 2011 [DOI] [PMC free article] [PubMed]
- 57.Crow M; Paul A; Ballouz S; Huang ZJ & Gillis J. Characterizing the replicability of cell types defined by single cell RNA-sequencing data using MetaNeighbor Nature Communications, Springer US, 2018 [DOI] [PMC free article] [PubMed] [Google Scholar]
- 58.Nehme R, Zuccaro E, Ghosh SD, et al. Combining NGN2 Programming with Developmental Patterning Generates Human Excitatory Neurons with NMDAR-Mediated Synaptic Transmission. Cell Rep. 2018;23(8):2509–2523. doi: 10.1016/j.celrep.2018.04.066 [DOI] [PMC free article] [PubMed] [Google Scholar]
- 59.Tychele N. Turner Qian Yi, Eichler EE, et al. denovo-db: a compendium of human de novo variants Nucleic Acids Research, 2016 [DOI] [PMC free article] [PubMed]
- 60.Ruzzo EK; Perez-Cano L; Jung JY; Wang L; Kashef-Haghighi D; Hartl C; Hoekstra J; Leventhal O; Gandal J; Paskov K; Stockham N; Polioudakis D; Lowe JK; Geschwind DH & Wall DP Whole genome sequencing in multiplex families reveals novel inerited and de novo genetic risk in autism bioRxiv, 2018
- 61.de Leeuw CA; Mooij JM; Heskes T & Posthuma D. MAGMA: Generalized Gene-Set Analysis of GWAS Data PLOS Comp. Biol., 2015 [DOI] [PMC free article] [PubMed]
- 62.Won H, Huang J, Opland CK, Hartl CL, & Geschwind DH (2019). Human evolved regulatory elements modulate genes involved in cortical expansion and neurodevelopmental disease susceptibility. Nature communications, 10(1), 2396. 10.1038/s41467-019-10248-3 [DOI] [PMC free article] [PubMed] [Google Scholar]
- 63.Schork AJ, Won H, Appadurai V, Nudel R, Gandal M, Delaneau O, Revsbech Christiansen M, Hougaard DM, Bækved-Hansen M, Bybjerg-Grauholm J, Giørtz Pedersen M, Agerbo E, Bøcker Pedersen C, Neale BM, Daly MJ, Wray NR, Nordentoft M, Mors O, Børglum AD, Bo Mortensen P, … Werge T. (2019). A genome-wide association study of shared risk across psychiatric disorders implicates gene regulation during fetal neurodevelopment. Nature neuroscience, 22(3), 353–361. 10.1038/s41593-018-0320-0 Schork, A. J., Won, H., Appadurai, V., Nudel, R., Gandal, M., Delaneau, O., Revsbech Christiansen, M., Hougaard, D. M., Bækved-Hansen, M., Bybjerg-Grauholm, J., Giørtz Pedersen, M., Agerbo, E., Bøcker Pedersen, C., Neale, B. M., Daly, M. J., Wray, N. R., Nordentoft, M., Mors, O., Børglum, A. D., Bo Mortensen, P., … Werge, T. (2019). A genome-wide association study of shared risk across psychiatric disorders implicates gene regulation during fetal neurodevelopment. Nature neuroscience, 22(3), 353–361. 10.1038/s41593-018-0320-0 [DOI] [PMC free article] [PubMed] [Google Scholar]
- 64.Cross-Disorder Group of the Psychiatric Genomics Consortium (2013). Identification of risk loci with shared effects on five major psychiatric disorders: a genome-wide analysis. Lancet (London, England), 381(9875), 1371–1379. 10.1016/S0140-6736(12)62129-1 [DOI] [PMC free article] [PubMed] [Google Scholar]
- 65.Lambert JC, Ibrahim-Verbaas CA, Harold D, Naj AC, Sims R, Bellenguez C, DeStafano AL, Bis JC, Beecham GW, Grenier-Boley B, Russo G, Thorton-Wells TA, Jones N, Smith AV, Chouraki V, Thomas C, Ikram MA, Zelenika D, Vardarajan BN, Kamatani Y, … Amouyel P. (2013). Meta-analysis of 74,046 individuals identifies 11 new susceptibility loci for Alzheimer’s disease. Nature genetics, 45(12), 1452–1458. 10.1038/ng.2802 [DOI] [PMC free article] [PubMed] [Google Scholar]
- 66.Andlauer TF, Buck D, Antony G, Bayas A, Bechmann L, Berthele A, Chan A, Gasperi C, Gold R, Graetz C, Haas J, Hecker M, Infante-Duarte C, Knop M, Kümpfel T, Limmroth V, Linker RA, Loleit V, Luessi F, Meuth SG, … Müller-Myhsok B. (2016). Novel multiple sclerosis susceptibility loci implicated in epigenetic regulation. Science advances, 2(6), e1501678. 10.1126/sciadv.1501678 [DOI] [PMC free article] [PubMed] [Google Scholar]
- 67.Okbay A, Beauchamp JP, Fontana MA, Lee JJ, Pers TH, Rietveld CA, Turley P, Chen GB, Emilsson V, Meddens SF, Oskarsson S, Pickrell JK, Thom K, Timshel P, de Vlaming R, Abdellaoui A, Ahluwalia TS, Bacelis J, Baumbach C, Bjornsdottir G, … Benjamin DJ (2016). Genome-wide association study identifies 74 loci associated with educational attainment. Nature, 533(7604), 539–542. 10.1038/nature17671 [DOI] [PMC free article] [PubMed] [Google Scholar]
- 68.Nguyen HT, Bryois J, Kim A, Dobbyn A, Huckins LM, Munoz-Manchado AB, … Stahl EA (2017). Integrated Bayesian analysis of rare exonic variants to identify risk genes for schizophrenia and neurodevelopmental disorders. Genome Medicine, 9(1). 10.1186/s13073-017-0497-y [DOI] [PMC free article] [PubMed] [Google Scholar]
- 69.Ruzzo EK, Pérez-Cano L, Jung J-Y, Wang L, Kashef-Haghighi D, Hartl C, … Wall DP (2018). Whole genome sequencing in multiplex families reveals novel inherited and de novo genetic risk in autism. Cold Spring Harbor Laboratory. 10.1101/338855 [DOI]
- 70.Du Y, Li Z, Liu Z, Zhang N, Wang R, Li F, … Wu J. Nonrandom occurrence of multiple de novo coding variants in a proband indicates the existence of an oligogenic model in autism. Genetics in Medicine. 2019 [DOI] [PubMed]
- 71.Ionita-Laza I, Lange C, & Laird MN, (2009). Estimating the number of unseen variants in the human genome. Proceedings of the National Academy of Sciences, 106(13), 5008–5013. 10.1073/pnas.0807815106 [DOI] [PMC free article] [PubMed] [Google Scholar]
- 72.Lambert SA, Jolma A, Campitelli LF, Das PK, Yin Y, Albu M, … Weirauch MT (2018). The Human Transcription Factors. Cell, 172(4), 650–665. 10.1016/j.cell.2018.01.029 [DOI] [PubMed] [Google Scholar]
Associated Data
This section collects any data citations, data availability statements, or supplementary materials included in this article.
Supplementary Materials
Data Availability Statement
Processed data is available at http://geschwindlab.org/gclabapps/hubgene/home


