Abstract
Elevated levels of plasma branched-chain amino acids (BCAAs) have been associated with insulin resistance and type 2 diabetes since the 1960s. Pharmacological activation of branched-chain α-ketoacid dehydrogenase (BCKDH), the rate-limiting enzyme of BCAA oxidation, lowers plasma BCAAs and improves insulin sensitivity. Here we show that modulation of BCKDH in skeletal muscle, but not liver, affects fasting plasma BCAAs in male mice. However, despite lowering BCAAs, increased BCAA oxidation in skeletal muscle does not improve insulin sensitivity. Our data indicate that skeletal muscle controls plasma BCAAs, that lowering fasting plasma BCAAs is insufficient to improve insulin sensitivity and that neither skeletal muscle nor liver account for the improved insulin sensitivity seen with pharmacological activation of BCKDH. These findings suggest potential concerted contributions of multiple tissues in the modulation of BCAA metabolism to alter insulin sensitivity.
One in ten people in the United States have diabetes. Of these people, 90–95% have type 2 diabetes (T2D)1, in which insulin resistance (IR) creates a demand for insulin that is greater than pancreatic capacity to produce insulin, leading to hyperglycaemia and many complications, including vision loss, kidney disease and heart disease. The mechanisms by which IR develops are unknown2–8.
Branched-chain amino acids (BCAAs) (valine, leucine, isoleucine) are essential AAs that must be obtained from dietary protein9–11. BCAAs are either used to synthesize new protein or imported into the mitochondria via SLC25A44 and catabolized12. The latter involves transamination by branched-chain amino transferases (BCAT1 and BCAT2) to form branched-chain α-ketoacids (BCKAs) (α-ketoisocaproic acid (α-KIC), α-keto-β-methylvalerate (α-KMV) and α-ketoisovalerate (α-KIV), followed by decarboxylation and dehydrogenation by the rate-limiting branched-chain α-ketoacid dehydrogenase (BCKDH)13–18. BCKDH is inhibited through phosphorylation by the kinase branched-chain ketoacid dehydrogenase kinase (BCKDK)19 and activated through dephosphorylation by the protein phosphatase PP2Cm (encoded by the gene PPM1K)20–22.
Elevated plasma BCAAs have been associated with IR and T2D since the 1960s23,24. Recent studies revealed an association between elevated plasma BCAAs and the development of T2D25–27, and between increased BCAA catabolism and IR28. A genetic Mendelian randomization study supported a causal role for BCAAs in T2D by associating T2D with genetic drivers of expression of PPM1K29. Several research groups showed, using hyperinsulinaemic–euglycaemic clamp (HIEC) studies, that infusion30–32 or ingestion33 of AAs acutely induces IR and that the addition of BCAAs to a high-fat diet (HFD) substantially worsens IR28. Conversely, BCAA restriction sensitizes rodents to insulin34,35. Furthermore, systemic inhibition of BCKDK with the small-molecule 3,6-dichlorobenzo(b)thiophene-2-carboxylic acid (BT2) improves insulin sensitivity in rodent models of IR and T2D36–38. Most recently, a human study demonstrated that treatment of T2D with sodium phenylbutyrate, an analogue of BT2 that inhibits BCKDK at the same allosteric site39, lowers plasma BCAAs and improves insulin sensitivity40. Despite these studies, the mechanisms by which BCAAs and their catabolism contribute to IR are unclear41.
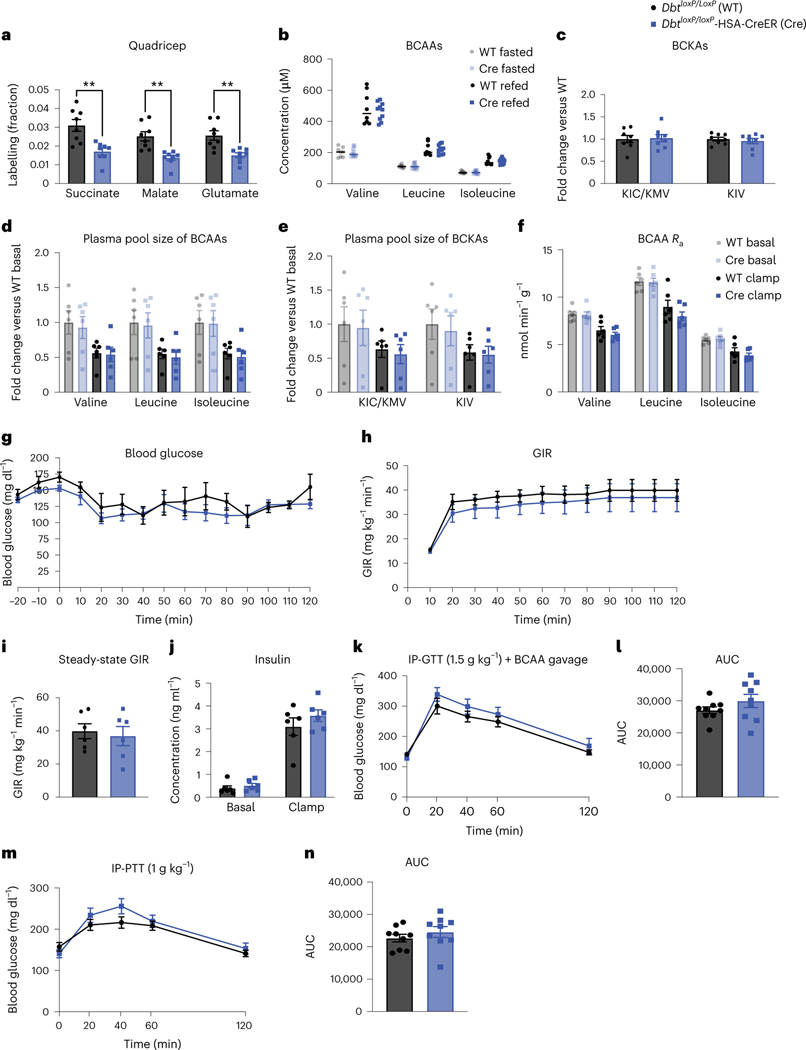
Recent work from our laboratory and other researchers implicated whole-body redistribution of BCAA catabolism towards skeletal muscle (SM) as a potential driver of IR. Steady-state in vivo isotopic tracing showed that the majority of BCAA oxidation occurs in SM, and in the db/db mouse model of IR and T2D42, BCAA oxidation is skewed towards SM and away from liver and adipose tissue36. Excess BCAA oxidation in SM may cause intramuscle accumulation of incompletely oxidized fatty acids, a driver of IR43,44, through elevated production of 3-hydroxyisobutyrate (3-HIB), a catabolic intermediate of valine that promotes fatty acid uptake in muscle45. Conversely, promoting liver BCAA catabolism in Zucker fatty rats (ZFRs), another model of IR and T2D, through adenovirus-mediated delivery of Ppm1k to increase BCKDH activity, lowered hepatic triglycerides and improved insulin sensitivity, potentially by indirectly reducing BCAA catabolic flux in SM37. These data suggest that elevated BCAA oxidation in SM, in part caused by shunting of BCAA oxidation away from liver, promotes the development of IR41. To test this hypothesis, we generated new alleles of Bckdk and Dbt (the gene that encodes the E2 component of the BCKDH complex17,18) flanked by loxP and evaluated glucose homeostasis in SM and liver-specific BCKDH gain-of-function (Bckdk knockout) and loss-of-function (Dbt knockout) mice.
Results
Systemic BCAA oxidation improves insulin sensitivity
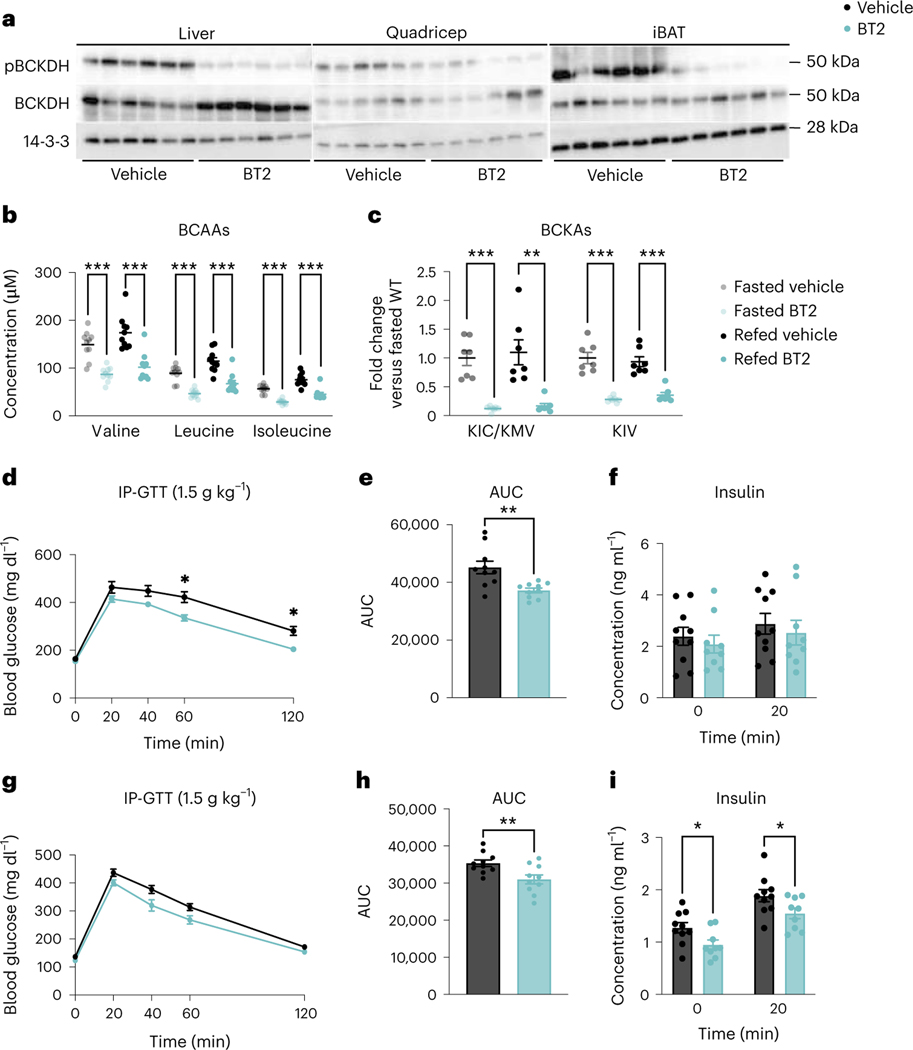
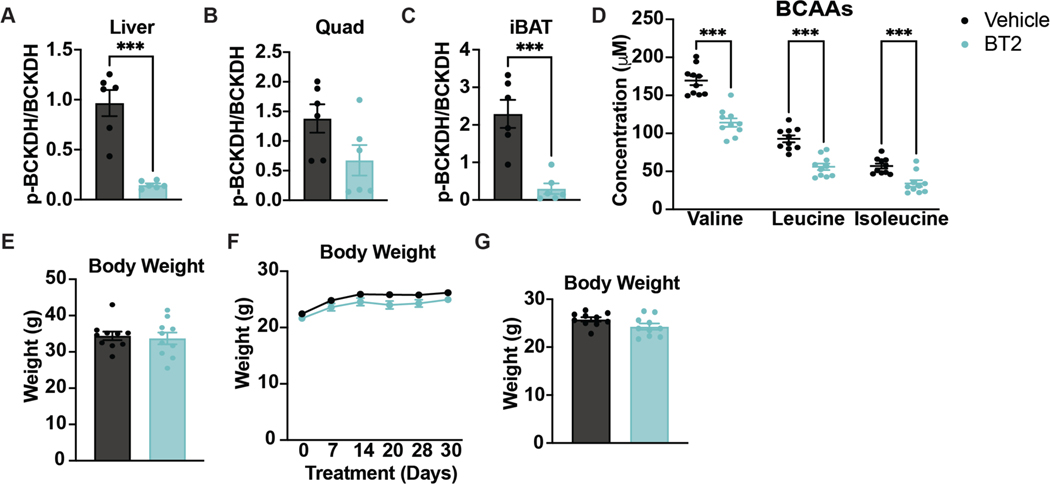
Other groups have shown that systemic activation of BCAA oxidation with BT2 protects against glucose intolerance37,38. We sought to validate these findings and test how rapidly BT2 acts to improve insulin sensitivity. Acute BT2 treatment suppressed phosphorylation of BCKDH (pBCKDH) across multiple tissues, compared to tissues from vehicle-treated mice (Fig. 1a and Extended Data Fig. 1a–c). Plasma BCAA concentrations were significantly lower in mice treated with BT2 either acutely or chronically compared to mice that received vehicle in fasted and refed states (Fig. 1b and Extended Data Fig. 1d). Circulating BCKAs were also significantly lower in BT2-treated mice compared to vehicle-treated mice in fasted and refed states (Fig. 1c). We next fed mice HFD for 5 weeks and treated them with BT2 or vehicle, either acutely or chronically. Both treatments significantly improved glucose clearance during a glucose tolerance test (GTT), with an approximate 20% reduction in the area under the curve (AUC) and a significant reduction in the insulin response after chronic BT2 treatment (Fig. 1d–i). There were no body weight differences between groups (Extended Data Fig. 1e–g). We concluded that BT2 partially reverses the IR instigated by HFD, and the effect of BT2 is rapid.
Fig. 1 |. Systemic BCAA oxidation improves insulin sensitivity.
a, Western blotting of tissues from n = 6 vehicle and n = 6 BT2-treated mice (14-3-3 is the loading control). b,c, Plasma BCAA concentrations (n = 10 vehicle and n = 10 BT2-treated) (b) and plasma BCKA levels (n = 10 vehicle and n = 10 BT2-treated) (c) in mice fasted for 5 h or refed for 2 h after overnight fasting. d, Intraperitoneal GTT (IP-GTT, 1.5 g kg−1) in mice fasted for 5 h after acute BT2 treatment; n = 10 vehicle and n = 10 BT2-treated mice on HFD for 5 weeks. e, AUC for the GTT in d. f, Insulin concentration at t = 0 and t = 20 (n = 10 vehicle and n = 9 BT2-treated mice) during the acute BT2 treatment GTT from d. a–f, Acute BT2 treatment was achieved via gavage with 100 mg kg−1 of either vehicle or BT2 the night before and the morning of the experiment. g, Glucose IP-GTT (1.5 g kg−1) in mice fasted for 5 h after chronic BT2 treatment; n = 10 vehicle and n = 10 BT2-treated mice on HFD for 4 weeks. h, AUC for the GTT in g. i, Insulin concentration at t = 0 and t = 20 min (n = 10 vehicle and n = 9 BT2-treated mice) during chronic BT2 treatment GTT from g. g–i, Chronic BT2 treatment was achieved via 50 mg kg−1 day−1 gavage of mice treated with either vehicle or BT2 for 4 weeks. Mice used for these experiments were male C57BL/6J diet-induced obesity (DIO) mice aged 10–12 weeks and fed HFD for 4–6 weeks. Data are presented as the mean ± s.e.m. When two groups were compared, a two-tailed Student’s t-test was used, with significance defined as *P < 0.05, **P < 0.01 and ***P < 0.001. In the experiments with multiple comparisons at different time points, a repeated measures, two-way analysis of variance (ANOVA) was used with significance defined as *P < 0.05. b, Valine fasted P = 0.000012; valine refed P = 0.000092; leucine fasted P < 0.000001; leucine refed P = 0.000129; isoleucine fasted P < 0.000001; isoleucine refed P = 0.000031. c, KIC/KMV fasted P = 0.000023; KIC/KMV refed P = 0.001194; KIV fasted P = 0.000011; KIV refed P = 0.000062. d, 60 min P = 0.0227; 120 min P = 0.0142. e, P = 0.003179. h, P = 0.009880. i, 0 min P = 0.027731; 20 min P = 0.045392.
Increased SM BCAA oxidation does not affect insulin sensitivity in mice fed normal chow
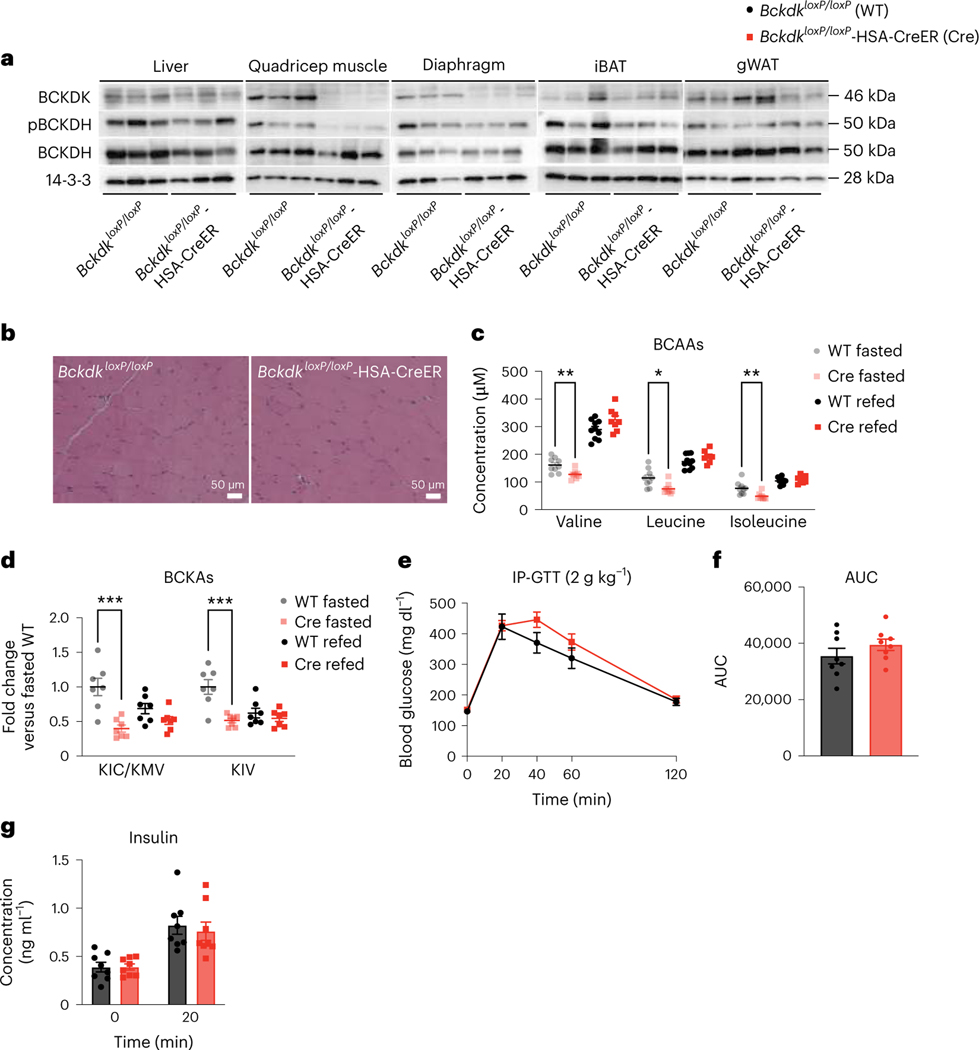
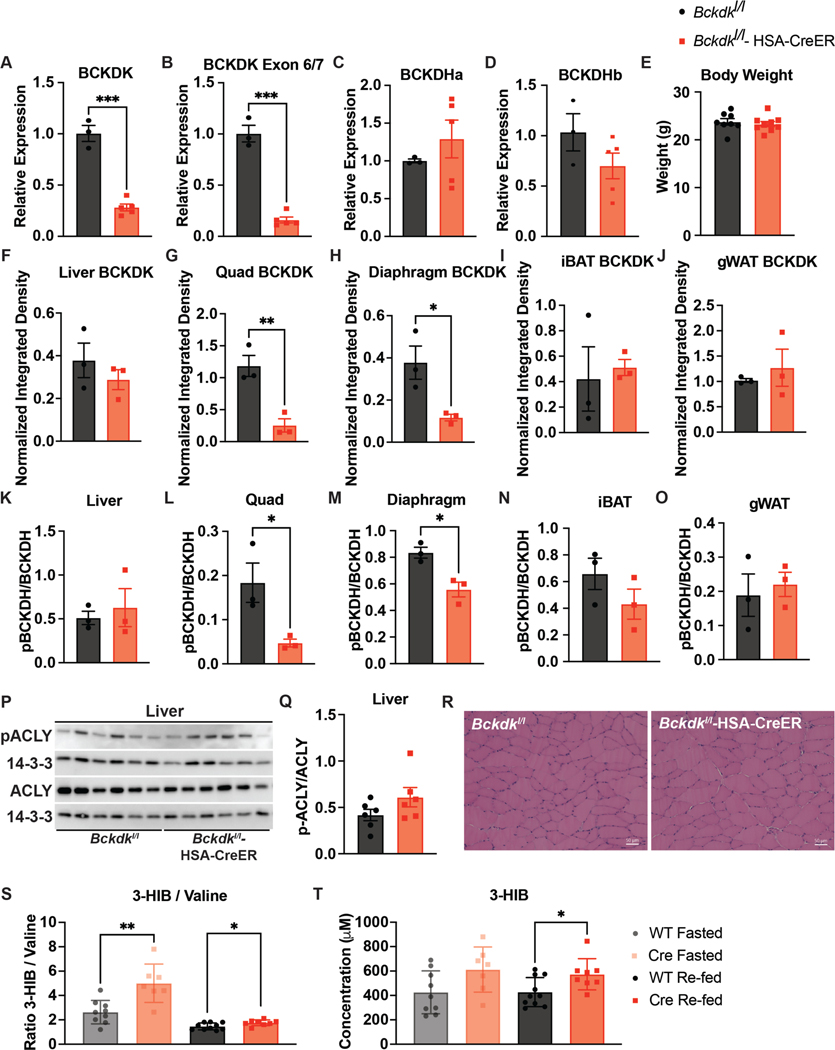
SM is the main site of glucose disposal7 and SM accounts for about 60% of whole-body BCAA oxidation36. We and others hypothesized that increasing oxidation of BCAAs in SM promotes IR36,37,45,46. To test this, we used CRISPR–Cas9 to introduce loxP sites flanking Bckdk into mice and crossed them to mice in which Cre expression is driven by the human skeletal actin (HSA (also known as ACTA1)) promoter, yielding tamoxifen-inducible Bckdk SM knockouts (BckdkloxP/loxP-HSA-CreER). mRNA expression in quadricep (Extended Data Fig. 2a–d) and western blotting confirmed specific deletion of Bckdk in the quadricep and diaphragm from fasted BckdkloxP/loxP-HSA-CreER mice after tamoxifen treatment; mice appeared grossly normal with no changes in body weight (Fig. 2a and Extended Data Fig. 2e–j). Consistent with the role of BCKDK, phosphorylation of BCKDH (pBCKDH) was lower in SM from fasted BckdkloxP/loxP-HSA-CreER mice compared to controls, with no impact on BCKDH mRNA expression or protein (Fig. 2a and Extended Data Fig. 2c,d,k–o). A previous study observed that BCKDK overexpression in rat liver increased phosphorylation of ATP-citrate lyase (ACLY), linking BCAA catabolism and de novo lipogenesis37. However, there was no impact on pACLY or ACLY in fasted livers between groups (Extended Data Fig. 2p,q). Haematoxylin and eosin (H&E) staining of SM was also normal (Fig. 2b and Extended Data Fig. 2r). Plasma BCAAs and BCKAs were significantly lower in BckdkloxP/loxP-HSA-CreER mice compared to controls, confirming the contribution of SM to whole-body BCAA oxidation. Surprisingly, plasma BCAAs and BCKAs in refed mice were not different between groups (Fig. 2c,d). The ratio of circulating 3-HIB and valine was significantly increased in both fasted and refed plasma from BckdkloxP/loxP-HSA-CreER mice compared to controls (Extended Data Fig. 2s), while the concentration of 3-HIB was significantly elevated only in the fed state, which is consistent with elevated catabolic flux (Extended Data Fig. 2t). To test the effect of Bckdk SM knockout on insulin sensitivity, we performed a GTT on BckdkloxP/loxP-HSA-CreER mice and controls, while simultaneously collecting blood to measure insulin concentration. The response to glucose was not different between groups (Fig. 2e,f). Insulin concentrations at baseline and 20 min after glucose challenge were unchanged (Fig. 2g). Despite significantly decreased fasting circulating BCAAs, indicating increased BCAA catabolic flux in SM, BckdkloxP/loxP-HSA-CreER mice were neither more nor less insulin-sensitive than controls on normal chow.
Fig. 2 |. Increased SM BCAA oxidation does not affect insulin sensitivity in mice fed normal chow.
a, Western blotting of tissues collected from n = 3 fasted BckdkloxP/loxP and n = 3 fasted BckdkloxP/loxP-HSA-CreER mice (14-3-3 is the loading control). b, H&E staining of quadricep muscle. Representative images from n = 4 BckdkloxP/loxP and n = 3 BckdkloxP/loxP-HSA-CreER mice. c, Plasma BCAA concentrations in mice fasted for 5 h (n = 9 BckdkloxP/loxP and n = 8 BckdkloxP/loxP-HSA-CreER) or refed for 2 h after overnight fasting (n = 10 BckdkloxP/loxP and n = 8 BckdkloxP/loxP-HSA-CreER). d, Plasma BCKA levels in fasted or refed mice (n = 7 BckdkloxP/loxP and n = 7 BckdkloxP/loxP-HSA-CreER). e, IP-GTT (2 g kg−1) using n = 8 BckdkloxP/loxP and n = 8 BckdkloxP/loxP-HSA-CreER chow-fed mice fasted for 5 h. f, AUC for the GTT in e. g, Insulin concentration at t = 0 and t = 20 min (n = 8 BckdkloxP/loxP and n = 8 BckdkloxP/loxP-HSA-CreER mice) during the GTT from d. The mice used for these experiments were male, 8–10-weeks old and fed normal chow. Data are presented as the mean ± s.e.m. When two groups were compared, a two-tailed Student’s t-test was used, with significance defined as *P < 0.05 and **P < 0.01. In the experiments with multiple comparisons at different time points, a repeated measures, two-way ANOVA was used. c, Valine fasted P = 0.006624; leucine fasted P = 0.012123; isoleucine fasted P = 0.006569. d, KIC/KMV fasted P = 0.000837; KIV fasted P = 0.000859.
Increased SM BCAA oxidation does not affect insulin sensitivity in mice fed a variety of HFDs
HFD supplemented with BCAAs worsens IR compared to HFD alone, but normal chow supplemented with BCAAs has no impact on IR compared to normal chow alone28. Therefore, we challenged BckdkloxP/loxP-HSA-CreER mice with a Western diet and performed an HIEC, the criterion standard measure of insulin sensitivity. We included a simultaneous non-perturbative infusion of [U-13C]-labelled BCAAs to assess the effect of insulin on BCAA turnover and on tissue-specific oxidation of BCAAs. Using liquid chromatography–mass spectrometry (LC–MS) to distinguish heavy-labelled metabolites from unlabelled metabolites, knowing the rate of [U-13C]-labelled BCAA infusion, we calculated the rate of endogenous BCAA appearance (Ra), that is, the amount of BCAAs coming from protein breakdown. (There were no BCAAs coming from protein ingestion because mice were fasted.) Analysis of 13C incorporation into tricarboxylic acid (TCA) cycle intermediates, normalized to the labelling of plasma BCAAs, revealed the relative contribution of BCAA-derived carbons to TCA cycle intermediates, a reflection of BCAA oxidation in each tissue.
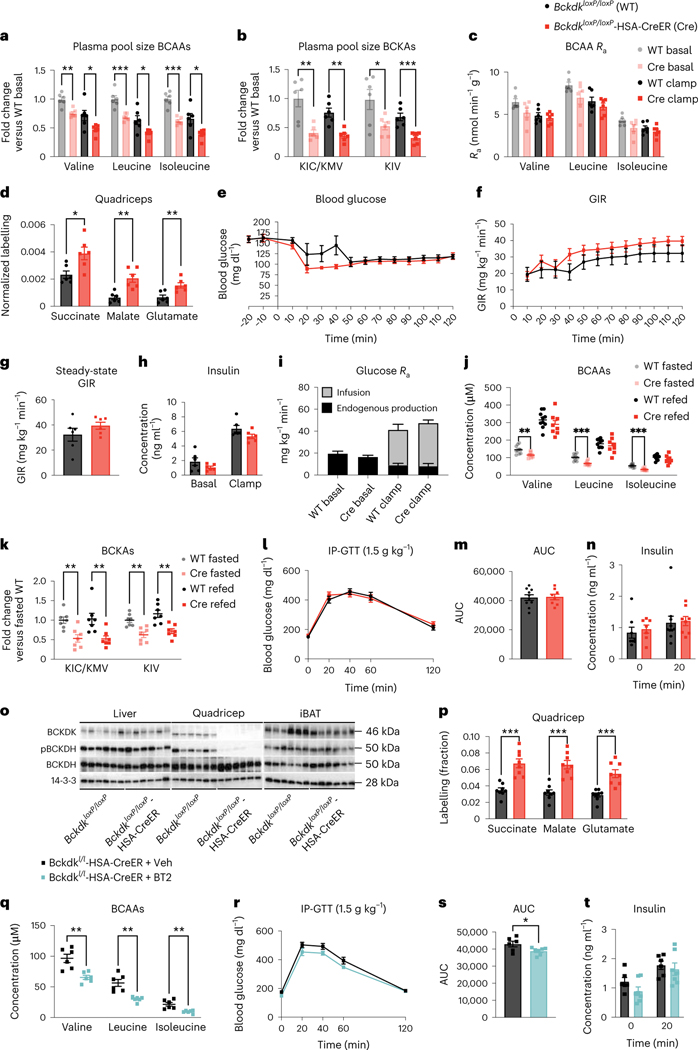
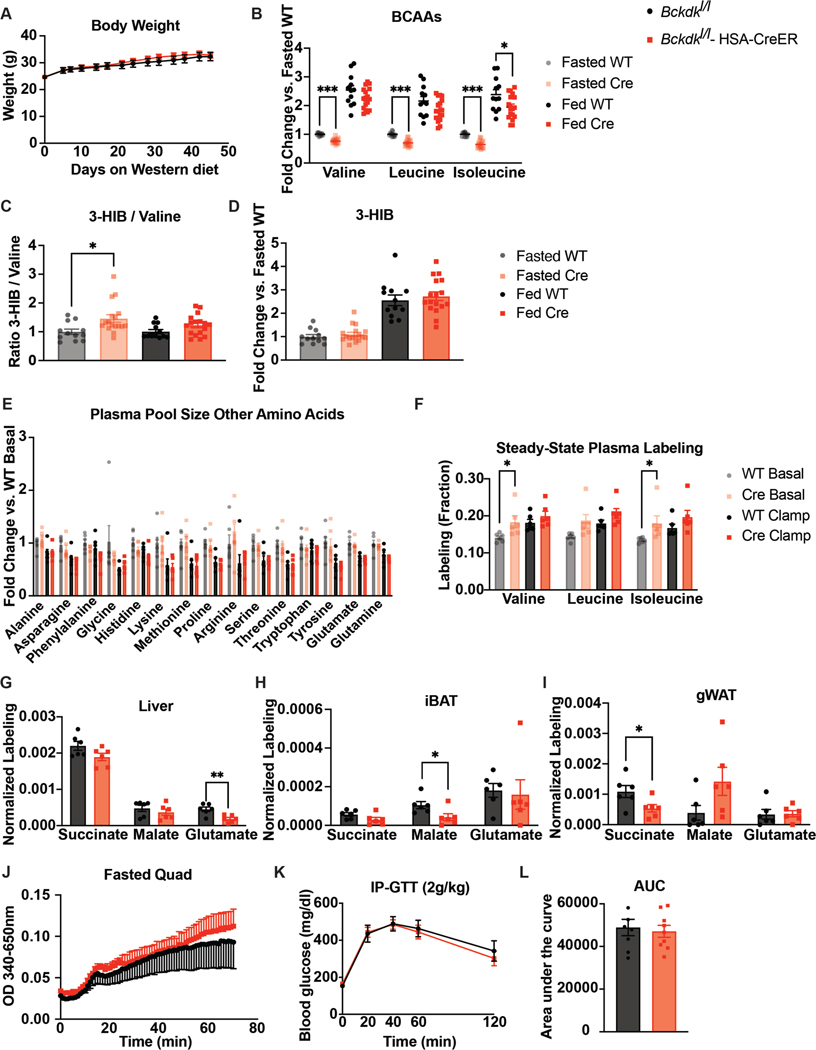
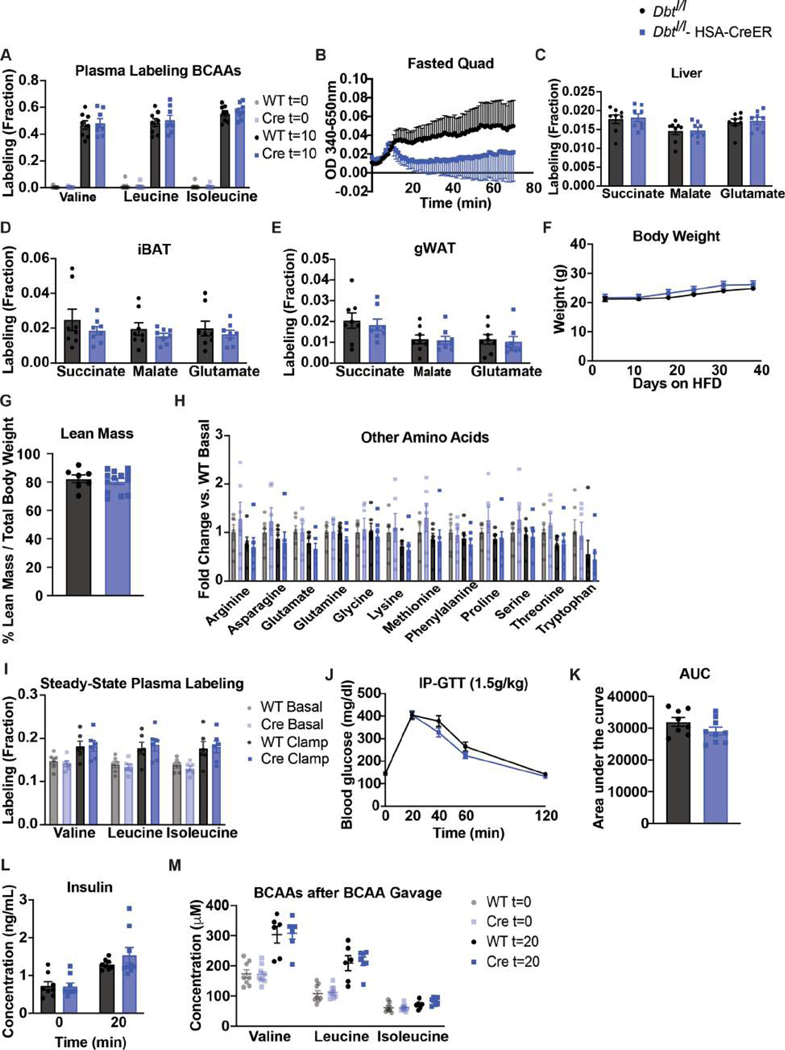
There were no differences in body weight, fed-state plasma BCAAs or 3-HIB between genotypes (Extended Data Fig. 3a–d). BckdkloxP/loxP-HSA-CreER mice on Western diet had significantly lower fasted plasma BCAAs and BCKAs both before (basal) and during (clamp) HIEC (Fig. 3a,b). No differences were observed in the plasma levels of other AAs (Extended Data Fig. 3e). Hyperinsulinaemia during the clamp period lowered plasma BCAAs and BCKAs in both genotypes (Fig. 3a,b), suggesting that this effect of insulin is not mediated through muscle BCKDK. Steady-state plasma labelling was achieved by the end of both the basal and clamp periods (Extended Data Fig. 3f). The rate of appearance (Ra) of plasma BCAAs was not statistically different between BckdkloxP/loxP-HSA-CreER and control mice in either basal or clamp settings, although the Ra of all groups was suppressed by insulin during the clamp (Fig. 3c). There was an approximate 2× increase in relative contribution of labelled BCAAs to the TCA cycle intermediates in fasted quadricep muscle from BckdkloxP/loxP-HSA-CreER mice compared to controls, strongly suggesting increased BCAA oxidation (Fig. 3d). Slight differences in relative BCAA oxidation were noted in liver, interscapular brown adipose tissue (iBAT) and gonadal white adipose tissue (gWAT), all decreasing their relative contribution of BCAA-derived carbons to TCA cycle intermediates, suggesting some interplay between SM, liver and adipose tissue in the regulation of BCAA oxidation (Extended Data Fig. 3g–i). BCKDH activity assays confirmed increased activity in fasted quadricep muscle from BckdkloxP/loxP-HSA-CreER mice compared to controls (Extended Data Fig. 3j). Together, these data confirm that BCAA oxidation is increased in the SM of BckdkloxP/loxP-HSA-CreER mice, which is consistent with the known role of BCKDK.
Fig. 3 |. Increased SM BCAA oxidation does not affect insulin sensitivity in mice fed a variety of HFDs.
a–c, Plasma BCAAs (a), plasma BCKAs (b) and Ra (c) of BCAAs collected during [U-13C]-labelled BCAA steady-state infusion before (basal, fasted for 5 h) and during (clamp, fasted for 7 h) HIEC; n = 6 BckdkloxP/loxP and n = 6 BckdkloxP/loxP-HSA-CreER. d, Normalized labelling of quadricep TCA cycle intermediates by [U-13C]-labelled BCAAs; n = 6 BckdkloxP/loxP and n = 6 BckdkloxP/loxP-HSA-CreER. e, Blood glucose. f, GIR. g, Steady-state GIR during HIEC. h, Insulin before and during HIEC. i, Glucose Ra before and during HIEC; the black bar is the endogenous glucose measured using d-glucose-6,6-d2, while the grey bar is glucose infused during HIEC. e–i, n = 6 BckdkloxP/loxP and n = 6 BckdkloxP/loxP-HSA-CreER. a–i, Mice were male, 20–24-weeks old and fed Western diet for 12 weeks. j, Plasma BCAAs (n = 10 BckdkloxP/loxP and n = 8 BckdkloxP/loxP-HSA-CreER). k, Plasma BCKAs (n = 7 BckdkloxP/loxP and n = 7 BckdkloxP/loxP-HSA-CreER) in mice fasted for 5 h or refed for 2 h after overnight fasting. l, IP-GTT (1.5 g kg−1) in mice fasted for 5 h; n = 10 BckdkloxP/loxP and n = 8 BckdkloxP/loxP-HSA-CreER. m, AUC for GTT in l. n, Insulin at t = 0 (n = 8 BckdkloxP/loxP and n = 7 BckdkloxP/loxP-HSA-CreER) and t = 20 min (n = 10 BckdkloxP/loxP and n = 8 BckdkloxP/loxP-HSA-CreER) during the GTT from l. j–n, Mice were male, 14–24-weeks old and were fed HFD for 4 weeks. o, Western blotting of refed tissues (14-3-3 is the loading control); n = 6 BckdkloxP/loxP and n = 6 BckdkloxP/loxP-HSA-CreER. p, Labelling fraction of TCA cycle intermediates by [U-13C]-labelled BCAA gavage in the quadriceps of fed mice; n = 8 BckdkloxP/loxP and n = 8 BckdkloxP/loxP-HSA-CreER. o,p, Mice were male, 16–17-weeks old and were fed HFD for 4 weeks. q, Plasma BCAAs after 100 mg kg−1 vehicle or BT2 treatment the night before and the morning of GTT; n = 6 vehicle and n = 6 BT2. r, 1.5 g kg−1 IP-GTT in BckdkloxP/loxP-HSA-CreER mice fasted for 5 h after the same vehicle or BT2 regimen in q; n = 6 vehicle and n = 7 BT2. s, AUC from the GTT in r. t, Insulin at t = 0 and t = 20 during the GTT from r; n = 6 vehicle and n = 7 BT2. q–t, Mice were male, 12–20-weeks old and were fed HFD for 4 weeks; n = 6 BckdkloxP/loxP-HSA-CreER + Veh and n = 6–7 BckdkloxP/loxP-HSA-CreER + BT2. Data are presented as the mean ± s.e.m. When two groups were compared, a two-tailed Student’s t-test was used, with significance defined as *P < 0.05, **P < 0.01 and ***P < 0.001. In the experiments with multiple comparisons at different time points, a repeated measures, two-way ANOVA was used. a, Valine basal P = 0.001199, valine clamp P = 0.031378; leucine basal P = 0.000636, leucine clamp P = 0.020943; isoleucine basal P = 0.000046, isoleucine clamp P = 0.017202. b, KIC/KMV basal P = 0.002799, KIC/KMV clamp P = 0.001194; KIV basal P = 0.034170, KIV clamp P = 0.000816. d, Succinate P = 0.015469; malate P = 0.001603; glutamate P = 0.005976. j, Valine fasted P = 0.005766; leucine fasted P = 0.000365; isoleucine fasted P = 0.000065. k, KIC/KMV fasted P = 0.003234, KIC/KMV refed P = 0.008413; KIV fasted P = 0.001603, KIV-refed P = 0.001892. p, Succinate P = 0.000100; malate P = 0.000072; glutamate P = 0.000289. q, Valine P = 0.002310; leucine P = 0.001134; isoleucine P = 0.002717. s, P = 0.037021.
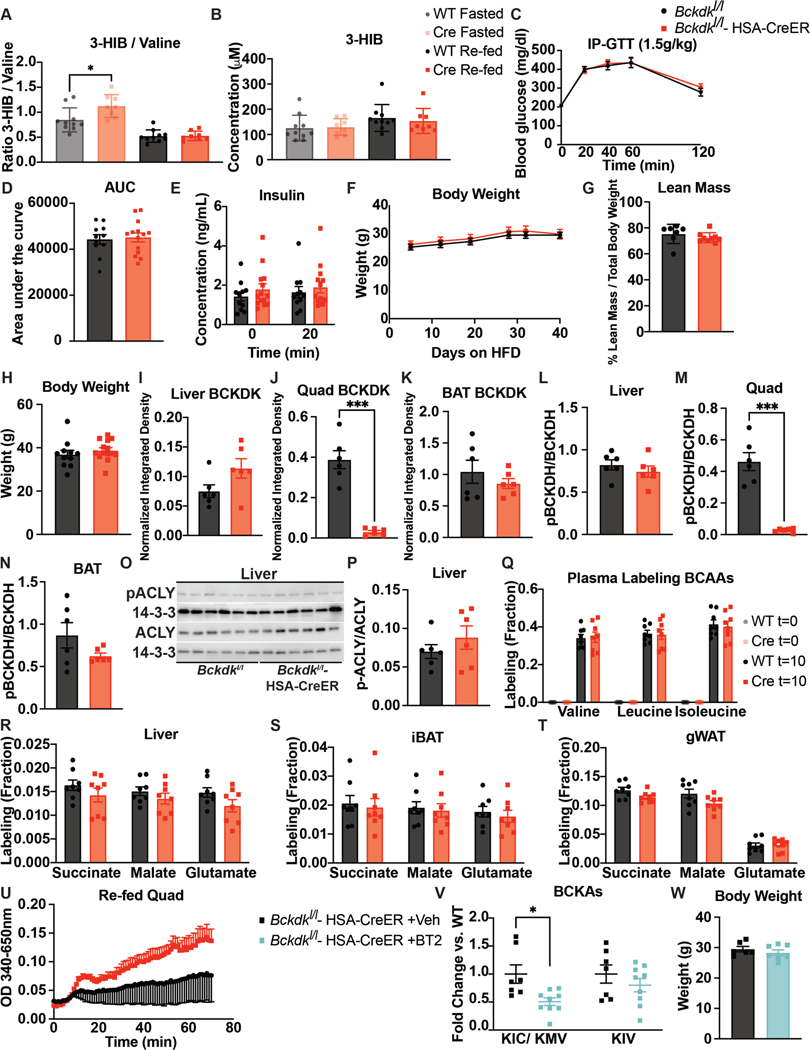
We next measured insulin sensitivity in mice on Western diet using HIEC. During HIEC, we achieved steady blood glucose levels by 50 min into the clamp (Fig. 3e). However, there was no difference in the glucose infusion rate (GIR) or the steady-state GIR, defined as the final 30 min of HIEC where the average blood glucose stayed between 100 mg dl−1 and 150 mg dl−1 and the GIR remained constant between Bckdkl/l-HSA-CreER mice and controls (Fig. 3f,g), indicating no difference in insulin sensitivity. Insulin concentration measured before and during clamp confirmed that hyperinsulinaemia was achieved in all mice and there was no difference between groups (Fig. 3h). Infusion of d-glucose-6,6-d2 before and during the clamp revealed that the endogenous Ra of glucose was not different between groups, indicating similar insulin-mediated suppression of hepatic gluconeogenesis between groups (Fig. 3i). The deuterium atoms in d-glucose-6,6-d2 are removed before entering the TCA cycle and thus do not interfere with the carbon labelling from [U-13C]-labelled BCAAs. We also performed a GTT on these mice fed Western diet before HIEC, which showed no difference between groups (Extended Data Fig. 3k,l). We further challenged these mice with HFD and performed GTTs after 4 and 10 weeks on this diet. As with mice on normal chow and Western diet, BckdkloxP/loxP-HSA-CreER mice on HFD had significantly decreased fasted plasma BCAAs and BCKAs; however, on this diet, BCKAs were also decreased in the refed state (Fig. 4j,k). BckdkloxP/loxP-HSA-CreER mice on HFD also had a significantly increased ratio of 3-HIB and valine in the fasted state but not in the refed state (Extended Data Fig. 4a). Again, there was no difference in 3-HIB concentration (Extended Data Fig. 4b). After 4 and 10 weeks on this diet, BckdkloxP/loxP-HSA-CreER mice on HFD did not have any difference in glucose tolerance (Fig. 3l,m and Extended Data Fig. 4c,d) or insulin levels (Fig. 3n and Extended Data Fig. 4e) compared to controls, despite substantial IR at 10 weeks (Extended Data Fig. 4c–e). There was no difference in body weight or lean mass between groups at 4 weeks on HFD (Extended Data Fig. 4f,g). Body weight further increased after 10 weeks on HFD, but weight between groups remained the same (Extended Data Fig. 4h). We conclude that increasing oxidation of BCAAs in SM has no appreciable impact on insulin sensitivity in fasted mice on a variety of diets.
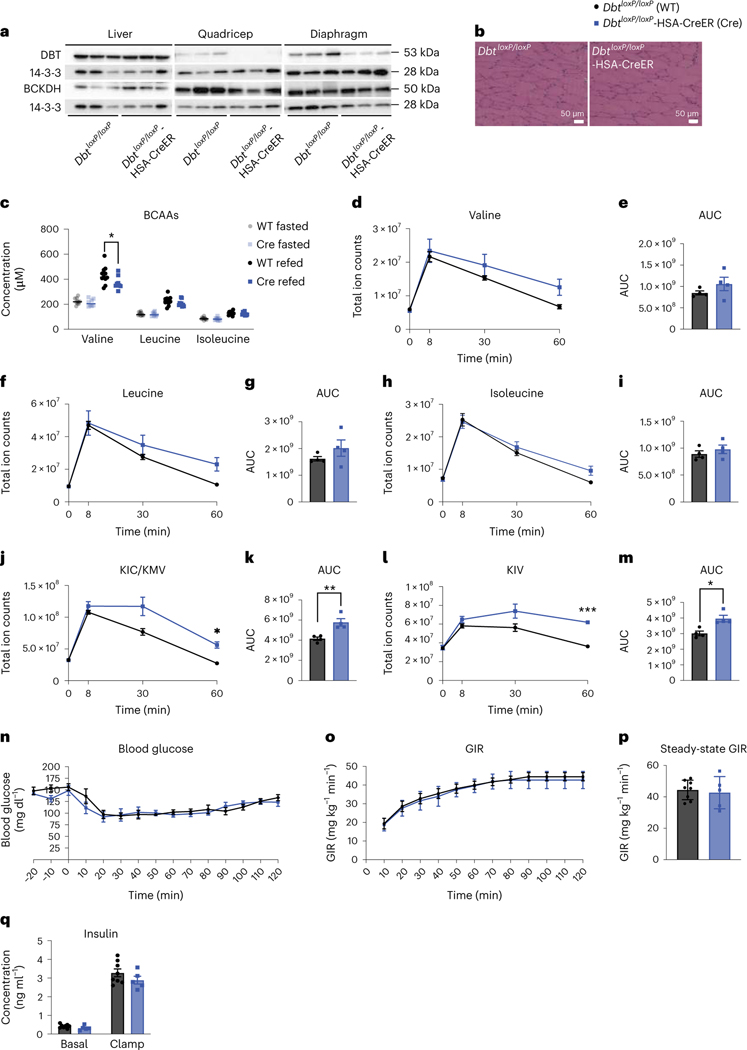
Fig. 4 |. Decreased SM BCAA oxidation does not affect insulin sensitivity in mice fed normal chow.
a, Western blotting of tissues collected from n = 3 DbtloxP/loxP and n = 3 DbtloxP/loxP-HSA-CreER mice (14-3-3 is the loading control). b, H&E staining of quadricep muscle. Representative images from n = 4 DbtloxP/loxP and n = 4 DbtloxP/loxP-HSA-CreER mice. c, Plasma BCAA concentration in mice fasted for 5 h (n = 10 DbtloxP/loxP and n = 8 DbtloxP/loxP-HSA-CreER) or refed for 2 h after overnight fasting (n = 11 DbtloxP/loxP and n = 9 DbtloxP/loxP-HSA-CreER). d–i, Plasma BCAA levels (d,f,h) and accompanying AUCs (e,g,i). j–m, Plasma BCKA levels (j,l) and accompanying AUCs (k,m) taken at various time points after BCAA gavage after a 5-h fast; n = 4 DbtloxP/loxP and n = 4 DbtloxP/loxP-HSA-CreER. n, Blood glucose. o, GIR. p, Steady-state GIR during HIEC; n = 8 DbtloxP/loxP and n = 5 DbtloxP/loxP-HSA-CreER. q, Insulin concentration before and during HIEC; n = 8 DbtloxP/loxP and n = 5 DbtloxP/loxP-HSA-CreER. The mice used in these experiments were male, 10–19-weeks old and were fed normal chow. Data are presented as the mean ± s.e.m. When two groups were compared, a two-tailed Student’s t-test was used, with significance defined as *P < 0.05 and **P < 0.01. In the experiments with multiple comparisons at different time points, a repeated measures, two-way ANOVA was used with significance defined as *P < 0.05 and ***P < 0.001. c, Valine refed P = 0.038708. j, 60 min P = 0.0226. k, P = 0.006699. l, 60 min P < 0.0001. m, P = 0.010268.
Circulating plasma BCAAs in BckdkloxP/loxP-HSA-CreER mice were surprisingly unchanged compared to controls in mice fed ad libitum or refed mice on multiple diets (Figs. 2c and 3j and Extended Data Fig. 3b). Western blotting confirmed deletion of BCKDK in quadricep samples from refed BckdkloxP/loxP-HSA-CreER mice compared to controls (Fig. 3o and Extended Data Fig. 4i–k). Likewise, phosphorylation of BCKDH was lower in the quadriceps from refed BckdkloxP/loxP-HSA-CreER animals compared to controls (Fig. 3o and Extended Data Fig. 4l–n). There was no impact on pACLY or ACLY (Extended Data Fig. 4o,p). To test if BCAA oxidation in SM was increased in fed BckdkloxP/loxP-HSA-CreER mice, we gave a bolus of [U-13C]-labelled BCAAs 2 h after refeeding and collected tissue 10 min later. Plasma labelling of BCAAs was the same between groups (Extended Data Figure 4q). In contrast, 13C enrichment of TCA cycle intermediates revealed higher contribution of BCAA-derived carbons in quadricep muscle from BckdkloxP/loxP-HSA-CreER mice compared to controls, indicating increased oxidation of BCAAs in SM (Fig. 4p). There was no difference in the contribution of labelled BCAAs to TCA cycle intermediates in liver, iBAT or gWAT (Extended Data Figure 4r–t). BCKDH activity assays confirmed increased activity in the quadriceps from refed BckdkloxP/loxP-HSA-CreER mice compared to controls (Extended Data Fig. 4u). We conclude that SM-specific BCAA oxidation is significantly increased in BckdkloxP/loxP-HSA-CreER mice in both fasted and refed states.
BT2 significantly lowers circulating plasma BCAAs and improves insulin sensitivity (Fig. 1), whereas deletion of BCKDK in SM does not, suggesting that the effects of BT2 are not mediated through SM. To test this, we treated our BckdkloxP/loxP-HSA-CreER mice acutely with BT2 or vehicle. BT2 further lowered plasma BCAAs and BCKAs in BckdkloxP/loxP-HSA-CreER mice, indicating an effect mediated by tissues other than SM (Fig. 3q and Extended Data Fig. 4v). BckdkloxP/loxP-HSA-CreER mice treated with BT2 also had significant improvement in glucose tolerance compared to vehicle-treated BckdkloxP/loxP-HSA-CreER mice during a GTT (Fig. 3r,s). There was no difference in insulin concentration or body weight (Fig. 3t and Extended Data Fig. 4w). These results demonstrate that despite SM being the main site of BCAA oxidation36, other tissues mediate improved insulin sensitivity through the activation of BCAA oxidation.
Decreased SM BCAA oxidation does not affect insulin sensitivity in mice fed normal chow
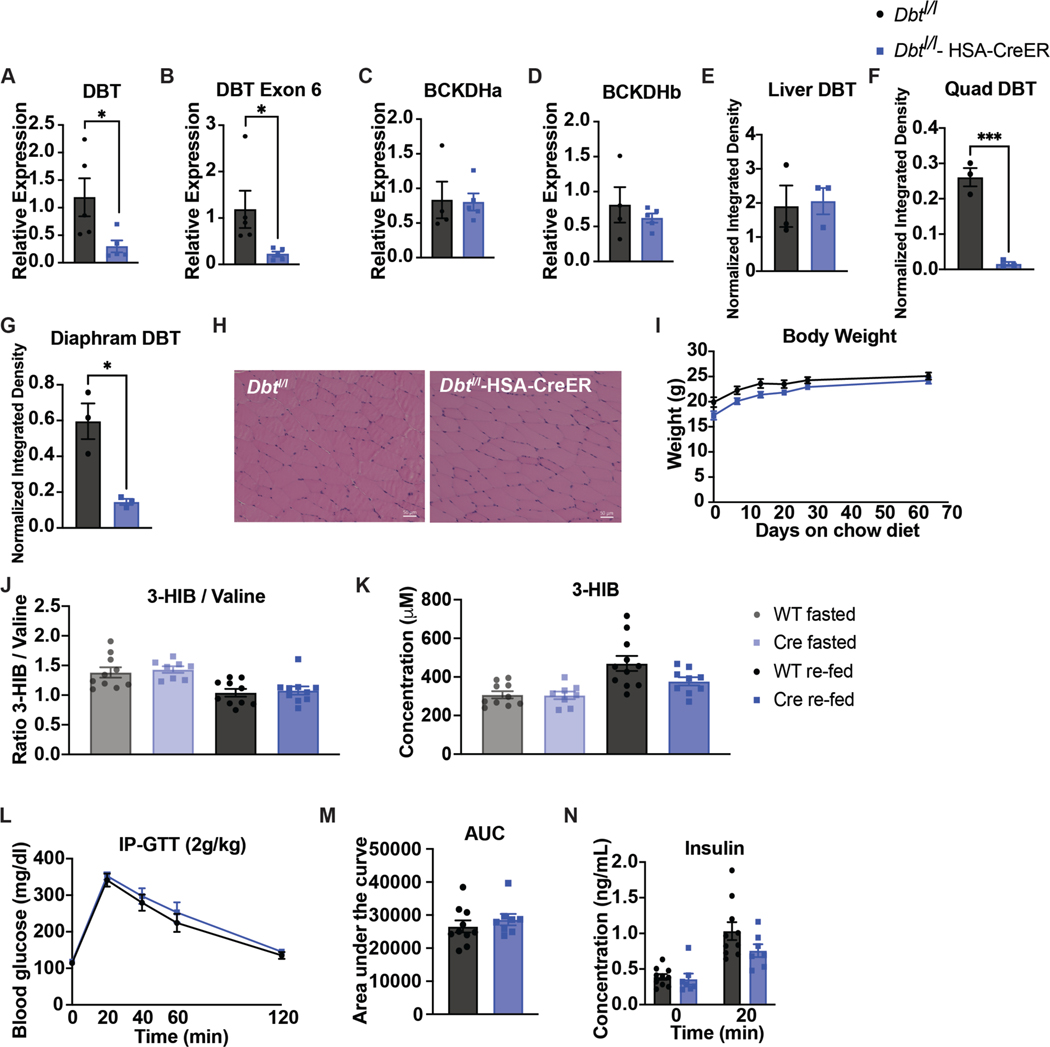
To test the effect of loss of BCAA oxidation in SM, we used CRISPR–Cas9 to introduce loxP sites flanking Dbt in mice and crossed them to mice encoding HSA-Cre, generating tamoxifen-inducible SM Dbt knockouts (DbtloxP/loxP-HSA-CreER). After tamoxifen, mRNA expression of Dbt was reduced and western blotting confirmed the absence of DBT protein in the quadriceps and diaphragms from DbtloxP/loxP-HSA-CreER mice, whereas BCKDHA protein and Bckdha and Bckdhb mRNA expression were unchanged between groups (Fig. 4a and Extended Data Fig. 5a–g). DbtloxP/loxP-HSA-CreER mice appeared grossly normal, without abnormalities in the H&E staining of SM (Fig. 4b and Extended Data Fig. 5h). There was no difference in body weight between groups (Extended Data Fig. 5i). Surprisingly, plasma BCAAs, the 3-HIB:valine ratio and 3-HIB concentration from fasted or refed mice were unchanged between groups (Fig. 4c and Extended Data Fig. 5j,k), suggesting potential compensation by other tissues. We next sought to test the ability of DbtloxP/loxP-HSA-CreER mice to clear BCAAs in the face of a BCAA challenge12 by subjecting mice to a BCAA gavage. Plasma clearance of BCAAs and BCKAs after the gavage was substantially blunted in DbtloxP/loxP-HSA-CreER mice compared to controls (Fig. 4d–m), demonstrating reduced whole-body BCAA catabolic capacity.
We assessed insulin sensitivity in these mice using GTT and HIEC. There was no difference in response to glucose by GTT and no difference in insulin concentration between DbtloxP/loxP-HSA-CreER mice and controls (Extended Data Fig. 5l–n). There was also no difference in GIR or insulin concentration between groups during HIEC, despite clear hyperinsulinaemia achieved during clamp (Fig. 4n–q). Despite a substantial difference in the ability to clear BCAAs and BCKAs from the plasma, DbtloxP/loxP-HSA-CreER mice were not more or less insulin-sensitive than controls on normal chow.
Decreased SM BCAA oxidation does not affect insulin sensitivity in mice fed HFD
We sought to examine the effects of SM Dbt knockout on glucose homeostasis in HFD-fed mice. After 5 weeks of HFD, mice received a gavage of [U-13C]-labelled BCAAs. After 10 min, 13C enrichment of TCA cycle intermediates by labelled BCAAs was reduced in the quadriceps from DbtloxP/loxP-HSA-CreER mice compared to controls (Fig. 5a), while plasma BCAAs were equally labelled in both groups (Extended Data Fig. 6a), demonstrating decreased oxidation of BCAAs by SM. BCKDH activity assays in the quadriceps of fasted mice confirmed decreased oxidative activity in SM (Extended Data Fig. 6b). The labelling of TCA cycle intermediates in liver, iBAT and gWAT was not different between groups (Extended Data Fig. 6c–e). Body weights and lean mass were also not different between groups (Extended Data Fig. 6f,g). As with chow-fed DbtloxP/loxP-HSA-CreER mice, fasting plasma BCAAs and BCKAs and refed BCAAs were unchanged between groups (Fig. 5b,c).
Fig. 5 |. Decreased SM BCAA oxidation does not affect insulin sensitivity in mice fed HFD.
a, Labelling fraction of TCA cycle intermediates in the quadriceps of 5-h fasted mice 10 min after [U-13C]-labelled BCAA gavage; n = 8 DbtloxP/loxP and n = 8 DbtloxP/loxP-HSA-CreER. b, Plasma BCAA concentration in mice fasted for 5 h or refed for 2 h after overnight fasting; n = 8 DbtloxP/loxP and n = 10 DbtloxP/loxP-HSA-CreER. c, Plasma BCKAs in mice fasted for 5 h; n = 8 DbtloxP/loxP and n = 8 DbtloxP/loxP-HSA-CreER. d, Fasting plasma pool size of BCAAs. e, Fasting plasma pool size of BCKAs. f, Ra of BCAAs during steady-state infusion of [U-13C]-labelled BCAAs before (basal, fasted for 5 h) and during (clamp, fasted for 7 h) HIEC; n = 6 DbtloxP/loxP and n = 6 DbtloxP/loxP-HSA-CreER. g, Blood glucose. h, GIR. i, Steady-state GIR during HIEC; n = 6 DbtloxP/loxP and n = 6 DbtloxP/loxP-HSA-CreER. j, Insulin concentration before and during HIEC; n = 6 DbtloxP/loxP and n = 6 DbtloxP/loxP-HSA-CreER. k, IP-GTT (1.5 g kg−1) after a BCAA gavage given at t = 0 in mice fasted for 5 h; n = 9 DbtloxP/loxP and n = 9 DbtloxP/loxP-HSA-CreER. l, AUC for the GTT in k. m, 1 g kg−1 IP-PTT in mice fasted for 16 h; n = 9 DbtloxP/loxP and n = 9 DbtloxP/loxP-HSA-CreER. n, AUC for the IP-PTT in l. Mice used in these experiments were male, 10–20-weeks old and were fed HFD for 4–8 weeks. Data are presented as the mean ± s.e.m. When comparing two groups, a two-tailed Student’s t-test was used, with significance defined as **P < 0.01. For the experiments with multiple comparisons at different time points, a repeated measures, two-way ANOVA was used. a, Succinate P = 0.001778; malate P = 0.001027; glutamate P = 0.002092.
We next combined HIEC with a steady-state non-perturbative infusion of [U-13C]-labelled BCAAs to quantify BCAA Ra before and during HIEC, as described above. Fasted plasma BCAAs, BCKAs and other AAs were not different between DbtloxP/loxP-HSA-CreER mice and controls before (basal) or during (clamp) HIEC (Fig. 5d,e and Extended Data Fig. 6h). Steady-state labelling of [U-13C]-labelled BCAAs was achieved during basal and clamp periods and was not different between groups (Extended Data Fig. 6i). BCAA Ra was also not different between groups (Fig. 5f). Insulin again reduced Ra during clamp, as observed above (Fig. 3c). GIR and insulin concentration were not different between DbtloxP/loxP-HSA-CreER and control mice during HIEC despite clear hyperinsulinaemia (Fig. 5g–j). A GTT performed before HIEC showed no difference in glucose tolerance or insulin concentration between groups (Extended Data Fig. 6j–l). Glucose tolerance was also not different after an acute BCAA challenge delivered at the same time as glucose during a GTT (Fig. 5k,l). Twenty minutes after BCAA challenge, increased circulating BCAAs were achieved during this GTT (Extended Data Fig. 6m). Chronic BCAA challenge may reveal different results. A pyruvate tolerance test (PTT) revealed no difference in blood glucose between groups after pyruvate load, indicating that hepatic gluconeogenesis was not affected by SM Dbt knockout (Fig. 5m,n). We conclude that decreasing oxidation of BCAAs in SM has no impact on insulin sensitivity in mice fed normal chow or HFD, or in mice challenged with a BCAA bolus.
Increased liver BCAA oxidation does not affect insulin sensitivity in mice fed HFD
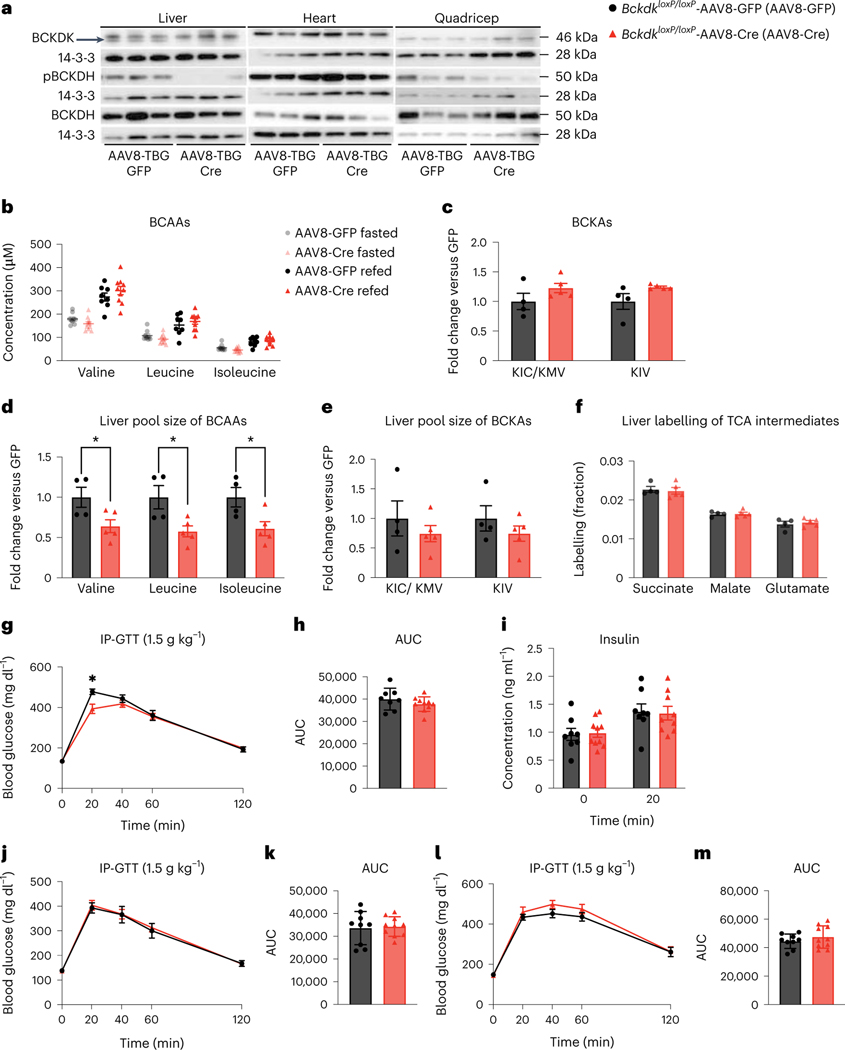
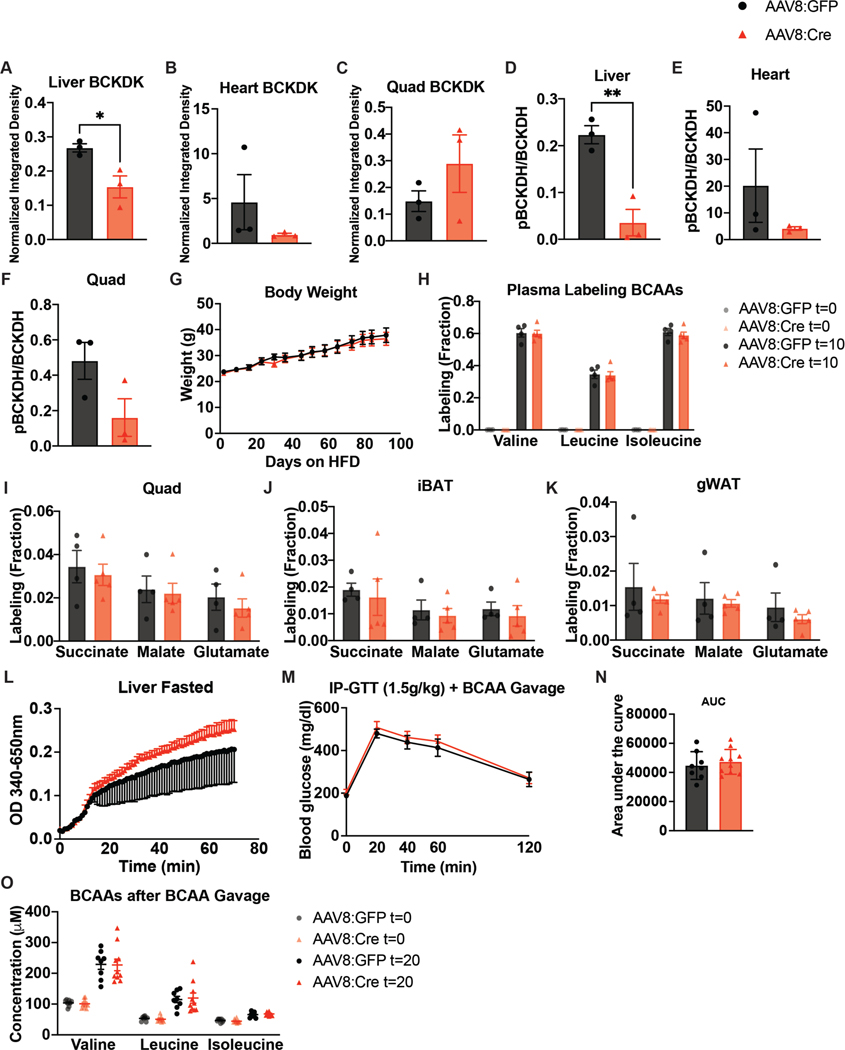
Previous studies showed that increasing liver BCAA oxidation in ZFRs improves insulin sensitivity37; due to our findings that modulation of SM BCAA catabolism had no effect on insulin sensitivity, we sought to increase BCAA oxidation in livers of mice fed HFD. We deleted liver Bckdk by infecting BckdkloxP/loxP mice with hepatotropic AAV8-TBG-Cre, encoding Cre under the hepatocyte-specific, thyroxine-binding globulin (TBG (also known as Serpina7)) promoter (Bckdk liver knockout). Controls were given AAV8-TBG-GFP. Deletion of BCKDK from liver was efficient and pBCKDH was reduced (Fig. 6a and Extended Data Fig. 7a–f). There was no difference in the plasma BCAAs of fasted or refed mice, or the BCKAs of fasted mice, between groups and no difference in body weight (Fig. 6b,c and Extended Data Fig. 7g). However, there was a significantly decreased pool size of BCAAs in livers from Bckdk liver knockouts after a bolus of [U-13C]-labelled BCAAs (Fig. 6d), but no difference in BCKAs in livers from these mice (Fig. 6e). While plasma labelling of BCAAs was the same in each group after a bolus (Extended Data Fig. 7h), labelling of TCA cycle intermediates by BCAAs in livers from fasted mice was not different between groups, despite clear knockout of BCKDK in these livers by western blotting (Fig. 6f). This result is probably because pBCKDH is already low in liver47 and deletion of BCKDK will not increase BCKDH activity any further. There was also no effect of Bckdk liver knockout on the labelling of TCA cycle intermediates in quadricep muscle, iBAT or gWAT (Extended Data Fig. 7i–k). BCKDH activity assays revealed marginally increased BCKDH activity in Bckdk liver knockouts compared to controls (Extended Data Fig. 7l). To assess insulin sensitivity, we performed GTTs after 2 weeks, 4 weeks and 2 months of HFD. There was no significant difference in glucose tolerance or insulin concentration between groups at any time point (Fig. 6g–m). There was also no difference in glucose tolerance after an acute BCAA challenge, which successfully elevated circulating plasma BCAAs 20 min into the GTT (Extended Data Fig. 7m–o). A chronic BCAA challenge was not performed and might reveal different results. We conclude that Bckdk liver knockout has no impact on insulin sensitivity in mice fed HFD.
Fig. 6 |. Increased liver BCAA oxidation does not affect insulin sensitivity in mice fed HFD.
a, Western blotting of tissues from n = 3 BckdkloxP/loxP-AAV8-GFP and n = 3 BckdkloxP/loxP-AAV8-Cre mice. Liver BCKDK is the bottom band, as shown by the black arrow. The top band is non-specific (14-3-3 is the loading control). b, Plasma BCAA concentration in mice fasted for 5 h or refed for 2 h after overnight fasting; n = 8 BckdkloxP/loxP-AAV8-GFP and n = 10 BckdkloxP/loxP-AAV8-Cre. c, Plasma BCKAs in mice fasted for 5 h; n = 4 BckdkloxP/loxP-AAV8-GFP and n = 5 BckdkloxP/loxP-AAV8-Cre. d, Liver pool size of BCAAs. e, Liver pool size of BCKAs. f, Labelling fraction of TCA cycle intermediates 10 min after gavage of [U-13C]-labelled BCAAs in mice fasted for 5 h; n = 4 BckdkloxP/loxP-AAV8-GFP and n = 5 BckdkloxP/loxP-AAV8-Cre. g, IP-GTT (1.5 g kg−1) in mice fasted for 5 h and fed HFD for 4 weeks; n = 8 BckdkloxP/loxP-AAV8-GFP and n = 10 BckdkloxP/loxP-AAV8-Cre. h, AUC of the GTT in g. i, Insulin concentration at t = 0 (n = 8 BckdkloxP/loxP-AAV8-GFP and n = 10 BckdkloxP/loxP-AAV8-Cre) and t = 20 min (n = 8 BckdkloxP/loxP-AAV8-GFP and n = 9 BckdkloxP/loxP-AAV8-Cre) during the GTT in g. j, IP-GTT (1.5 g kg−1) in mice fasted for 5 h and fed HFD for 2 weeks; n = BckdkloxP/loxP-AAV8-GFP and n = 10 BckdkloxP/loxP-AAV8-Cre. k, AUC of the GTT in j. l, IP-GTT (1.5 g kg−1) in mice fasted for 5 h and fed HFD for 2 months; n = 9 BckdkloxP/loxP-AAV8-GFP and n = 10 BckdkloxP/loxP-AAV8-Cre. m, AUC of the GTT in l. Mice used in these experiments were male, 12–21-weeks old and were fed HFD for 4–12 weeks. Data are presented as the mean ± s.e.m. When two groups were compared, a two-tailed Student’s t-test was used, with significance defined as *P < 0.05. In the experiments with multiple comparisons at different time points, a repeated measures, two-way ANOVA was used with significance defined as *P < 0.05. d, Valine P = 0.039715; leucine P = 0.024237; isoleucine P = 0.030860. g, 20 min P = 0.0348.
Decreased liver BCAA oxidation does not affect insulin sensitivity in mice fed normal chow or HFD
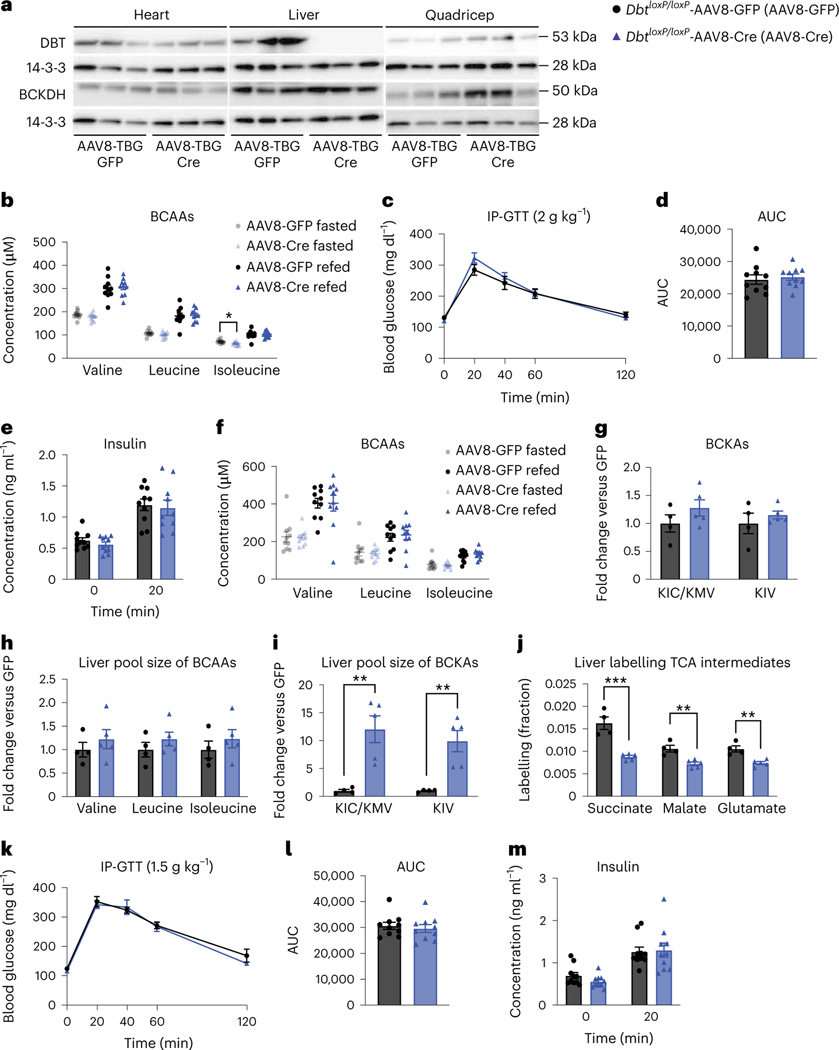
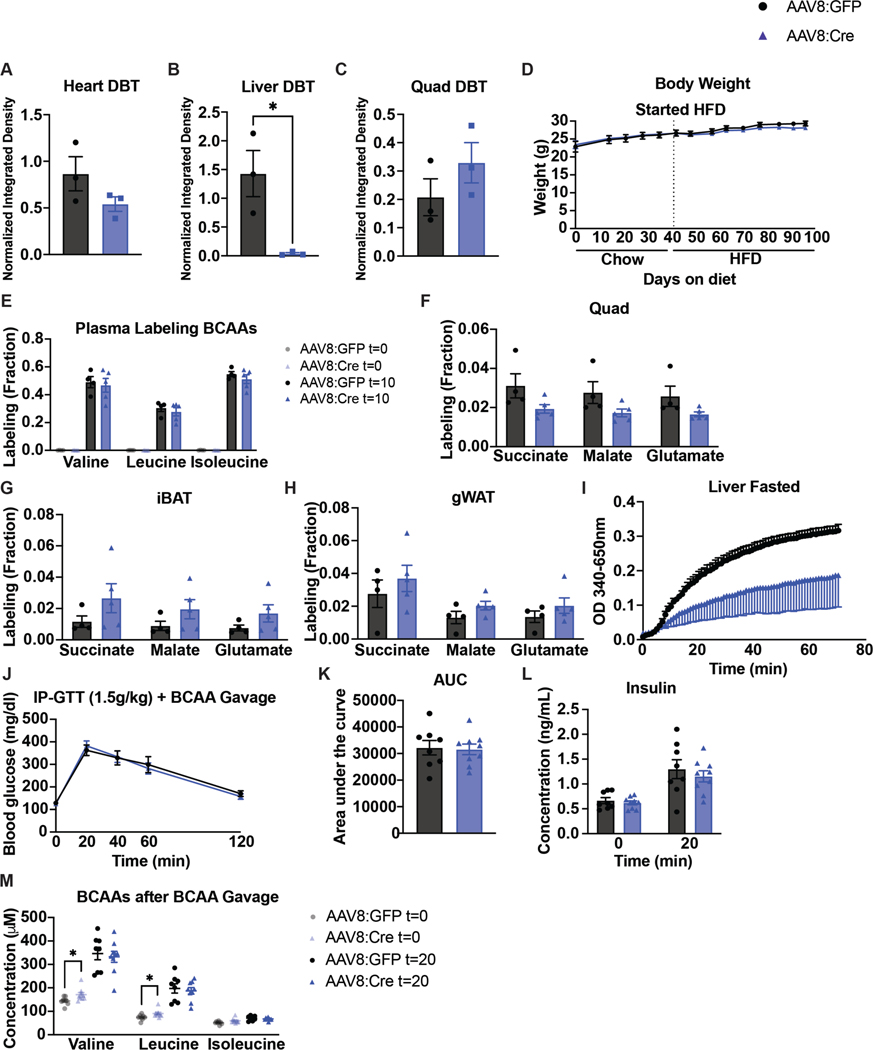
We targeted liver Dbt, with AAV8-TBG-Cre in DbtloxP/loxP mice (Dbt liver knockouts) to test the impact of loss of liver BCAA catabolism on insulin sensitivity. Dbt was efficiently deleted in livers from AAV8-TBG-Cre mice (Fig. 7a and Extended Data Fig. 8a–c). There were no body weight differences between groups on either chow or HFD (Extended Data Fig. 8d). There was no major difference in fasted or refed plasma BCAAs in mice on normal chow (Fig. 7b). There was also no difference in glucose tolerance or insulin concentration between Dbt liver knockouts and controls on normal chow (Fig. 7c–e). After 4 weeks of HFD, there was no difference in fasted or refed plasma BCAAs or fasted BCKAs between groups (Fig. 7f,g). Ten minutes after a bolus of [U-13C]-labelled BCAAs, the liver pool size of BCAAs was not significantly different between groups (Fig. 7h), but the liver pool size of BCKAs was increased in Dbt liver knockouts compared to controls on HFD (Fig. 7i). Labelling of BCAAs in the plasma was not different between groups (Extended Data Fig. 8e), but labelling of TCA cycle intermediates by [U-13C]-labelled BCAAs in the fasted liver was blunted in Dbt liver knockouts (Fig. 7j). There was no difference between groups in the labelling of TCA cycle intermediates in fasted quadricep muscle, iBAT or gWAT (Extended Data Fig. 8f–h). BCKDH activity assays confirmed markedly decreased BCKDH activity in fasted livers from Dbt liver knockouts compared to controls (Extended Data Fig. 8i). Again, no differences in glucose tolerance or insulin concentration were observed between groups on HFD (Fig. 7k–m). There was also no difference in glucose tolerance or insulin concentration after an acute BCAA challenge, which successfully elevated circulating plasma BCAAs 20 min into the GTT (Extended Data Fig. 8j–m). A chronic BCAA challenge was not performed and might reveal different results. We conclude that decreasing oxidation of BCAAs in liver has no impact on insulin sensitivity in mice fed normal chow or HFD, or in mice challenged with a BCAA bolus.
Fig. 7 |. Decreased liver BCAA oxidation does not affect insulin sensitivity in mice fed normal chow or HFD.
a, Western blotting of tissues from n = 3 DbtloxP/loxP-AAV8-GFP and n = 3 Dbtloxp/loxP-AAV8-Cre mice (14-3-3 is the loading control). b, Plasma BCAA concentrations in chow-fed mice fasted for 5 h or refed for 2 h after overnight fasting; n = 10 DbtloxP/loxP-AAV8-GFP and n = 10 DbtloxP/loxP-AAV8-Cre. c, IP-GTT (2 g kg−1) in chow-fed mice fasted for 5 h; n = 10 DbtloxP/loxP-AAV8-GFP and n = 10 DbtloxP/loxP-AAV8-Cre. d, AUC of the GTT in c. e, Insulin concentration at t = 0 and t = 20 min (n = 10 DbtloxP/loxP-AAV8-GFP and n = 10 DbtloxP/loxP-AAV8-Cre) during the GTT from c. f, Plasma BCAA concentrations in HFD-fed mice fasted for 5 h or refed for 2 h after overnight fasting; n = 10 DbtloxP/loxP-AAV8-GFP and n = 10 DbtloxP/loxP-AAV8-Cre. g, Plasma BCKAs in mice fasted for 5 h; n = 4 DbtloxP/loxP-AAV8-GFP and n = 5 DbtloxP/loxP-AAV8-Cre. h, Liver pool size of BCAAs. i, Liver pool size of BCKAs. j, Labelling fraction of TCA cycle intermediates in mice fasted for 5 h ten minutes after gavage of [U-13C]-labelled BCAAs; n = 4 DbtloxP/loxP-AAV8-GFP and n = 5 DbtloxP/loxP-AAV8-Cre. k, IP-GTT (1.5 g kg−1) in mice fasted for 5 h and fed HFD; n = 10 DbtloxP/loxP-AAV8-GFP and n = 10 DbtloxP/loxP-AAV8-Cre. l, AUC of the GTT in k. m, Plasma insulin concentration at t = 0 and t = 20 min (n = 10 DbtloxP/loxP-AAV8-GFP and n = 10 DbtloxP/loxP-AAV8-Cre) during the GTT from k. a–e, Mice were fed chow diet. f–m, Mice were fed HFD. Mice were male, 16–24-weeks old and were fed chow diet for 4–5 weeks, followed by HFD for 4–6 weeks. Data are presented as the mean ± s.e.m. When comparing two groups, a two-tailed Student’s t-test was used, with significance defined as *P < 0.05 and **P < 0.01. In the experiments with multiple comparisons at different time points, a repeated measures, two-way ANOVA was used. b, Isoleucine fasted P = 0.019558. i, KIC/KMV P = 0.004877, KIV P = 0.004452. j, Succinate P = 0.000631; malate P = 0.003667; glutamate P = 0.003207.
Double knockout of BCKDK in both SM and liver has no effect on insulin sensitivity
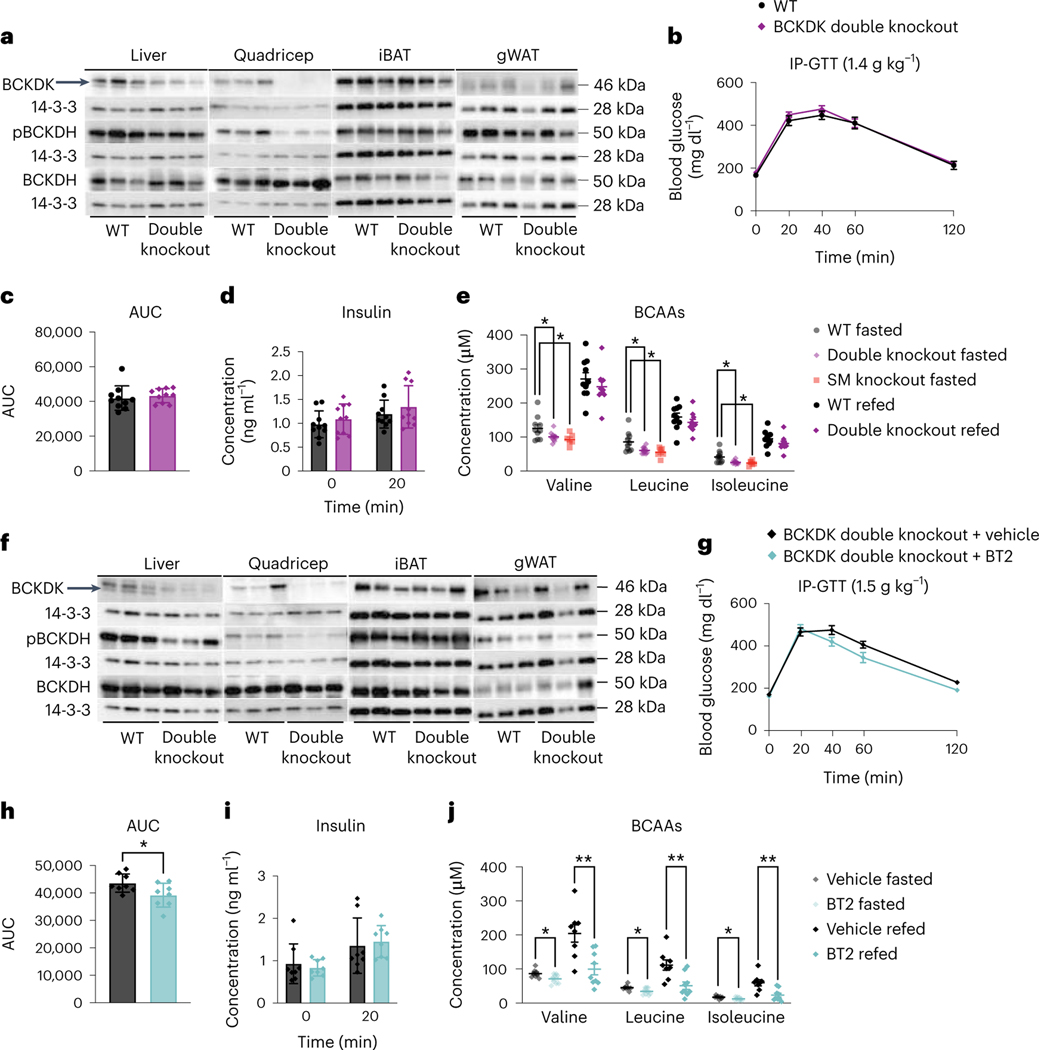
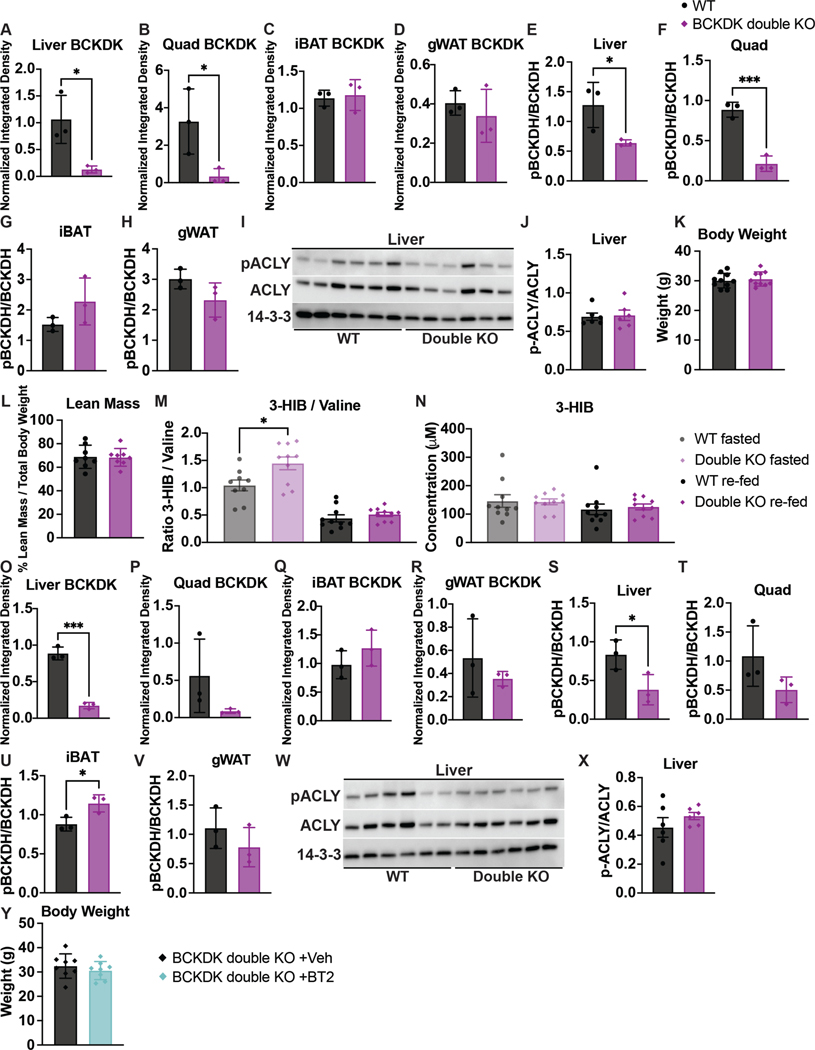
To test the possibility that altered BCAA oxidation in both liver and SM is required to improve insulin sensitivity, we infected BckdkloxP/loxP-HSA-CreER mice with AAV8-TBG-Cre to generate BCKDK SM and liver double knockout mice (BCKDK double knockout). BckdkloxP/loxP mice given AAV8-TBG-GFP were the controls. BCKDK was deleted in both quadricep muscle and liver; pBCKDH was also reduced (Fig. 8a and Extended Data Fig. 9a–h). Livers from these fasted mice showed no difference in pACLY or ACLY between groups (Extended Data Fig. 9i,j). Body weight and lean mass were not different between groups (Extended Data Fig. 9k,l). After 6 weeks of HFD, there was no difference in glucose tolerance or insulin concentration between groups (Fig. 8b–d), despite significantly decreased fasting plasma BCAAs in BCKDK double knockouts compared to controls (Fig. 8e). Circulating BCAAs in the BCKDK double knockouts were not any lower than circulating BCAAs in the BckdkloxP/loxP-HSA-CreER single knockouts, which is not surprising considering that Bckdk liver knockout did not lower plasma BCAAs (Fig. 8e). The 3-HIB:valine ratio was significantly elevated in the fasted, but not the refed state, and the concentration of 3-HIB was the same across groups (Extended Data Fig. 9m,n). BCKDK and pBCKDH were also reduced in liver and quadricep muscle of refed mice (Fig. 8f and Extended Data Fig. 9o–v). Livers from refed mice again showed no difference in pACLY or ACLY between groups (Extended Data Fig. 9w,x). From these data, we conclude that increased BCAA oxidation in both SM and liver has no impact on insulin sensitivity.
Fig. 8 |. Double knockout of BCKDK in both SM and liver has no effect on insulin sensitivity.
a, Western blotting of fasted tissues from n = 3 WT and n = 3 BCKDK double knockout mice. Liver BCKDK is the bottom band, as shown by the black arrow. The top band is non-specific; 14-3-3 is the loading control. b, IP-GTT (1.5 g kg−1) in mice fasted for 5 h and fed HFD for 6 weeks; n = 10 WT and n = 10 double knockout mice. c, AUC for the GTT in b; n = 10 WT and n = 10 double knockout mice. d, Insulin concentration at t = 0 and t = 20 min (n = 10 WT and n = 10 double knockout mice) during the GTT from b. e, Plasma BCAA concentration in HFD-fed mice fasted for 5 h or refed for 2 h after overnight fasting; n = 10 WT, n = 6 BckdkloxP/loxP-HSA-CreER (SM knockout) and n = 10 double knockout mice. f, Western blotting of refed tissues from n = 3 WT and n = 3 double knockout mice; 14-3-3 is the loading control. g, IP-GTT (1.5 g kg−1) in mice fasted for 5 h and fed HFD for 7 weeks, treated with 100 mg kg−1 of either vehicle or BT2 the night before and the morning of the GTT; n = 8 BCKDK double knockout + vehicle and n = 8 BCKDK double knockout + BT2 mice. h, AUC for the GTT in g. i, Insulin concentration at t = 0 and t = 20 min (n = 8 BCKDK double knockout + vehicle and n = 8 BCKDK double knockout + BT2 mice) during the GTT from g. j, Plasma BCAA concentration in mice fasted for 5 h or refed for 2 h after overnight fasting, treated with 100 mg kg−1 of either vehicle or BT2 the night before and the morning of plasma collection; n = 8 BCKDK double knockout + vehicle and n = 9 BCKDK double knockout + BT2 mice. Mice used for these experiments were 13–23-weeks old and were fed HFD for 6–7 weeks. Data are presented as the mean ± s.e.m. When two groups were compared, a two-tailed Student’s t-test was used, with significance defined as *P < 0.05 and **P < 0.01. In the experiments with multiple comparisons at different time points, a repeated measures, two-way ANOVA was used. e, Valine WT versus double knockout fasted P = 0.047907; valine WT versus SM knockout fasted P = 0.049487; leucine WT versus double knockout fasted P = 0.020429; leucine WT versus SM knockout fasted P = 0.031846; isoleucine WT versus double knockout fasted P = 0.014609; isoleucine WT versus SM knockout fasted P = 0.031719. h, P = 0.039819. j, Valine fasted P = 0.025933, valine refed P = 0.003017; leucine fasted P = 0.022498, leucine refed P = 0.004677; isoleucine fasted P = 0.041485, isoleucine refed P = 0.003193.
Finally, to test if BT2 acts via tissues other than muscle and liver, we treated BCKDK double knockouts acutely with BT2 or vehicle. BCKDK double knockouts treated with BT2 had significantly improved glucose tolerance compared to BCKDK double knockouts treated with vehicle (Fig. 8g,h), in the absence of differences in insulin concentration or body weight between groups (Fig. 8i and Extended Data Fig. 9y). BT2 treatment in BCKDK double knockouts further lowered BCAAs compared to vehicle-treated BCKDK double knockouts in fasted and refed states (Fig. 8j). These results indicate that BT2 can act on tissues other than SM and liver to lower systemic BCAAs and improve insulin sensitivity.
Discussion
Strong evidence indicates that elevated plasma BCAAs or increased oxidation of BCAAs (or both) contribute causally to the development of IR and T2D23–38,48. Inhibition of BCKDK with BT2 increases whole-body BCAA oxidation and improves insulin sensitivity in rodents (Fig. 1)36–38, while a recent human study showed improved insulin sensitivity in T2D with sodium phenylbutyrate treatment, an inhibitor similar to BCKDK40. However, the mechanism by which BCAAs promote IR, and conversely how BT2 and sodium phenylbutyrate improve insulin sensitivity, are uncertain. Simple questions remain unanswered: Is insulin sensitivity improved by lowering plasma BCAAs or by modulation of BCAA catabolism in a specific tissue? And what tissue is BT2 primarily acting on?
We found that lowering fasting systemic BCAAs in our SM Bckdk knockouts did not improve insulin sensitivity. We showed this in three different dietary contexts: normal chow, Western diet and HFD (Figs. 2 and 3). In all three contexts, the fasting plasma levels of BCAAs and BCKAs were significantly lowered, without any effect on insulin sensitivity. We conclude that insulin sensitivity is unlikely to be modulated by fasting systemic BCAA levels, despite the long-standing link between fasting plasma BCAA levels and the development of T2D23–27. Our model only decreased plasma BCAAs in fasted mice, while BT2 decreased plasma BCAAs in fasted and refed mice. This may reflect the increased load of BCAAs during feeding, which is too large for SM and liver to catabolize quickly. It is thus possible that plasma BCAAs after feeding have a role in IR. Our conclusion that plasma BCAAs are not the driver of IR is consistent with the observation that systemic deletion of Bcat2 in mice, which causes elevations of plasma BCAAs, leads to increased, rather than decreased, insulin sensitivity49. It is also consistent with the observation that patients with maple syrup urine disease, in whom plasma BCAAs are elevated, have not been reported to be prone to diabetes50–55.
If not SM and liver, then what tissue contributes to the effects of BCAAs on IR? We and others postulated that elevated oxidation of BCAAs in SM promotes IR36,37. We previously observed that BCAA oxidation is increased in SM and decreased in liver and adipose tissue from db/db mice36. We also previously observed that secretion of 3-HIB increases fatty acid uptake by SM, thus potentially promoting lipotoxicity45. Elevated BCAA oxidation in muscle potentially overwhelms mitochondria with excess substrate, thereby impairing oxidation of fatty acid species and also promoting lipotoxicity35,56,57. High BCAA oxidation in muscle might exert a ‘pull’ on glycine, preventing glycine’s role to clear acetyl coenzyme A (CoA), again leading to lipotoxicity46. All these studies pointed to SM as a primary site of action for the impact of BCAAs on IR. Our work, however, does not support this conclusion. Neither activation nor suppression of BCAA oxidation in SM had any appreciable effect on insulin sensitivity (Figs. 2–5). We conclude that SM BCAA oxidation has minimal effect on IR in mice, despite being the primary tissue site of BCAA oxidation36.
BCAA oxidation in liver is also substantial36 and promoting BCAA oxidation in the livers of ZFRs has been shown to alleviate IR37. However, in our studies, neither activation nor suppression of BCAA oxidation in liver had any effect on insulin sensitivity (Figs. 6 and 7). Even the co-deletion of Bckdk simultaneously in SM and liver failed to have an impact on insulin sensitivity (Fig. 8). We conclude that, like in SM, liver BCAA oxidation has minimal impact on insulin sensitivity in mice. This contrast with the results observed in ZFRs37 may stem from species differences. For example, hepatic Bckdk gene expression is induced by a high-fructose diet in rats but not in mice57, suggesting that liver may have a larger role in BCAA handling in rats. However, systemic inhibition of Bckdk with BT2 has an impact on insulin sensitivity in both species36–38. The absence of effect on insulin sensitivity by deletion of Bckdk in SM or liver, alone or in combination, indicates that the beneficial effects of BT2 must be mediated through a different tissue.
Multiple studies noted decreased BCAA oxidation in adipose tissue in genetic mouse models of obesity and T2D36,38,58, suggesting that suppression of BCAA oxidation in adipose tissue contributes to elevated plasma BCAAs and IR. Mice lacking Bckdha in iBAT have increased weight gain and IR12, suggesting that BCAA oxidation in adipose tissue is beneficial. However, a recent study observed that Bcat2 deletion in adipose tissue protected mice fed a HFD from weight gain and IR; supplementary BCKAs reversed these beneficial effects49. Thus, in this model, BCKA oxidation in adipose tissue is deleterious rather than protective to IR. The flux of BCAA oxidation in adipose tissue is quite low36. Any systemic effects from adipose-specific changes in BCAA catabolism would probably be mediated by signalling other than by BCAAs themselves, potentially by recently reported adipose-specific monomethyl branched-chain fatty acid species. Their suppression has been associated with IR59. Our preliminary results in iBAT from SM BCKDK knockout (Extended Data Fig. 3h) hint that iBAT may be involved in counter-regulating BCAA oxidation in response to genetic manipulation. The contribution of adipose tissue BCAA catabolism to whole-body insulin sensitivity is uncertain; thus, it will be of interest in future studies.
It is worth noting that our data raise the possibility that the beneficial effects of BT2 are mediated via off-target effects. We think this is unlikely. First, several studies showed that BCAA supplementation worsens insulin sensitivity28,38, and conversely BCAA restriction improves insulin sensitivity34,35, implicating the BCAA pathway. Second, overexpression of Ppm1k, which also antagonizes BCKDK, improves insulin sensitivity37. Formal proof of on-target effects will require evaluating the impact of BT2 in whole-body Bckdk knockouts.
Our study reveals that BCAA oxidation in SM or liver, alone or in combination, does not have an impact on insulin sensitivity in male mice; lowering fasting plasma BCAAs is not sufficient to improve insulin sensitivity. Many studies, including this one, have demonstrated the beneficial effects of systemic activation of BCAA oxidation. How this benefit is achieved, however, remains unclear.
Methods
Animals
All experiments were performed in mixed background (C57BL/6J being the dominant strain) adult male mice. Only male mice were used to avoid any potential confounding factors brought on by the sexual dimorphism that protects female mice from obesity and glucose intolerance60–66. Muscle-specific BCKDK knockout was achieved by crossing homozygous floxed BckdkloxP/loxP mice (loxP sites flanking exons 5, 6, 7 and 8 generated by the CRISPR–Cas9 technology) to homozygous floxed BckdkloxP/loxP-HSA-CreER mice. Knockout was then induced shortly after weaning by gavaging 200 μl of 25 mg ml−1 of tamoxifen dissolved in corn oil for 5 d, followed by 7 d of 400 mg kg−1 tamoxifen diet (TD.130859, Envigo). Knockout was achieved 2 weeks after completion of the tamoxifen diet. Bckdk floxed sites were confirmed by genotyping via PCR using the following sequences: forward: CCGTAGCCTTCCTTTCATCA; reverse: ACAGACCCTTCCAGCTCTCA. HSA-Cre was confirmed by genotyping via PCR using the following sequences: forward: GCATGGTGGAGATCTTTGA; reverse: CGACCGGCAAACGGACAGAAGC. Muscle-specific Dbt knockout was achieved by crossing homozygous floxed DbtloxP/loxP mice (loxP sites flanking exons 5, 6, 7 and 8 generated by CRISPR–Cas9 technology) to homozygous floxed DbtloxP/loxP-HSA-CreER mice. Knockout was then induced using the same tamoxifen regimen as above. Knockout was achieved 1 month after completion of the tamoxifen diet. DbtloxP/loxP floxed sites were confirmed by genotyping via PCR using the following sequences: forward: GTCTGAAAAGACTTTCCATGATACCT; reverse: CAAGCCTGGGAGGACTCC. BCKDK and DBT liver knockout was achieved via AAV8-TBG-Cre or green fluorescent protein (GFP) vector injection and allowed to recover for 2 weeks before beginning any experiments. BCKDK double knockout (skeletal muscle and liver) mice were generated using the same tamoxifen regime as the SM knockouts alone, allowed to recover and fed on a HFD for 1 month, then injected with AAV8-TBG-Cre or GFP vectors. Experiments were performed after another 2 weeks of recovery. The BT2 experiments were done in male C57BL/6J DIO mice obtained from the Jackson Laboratory (strain no. 380050). Mice were housed in a facility on a 12-h light cycle under standard temperature and humidity with free access to food and water. After tamoxifen or AAV8-TBG-Cre induction, mice were fed normal chow diet (5001, LabDiet), Western diet (TD.88137, Envigo) or 60% HFD (D12451, Research Diets) for up to 14 weeks depending on the experiment. Samples (and tissues) from fasted mice were collected via tail snip after 5 h without food; blood samples (and tissues) from refed mice were collected via tail snip after a 24-h overnight fasting, followed by a 2-h refeeding period with free access to food; fed-state blood samples were collected via tail snip at 23:00 when mice were active and eating. All blood was then centrifuged at 20,000g for 15 min at 4 °C to collect plasma for future metabolite analysis. All animal experiments performed in this study followed protocols and ethical regulations approved by the Institutional Animal Care and Use Committee at the University of Pennsylvania.
Antibodies
Protein content was evaluated using the following antibodies: anti-14-3-3 loading control (catalogue no. 8312S, Cell Signaling Technology); anti-DBT (catalogue no. 12451–1-AP, Proteintech); recombinant anti-BCKDK (catalogue no. ab128935, Abcam); BCKDH (BCKDE1A polyclonal antibody, catalogue no. A303–790A, Bethyl Laboratories); pBCKDH (pBCKDE1A (Ser293), catalogue no. A304–672A, Bethyl Laboratories); pACLY (catalogue no. 4331S, Cell Signaling Technology); ACLY (catalogue no. 4332, Cell Signaling Technology); and goat anti-rabbit IgG (H+L) secondary antibody, horseradish peroxidase (HRP) (catalogue no. 31460, Invitrogen). All primary antibodies were prepared as a 1:1,000 dilution in PBS, except for pACLY, which was prepared as a 1:500 dilution. The secondary antibody was prepared 1:10,000 in 5% milk in Tris-buffered saline with Tween 20 (TBST).
AAV vectors and administration
Custom AAV8 vectors used to knockout Bckdk or Dbt in the liver were obtained from the Penn Vector Core at the University of Pennsylvania: AAV8.TBG.PI.Cre.rBG (AAV8-TBG-Cre); AAV8.TBG.PI.eGFP.WPRE.bGH (AAV8-TBG-GFP). Each vector was diluted to 1.5 × 10¹¹ (ref. 11) genome copies per mouse in saline and retro-orbitally injected into mice anaesthetized with isoflurane67.
Western blotting
Protein was extracted from tissue samples by lysing in radioimmuno-precipitation assay buffer containing protease (cOmplete Protease Inhibitor Cocktail, Roche) and phosphatase (PhosSTOP, Roche) inhibitors. Samples were homogenized and spun down then the supernatant was quantified with a bicinchoninic acid assay kit (Thermo Fisher Scientific). Then,10 μg of protein was loaded onto a 4–20% gradient Tris-glycine polyacrylamide gel (Bio-Rad Laboratories) and electrophoresed (SDS–polyacrylamide gel electrophoresis). The protein gel was then transferred to a polyvinylidene fluoride membrane (Merck Millipore). After transfer, membranes were blocked with 5% milk in TBST for 1 h, then incubated with primary antibody overnight at 4 °C. Membranes were then washed with TBST and incubated with anti-rabbit (all primary antibodies used in this study were made in the rabbit) HRP-conjugated secondary antibody for 1 h. Membranes were finally imaged with a digital imager (ImageQuant LAS 4000, GE Healthcare). Images were quantified using ImageJ 2.
Histology and imaging
Quadricep and tibialis anterior muscles were formalin-fixed and embedded in paraffin for H&E staining. All staining, and paraffin embedding, were performed by the Comparative Pathology Core at the University of Pennsylvania School of Veterinary Medicine. Imaging was performed with a KEYENCE all-in-one fluorescence microscope (BZ-X810).
Quantitative PCR
RNA was extracted from quadricep samples by lysing about 30 mg of tissue in 1 ml TRIzol. Samples were homogenized then incubated at room temperature for 5 min. Then, 200 μl of chloroform was added and samples were shaken for 15 s, followed by a 3-min incubation at room temperature. Samples were centrifuged at 12,000g for 5 min at 4 °C. The aqueous phase was then transferred to a new tube and one volume of 70% ethanol was added (approximately 600 μl). Up to 700 μl of sample was added to an RNeasy mini column (QIAGEN) and centrifuged at 8,000g for 15 s. Then, 700 μl of buffer RW1 (QIAGEN) were added to the column and centrifuged for at 8,000g for 15 s. Then, 500 μl of buffer RPE (QIAGEN) were added to the column and centrifuged at 8,000g for 15 s. Another 500 μl of buffer RPE were added to the column and centrifuged at 8,000g for 2 min. To elute the RNA, the column was transferred to a new tube and 50 μl of RNase-free water (QIAGEN) were added directly to the column membrane. After 1 min, the samples were centrifuged at 8,000g for 1 min. All samples were diluted to the same concentration (50–150 ng μl−1). PCR with reverse transcription using the High Capacity cDNA Reverse Transcription Kit (Thermo Fischer Scientific) was performed to make complementary DNA (cDNA). Quantitative PCR was performed on cDNA using SYBR Green and selected primers. The primers were: Bckdk full: forward: ACATCAGCCACCGATACACAC; reverse: GAGGCGAACTGAGGGCTTC; Bckdk exon 6/7: forward: CAAGGATGTGGTGACCCTGTT; reverse: TACCGGACTAGCTTTTCATCCTGG; Cre: forward: GCATTTCTGGGGATTGCTTA; reverse: CCCGGCAAAACAGGTAGTTA; Bckdha: forward: ATCTACCGTGTCATGGACCG; reverse: ATGGTGTTGAGCAGCGTCAT; Bckdhb: forward: AGCTATTGCGGAAATCCAGTTT; reverse: ACAGTTGAAAAGATCACCTGAGC; Dbt full: forward: AGACTGACCTGTGTTCGCTAT; reverse: GAGTGACGTGGCTGACTGTA; Dbt exon 6: forward: AAAGCAGACAGGAGCCATAC; reverse: ACACTGGAGGCTTTGCTATC.
Infusions and HIECs
Mice were anaesthetized with isoflurane before catheter insertion. Surgery to implant two catheters into the mouse, one in the jugular vein for infusion and one in the carotid artery for blood collection, was performed. After surgery, mice were given at least 4 d to recover before the infusions. During the infusion, mice were fasted for 3 h then attached via their jugular line to our infusion set-up (Instech Laboratories), which includes a tether and swivel system to allow for free movement. A basal infusion of [U-13C]-labelled valine (catalogue no. CLM-2249-H, Cambridge Isotope Laboratories), [U-13C]-labelled leucine (catalogue no. CLM-2262-H, Cambridge Isotope Laboratories), [U-13C]-labelled isoleucine (catalogue no. CLM-2248-H, Cambridge Isotope Laboratories) and d-glucose-6,6-d2 (catalogue no. 282650, Sigma-Aldrich) dissolved in normal saline was delivered for 2 h at a rate of 3.3 μl min−1 to reach steady-state plasma labelling. The concentrations of labelled BCAAs and glucose in the infusion solution were prepared using previous infusion rate measurements made by the laboratory (valine: 36.2 nmol min−1; leucine: 48.3 nmol min−1; isoleucine: 22.6 nmol min−1, glucose: 11.88 μg min−1), which are based on the Ra and desired fractional labelling of each metabolite: infusion rate = (labelling × Ra) / (1 − labelling)36. Two blood samples were taken from the arterial line 10 min apart at the end of this 2-h basal infusion to calculate plasma labelling and the Ra of each labelled BCAA, and to ensure that mice were at steady state. The Ra of d-glucose-6,6-d2 was also calculated using these plasma measurements. After this 2-h basal infusion, Novolin R insulin (catalogue no. 00169183311, Novo Nordisk) was introduced into the infusion solution at a rate of 2.5 mU kg−1 min−1 (for the experiments with DbtloxP/loxP-HSA-CreER and littermate controls) or 4 mU kg−1 min−1 (for the experiments with BckdkloxP/loxP-HSA-CreER and littermate controls). After 10 min of infusing insulin, mice were infused with 20% glucose for 2 h at a variable rate to maintain constant blood glucose levels. Blood glucose levels were measured with a glucose meter using blood from the arterial line every 10 min throughout the 2 h; the GIR was adjusted accordingly. Two blood samples were taken from the arterial line 10 min apart at the end of this 2-h clamp period to calculate plasma labelling and the Ra of each labelled BCAA, and to ensure that mice were at steady state. The Ra of d-glucose-6,6-d2 was also calculated using these plasma measurements. Mice were killed with pentobarbital followed by cervical dislocation; tissues were freeze-clamped in liquid nitrogen after collection for future metabolite analysis.
Glucose, pyruvate and BCAA tolerance tests
Mice were individually housed on ALPHA-dri bedding (Shepard Specialty Papers) and fasted for 5 h before collecting the time 0 blood sample via tail snip. After the time 0 blood samples were collected, mice were injected intraperitoneally with 1–2 g kg−1 of glucose or pyruvate, or orally gavaged with a 182 mg kg−1 mixture of all three [U-13C]-labelled BCAAs in their native ratio of 1.6:2.2:1 valine:leucine:isoleucine22. Repeated blood samples were collected at several time points and centrifuged at 20,000g for 15 min at 4 °C to collect plasma for insulin and metabolite analysis. Blood glucose was measured using a OneTouch Ultra glucometer. Any tissues taken were freeze-clamped in liquid nitrogen for future metabolite analysis.
Insulin enzyme-linked immunosorbent assays
Insulin concentrations were measured from plasma taken at time 0 and 20 min after glucose injection during the GTTs using the ‘wide range assay’ described in the Ultra Sensitive Mouse Insulin ELISA Kit (Crystal Chem).
BT2 preparation and delivery
A 200 mg ml−1 stock solution of BT2 (catalogue no. 25643, Chem-Impex International) in dimethylsulfoxide (DMSO) was prepared first. A 10 mg ml−1 working solution of BT2 was then prepared by dissolving 50 μl of 200 mg ml−1 BT2 into a mixture of 850 μl of 0.1 M sodium bicarbonate, pH 9, and 100 μl Cremophor EL vehicle (Merck Millipore)38. The vehicle solution was prepared by dissolving 50 μl of DMSO into the same mixture. Mice were given BT2 or vehicle chronically via oral gavage every day for 1 month at a dose of 50 mg kg−1 d−1, or acutely via two oral gavages (one in the evening before the experiment and one in the morning before the experiment) at a dose of 100 mg kg−1 day−1 (ref. 68).
Gas chromatography and MS
A total of 10 μl of plasma plus an internal standard (either 8 μl of 1.22 mM [U-13C-15N]leucine (catalogue no. CNLM-281-H, Cambridge Isotope Laboratories) or 6.7 μl of 2.8 mM norvaline (catalogue no. 841505, Sigma-Aldrich)) were brought to a final sample volume of 34.7 μl using double-distilled H2O. Metabolites were then extracted from this mixture using 2.4 μl of 0.4 N HCl and 148.3 μl of cold 100% methanol. Samples were kept on dry ice for 15 min then centrifuged at 20,000g for 15 min at 4 °C; 150 μl of supernatant were saved from each sample and fully dried before being derivatized with a 50:50 mixture of 20 μl of MTBSTFA and 20 μl of acetonitrile at 70 °C for 90 min. Samples were finally centrifuged at 20,000g for 5 min at room temperature and 30 μl of the supernatant were aliquoted into vials to be run on a gas chromatograph (GC) (7890B GC System, Agilent) and mass selective detector (MSD) (5977B, Agilent). One microliter of each sample was injected by the automatic liquid sampler (7693A, Agilent) into the GC. The GC method used splitless injection mode with 1.2 ml min−1 helium as a carrier gas moving each sample through a 30 m × 250 μm × 0.25 μm HP-5ms Ultra Inert GC Column (part no. 19091S-433UI, Agilent). The inlet temperature was 250 °C and the oven temperature was initially 100 °C. After 3 min, the oven temperature was increased by 4 °C per minute to 230 °C then by 20 °C per minute to 300 °C and was held for 5 min. The transfer line temperature was 250 °C, the MSD source temperature was 230 °C and the MSD quadrupole temperature was 150 °C. The method included a 6-min solvent delay, after which the MSD operated in electron ionization mode and scan mode with a mass range of 50–550 atomic mass units at 2.9 scans per second. The Agilent MassHunter Quantitative Analysis software was used to quantify chromatograms obtained from the above method. The relative abundance of each metabolite was normalized to an internal standard (either norvaline or [U-13C-15N]leucine)69. A standard curve of BCAAs and 3-HIB was also used during each sample run to calculate exact concentrations. Fasting and refed circulating BCAA and 3-HIB concentrations were measured via GC and MS because we have a well-established protocol that can accurately and reproducibly detect them in plasma.
Metabolite extraction for LC–MS
For plasma samples, 200 μl methanol kept on dry ice was added to 5 μl plasma and incubated on ice for 10 min, followed by centrifugation at 17,000g for 10 min at 4 °C. The supernatant was transferred to an MS vial to run on LC–MS. For tissue samples, frozen samples were first ground with a CryoMill (Restch). The resulting tissue powder was extracted with 40:40:20 methanol:acetonitrile:water (40 μl extraction solvent per 1 mg tissue) for 10 min on ice, followed by centrifugation at 17,000g for 10 min; the supernatant was transferred to an MS vial until further analysis70.
LC–MS
A quadrupole orbitrap mass spectrometer (Q Exactive, Thermo Fisher Scientific) was coupled to a Vanquish UHPLC System (Thermo Fisher Scientific) with electrospray ionization and scan range from 60 to 1,000 m/z at 1 Hz, with a 140,000 resolution. LC separation was performed on an XBridge BEH Amide Column (2.1 × 150 mm, 2.5 μm particle size and 130 Å pore size; Waters Corporation) using a gradient of solvent A (95:5 water:acetonitrile with 20 mM ammonium acetate and 20 mM ammonium hydroxide, pH 9.45) and solvent B (acetonitrile). The flow rate was 150 μl min−1. The LC gradient was: 0 min, 85% B; 2 min, 85% B; 3 min, 80% B; 5 min, 80% B; 6 min, 75% B; 7 min, 75% B; 8 min, 70% B; 9 min, 70% B; 10 min, 50% B; 12 min, 50% B; 13 min, 25% B; 16 min, 25% B; 18 min, 0% B; 23 min, 0% B; 24 min, 85% B; and 30 min, 85% B. The injection volume was 5–10 μl and the autosampler temperature was set at 4 °C70. LC–MS was used to measure BCKAs, heavy-labelled BCAAs and heavy-labelled TCA cycle intermediates in plasma and in tissue because the overall sensitivity on these instruments is better, especially for measuring isotope enrichment.
BCKDH complex activity assay
A total of 50 mg of frozen tissue were homogenized in 600 μl of cold extraction buffer (50 mM HEPES, 3% (w/v) Triton X-100, 2 mM EDTA, 5 mM dithiothreitol (DTT), 0.5 mM thiamine pyrophosphate, 50 mM potassium fluoride, 2% (v/v) bovine serum, 0.1 mM N-tosyl-l-phenylalanine chloromethyl ketone, 0.1 mg ml−1 trypsin inhibitor, 0.02 mg ml−1 leupeptin, pH 7.4, at 4 °C adjusted with KOH) with phosphatase inhibitor (PhosSTOP), then spun down to remove insoluble material at 20,000g for 5 min at 4 °C. Then, 300 μl of 27% (wt/vol) Polyethylene Glycol 6000 was added to the supernatant and incubated on ice for 20 min. After this incubation, the solutions were spun down at 12,000g for 10 min at 4 °C. The supernatant was discarded and 500 μl of suspension buffer (25 mM HEPES, 0.1% (w/v) Triton X-100, 0.2 mM EDTA, 0.4 mM thiamine pyrophosphate, 1 mM DTT, 50 mM KCl, 0.02 mg ml−1 leupeptin, pH 7.4, at 37 °C adjusted with KOH) with phosphatase inhibitor was added to the pellet. Samples were homogenized until the pellets were dissolved. Protein concentrations were then assessed using a Bradford assay (Bio-Rad Laboratories) and all samples were normalized with suspension buffer. Liver samples were then diluted 1:10, and quadricep samples 1:5, in sterile water. A total of 60 μl of normalized, diluted samples were further diluted with 40 μl sterile water and 100 μl of 2× assay buffer (100 μl, 60 mM potassium phosphate, 4 mM MgCl2, 0.8 mM thiamine pyrophosphate, 0.8 mM CoA, 2 mM NAD+, 0.2% (w/v) Triton X-100 and 4 mM DTT, pH 7.3, at 30 °C adjusted with KOH) with phosphatase inhibitor into a 96-well plate. A baseline absorbance of 340 nm at 30 °C was recorded for 10 min, after which the reaction was initiated by injecting 20 μl of pre-warmed (30 °C) 1 mM ketoisovalerate. Absorbance was measured at 340 nm for 70 min; 650 nm was subtracted from all measurements for background correction71. This method was adapted from Nakai et al.72 and Webb et al.73.
Lean mass measurements
Mice were weighed to get a measure of total body weight, then placed in an EchoMRI 3-in-1 Composition Analyzer (Echo Medical Systems). Lean mass was measured and presented as a percentage of total body weight.
Quantification and statistical analysis
Data were analysed with Prism (GraphPad Software Version 9.5.1) and are presented as the mean ± SEM. When two groups were compared, an unpaired, two-tailed Student’s t-test was used with significance defined as *P < 0.05, **P < 0.01 and ***P < 0.001. In the experiments with multiple comparisons at different time points, a repeated measures two-way ANOVA was used with Šídák’s multiple comparisons for post-hoc testing. Significance was defined as *P < 0.05, **P < 0.01 and ***P < 0.001. All mice were randomized to treatment group and all experiments were done blinded to genotype or treatment.
Reporting summary
Further information on research design is available in the Nature Portfolio Reporting Summary linked to this article.
Data availability
All data generated or analysed during this study are included in the published article and its supplementary information files. The data that support the findings of this study are available from the corresponding author upon reasonable request. Source data are provided with this paper.
Extended Data
Extended Data Figure 1. BT2 treatment, acutely or chronically, does not affect body weight.
a-c, Western quantification of the ratio p-BCKDH/BCKDH in fasted tissues; n=6 vehicle- and n=6 BT2-treated. d, Plasma BCAA concentration in HFD-fed mice fasted for 5-hr or re-fed for 2-hr after an overnight fast; n=10 vehicle- and n=10 BT2-treated. Mice were gavaged with 50mg/kg/day of either vehicle or BT2 for 4 weeks prior to plasma collection. e, Body weights of mice used for acute BT2 experiment; n=10 vehicle- and n=10 BT2-treated. f, Body weights of mice used for chronic BT2 experiment; n=10 vehicle- and n=10 BT2-treated. g, Body weights of mice used for chronic BT2 GTT (at treatment day 28); n=10 vehicle- and n=10 BT2-treated. Mice used for these experiments were male C57BL/6J diet-induced obesity (DIO) mice ordered from the Jackson Laboratory. They were age 10–12 weeks and on a HFD for 4–6 weeks. Comparisons of two groups use two-tailed Student’s t-test with significance defined as: ***p<0.001. Experiments with multiple comparisons at different time-points use two-way ANOVA with repeated measures.
Extended Data Figure 2. BCKDK muscle knockout is specific and does not affect body weight or muscle physiology on chow diet.
a-d, Gene expression data via qPCR of Bckdk, Bckdk exon 6 & 7 (deleted region), Bckdha, and Bckdhb, respectively; n=3 Bckdkl/l (WT) and n=5 Bckdkl/l-HSA-CreER (Cre). e, Body weights; n=8 WT and n=8 Cre. f-j, Western quantification of BCKDK in fasted tissues normalized to loading control; n=3 WT and n=3 Cre. k-o, Western quantification of the ratio pBCKDH/BCKDH in fasted tissues; n=3 WT and n=3 Cre. p, Western blotting for p-ACLY and ACLY in fasted livers; n=6 WT and n=6 Cre. 14-3-3 is the loading control. q, Western quantification of the ratio p-ACLY/ACLY from the blot in p. r, H&E staining of tibialis anterior (TA) muscle. Representative images from n=4 WT and n=3 Cre mice. s, Ratio of 3-HIB/valine, and t, Concentration of 3-HIB in the plasma from mice fasted for 5-hr (n=10 WT and n=8 Cre) or re-fed for 2-hr after an overnight fast (n=10 WT and n=8 Cre). Mice used for these experiments were male, aged 8–10 weeks and fed chow diet. Comparisons of two groups use two-tailed Student’s t-test with significance defined as: *p<0.05, **p<0.01, ***p<0.001.
Extended Data Figure 3. Increased BCAA oxidation in BCKDK muscle knockout is specific in a fasted state and does not affect body weight or glucose tolerance on Western diet.
a, Body weights of mice; n=8 Bckdkl/l (WT) and n=9 Bckdkl/l-HSA-CreER (Cre). b, Plasma BCAA levels, c, Ratio of 3-HIB/valine, and d, Relative amount of 3-HIB in mice after a 5-hr fast (fasted) and in a fed state collected at 10pm (fed); n=12 WT and n=17 Cre. e, Fasting plasma pool size of various amino acids, and f, Steady-state plasma labeling of BCAAs by U13C-BCAAs (fraction) during steady-state infusion of U13C-BCAAs before (basal, 5-hr fasted) and during (clamp, 7-hr fasted) HIEC in n=6 WT and n=6 Cre mice. g, Normalized labeling of TCA cycle intermediates by U13C-BCAAs in liver, h, iBAT, and i, gWAT at the end of the infusion and HIEC (7-hr fasted); n=6 WT and n=6 Cre. j, BCKDH complex activity measured in fasted quad samples fed HFD for 4 weeks; n=4 WT and n=3 Cre. k, 2g/kg glucose IP-GTT in 5-hr fasted mice fed Western diet for 5 weeks; n=8 WT and n=9 Cre. l, Area-under-the-curve (AUC) for the GTT in k. Mice used in these experiments were male, aged 18–24 weeks and fed Western diet for 5–12 weeks. Comparisons of two groups use two-tailed Student’s t-test with significance defined as: *p<0.05, **p<0.01, ***p<0.001. Experiments with multiple comparisons at different time-points use two-way ANOVA with repeated measures.
Extended Data Figure 4. Increased BCAA oxidation in BCKDK muscle knockout is specific in a fed state and does not affect body weight or glucose tolerance on HFD.
a, Ratio of 3-HIB/valine, and b, Concentration of 3-HIB in mice fasted for 5-hr or re-fed for 2-hr after an overnight fast; n=10 Bckdkl/l (WT) and n=8 Bckdkl/l-HSA-CreER (Cre). c, 1.5g/kg IP-GTT in 5-hr fasted mice; n=11 WT and n=14 Cre. d, Area-under-the-curve (AUC) for GTT in c. e, Insulin concentration at t=0 and t=20 min (n=11 WT and n=14 Cre) during GTT from c. f, Weights; n=10 WT and n=8 Cre. g, Lean mass; n=7 WT and n=9 Cre. h, Weights; n=11 WT and n=14 Cre. i-k, Quantification of BCKDK in re-fed tissues normalized to loading control. l-n Quantification of the ratio pBCKDH/BCKDH in re-fed tissues. o, Western blotting for p-ACLY&ACLY in re-fed livers. 14-3-3 is the loading control. p, Quantification of the ratio p-ACLY/ACLY. n=6 WT and n=6 Cre for i-p. q, Labeling fraction of BCAAs in plasma before (t=0) and 10 min after gavage (t=10) of U13C-BCAAs in mice re-fed for 2-hr, and labeling fraction of TCA cycle intermediates 10 min after gavage of U13C-BCAAs in re-fed r, liver, s, iBAT, and t, gWAT; n=8 WT and n=8 Cre. u, BCKDH activity in re-fed quads; n=4 WT and n=3 Cre. v, Plasma BCKAs in Bckdkl/l-HSA-CreER mice treated with 100mg/kg of vehicle (Veh; n=6) or BT2 (n=7) the night before and morning of collection. w, Weights of Bckdkl/l-HSA-CreER mice treated with Veh or BT2. Mice in a, b, & f were male, aged 14–24 weeks and fed HFD for 4–5 weeks. Mice in c-e, & h were male, aged 20–26 weeks and fed HFD for 10 weeks. Mice in g & l-u were male, aged 16–17 weeks and fed HFD for 4 weeks. Mice in v & w were male, aged 12–20 and fed HFD for 4 weeks. Comparisons of two groups use two-tailed Student’s t-test with significance defined as: *p<0.05, **p<0.01, ***p<0.001. Experiments with multiple comparisons at different time-points use two-way ANOVA with repeated measures.
Extended Data Figure 5. DBT muscle knockout is specific and does not affect body weight, muscle physiology, or glucose tolerance on chow diet.
a-d, Gene expression data via qPCR of Dbt, Dbt exon 6 (deleted region), Bckdha, and Bckdhb, respectively; n=3 Dbtl/l (WT) and n=5 Dbtl/l-HSA-CreER (Cre). e-g, Western quantification of DBT in fasted tissues normalized to loading control; n=3 WT and n=3 Cre. h, H&E staining of tibialis anterior (TA) muscle. Representative images from n=3 WT and n=3 Cre. I, Ratio of 3-HIB/valine, and j, Concentration of 3-HIB from mice fasted for 5-hr (n=10 WT and n=8 Cre) or re-fed for 2-hr after an overnight fast (n=11 WT and n=9 Cre). k, Body weights; n=10 WT and n=8 Cre. l, 2g/kg glucose IP-GTT in 5-hr fasted mice; n=10 WT and n=10 Cre. m, Area-under-the-curve (AUC) for the GTT in l. n, Insulin concentration at t=0 and t=20 min (n=10 WT and n=7 Cre) during GTT from l. Mice used in these experiments were male, aged 10–19 weeks fed chow diet. Comparisons of two groups use two-tailed Student’s t-test with significance defined as: *p<0.05 and ***p<0.001. Experiments with multiple comparisons at different time-points use two-way ANOVA with repeated measures.
Extended Data Figure 6. Decreased BCAA oxidation in DBT muscle knockout is muscle specific and does not affect body weight or glucose tolerance on HFD.
a, Plasma labeling of BCAAs after U13C-BCAAs gavage (fraction) in 5-hr fasted mice; n=8 Dbtl/l (WT) and n=8 Dbtl/l-HSA-CreER (Cre). b, BCKDH complex activity measured in fasted quads from n=4 WT and n=4 Cre mice. Labeling fraction of TCA cycle intermediates 10 min after gavage of U13C-BCAAs in c, liver d, iBAT, & e, gWAT in 5-hr fasted mice; n=8 WT and n=8 Cre. f, Body weights; n=10 WT and n=14 Cre. g, Lean mass; n= WT and n= Cre. Fasting plasma pool size of various amino acids during steady-state infusion of U13C-BCAAs before (basal, 5-hr fasted) and during (clamp, 7-hr fasted) HIEC in n=6 WT and n=6 Cre mice. h, Plasma BCAA concentration in 5-hr fasted or 2-hr re-fed after an overnight fast in mice; n=8 WT and n=10 Cre. i, Steady-state plasma labeling of BCAAs by infusion of U13C-BCAAs before (basal) and during (clamp) HIEC; n=6 WT and n=6 Cre mice fed. j, 1.5g/kg glucose IP-GTT in 5-hr fasted mice fed HFD for 4 weeks; n=8 WT and n=9 Cre. k, Area-under-the-curve (AUC) for the GTT in j. l, Insulin concentration at t=0 and t=20 min (n=8 WT and n=9 Cre) during the GTT from j. m, Plasma BCAA concentration in 5-hr fasted mice before (t=0), n=8 WT and n=9 Cre, and 20 min after (t=20), n=6 WT and n=7 Cre, a gavage of BCAAs. Mice used in these experiments were male, aged 10–20 weeks fed HFD for 4–8 weeks. Comparisons of two groups use two-tailed Student’s t-test. Experiments with multiple comparisons at different time-points use two-way ANOVA with repeated measures.
Extended Data Figure 7. BCKDK liver knockout does not affect body weight or glucose tolerance at various time points on HFD or after a BCAA challenge.
a-c, Western quantification of BCKDK in tissues normalized to loading control; n=3 Bckdkl/l-AAV8:GFP (GFP) and n=3 Bckdkl/l-AAV8:Cre (Cre). d-f, Western quantification of the ratio pBCKDH/BCKDH; n=3 GFP and n=3 Cre. g, Body weights of n=9 GFP and n=10 Cre mice on HFD. h, Plasma labeling of BCAAs after U13C-BCAAs gavage (fraction) 5-hr fasted mice; n=4 GFP and n=5 Cre. Labeling fraction of TCA cycle intermediates 10 min post U13C-BCAA gavage in i, quad j, iBAT, & k, gWAT in 5-hr fasted mice; n=4 GFP and n=5 Cre. l, BCKDH complex activity assay measured in fasted livers from n=4 GFP and n=3 Cre mice. m, 1.5g/kg glucose IP-GTT in 5-hr fasted mice fed HFD after a BCAA gavage given at t=0; n=8 GFP and n=10 Cre. n, Area-under-the-curve (AUC) for the GTT in m. o, Plasma BCAA concentration of 5-hr fasted plasma before (t=0) (n=8 GFP and n=9 Cre) and 20 min after (t=20) (n=8 GFP and n=10 Cre) a BCAA gavage from GTT + BCAA gavage in m. Mice used in these experiments were male, aged 8–26 weeks and on a HFD for 2–12 weeks. Comparisons of two groups use two-tailed Student’s t-test with significance defined as: *p<0.05 and **p<0.01. Experiments with multiple comparisons at different time-points use two-way ANOVA with repeated measures.
Extended Data Figure 8. DBT liver knockout does not affect body weight or glucose tolerance on multiple diets or after a BCAA challenge.
a-c, Western quantification of DBT in tissues normalized to loading control; n=3 Dbtl/l-AAV8:GFP (GFP) and n=3 Dbtl/l-AAV8:Cre (Cre). d, Body weights of n=10 GFP and n=10 Cre mice on chow and HFD. e, Plasma labeling of BCAAs after U13C-BCAA gavage (fraction); n=4 GFP and n=5 Cre. Labeling fraction of TCA cycle intermediates 10 min post U13C-BCAA gavage in f, quad g, iBAT, & h, gWAT in 5-hr fasted mice; n=4 GFP and n=5 Cre. i, BCKDH complex activity measured in fasted livers from n=4 GFP and n=4 Cre mice. j, 1.5g/kg glucose IP-GTT in 5-hr fasted mice fed HFD for 4 weeks after a BCAA gavage given at t=0; n=8 GFP and n=9 Cre. k, Area-under-the-curve (AUC) for the GTT in j. l, Insulin concentration at t=0 and t=20 min (n=8 GFP and n=9 Cre) during GTT from j. m, Plasma BCAA concentration in 5-hr fasted mice before (t=0) and 20 min after (t=20) a gavage of BCAAs from GTT + BCAA gavage in j; n=8 GFP and n=9 Cre. Mice used in these experiments were male, aged 16–24 weeks and fed a chow diet for 4–5 weeks, followed by a HFD for 4–6 weeks. Comparisons of two groups use two-tailed Student’s t-test with significance defined as: *p<0.05. Experiments with multiple comparisons at different time-points use two-way ANOVA with repeated measures.
Extended Data Figure 9. Double knockout of BCKDK in both skeletal muscle and liver is specific in fasted and re-fed states.
a-d, Western quantification of BCKDK in fasted tissues normalized to loading control collected from n=3 WT and n=3 BCKDK double KO (Double KO) mice. e-h, Western quantification of the ratio pBCKDH/BCKDH in fasted tissues; n=3 WT and n=3 Double KO. i, Western blotting for p-ACLY and ACLY in fasted livers. 14-3-3 is the loading control; n=6 WT and n=6 Double KO. j, Western quantification of the ratio p-ACLY/ACLY from the blot in i. k, Body weights of n=10 WT and n=10 Double KO mice on HFD. l, Lean mass of n=8 WT and n=8 Double KO mice on HFD. m, Ratio of 3-HIB/valine, and n, Concentration of 3-HIB in plasma in mice fasted for 5-hr or re-fed for 2-hr after an overnight fast; n=10 WT and n=10 Double KO mice fed HFD. o-r, Western quantification of BCKDK in re-fed tissues normalized to loading control; n=3 WT and n=3 Double KO. s-v, Western quantification of the ratio pBCKDH/BCKDH in re-fed tissues; n=3 WT and n=3 Double KO. w, Western blotting for p-ACLY and ACLY in re-fed livers. 14-3-3 is the loading control; n=6 WT and n=6 Double KO. x, Western quantification of the ratio p-ACLY/ACLY from the blot in w. y, Body weights of n=8 BCKDK double KO + vehicle (Veh)-treated and n=8 BCKDK double KO + BT2-treated mice fed HFD. Mice used for these experiments were aged 13–23 weeks and fed HFD for 6–7 weeks. Comparisons of two groups use two-tailed Student’s t-test with significance defined as: *p<0.05 and ***p<0.001. Experiments with multiple comparisons at different time-points use two-way ANOVA with repeated measures.
Supplementary Material
Acknowledgements
We thank R. Miller and K. Filipski for their feedback. M.C.B. was supported by a National Institutes of Health (NIH) grant no. F31DK132839. Z.A. was supported by NIH grant nos. DK114103 and CA248315. This work was also supported in part by Pfizer. We also thank the Penn Vector Core at the University of Pennsylvania for producing the custom AAV8 vectors, the Comparative Pathology Core at the University of Pennsylvania School of Veterinary Medicine for preparing and staining the mouse muscle slides, and J. Davis at the Rodent Metabolic Phenotyping Core, supported in part by Penn Diabetes Research Center grant nos. P30-DK19525 and S10-OD025098, for the lean mass body weight measurements. Metabolic studies were in part supported by NIH Diabetes Research Center grant no. P30 DK019525.
Footnotes
Competing interests
R.J.R.F. and B.B.Z. are employees of Pfizer. This work was in part supported by Pfizer. The other authors declare no competing interests.
Additional information
Extended data is available for this paper at https://doi.org/10.1038/s42255–023-00794-y.
Supplementary information The online version contains supplementary material available at https://doi.org/10.1038/s42255–023-00794-y.
Peer review information Nature Metabolism thanks Yibin Wang, Owen McGuinness and the other, anonymous, reviewer(s) for their contribution to the peer review of this work. Primary Handling Editor: Isabella Samuelson, in collaboration with the Nature Metabolism team.
References
- 1.Centers for Disease Control and Prevention. National Diabetes Statistics Report (CDC, 2020). [Google Scholar]
- 2.Randle PJ, Garland PB, Hales CN & Newsholme EA The glucose fatty-acid cycle. Its role in insulin sensitivity and the metabolic disturbances of diabetes mellitus. Lancet 281, 785–789 (1963). [DOI] [PubMed] [Google Scholar]
- 3.McGarry JD What if Minkowski had been ageusic? An alternative angle on diabetes. Science 258, 766–770 (1992). [DOI] [PubMed] [Google Scholar]
- 4.Corkey BE Banting Lecture 2011: hyperinsulinemia: cause or consequence? Diabetes 61, 4–13 (2012). [DOI] [PMC free article] [PubMed] [Google Scholar]
- 5.Shulman GI Ectopic fat in insulin resistance, dyslipidemia, and cardiometabolic disease. N. Engl. J. Med. 371, 2236–2238 (2014). [DOI] [PubMed] [Google Scholar]
- 6.Kahn SE, Cooper ME & Del Prato S. Pathophysiology and treatment of type 2 diabetes: perspectives on the past, present, and future. Lancet 383, 1068–1083 (2014). [DOI] [PMC free article] [PubMed] [Google Scholar]
- 7.Petersen MC & Shulman GI Mechanisms of insulin action and insulin resistance. Physiol. Rev 98, 2133–2223 (2018). [DOI] [PMC free article] [PubMed] [Google Scholar]
- 8.Fazakerley DJ, Krycer JR, Kearney AL, Hocking SL & James DE Muscle and adipose tissue insulin resistance: malady without mechanism? J. Lipid Res 60, 1720–1732 (2019). [DOI] [PMC free article] [PubMed] [Google Scholar]
- 9.Davis TA, Fiorotto ML & Reeds PJ Amino acid compositions of body and milk protein change during the suckling period in rats. J. Nutr 123, 947–956 (1993). [DOI] [PubMed] [Google Scholar]
- 10.Moura A, Savageau MA & Alves R. Relative amino acid composition signatures of organisms and environments. PLoS ONE 8, e77319 (2013). [DOI] [PMC free article] [PubMed] [Google Scholar]
- 11.Schweigert BS, Bennett BA & Guthneck BT Amino acid composition of organ meats. J. Food Sci 19, 219–223 (1954). [Google Scholar]
- 12.Yoneshiro T. et al. BCAA catabolism in brown fat controls energy homeostasis through SLC25A44. Nature 572, 614–619 (2019). [DOI] [PMC free article] [PubMed] [Google Scholar]
- 13.Ichihara A. Isozyme patterns of branched-chain amino acid transaminase during cellular differentiation and carcinogenesis. Ann. N. Y. Acad. Sci 259, 347–354 (1975). [DOI] [PubMed] [Google Scholar]
- 14.Goto M, Shinno H. & Ichihara A. Isozyme patterns of branched-chain amino acid transaminase in human tissues and tumors. Gan 68, 663–667 (1977). [PubMed] [Google Scholar]
- 15.Ichihara A. & Koyama E. Transaminase of branched-chain amino acids. J. Biochem 59, 160–169 (1966). [DOI] [PubMed] [Google Scholar]
- 16.Johnson WA & Connelly JL Cellular localization and characterization of bovine liver branched-chain α-keto acid dehydrogenases. Biochemistry 11, 1967–1973 (1972). [DOI] [PubMed] [Google Scholar]
- 17.Aevarsson A, Seger K, Turley S, Sokatch JR & Hol WG Crystal structure of 2-oxoisovalerate and dehydrogenase and the architecture of 2-oxo acid dehydrogenase multienzyme complexes. Nat. Struct. Biol 6, 785–792 (1999). [DOI] [PubMed] [Google Scholar]
- 18.Ævarsson A. et al. Crystal structure of human branched-chain α-ketoacid dehydrogenase and the molecular basis of multienzyme complex deficiency in maple syrup urine disease. Structure 8, 277–291 (2000). [DOI] [PubMed] [Google Scholar]
- 19.Harris RA et al. Purification, characterization, regulation and molecular cloning of mitochondrial protein kinases. Adv. Enzyme Regul 32, 267–284 (1992). [DOI] [PubMed] [Google Scholar]
- 20.Damuni Z. & Reed LJ Purification and properties of the catalytic subunit of the branched-chain α-keto acid dehydrogenase phosphatase from bovine kidney mitochondria. J. Biol. Chem 262, 5129–5132 (1987). [PubMed] [Google Scholar]
- 21.Lu G. et al. Protein phosphatase 2Cm is a critical regulator of branched-chain amino acid catabolism in mice and cultured cells. J. Clin. Invest 119, 1678–1687 (2009). [DOI] [PMC free article] [PubMed] [Google Scholar]
- 22.Neinast M, Murashige D. & Arany Z. Branched-chain amino acids. Annu. Rev. Physiol 81, 139–164 (2019). [DOI] [PMC free article] [PubMed] [Google Scholar]
- 23.Adibi SA Influence of dietary deprivations on plasma concentration of free amino acids of man. J. Appl. Physiol 25, 52–57 (1968). [DOI] [PubMed] [Google Scholar]
- 24.Felig P, Marliss E. & Cahill GF Jr Plasma amino acid levels and insulin secretion in obesity. N. Engl. J. Med 281, 811–816 (1969). [DOI] [PubMed] [Google Scholar]
- 25.Wang TJ et al. Metabolite profiles and the risk of developing diabetes. Nat. Med 17, 448–453 (2011). [DOI] [PMC free article] [PubMed] [Google Scholar]
- 26.Würtz P. et al. Branched-chain and aromatic amino aids are predictors of insulin resistance in young adults. Diabetes Care 36, 648–655 (2013). [DOI] [PMC free article] [PubMed] [Google Scholar]
- 27.Guasch-Ferré M. et al. Metabolomics in prediabetes and diabetes: a systematic review and meta-analysis. Diabetes Care 39, 833–846 (2016). [DOI] [PMC free article] [PubMed] [Google Scholar]
- 28.Newgard CB et al. A branched-chain amino acid-related metabolic signature that differentiates obese and lean humans and contributes to insulin resistance. Cell Metab. 9, 311–326 (2009). [DOI] [PMC free article] [PubMed] [Google Scholar]
- 29.Lotta LA et al. Genetic predisposition to an impaired metabolism of the branched-chain amino acids and risk of type 2 diabetes: a Mendelian randomisation analysis. PLoS Med. 13, e1002179 (2016). [DOI] [PMC free article] [PubMed] [Google Scholar]
- 30.Krebs M. et al. Mechanism of amino acid-induced skeletal muscle insulin resistance in humans. Diabetes 51, 599–605 (2002). [DOI] [PubMed] [Google Scholar]
- 31.Krebs M. et al. Direct and indirect effects of amino acids on hepatic glucose metabolism in humans. Diabetologia 46, 917–925 (2003). [DOI] [PubMed] [Google Scholar]
- 32.Tremblay F. et al. Overactivation of S6 kinase 1 as a cause of human insulin resistance during increased amino acid availability. Diabetes 54, 2674–2684 (2005). [DOI] [PubMed] [Google Scholar]
- 33.Harris L-ALS et al. Alterations in 3-hydroxyisobutyrate and FGF21 metabolism are associated with protein ingestion-induced insulin resistance. Diabetes 66, 1871–1878 (2017). [DOI] [PMC free article] [PubMed] [Google Scholar]
- 34.Fontana L. et al. Decreased consumption of branched-chain amino acids improves metabolic health. Cell Rep. 16, 520–530 (2016). [DOI] [PMC free article] [PubMed] [Google Scholar]
- 35.White PJ et al. Branched-chain amino acid restriction in Zucker-fatty rats improves muscle insulin sensitivity by enhancing efficiency of fatty acid oxidation and acyl-glycine export. Mol. Metab 5, 538–551 (2016). [DOI] [PMC free article] [PubMed] [Google Scholar]
- 36.Neinast MD et al. Quantitative analysis of the whole-body metabolic fate of branched-chain amino acids. Cell Metab. 29, 417–429 (2019). [DOI] [PMC free article] [PubMed] [Google Scholar]
- 37.White PJ et al. The BCKDH kinase and phosphatase integrate BCAA and lipid metabolism via regulation of ATP-citrate lyase. Cell Metab. 27, 1281–1293 (2018). [DOI] [PMC free article] [PubMed] [Google Scholar]
- 38.Zhou M. et al. Targeting BCAA catabolism to treat obesity-associated insulin resistance. Diabetes 68, 1730–1746 (2019). [DOI] [PMC free article] [PubMed] [Google Scholar]
- 39.Tso S-C et al. Benzothiophene carboxylate derivatives as novel allosteric inhibitors of branched-chain α-ketoacid dehydrogenase kinase. J. Biol. Chem 289, 20583–20593 (2014). [DOI] [PMC free article] [PubMed] [Google Scholar]
- 40.Vanweert F. et al. A randomized placebo-controlled clinical trial for pharmacological activation of BCAA catabolism in patients with type 2 diabetes. Nat. Commun 13, 3508 (2022). [DOI] [PMC free article] [PubMed] [Google Scholar]
- 41.Blair MC, Neinast MD & Arany Z. Whole-body metabolic fate of branched-chain amino acids. Biochem. J 478, 765–776 (2021). [DOI] [PMC free article] [PubMed] [Google Scholar]
- 42.Coleman DL Obese and diabetes: two mutant genes causing diabetes-obesity syndromes in mice. Diabetologia 14, 141–148 (1978). [DOI] [PubMed] [Google Scholar]
- 43.Savage DB, Petersen KF & Shulman GI Disordered lipid metabolism and the pathogenesis of insulin resistance. Physiol. Rev 87, 507–520 (2007). [DOI] [PMC free article] [PubMed] [Google Scholar]
- 44.Brøns C. & Vaag A. Skeletal muscle lipotoxicity in insulin resistance and type 2 diabetes. J. Physiol 587, 3977–3978 (2009). [DOI] [PMC free article] [PubMed] [Google Scholar]
- 45.Jang C. et al. A branched-chain amino acid metabolite drives vascular fatty acid transport and causes insulin resistance. Nat. Med 22, 421–426 (2016). [DOI] [PMC free article] [PubMed] [Google Scholar]
- 46.White PJ et al. Muscle-liver trafficking of BCAA-derived nitrogen underlies obesity-related glycine depletion. Cell Rep. 33, 108375 (2020). [DOI] [PMC free article] [PubMed] [Google Scholar]
- 47.Shimomura Y. et al. Branched-chain amino acid catabolism in exercise and liver disease. J. Nutr 136, 250S–253S (2006). [DOI] [PubMed] [Google Scholar]
- 48.Cummings NE et al. Restoration of metabolic health by decreased consumption of branched-chain amino acids. J. Physiol 596, 623–645 (2018). [DOI] [PMC free article] [PubMed] [Google Scholar]
- 49.Ma Q-X et al. BCAA–BCKA axis regulates WAT browning through acetylation of PRDM16. Nat. Metab 4, 106–122 (2022). [DOI] [PubMed] [Google Scholar]
- 50.Schadewaldt P, Bodner-Leidecker A, Hammen HW & Wendel U. Significance of L-alloisoleucine in plasma for diagnosis of maple syrup urine disease. Clin. Chem 45, 1734–1740 (1999). [PubMed] [Google Scholar]
- 51.Podebrad F. et al. 4,5-Dimethyl-3-hydroxy-2[5H]-furanone (sotolone)—the odour of maple syrup urine disease. J. Inherit. Metab. Dis 22, 107–114 (1999). [DOI] [PubMed] [Google Scholar]
- 52.Sewell AC, Mosandl A. & Böhles H. False diagnosis of maple syrup urine disease owing to ingestion of herbal tea. N. Engl. J. Med 341, 769 (1999). [DOI] [PubMed] [Google Scholar]
- 53.Yudkoff M. Brain metabolism of branched-chain amino acids. Glia 21, 92–98 (1997). [DOI] [PubMed] [Google Scholar]
- 54.Yudkoff M. et al. [15 N] leucine as a source of [15 N] glutamate in organotypic cerebellar explants. Biochem. Biophys. Res. Commun 115, 174–179 (1983). [DOI] [PubMed] [Google Scholar]
- 55.Gambello MJ & Li H. Current strategies for the treatment of inborn errors of metabolism. J. Genet. Genomics 45, 61–70 (2018). [DOI] [PubMed] [Google Scholar]
- 56.Newgard CB Interplay between lipids and branched-chain amino acids in development of insulin resistance. Cell Metab. 15, 606–614 (2012). [DOI] [PMC free article] [PubMed] [Google Scholar]
- 57.White PJ et al. Insulin action, type 2 diabetes, and branched-chain amino acids: a two-way street. Mol. Metab. 52, 101261 (2021). [DOI] [PMC free article] [PubMed] [Google Scholar]
- 58.Herman MA, She P, Peroni OD, Lynch CJ & Kahn BB Adipose tissue branched-chain amino acid (BCAA) metabolism modulates circulating BCAA levels. J. Biol. Chem 285, 11348–11356 (2010). [DOI] [PMC free article] [PubMed] [Google Scholar]
- 59.Wallace M. et al. Enzyme promiscuity drives branched-chain fatty acid synthesis in adipose tissues. Nat. Chem. Biol 14, 1021–1031 (2018). [DOI] [PMC free article] [PubMed] [Google Scholar]
- 60.Sugiyama MG & Agellon LB Sex differences in lipid metabolism and metabolic disease risk. Biochem. Cell Biol 90, 124–141 (2012). [DOI] [PubMed] [Google Scholar]
- 61.Shi H, Seeley RJ & Clegg DJ Sexual differences in the control of energy homeostasis. Front. Neuroendocrinol. 30, 396–404 (2009). [DOI] [PMC free article] [PubMed] [Google Scholar]
- 62.Grove KL, Fried SK, Greenberg AS, Xiao XQ & Clegg DJ A microarray analysis of sexual dimorphism of adipose tissues in high-fat-diet-induced obese mice. Int. J. Obes 34, 989–1000 (2010). [DOI] [PMC free article] [PubMed] [Google Scholar]
- 63.Stubbins RE, Holcomb VB, Hong J. & Núñez NP Estrogen modulates abdominal adiposity and protects female mice from obesity and impaired glucose tolerance. Eur. J. Nutr 51, 861–870 (2012). [DOI] [PubMed] [Google Scholar]
- 64.Yang Y, Smith DL, Keating KD, Allison DB & Nagy TR Variations in body weight, food intake and body composition after long-term high-fat-diet feeding in C57BL/6J mice. Obesity 22, 2147–2155 (2014). [DOI] [PMC free article] [PubMed] [Google Scholar]
- 65.Dorfman MD et al. Sex differences in microglial CX3CR1 signalling determine obesity susceptibility in mice. Nat. Commun 8, 14556 (2017). [DOI] [PMC free article] [PubMed] [Google Scholar]
- 66.Benz V. et al. Sexual dimorphic regulation of body weight dynamics and adipose tissue lipolysis. PLoS ONE 7, e37794 (2012). [DOI] [PMC free article] [PubMed] [Google Scholar]
- 67.Gosis BS et al. Inhibition of nonalcoholic fatty liver disease in mice by selective inhibition of mTORC1. Science 376, eabf8271 (2022). [DOI] [PMC free article] [PubMed] [Google Scholar]
- 68.Bollinger E. et al. BDK inhibition acts as a catabolic switch to mimic fasting and improve metabolism in mice. Mol. Metab 66, 101611 (2022). [DOI] [PMC free article] [PubMed] [Google Scholar]
- 69.Ibrahim A. et al. Insulin-stimulated adipocytes secrete lactate to promote endothelial fatty acid uptake and transport. J. Cell Sci 135, jcs258964 (2022). [DOI] [PMC free article] [PubMed] [Google Scholar]
- 70.Zeng X. et al. Gut bacterial nutrient preferences quantified in vivo. Cell 185, 3441–3456 (2022). [DOI] [PMC free article] [PubMed] [Google Scholar]
- 71.Murashige D. et al. Extra-cardiac BCAA catabolism lowers blood pressure and protects from heart failure. Cell Metab. 34, 1749–1764 (2022). [DOI] [PMC free article] [PubMed] [Google Scholar]
- 72.Nakai N, Kobayashi R, Popov KM, Harris RA & Shimomura Y. Determination of branched-chain α-keto acid dehydrogenase activity state and branched-chain α-keto acid dehydrogenase kinase activity and protein in mammalian tissues. Methods Enzymol. 324, 48–62 (2000). [DOI] [PubMed] [Google Scholar]
- 73.Webb LA et al. Changes in tissue abundance and activity of enzymes related to branched-chain amino acid catabolism in dairy cows during early lactation. J. Dairy Sci 102, 3556–3568 (2019). [DOI] [PubMed] [Google Scholar]
Associated Data
This section collects any data citations, data availability statements, or supplementary materials included in this article.
Supplementary Materials
Data Availability Statement
All data generated or analysed during this study are included in the published article and its supplementary information files. The data that support the findings of this study are available from the corresponding author upon reasonable request. Source data are provided with this paper.


