Abstract
Objective
Knowledgebases are needed to clarify correlations observed in real-world electronic health record (EHR) data. We posit design principles, present a unifying framework, and report a test of concept.
Materials and Methods
We structured a knowledge framework along 3 axes: condition of interest, knowledge source, and taxonomy. In our test of concept, we used hypertension as our condition of interest, literature and VanderbiltDDx knowledgebase as sources, and phecodes as our taxonomy. In a cohort of 832 566 deidentified EHRs, we modeled blood pressure and heart rate by sex and age, classified individuals by hypertensive status, and ran a Phenome-wide Association Study (PheWAS) for hypertension. We compared the correlations from PheWAS to the associations in our knowledgebase.
Results
We produced PhecodeKbHtn: a knowledgebase comprising 167 hypertension-associated diseases, 15 of which were also negatively associated with blood pressure (pos+neg). Our hypertension PheWAS included 1914 phecodes, 129 of which were in the PhecodeKbHtn. Among the PheWAS association results, phecodes that were in PhecodeKbHtn had larger effect sizes compared with those phecodes not in the knowledgebase.
Discussion
Each source contributed unique and additive associations. Models of blood pressure and heart rate by age and sex were consistent with prior cohort studies. All but 4 PheWAS positive and negative correlations for phecodes in PhecodeKbHtn may be explained by knowledgebase associations, hypertensive cardiac complications, or causes of hypertension independently associated with hypotension.
Conclusion
It is feasible to assemble a knowledgebase that is compatible with EHR data to aid interpretation of clinical correlation research.
Keywords: knowledgebase, phecode, PheWAS, electronic health records, hypertension
BACKGROUND AND SIGNIFICANCE
Biomedical science and medicine progress through iterative cycles as researchers recognize correlations, explore theories of underlying mechanisms, test interventions, etc. Through this process our understanding of disease evolves, from clinical observations to designations grounded in anatomy, physiology, biochemistry, and molecular biology.1 New means of recognizing, monitoring, and treating diseases emerge as a result. Knowledge of a disease may become so sophisticated that specialization is necessary,2 with novel nomenclature, measurement modalities, and methods of structuring knowledge. As long as progress is being made, the definition of a disease is in flux. Each alteration changes the spectrum of patients who have the disease,1 and the characteristics of diagnosed patients in real-world data—including comorbidity patterns, measured biomarkers, treatment regimes, and modes of interacting with hospital systems—change with them. The evolution of disease knowledge is essential to progress, but it also complicates statistical modeling efforts using real-world clinical data that is constantly shifting. Application of today’s advances in machine learning to clinical prediction research would benefit from a unifying knowledgebase framework that relates knowledge of a disease to the clinical patterns observed in real-world data. Here we present a prototype framework, with application to electronic health record (EHR) data.
PheWAS3 is a high throughput logistic modeling method that produces correlation statistics with EHR variables. The method uses International Classification of Diseases (ICD) codes to define over 3000 diseases and symptoms. These phenotypes are called phecodes.4 PheWAS was developed to analyze genetic variation, but has been used for nongenetic biomarkers as well, including those extracted from the EHR (eg, test results).5 PheWAS allows researchers to observe correlations of a single predictor with a wide array of phenotypes sampled from the medical phenome.
PheWAS makes it easy to generate summary statistics, but interpreting these associations is more complicated. Correlations identified in PheWAS (particularly when a nongenetic variable is analyzed) may represent real associations (either causal or merely correlational) or may reflect complex biases of real-world EHR data.6 Given this landscape, it is difficult to determine if and how well PheWAS reflects our knowledge of a clinical entity. The overall goal of this work is to create a framework for unifying our knowledge of disease with the statistical correlations observed in EHR data. To do so, we address 2 related feasibility questions. Is it workable to assemble a knowledgebase to inform interpretation of PheWAS by mapping known associations to phecodes? Is it practicable to repurpose PheWAS methods to clarify associations between diagnoses and EHR-derived indicators?
We posit 3 design principles for a unifying knowledgebase framework. First, the framework should be extensible and represent abstractions from different knowledge sources side-by-side. This principle is intended to preserve the implicit temporal, methodologic, and semantic context of each source, while clarifying relationships among content of various sources.7 Second, the framework should represent clinically meaningful relationships among concepts. For this principle, we draw on the diagnosis relationships and categories of manifestations in the INTERNIST-I knowledgebase.8 Third, the framework should enable integration with EHR data by mapping the concepts to an EHR-compatible taxonomy, phecodes in this case.
Here, we present a knowledgebase framework and test of concept using hypertension as the EHR-derived indicator of interest. We populated a hypertension knowledgebase (PhecodeKbHtn) with phecodes for hypertension-associated diseases from 2 sources: a literature review of epidemiology of hypertension and the VanderbiltDDx knowledgebase.9 We generated real-world phecode correlation data using a cohort of deidentified EHRs and used mean systolic and mean diastolic blood pressure over the course of EHR follow-up to classify individuals as hypertensive or without hypertension. We ran a PheWAS for hypertension which identified phecodes that were both positively and negatively correlated with hypertension status. Phecodes that were in PhecodeKbHtn had larger effect sizes compared with those phecodes not in the knowledgebase, suggesting that associations in the knowledgebase were reflected in PheWAS data.
This test of concept suggests it is feasible to assemble a knowledgebase linking known associations from disparate knowledge sources to phecodes in a structure that preserves context of the sources. EHR-derived indicators such as means of systolic and diastolic blood pressure over course of EHR follow-up may provide sufficient signal to explore associations of hypertension with other diagnoses. The knowledgebase may be used to explore the nature of PheWAS correlations to answer questions such as whether associations are known or potentially novel. These methods open the door to reuse of the labor-intensive research required to interpret results for a PheWAS across subsequent studies.
Related work
Reviewing the literature, we identified multiple informatics projects that relate to our goal of clarifying the relationships among knowledge sources and EHR data. Supplementary Material I presents a brief overview of existing methods and tools for clinical knowledge representation including: Ontologies,10,11 Knowledge graphs,12,13 and the Pharmacogenomics Knowledgebase.14,15
OBJECTIVE
To explore the feasibility of applying knowledgebase strategies to aid interpretation of correlations observed in real-world data. We posit design principles for a unifying knowledgebase framework to relate knowledge from disparate sources to EHR data while preserving implicit temporal and semantic context of each source. This paper presents a test of concept.
MATERIALS AND METHODS
Knowledgebase assembly
We propose a knowledgebase framework structured along 3 axes: (1) the EHR-derived taxonomy, (2) sections for sources of knowledge, and (3) chapters for conditions of interest, as depicted in Figure 1A. Conditions may be a clinical presentation, eg, hypertension, biomarker, eg, test result or genotype, or disease entity. This extensible structure represents abstractions of sources side-by-side to preserve implicit context within each source while making explicit relationships across sources. For test of concept, we use phecodes as the taxonomy, a literature review, and the VanderbiltDDx knowledgebase (VDDxKB) as sources and hypertension as the condition.
Figure 1.
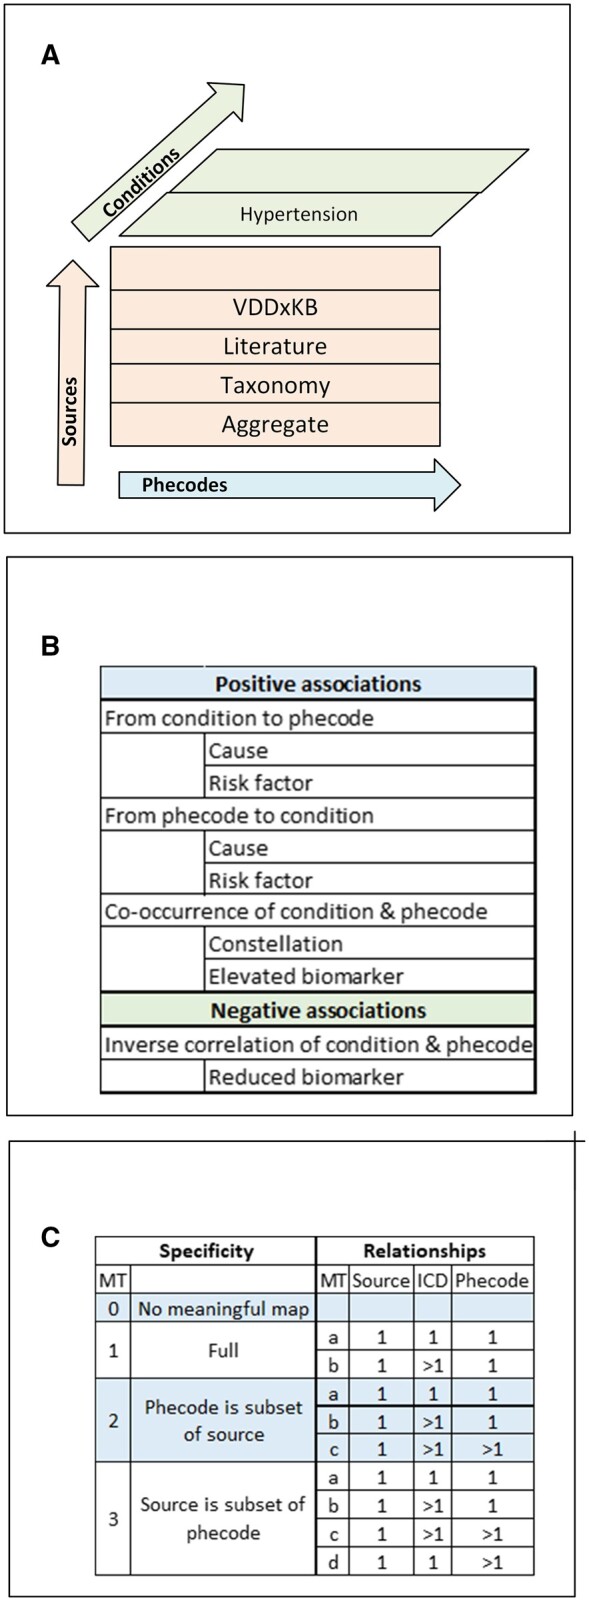
Unifying knowledgebase framework. (A) Content is represented in sections by source and in aggregate, with chapters for conditions, loosely coupled to phecodes; (B) content is represented as associations between condition and phecodes; (C) source terms map to ICDs then phecodes, maps are characterized by mapping type (MT).
The abstraction of a source includes associations between a condition of interest and phecodes, whether the association is positive or negative; the direction and type of association as depicted in Figure 1B. A positive association indicates the condition increases the likelihood of the phecode or vice versa. Some associations can be both positive and negative (eg, hypertension is a risk factor for ischemic heart disease which may result in hypotension). We refer to these associations as “positive and negative” or “pos+neg” for short. Direction may be from condition to phecode, from phecode to condition, or co-occurrence without known direction. Types of association encoded in the knowledgebase include cause; risk factor; system, part of a constellation; or co-occurrence.
Phecodes are manually curated groups of ICD-CM codes intended to capture clinically meaningful concepts for research. In this project, we used Phecode X,16 an extended phecode map that adds granularity to phecode version 1.2. Mappings between the knowledgebase and phecodes were refined iteratively by one investigator (WWS). The current iteration denotes variation in the specificity of the map by number and annotates combinations of mapping relationships with a letter as depicted in Figure 1C.
Literature review
One investigator (WWS) conducted a preliminary literature review to identify hypertension-associated disease entities. Expert searchers reviewed published literature for content pertaining to hypertension to ensure that the associations between each phecode and hypertension had valid evidentiary support. Supplementary Material IIA provides detailed search strategies. All diagnoses found through the literature review are positive associations. We did not review literature for negative associations.
VanderbiltDDx knowledgebase
VDDxKB content was developed from 1973 to 1984 and updated systematically through 1994.17 Select disease profiles were added from 2013 to 2017. VDDxKB contains 2 types of elements (diagnoses and manifestations), as well as information about these elements, and relationships between diagnosis pairs and diagnosis-manifestation pairs. This information is recorded in comma separated text files and linked by diagnosis IDs (DXID). Links between diagnosis pairs include direction, to or from first to second; nature of association between diagnosis pairs, eg, cause, predispose; frequency, an estimate of conditional probability of second given first; and evoking strength, relative likelihood of second given first. Diagnosis-manifestation pair links include frequency and evoking strength.8
One investigator (WWS) explored VDDxKB files and found 2 diagnoses representing arterial hypertension and 8 manifestations of a positive association with hypertension. The diagnoses are essential and malignant hypertension. The manifestations include 5 physical findings, diastolic blood pressure (DBP) 95–125, DBP >125, increased pulse pressure, paroxysmal increase in arterial pressure, systolic blood pressure (SBP) greater in arms than legs; and 3 hypertension history findings, abrupt onset, recent exacerbation, and resistant to treatment. We extracted DXIDs linked to these diagnoses or manifestations and represented the information in the links in the VDDxKB section of PhecodeKbHtn. The extract included 2 manifestations of a negative association with blood pressure, SBP <90 and DBP <60, if those manifestations were linked to one of the DXIDs that also had a positive association. We classified these as pos+neg associations.
Phecode taxonomy
Phecodes have parent-child structure supporting up to 4 levels of granularity and are grouped into disease categories, similar to ICD chapters. We consider the phecode taxonomy (PT) as a third knowledge source, in addition to its role as a mapping terminology. The PT section includes phecodes with strings containing “hypertension” and “hypertensive” encoded as pt = 1 and phecodes that are up-spread (pt = 2) or down-spread (pt = 3) from a phecode in the literature or VDDxKB maps. If the phecode string includes both “hypertensive” and a disease with a negative association, eg, hypertensive heart disease with heart failure, the association was classified as pos+neg, otherwise it was classified as positive.
Cohort extraction and data analysis
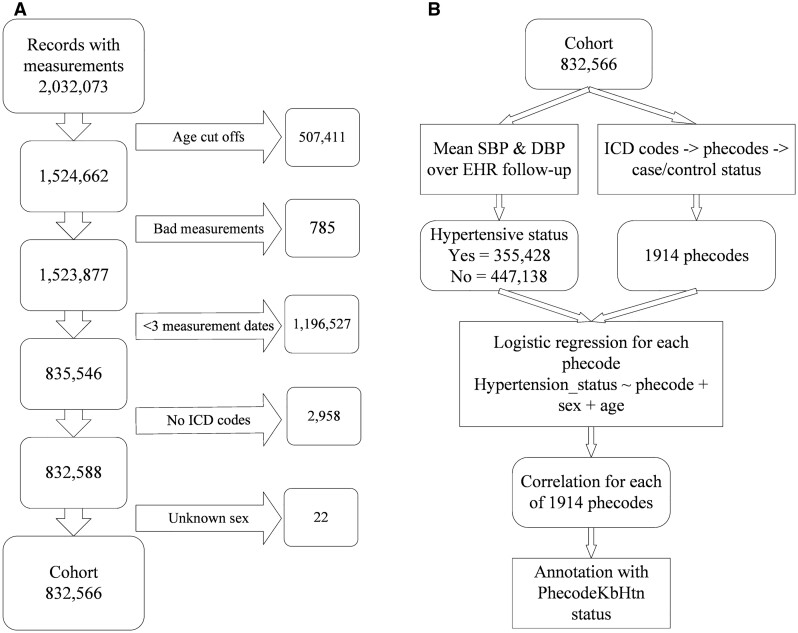
Figure 2 overviews the cohort extraction and data analysis process.
Figure 2.
Process flow. (A) Cohort extraction; (B) data analysis.
Data resource
We extracted data for this study from Vanderbilt University Medical Center’s (VUMC) Synthetic Derivative (SD),18 a deidentified image of EHR data. VUMC’s Institutional Review Board No. 211951 designated this study as not qualifying as human subject research. This study utilized the following data elements: demographic information (age, sex, date of birth), blood pressure and heart rate (HR) measurements, and ICD-CM codes (version 9 and 10). Our cohort included individuals with greater than 2 viable measurement triplets on distinct days between ages 18 and 81 years. We defined viable measurements as SBP >50 and <270, DBP >10 and <170, and HR >30 and <200 and calculated age in years by dividing days by 365.25. We excluded individuals with no ICDs and unknown sex.
Defining hypertension and hypertensive subtypes
We calculated means of SBP, DBP, and HR measurements over the course of EHR follow-up for each individual without adjustment for hypertensive medication. We tested the signal provided by these means with linear regression models using mean SBP, DBP, and HR as dependent variables and sex, first measurement age with a cubic spline, and the interaction between these 2 variables, as independent variables.
Using mean blood pressure readings, we classified individuals with hypertension (SBP ≥130, DBP ≥80) and those without hypertension (SBP <130, DBP <80) as defined by the 2017 American Heart Association (AHA) criteria.19 We further stratified mean blood pressure readings into 5 subtypes based on cutoffs in the criteria. These groups included 2 nonhypertensive subtypes, not elevated (SBP <120, DBP <80) and elevated (SBP 120–129, DBP <80. The hypertensive group was separated into 3 subtypes: isolated systolic (SBP ≥130, DBP <80), isolated diastolic (SBP <130, DBP ≥80), and a combined systolic and diastolic subtype (SBP ≥130, DBP ≥80). We stratified our cohort by first measurement age (10-year increments) and sex, and calculated the percentage of each subtype for each strata.
Defining cases and controls
ICD codes were mapped to Phecode X.16 For each phecode, we defined cases as individuals with 2 or more target phecodes on unique billing dates. We defined controls as individuals without the target phecode. We calculated the prevalence of each phecode for our entire cohort. Phecodes with fewer than 400 cases were excluded from subsequent analysis.
PheWAS analysis
We ran a PheWAS to explore associations between phecodes and the case/control status for hypertension. PheWAS uses logistic regression testing each phecode as the dependent variable. We included age at last encounter and sex as covariates. We used a Bonferroni correction to define “phenome-wide significant” associations (P value <.05/total number of tests). To assess the effect of multicollinearity in logistic regression tests, we computed the Variance Inflation Factor (VIF) using the vif() function available in the “car” R package.
Analysis of PheWAS results with PhecodeKbHtn associations
We tested the hypothesis that the effect size of PheWAS results would be correlated with PhecodeKbHtn association status (0 = not in knowledgebase, 3 = positive, 4 = pos+neg). We compared the resulting betas with a Kruskal-Wallis test, a nonparametric method testing whether samples come from the same distribution.20 Further, one investigator (WWS) compared PheWAS correlations to PhecodeKbHtn associations for each phecode in PhecodeKbHtn.
RESULTS
PhecodeKbHtn assembly
The literature review found 53 diagnoses associated with hypertension. All but one mapped to a phecode and the remaining 52 diagnoses map to 58 phecodes. These maps are provided in Supplementary Material IIB. The representation of the links between phecodes and literature diagnoses is presented in Supplementary Material IIC with direction of the association, type of association, and reference.21–35
VDDxKB contains 124 diagnoses associated with hypertension. Fourteen do not map to a phecode in a meaningful way. The remaining 110 map to 118 phecodes. These maps are provided in Supplementary Material IIIA. We present the VDDx content supporting the associations in the VDDx section of PhecodeKbHtn as Supplementary Material IIIB.
The specificity of the maps varies by source and is summarized Supplementary Material IVA. The specificity of the literature diagnosis is similar to the phecode in 75% of the maps compared to 49% for VDDxKB diagnoses. The VDDxKB diagnosis is a subset (ie, more specific) of the phecode in 36% of maps, while the literature diagnosis is a subset of the phecode in 10% of maps.
Each source contributes unique associations, ie, adds a phecode not in the other sources, and others that are additive, ie, providing additional information about direction or type of association, as depicted in Figure 3. The aggregate PhecodeKbHtn includes associations between hypertension and 167 phecodes, all of which are positive associations. Fifteen also include negative associations. The data dictionary for PhecodeKbHtn is included in Supplementary Material IVB. PhecodeKbHtn with positive or pos+neg association for each phecode, in aggregate and by section, are presented in Supplementary Material IVC.
Figure 3.
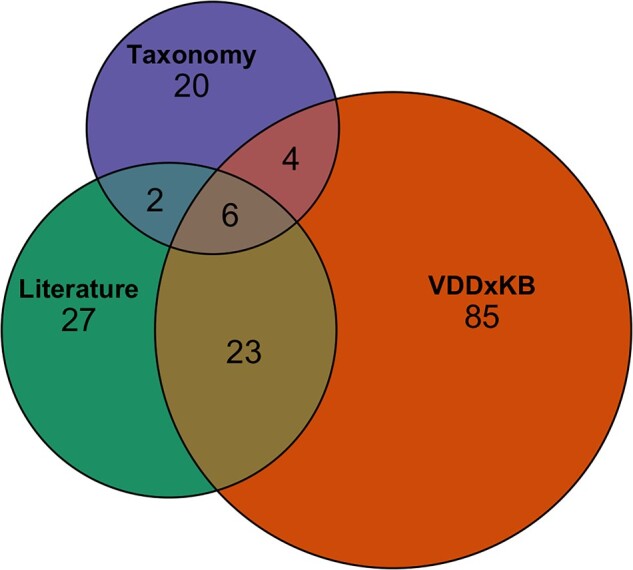
Phecodes contributed to PhecodeKbHtn by knowledge source.
Cohort description
The final cohort comprised 832 566 individuals, with 355 428 meeting AHA’s criteria for hypertension and 477 138 classified as without hypertension. Distribution of sex, measurements, duration of EHR follow-up, and hypertensive subtype are summarized by 10-year age increment in Supplementary Material V. Prevalence of phecodes for our entire cohort are provided in Supplementary Material VI.
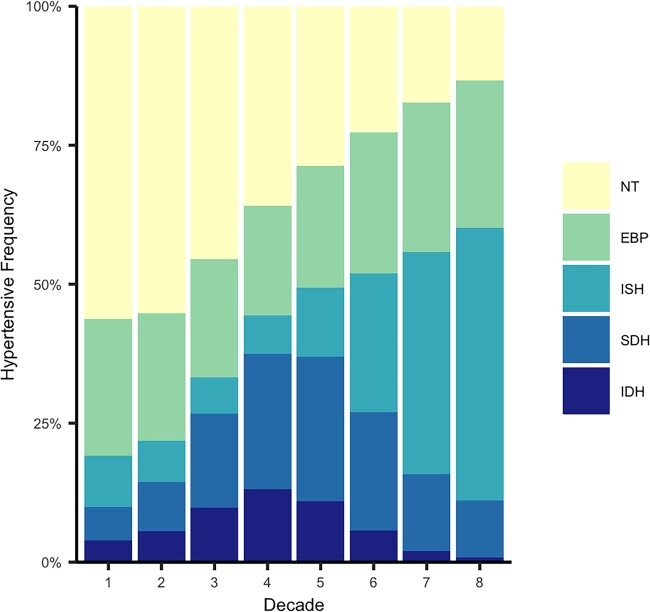
Figure 4 presents the linear regression models for mean SBP, DBP, and HR as dependent variables with first measurement age and gender as independent variables. Figure 5 visualizes shifts in the frequency distribution of the hypertensive subtypes by age in 10-year increments.
Figure 4.
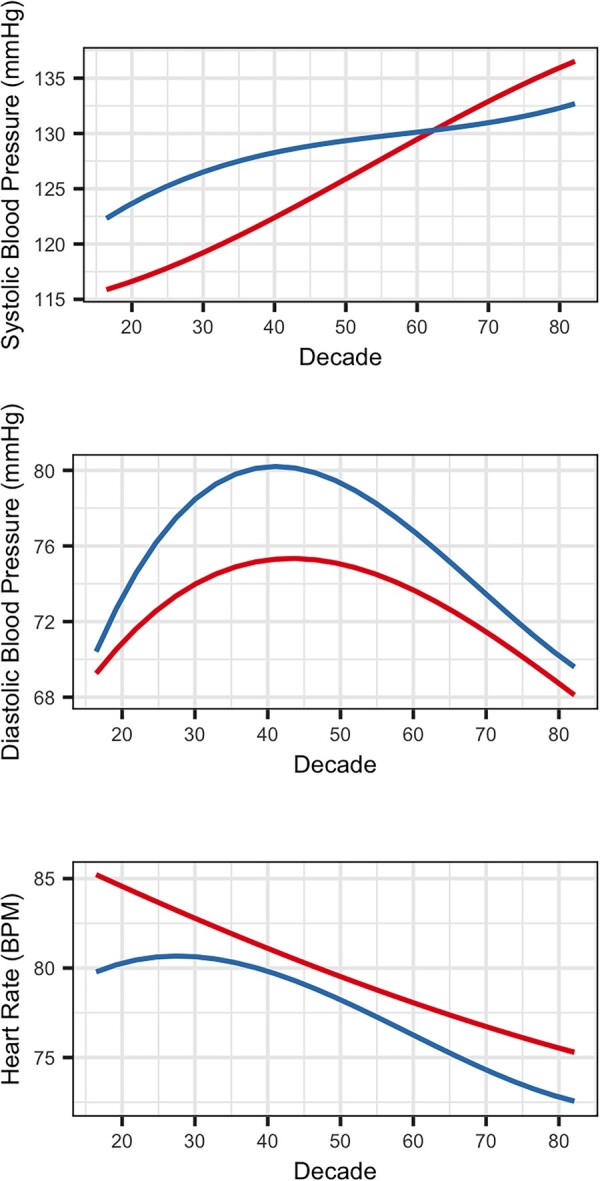
Linear models of mean blood pressures and heart rate (y axis) by age (x axis) and stratified by sex: female (red) and male (blue).
Figure 5.
Frequency of hypertensive subtypes by age. Not elevated (NT), elevated blood pressure (EBP), isolated systolic hypertension (ISH), combined systolic and diastolic hypertension (SDH), isolated diastolic hypertension (IDH).
PheWAS analysis
The PheWAS analysis included 1914 phecodes. The majority of correlations (61%) were “phenome-wide significant” indicating strong correlation with most phecodes tested. About 82.3% of phenome-wide significant correlations were negative (beta <1) and 17.7% were positive (beta >1). The VIF was within acceptable limits, and never exceeded 1.12. PheWAS results are presented with PhecodeKbHtn associations as Supplementary Material VII.
Comparison of PheWAS results with PhecodeKbHtn associations
Of the 167 phecodes in PhecodeKbHtn, 129 (77%) had adequate case counts to include in the PheWAS analysis, 116 positive associations and 13 pos+neg. The estimated effect sizes (betas) in PheWAS were significantly different for phecodes that were in PhecodeKbHtn versus those that were absent from the knowledgebase. PhecodeKbHtn positive phecodes had, on average higher betas, and pos+neg had lower betas (Figure 6; Supplementary Material VIII).
Figure 6.
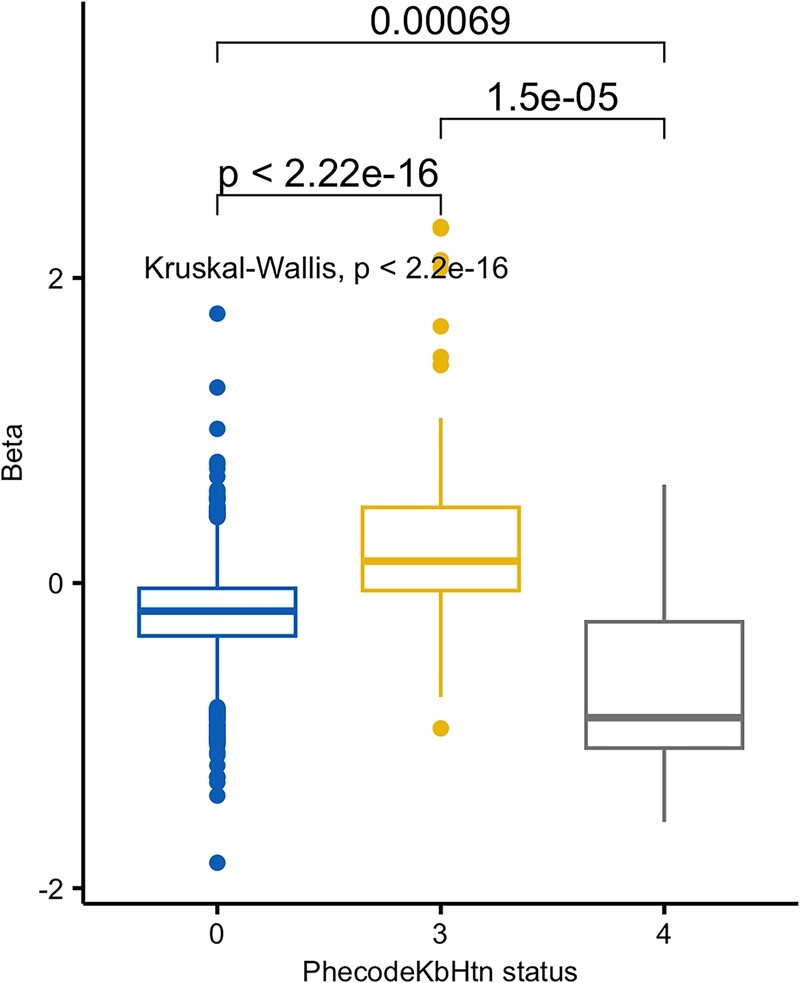
Betas of linear model of PheWAS correlations by PhecodeKbHtn association status.
Supplementary Material IX compares associations for phecodes in PhecodeKbHtn by section, with PheWAS correlations. About forty-three percent of positive associations and 100% of pos+neg associations aligned with the model’s correlations. Review of the 35 phecodes with positive association in PhecodeKbHtn and negative PheWAS correlations found explanation for association with reduced blood pressure in 31.36,37
DISCUSSION
This test of concept validates our 3 design principles and demonstrates feasibility of assembling a unifying knowledgebase to clarify relationships among disparate knowledge sources and EHR data.
The 3 knowledge sources differ in purpose, granularity, and currency. The literature review includes current expert syntheses such as UpToDate augmented by original publications as needed. VDDxKB reflects diagnostic terms, prevalence of disease, and frequency of manifestations as reported in the literature through 1994 and precoordinates diagnostic concepts with specific etiologies. The phecode taxonomy amalgamates diagnostic classifications, from ICD-9-CM, first formalized in 1979, and ICD-10-CM, first draft posted in 1997, into groups with emphasis on chronic conditions relevant to genetic associations.
Representing sources side-by-side, and loosely coupling them to phecodes, maintains the context implicit in each source. Linking associations from current literature and the earlier literature represented in VDDxKB provides visibility into evolution in terminology and knowledge that may be helpful when interpreting real world data entered over several years. The PT section makes explicit which phecodes include hypertensive ICD codes, limiting circular logic. Abstracting content within each source into a framework of clinically meaningful relationships between diagnoses and a condition of interest eases comparison of associations across sources. The aggregate positive or pos+neg associations from these disparate sources add robustness to the knowledgebase.
Phecode-based phenotypes have been extensively evaluated and shown to replicate known genetic associations for a wide variety of diseases.38 They capture case/control status across the medical phenome and are highly portable because they are based on standard codes. Mapping source diagnoses to phecodes is not a simple matter of matching the text in the phecode string. It requires looking at each member of the group of ICDs that define a phecode to determine its specificity. It is often necessary to look at the approximate synonyms in the ICD coding guide to identify which ICD is most likely to represent a concept in the EHR. For example, chronic gouty nephropathy is an approximate synonym of N28.9 Disorder of kidney and ureter, unspecified. This ICD is used for this condition instead of ones with gout in the name. Including the mapping type by phecode within each source gives visibility into differences in specificity.
Investigators derive indicators of hypertension using longitudinal real-world data in multiple ways (eg, mean39 or median40 of all valid measurements, mean of 2–3 consecutive measurements,41 ICD codes used alone or in combination with reported HTN treatment and/or BP measurements). Our linear regression models of mean SBP, DBP, and HR with age and sex as independent variables are similar to the results of cohort studies reporting trends over the life course.42,43 The AHA criteria are designed to classify blood pressures into stages associated with cardiovascular complications. By using the cutoffs in AHA criteria and further stratifying into subtypes reflecting various combinations of systolic and diastolic hypertension, we capture differences in hemodynamics. The frequency distribution of subtypes by 10-year increments aligns with the results of cohort studies pursuing that distinction.43,44 These findings suggest mean measurements over EHR follow-up provide meaningful signal.
The PheWAS analysis revealed a medical phenome that is strongly correlated with hypertension status, either in positive or in negative direction. The majority of PheWAS associations were significant, even after adjusting for multiple testing burden. This finding is likely explained, in part, by the multifactorial nature of hypertension. But many observed correlations are also likely to be artifactual and driven by complex relationships inherent in EHR data. For example, risk factors for hypertension may also lead to additional diseases. Furthermore, a diagnosis of hypertension may initiate a clinical care pathway in which new pathologies and discovered and documented. Our results suggest a unified knowledgebase strategy may aid in interpreting this complex web of PheWAS correlations, relating them to existing knowledge of a disease. We found that phecodes in PhecodeKbHtn had more robust effect sizes compared with those that were absent from the knowledgebase. Moreover, we found that positive associations in PhecodeKbHtn correlated with positive correlations in PheWAS while pos+neg associations correlated with negative correlations.
All but 4 of the PheWAS’s positive and negative correlations for phecodes in PhecodeKbHtn may be explained by associations in PhecodeKbHtn, additional cardiac complications of hypertension which may reduce blood pressure, and other causes of hypertension that have independent associations with hypotension. If the additional associations with reduced blood pressure had been represented in PhecodeKbHtn, 76% of the associations in PhecodeKbHtn would have aligned with PheWAS correlations. Therefore, it will be important to pay equal attention to positive and negative associations with a condition when abstracting knowledge sources. In the case of hypertension this will involve adding hypotension as a separate chapter with sections for each source. Representing positive associations with these 2 opposite conditions in separate chapters of the knowledgebase avoids ambiguity and allows capture of the union of the 2 as pos+neg in each where appropriate.
This test of concept has several limitations. One investigator (WWS) with a background in biomedical informatics and nephrology mapped source diagnoses to phecodes and extracted content related to hypertension from VDDxKB as a formative process. The cohort was drawn from patients seen at a tertiary medical center and is not representative of the general population. As a complex and multifactorial disease, hypertension may be a particularly challenging phenotype to investigate via PheWAS; further study is necessary to determine if the knowledgebase approach generalizes to other diseases. Conditions associated with hypertension and aging overlap. Finally, average SBP and DBP over the course of follow-up are summative indicators. The PheWAS analysis did not use information regarding the timing of diagnoses and blood pressure measures across an individual patient record. Despite this temporal flattening, we still observed a significant concordance between PheWAS correlations and the knowledgebase, but the signal may have been attenuated compared with a temporally sensitive approach.
The next step is to repeat the knowledgebase assembly process with hypotension as the condition to explore how chapters of associations with opposite conditions work together. Future work might include developing a chapter with a genetic mutation as the condition to explore use of a multicondition knowledgebase as an aid to interpretation of a PheWAS with many fewer phecodes with phenome-wide significance. Additional knowledge sources might be piloted as part of the assembly of a chapter and extended to other chapters as appropriate.
CONCLUSION
We present methods to assemble a knowledgebase to link known associations from disparate knowledge sources to EHR data to aid interpretation of clinical correlations observed in real-world clinical data. Our test of concept shows multiple sources add robustness to the aggregate knowledgebase while its structure preserves context implicit in a source; mean blood pressure measurements over EHR follow-up provide meaningful signal to explore associations with hypertension; and the knowledgebase may be used to explore whether PheWAS correlations are known or potentially novel. These methods open the door to reuse of the labor-intensive research required to interpret results for a PheWAS across subsequent studies.
Supplementary Material
ACKNOWLEDGMENTS
The authors thank Dr Randolph Miller for providing access to the VanderbiltDDx knowledgebase and for explaining the content of the files. In 2017, Vanderbilt licensed exclusive rights to use the VanderbiltDDxKB in commercial products to a California start-up company, Dr Assist, which now goes by the name Curai Health. Part of the agreement allows Vanderbilt to use the KB for research and also use it in noncommercial applications that Vanderbilt can distribute. Vanderbilt is not allowed to distribute the VanderbiltDDx knowledge base in its native form free of charge, except when shared with noncommercial entities via nondisclosure agreements. The authors also thank Annette Williams for her contributions to the literature review.
Contributor Information
William W Stead, Department of Biomedical Informatics, Vanderbilt University Medical Center, Nashville, Tennessee, USA; Department of Medicine, Vanderbilt University Medical Center, Nashville, Tennessee, USA.
Adam Lewis, Department of Biomedical Informatics, Vanderbilt University Medical Center, Nashville, Tennessee, USA.
Nunzia B Giuse, Department of Biomedical Informatics, Vanderbilt University Medical Center, Nashville, Tennessee, USA; Center for Knowledge Management, Vanderbilt University Medical Center, Nashville, Tennessee, USA.
Taneya Y Koonce, Center for Knowledge Management, Vanderbilt University Medical Center, Nashville, Tennessee, USA.
Lisa Bastarache, Department of Biomedical Informatics, Vanderbilt University Medical Center, Nashville, Tennessee, USA.
FUNDING
Partial support for the project was provided by R01-LM010685 from the National Library of Medicine. The project used data resources supported by CTSA award No. UL1 TR002243 from the National Center for Advancing Translational Sciences. The manuscript’s contents are solely the responsibility of the authors and do not necessarily represent official views of the National Library of Medicine, National Center for Advancing Translational Sciences, or the National Institutes of Health.
AUTHOR CONTRIBUTIONS
WWS—concept and design, analysis and interpretation of data, drafting of manuscript, critical revision of manuscript, funding; AL—acquisition, analysis of data, drafting of manuscript; NBG—design and interpretation of literature review, critical revision of manuscript; TYK—conduct and interpretation of literature review, critical revision of manuscript; LB—concept and design, acquisition, analysis and interpretation of data, drafting of manuscript, critical revision of manuscript, funding.
SUPPLEMENTARY MATERIAL
Supplementary material is available at Journal of the American Medical Informatics Association online.
CONFLICT OF INTEREST STATEMENT
Reported on ICJME form by author.
DATA AVAILABILITY
Summary data for all analyses are included in the online Supplementary Material. Phecode maps and auxiliary files are freely available on our website (phewascatalog.org) and the PheWAS computational pipeline is available from GitHUb. PhecodeKbHtn will be made available on this website concurrent with publication of this manuscript.
REFERENCES
- 1. Feinstein AR. An analysis of diagnostic reasoning. I. The domains and disorders of clinical macrobiology. Yale J Biol Med 1973; 4: 212–32. [PMC free article] [PubMed] [Google Scholar]
- 2. Godber G. The effect of specialisation on the practice of medicine. Lancet 1978; 1 (8058): 257–9. [DOI] [PubMed] [Google Scholar]
- 3. Bastarache L, Denny JC, Roden DM.. Phenome-wide association studies. JAMA 2022; 327 (1): 75–6. [DOI] [PMC free article] [PubMed] [Google Scholar]
- 4. Bastarache L. Using phecodes for research with the electronic health record: from PheWAS to PheRS. Annu Rev Biomed Data Sci 2021; 4: 1–19. [DOI] [PMC free article] [PubMed] [Google Scholar]
- 5. Mosley JD, Feng Q, Wells QS, et al. A study paradigm integrating prospective epidemiologic cohorts and electronic health records to identify disease biomarkers. Nat Commun 2018; 9 (1): 3522. [DOI] [PMC free article] [PubMed] [Google Scholar]
- 6. Hripcsak G, Albers DJ.. Next-generation phenotyping of electronic health records. J Am Med Inform Assoc 2013; 20 (1): 117–21. [DOI] [PMC free article] [PubMed] [Google Scholar]
- 7. Stead WW, Miller RA, Musen MA, Hersh WR.. Integration and beyond: linking information from disparate sources and into workflow. J Am Med Inform Assoc 2000; 7 (2): 135–45. [DOI] [PMC free article] [PubMed] [Google Scholar]
- 8. Miller RA, Pople HE Jr, Myers JD.. Internist-1, an experimental computer-based diagnostic consultant for general internal medicine. N Engl J Med 1982; 307 (8): 468–76. [DOI] [PubMed] [Google Scholar]
- 9. VDDx. https://apps.apple.com/us/app/vanderbiltddx-case-simulator/id1484979647. Accessed January 27, 2023.
- 10. Bodenreider O, Stevens R.. Bio-ontologies: current trends and future directions. Brief Bioinform 2006; 7 (3): 256–74. [DOI] [PMC free article] [PubMed] [Google Scholar]
- 11. Noy NF, Shah NH, Whetzel PL, et al. BioPortal: ontologies and integrated data resources at the click of a mouse. Nucleic Acids Res 2009; 37 (Web Server issue): W170–3. [DOI] [PMC free article] [PubMed] [Google Scholar]
- 12. Paulheim H. Knowledge graph refinement: a survey of approaches and evaluation methods. SWJ 2016; 8 (3): 489–508. [Google Scholar]
- 13. Noy N, Gao Y, Narayanan A, et al. Industry-scale knowledge graphs: lessons and challenges: five diverse technology companies show how it’s done. Queue 2019; 17 (2): 48–75. [Google Scholar]
- 14. Thorn CF, Klein TE, Altman RB.. Pharmacogenomics and bioinformatics: PharmGKB. Pharmacogenomics 2010; 11 (4): 501–5. [DOI] [PMC free article] [PubMed] [Google Scholar]
- 15. Barbarino JM, Whirl-Carrillo M, Altman RB, Klein TE.. PharmGKB: a worldwide resource for pharmacogenomic information. Wiley Interdiscip Rev Syst Biol Med 2018; 10 (4): e1417. [DOI] [PMC free article] [PubMed] [Google Scholar]
- 16. Phecode X. (Extended). https://phewascatalog.org/phecode_x. Accessed February 18, 2023.
- 17. Giuse DA, Giuse NB, Miller RA.. Consistency enforcement in medical knowledge base construction. Artif Intell Med 1993; 5 (3): 245–52. [DOI] [PubMed] [Google Scholar]
- 18. Danciu I, Cowan JD, Basford M, et al. Secondary use of clinical data: the Vanderbilt approach. J Biomed Inform 2014; 52: 28–35. [DOI] [PMC free article] [PubMed] [Google Scholar]
- 19. Whelton PK, Carey RM, Aronow WS, et al. 2017 ACC/AHA/AAPA/ABC/ACPM/AGS/APhA/ASH/ASPC/NMA/PCNA guideline for the prevention, detection, evaluation, and management of high blood pressure in adults: a report of the American College of Cardiology/American Heart Association Task Force on Clinical Practice Guidelines. J Am Coll Cardiol 2018; 71 (19): e127–248. [DOI] [PubMed] [Google Scholar]
- 20. Kruskal W, Wallis WA.. Use of ranks in one criterion variance analysis. J Am Stat Assoc 1952; 47 (260): 583–621. [Google Scholar]
- 21. Chobanian AV, Bakris GL, Black HR, et al. ; National High Blood Pressure Education Program Coordinating Committee. Seventh Report of the Joint National Committee on Prevention, Detection, Evaluation, and Treatment of High Blood Pressure. Hypertension 2003; 42 (6): 1206–52. [DOI] [PubMed] [Google Scholar]
- 22. Basile J. Overview of hypertension in adults. https://www.uptodate.com/contents/overview-of-hypertension-in-adults. Accessed April 30, 2023. [Google Scholar]
- 23. Chobanian AV. Clinical practice. Isolated systolic hypertension in the elderly. N Engl J Med 2007; 357 (8): 789–96. [DOI] [PubMed] [Google Scholar]
- 24. Bakris GL. Treatment of hypertension in patients with diabetes mellitus. https://www.uptodate.com/contents/treatment-of-hypertension-in-patients-with-diabetes-mellitus. Accessed April 30, 2023. [Google Scholar]
- 25. Arauz-Pacheco C, Parrott MA, Raskin P.. Treatment of hypertension in adults with diabetes. Diabetes Care 2003; 26 (Suppl 1): S80–2. [DOI] [PubMed] [Google Scholar]
- 26. Hypertension in Diabetes Study (HDS): I. Prevalence of hypertension in newly presenting type 2 diabetic patients and the association with risk factors for cardiovascular and diabetic complications. J Hypertens 1993; 11: 309–17. [DOI] [PubMed] [Google Scholar]
- 27. Mulè G, Nardi E, Cottone S, et al. Relationship of metabolic syndrome with pulse pressure in patients with essential hypertension. Am J Hypertens 2007; 20 (2): 197–203. [DOI] [PubMed] [Google Scholar]
- 28. Ellims AH, Mariani JA, Schlaich MP.. Restoration of blood pressure control with pacemaker implantation in a patient with bradycardia and resistant hypertension: a case report. Int J Cardiol 2013; 167 (2): e38–40. [DOI] [PubMed] [Google Scholar]
- 29. Vasan RS. Epidemiology of heart failure. https://www.uptodate.com/contents/epidemiology-of-heart-failure. Accessed April 30, 2023. [Google Scholar]
- 30. Rordorf G. Spontaneous intracerebral hemorrhage: pathogenesis, clinical features, and diagnosis. https://www.uptodate.com/contents/spontaneous-intracerebral-hemorrhage-pathogenesis-clinical-features-and-diagnosis. Accessed April 30, 2023. [Google Scholar]
- 31. Radhakrishnan J. Glomerular disease: evaluation and differential diagnosis in adults. https://www.uptodate.com/contents/glomerular-disease-evaluation-and-differential-diagnosis-in-adults. Accessed April 30, 2023. [Google Scholar]
- 32. Curhan GC. Kidney stones in adults: epidemiology and risk factors. https://www.uptodate.com/contents/kidney-stones-in-adults-epidemiology-and-risk-factors. Accessed April 30, 2023. [Google Scholar]
- 33. Borghi L, Meschi T, Guerra A, et al. Essential arterial hypertension and stone disease. Kidney Int 1999; 55 (6): 2397–406. [DOI] [PubMed] [Google Scholar]
- 34. Mann JFE. Overview of hypertension in acute and chronic kidney disease. https://www.uptodate.com/contents/overview-of-hypertension-in-acute-and-chronic-kidney-disease. Accessed April 30, 2023. [Google Scholar]
- 35. Ihm CG. Hypertension in chronic glomerulonephritis. Electrolyte Blood Press 2015; 13 (2): 41–5. [DOI] [PMC free article] [PubMed] [Google Scholar]
- 36. Udovcic M, Pena RH, Patham B, Tabatabai L, Kansara A.. Hypothyroidism and the heart. Methodist Debakey Cardiovasc J 2017; 13 (2): 55–9. [DOI] [PMC free article] [PubMed] [Google Scholar]
- 37. Lambova S. Cardiac manifestations in systemic sclerosis. World J Cardiol 2014; 6 (9): 993–1005. [DOI] [PMC free article] [PubMed] [Google Scholar]
- 38. Denny JC, Bastarache L, Ritchie MD, et al. Systematic comparison of phenome-wide association study of electronic medical record data and genome-wide association study data. Nat Biotechnol 2013; 31 (12): 1102–10. [DOI] [PMC free article] [PubMed] [Google Scholar]
- 39. Ganesh SK, Chasman DI, Larson MG, et al. ; Global Blood Pressure Genetics Consortium. Effects of long-term averaging of quantitative blood pressure traits on the detection of genetic associations. Am J Hum Genet 2014; 95 (1): 49–65. [DOI] [PMC free article] [PubMed] [Google Scholar]
- 40. Manemann SM, St Sauver JL, Liu H, et al. Longitudinal cohorts for harnessing the electronic health record for disease prediction in a US population. BMJ Open 2021; 11 (6): e044353. [DOI] [PMC free article] [PubMed] [Google Scholar]
- 41. Yamada MH, Fujihara K, Kodama S, et al. Associations of systolic blood pressure and diastolic blood pressure with the incidence of coronary artery disease or cerebrovascular disease according to glucose status. Diabetes Care 2021; 44 (9): 2124–31. [DOI] [PubMed] [Google Scholar]
- 42. Burt VL, Whelton P, Roccella EJ, et al. Prevalence of hypertension in the US adult population. Results from the Third National Health and Nutrition Examination Survey, 1988–1991. Hypertension 1995; 25 (3): 305–13. [DOI] [PubMed] [Google Scholar]
- 43. Gavish B, Bursztyn M.. Ambulatory pulse pressure components: concept, determination and clinical relevance. J Hypertens 2019; 37 (4): 765–74. [DOI] [PubMed] [Google Scholar]
- 44. Franklin SS, Jacobs MJ, Wong ND, L’Italien GJ, et al. Predominance of isolated systolic hypertension among middle-aged and elderly US hypertensives: analysis based on National Health and Nutrition Examination Survey (NHANES) III. Hypertension 2001; 37 (3): 869–74. [DOI] [PubMed] [Google Scholar]
Associated Data
This section collects any data citations, data availability statements, or supplementary materials included in this article.
Supplementary Materials
Data Availability Statement
Summary data for all analyses are included in the online Supplementary Material. Phecode maps and auxiliary files are freely available on our website (phewascatalog.org) and the PheWAS computational pipeline is available from GitHUb. PhecodeKbHtn will be made available on this website concurrent with publication of this manuscript.


