

Abstract
The comet assay is a versatile method to detect nuclear DNA damage in individual eukaryotic cells, from yeast to human. The types of damage detected encompass DNA strand breaks and alkali-labile sites (e.g., apurinic/apyrimidinic sites), alkylated and oxidized nucleobases, DNA–DNA crosslinks, UV-induced cyclobutane pyrimidine dimers and some chemically induced DNA adducts. Depending on the specimen type, there are important modifications to the comet assay protocol to avoid the formation of additional DNA damage during the processing of samples and to ensure sufficient sensitivity to detect differences in damage levels between sample groups. Various applications of the comet assay have been validated by research groups in academia, industry and regulatory agencies, and its strengths are highlighted by the adoption of the comet assay as an in vivo test for genotoxicity in animal organs by the Organisation for Economic Co-operation and Development. The present document includes a series of consensus protocols that describe the application of the comet assay to a wide variety of cell types, species and types of DNA damage, thereby demonstrating its versatility.
Introduction
The alkaline comet assay (single-cell gel electrophoresis) is a sensitive method that detects DNA strand breaks (SBs) and alkali-labile sites (ALS) in the nucleus of virtually all types of eukaryotic cells. ALS are not well defined but, as the name suggests, are essentially any DNA modification that becomes an SB under alkaline conditions, e.g., apurinic/apyrimidinic (AP) sites. The principle of the comet assay relies on the spatial organization of DNA in the nucleus, namely loops of DNA formed by attachment of the linear molecule at intervals to the nuclear matrix, and additional winding of the double helix around protein cores to form nucleosomes. This organization means that, when the proteins are removed during the lysis step of the assay, the DNA remains in a compact supercoiled state. However, if a DNA SB is present, the supercoiling of the loops relaxes. As a result of this relaxation, these loops, which are still attached to the nuclear matrix, are drawn towards the anode, forming the characteristic ‘comet tail’, seen under a fluorescence microscope. The relative amount of total DNA in the tail reflects the frequency of breaks. The name ‘comet assay’ was introduced in 1990 (ref. 1) and was adopted as a Medical Subject Heading in PubMed in 2000.
The comet assay is used worldwide as a standard method for the detection of DNA damage in genotoxicity testing and human biomonitoring studies2. It is also a popular tool in the field of ecotoxicology and environmental monitoring for studying different animal and plant species3–5.
The first multilaboratory, collaborative review on the use of the comet assay, including information about the development of the assay, principles, applications and protocols, was published in 1993 (ref. 6). However, the first initiative to develop a guideline for the comet assay in genetic toxicology, including in vitro and in vivo studies, was published in 2000 (ref. 7). A formal validation study was performed during 2006–2012, culminating in the adoption of the in vivo mammalian, alkaline comet assay as the Organisation for Economic Co-operation and Development (OECD) test guideline no. 489 in 2014 (updated in 2016)8. Despite the importance of an OECD guideline, some limitations remain. For instance, this guideline does not include species other than mammals, and lesions other than SBs and ALS are not considered, nor is the measurement of DNA repair or the application to biomonitoring. Indeed, it was the application of the comet assay to human biomonitoring that led the research community to collaborate and develop standardized procedures, to achieve congruent baseline levels of DNA damage and consistent reporting of procedures. These issues have been addressed through a number of multilaboratory validation studies, specifically the European Standards Committee on Oxidative DNA Damage (ESCODD)9–11, the European Comet Assay Validation Group (ECVAG)12–18 and the COST Action hCOMET (CA15132) (the comet assay as a human biomonitoring tool)19. Additionally, and in the framework of hCOMET, technical recommendations have been developed for the application of the comet assay to human samples20,21. Most recently, a protocol for the comet-based DNA repair assay22, and recommendations for Minimum Information for Reporting Comet Assay (MIRCA) procedures and results23, have been published also under the auspices of hCOMET.
A previous Nature Protocols article described the neutral comet assay and a specific alkaline version of the comet assay24. Here we extend this knowledge to cover the most widely used alkaline method, and its various modifications, and we also provide protocols applicable to different sample types, from various eukaryotic species, including yeast, non-mammalian species, mammals and plants. Before describing the comet assay protocol, we provide details of appropriate methods for isolating cells from different specimens, as this is key to avoiding artifactual formation of DNA damage and hence to achieving maximal specificity of the assay.
The development of the alkaline comet assay
The comet assay was first described in 1984, as a method for the detection of radiation-induced DNA breaks in single mammalian cells25. The method was modified a few years later by increasing the pH of the electrophoresis solution, resulting in the alkaline comet assay most widely used today26. Since the early 1990s, the comet assay has replaced the previously most popular methods for detection of SBs and ALS, namely alkaline elution and alkaline unwinding27.
The alkaline comet assay measures both single and double SBs (as well as ALS); it is referred to in this paper as the standard comet assay. In other methods for measuring DNA breaks, namely alkaline unwinding and alkaline elution, the alkaline conditions are crucial, as the methods require DNA denaturation. This is not the case for the comet assay25, as migration of the DNA depends on relaxation of supercoils, which occurs at both neutral and alkaline pH. This explanation is not universally accepted, and the neutral version of the assay is employed in the belief, by some, that it detects only double SBs. Even after 35 years, this issue is still controversial, and experiments to decide definitively between the alternative explanations are needed. The neutral comet assay protocol developed by Olive et al.28 to measure double SBs involves lysis in sodium dodecyl sulfate and incubation for 4 h at 50 °C with proteinase K—conditions sufficiently different from the standard comet assay protocol that separation of DNA from the nuclear matrix is likely to occur, so that true double-stranded DNA fragments are released, migrating towards the anode. Protocols described in this article are restricted to the alkaline comet assay.
Recent advances in the comet assay have led to high-throughput versions of the assay, many of which utilize multiple gels, instead of the conventional one or two per slide; for example, 12 agarose mini-gels on one microscope slide29, or 48 or 96 mini-gels on a GelBond film30, or a ‘microarray’ of cells, in a 96-well plate pattern (e.g., CometChip)31. In addition, the spectrum of DNA lesions detected is increased by the inclusion of lesion-specific enzymes capable of converting damaged nucleobases to DNA SBs; for instance, bacterial endonuclease III (EndoIII), catalyzing the excision of oxidized pyrimidines, or formamidopyrimidine-DNA glycosylase (Fpg), and human 8-oxoguanine DNA glycosylase 1 (hOGG1), catalyzing the excision of oxidized purines32–34. Apart from DNA nucleobase oxidation, the comet assay is also used for the evaluation of DNA lesions induced by crosslinking agents, such as cisplatin35–37. Additionally, the combination of the comet assay and fluorescence in situ hybridization (comet–FISH) allows the investigation of gene region-specific DNA damage and repair38–41. One of the newest variants of the comet assay includes its adaptation to detect global methylation levels, through treatment with specific restriction enzymes42,43.
Overview of the protocol for the alkaline comet assay
A single-cell suspension is necessary to perform the comet assay. In some cases, the sample is already a cell suspension, but when working with adherent cells, spheroids, whole organisms or tissues, mechanical and/or enzymic processing in specific buffers is required. In some samples, such as yeast, the cell wall also needs to be lysed. All these procedures are described in detail in the protocols below. The possibility of freezing cell suspensions, blood or solid tissues for later analysis is also discussed; this has logistical advantages for in vivo animal experiments and human biomonitoring where samples cannot be analyzed immediately.
After isolation of the cells of interest, the comet assay protocol is divided into four main stages, as described below and shown in Fig. 1, although the precise conditions employed in these stages may vary depending on the type of specimen used (Table 1). The protocol is accompanied by tutorial videos to illustrate the various steps (overview: https://youtu.be/KkuAj_COOR8); we believe that, by following these steps, results will become more reproducible and comparable between individual laboratories and research groups.
Fig. 1 |. Overview of the standard and the enzyme-modified comet assay protocols.
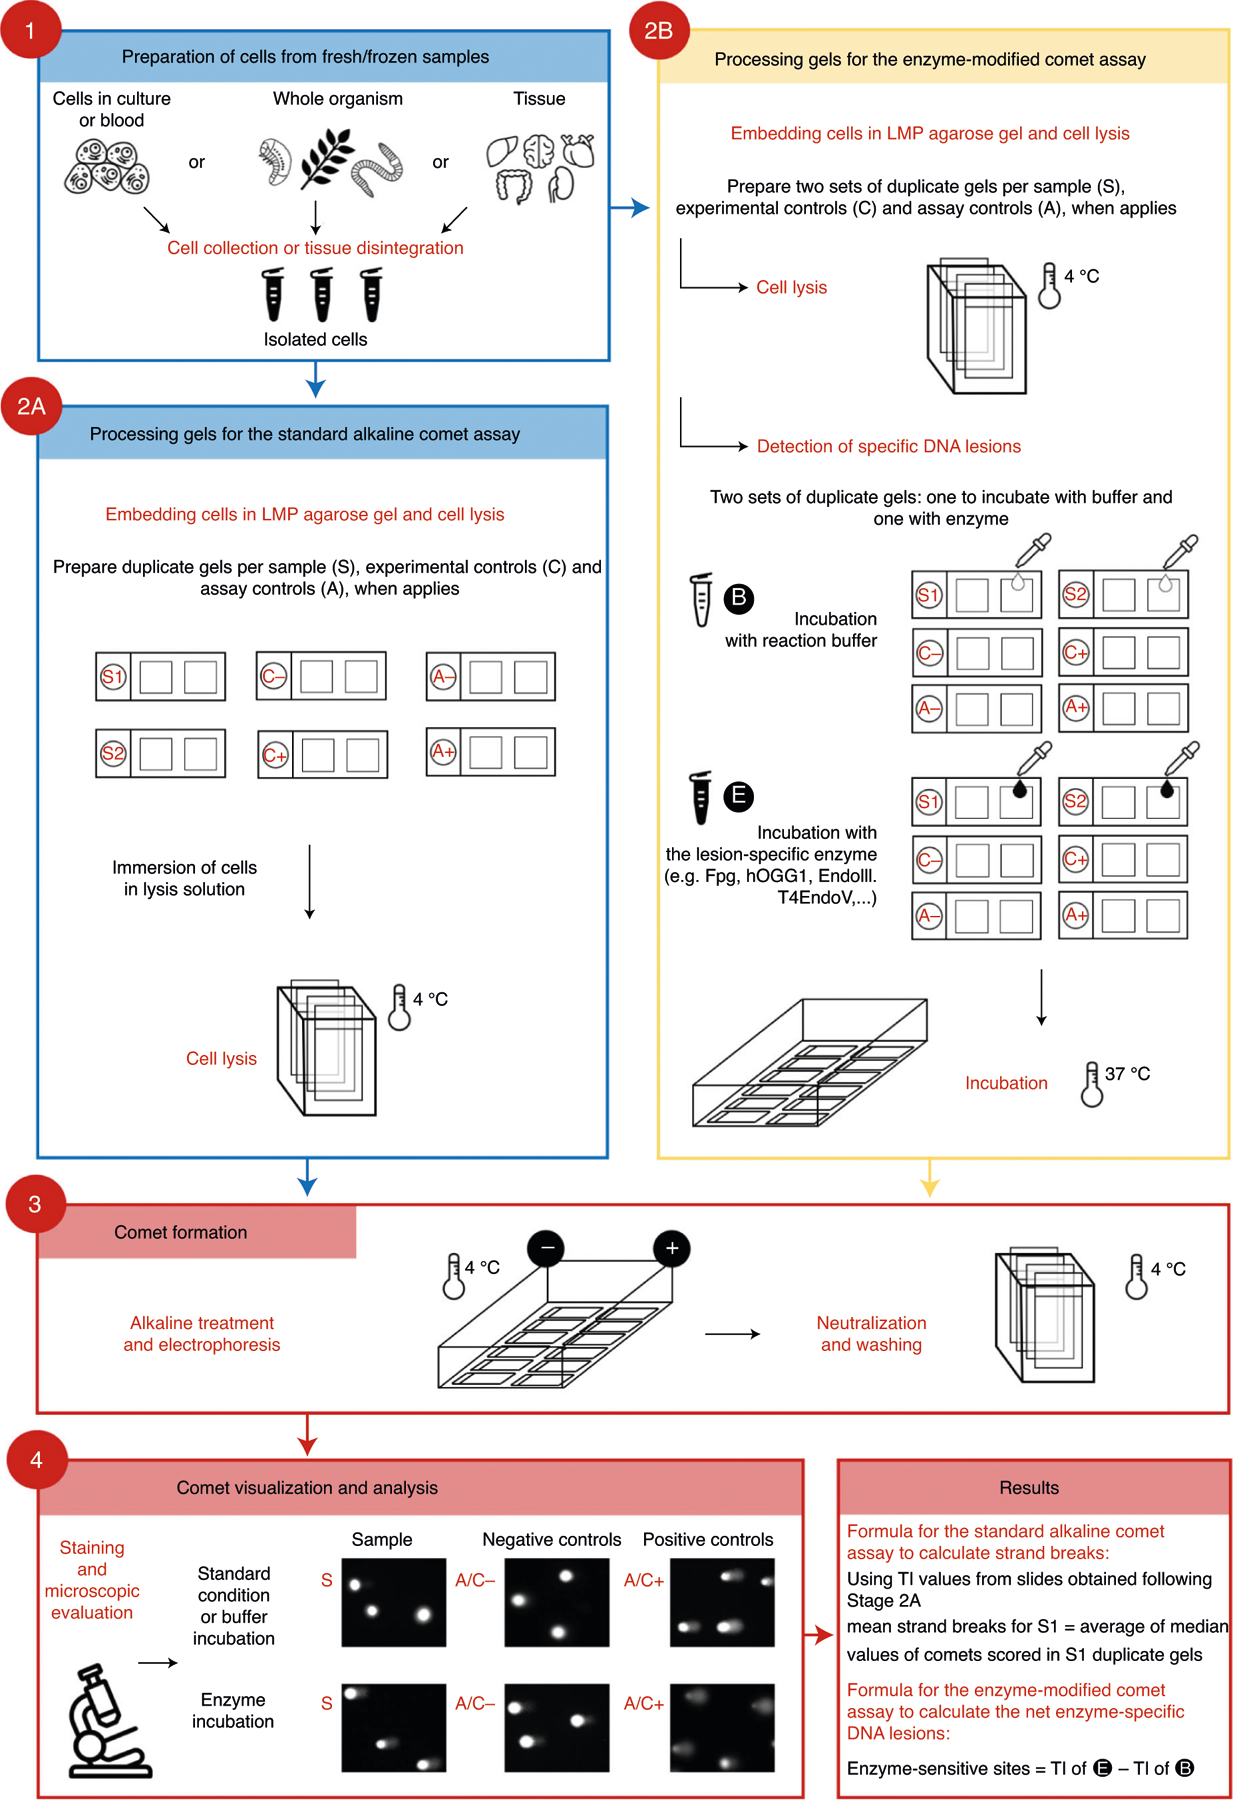
Stage 1 involves the isolation of single cells, which are processed in either the standard (Stage 2A) or enzyme-modified (Stage 2B) comet assay. In the second stage of the standard comet assay, nucleoids are embedded in agarose and lysed. The enzyme-modified comet assay contains an additional step where the nucleoids are incubated with DNA repair enzymes such as formamidopyrimidine DNA glycosylase (Fpg), human 8-oxoguanine DNA glycosylase 1 (hOGG1), endonuclease III (EndoIII), or T4 endonuclease V (T4endoV). Stage 3 entails a DNA unwinding step, electrophoresis and subsequent neutralization of the slides. Stage 4 is the visualization and microscopic evaluation of comets in the samples (S) as well as negative (A/C−) and positive (A/C+) assay controls. Finally, the results are expressed as, e.g., tail intensity (TI) for DNA SBs, or in the case of enzyme-sensitive sites as net TI by subtracting TI for the buffer-treated slides from TI for the enzyme-treated slides.
Table 1 |.
Experimental models and sample types that can be used with the described procedure
| Experimental models | Sample types |
|---|---|
| In vitro | |
| Cell lines and primary culture | Single cell culture and co-culture |
| 3D cell models | Liver spheroids, reconstructed human full-thickness (FT) skin tissues (dermis and epidermis) and reconstructed airway/lung tissues |
| Zebrafish | Embryos and larvae |
| Yeast | Single culture of different strains and species |
| Plants | Organs |
| Bryophyta, Pinophyta, Ginkgophyta, monocots, eudicots | Roots, leaves |
| In vivo—non-mammalian | Organs/samples |
| Crustaceans: Daphnia magna, Ceriodaphnia dubia | Whole organism |
| Planarians: Schmidtea mediterranea, Dugesia japonica | Whole organism |
| Insects: Drosophila melanogaster | Hemocytes and neuroblasts |
| Insects: Chironomus riparius | Larvae, whole organism |
| Annelids: earthworm, Eisenia foetida | Coelomocytes |
| Mollusks: Bivalvia | Hemolymph, gills, digestive glands |
| Amphibians | Blood from anuran amphibians at premetamorphic stages |
| Fish: zebrafish (Danio rerio), mosquitofish (Gambuzia holbrooki), gilthead seabream (Sparus aurata), Senegalese sole (Solea soleganensis) and European eel (Anguilla anguilla) | Blood, liver, gills, gonads and sperm |
| In vivo—mammalian | Organs/samples |
| Rodents | Blood, bone marrow, liver, kidney, lung, spleen, brain (hippocampus, prefrontal cortex), glandular stomach, duodenum, jejunum, ileum, colon, skeletal muscle, heart, aorta, bladder, adrenals, hypothalamus, thyroid, pituitary, pineal gland, pancreas, epidermal cells, ovary, prostate, mammary gland, uterus, testis, germ cells and sperm |
| Humans (for biomonitoring studies) | Blood and derived cells (including buffy coat); buccal mononuclear cells (MNCs); buccal, nasal, lachrymal and conjunctival epithelial cells; sperm; and placental cells |
Stage 1: preparation of cells from fresh or frozen samples
The first stage is the isolation of cells from whole organisms, animal or plant tissues, biopsies, blood samples, spheroids or cell culture. Blood cells are most convenient in human biomonitoring studies as they are already a single-cell suspension. Likewise, cells growing in suspension cultures can be used directly in the comet assay, whereas adherent cells must be detached from the cell culture plate and resuspended in a suitable buffer. Spheroids, tissues, biopsies or whole organisms are homogenized before processing in the comet assay. The current protocol describes these cell-processing steps for a wide variety of organisms and biomatrices. Tutorial videos for certain sample types can be found in this playlist: https://youtube.com/playlist?list=PLEVxCdaQpbj1LBaBPneAZVaCpwzETlJ65
Stage 2A: processing gels for the standard alkaline comet assay
In the second stage (tutorial video: https://youtu.be/FXSTSCtgo-k), cells are suspended in low-melting-point (LMP) agarose at 37 °C, and placed on microscope slides, or plastic (GelBond) films, and the agarose is allowed to solidify on a cold plate, or in a fridge. (Normal agarose is not suitable, as the higher temperature required to maintain it in a liquid state would probably damage the cells’ DNA.) The gelembedded cells are then lysed to remove membranes and other cytoplasmic material, resulting in protein-depleted nuclei with supercoiled DNA attached to the nuclear matrix—structures known as nucleoids. Modification of the lysis procedure is necessary for specific biomatrices, such as buccal cells, sperm and yeast. In the case of plants, nuclei are released mechanically rather than through lysis.
Stage 2B: processing gels for the enzyme-modified comet assay
The enzyme-modified comet assay includes an additional step after lysis (tutorial video: https://youtu.be/x0Xt84R6Bho). The gel-embedded nucleoids are incubated with bacterial, bacteriophage or human DNA repair enzymes that recognize specific DNA lesions and lead to the creation of additional SBs. The cells are embedded as described in Stage 2A, but slides need to be prepared in duplicate: one slide to incubate with reaction buffer and one slide to incubate with the enzyme.
Stage 3: comet formation
After lysis (and optional enzyme digestion), the samples are transferred to an alkaline solution (tutorial video: https://youtu.be/s52tkqVNTUA). ‘Comets’ are formed during subsequent electro-phoresis in this solution. DNA loops containing SBs, with supercoiling relaxed, migrate towards the anode (as DNA is negatively charged) forming the tail of the comet, whereas the DNA without SBs does not move. The proportion of total DNA in the comet tail is a quantitative indicator of the frequency of DNA breaks in the cell. Following electrophoresis, neutralization (i.e., removal of the alkaline solution from the gels) and washing of the slides take place.
Stage 4: comet visualization and analysis
The final stage in the comet assay is the staining of the DNA, visualization of the comets and quantification (tutorial video: https://youtu.be/5wIUI4OFwlc). It is possible to store dried and unstained slides indefinitely, while stained slides can be stored in dark conditions for a limited time depending on the dyes used. Comets are visualized by fluorescence microscopy, and analyzed using free, or commercially available, semi-automated or fully automated scoring software, or by visual scoring.
Technical modifications
Various modifications have been made to the standard comet assay, to allow the measurement of DNA modifications other than SBs and ALS or to examine damage in specific genomic regions. In addition, the throughput of the assay has been increased using different approaches. These changes, which improve the versatility and performance of the assay, are discussed in the following subsections.
Enzyme-modified comet assay: measurement of specific DNA lesions
DNA SBs can be regarded as a generic form of DNA damage. They are caused by a variety of chemicals, as well as ionizing radiation, and even arise as transient intermediates during DNA repair. SBs (at least single strand breaks, SSBs) are quickly rejoined, and so they are unlikely to lead to mutations, and generally do not represent a great threat to genome stability44,45. However, as they are unlikely to occur in isolation, they can be indicative of a greater cellular burden of damage, and hence are important to measure. With regard to genotoxicity and carcinogenesis, modification of DNA nucleobases, such as oxidation or alkylation, is considered to have a greater implication than SSBs. Nucleobase lesions are repaired more slowly than SSBs, and can lead to mutations if they are present in the DNA during replication. For example, 8-oxo-7,8-dihydroxyguanine, a product of oxidative stress, can pair with adenine rather than cytosine, causing mutations46. It is therefore advantageous to modify the assay to detect these nucleobase alterations, and this is achieved by using enzymes with the ability to convert the lesions into breaks. The bacterial DNA repair enzyme EndoIII, which recognizes oxidized pyrimidines, was the first to be applied47, followed by bacterial Fpg and human hOGG1 for oxidized purines48–50; these are probably the most widely used, although others have been employed (reviewed by Muruzabal et al.34).
Incubation of the nucleoids with the repair enzyme takes place following lysis and washing of the slides in an enzyme-specific reaction buffer. Depending on the enzyme, the DNA is incised at sites of the lesions, or the modified nucleobase is removed leaving an AP site. Under alkaline conditions, AP sites are converted to SSBs. In parallel with the enzyme incubation, a duplicate set of gels is incubated with the enzyme reaction buffer alone. Before its experimental use, it is important first to titrate the enzyme using cells containing the lesions of interest, to determine the optimum combination of enzyme concentration and incubation time51. ‘Net enzyme-sensitive sites’ are calculated as the difference in comet DNA migration (tail intensity, TI) between the enzyme-incubated and reaction-buffer-incubated samples.
The bacterial enzymes 3-methyladenine DNA glycosylase (AlkD) and 3-methyladenine DNA glycosylase II (AlkA) have been used in the comet assay to detect alkylated nucleobases52,53. However, the use of these enzymes is limited since they are not commercially available. More recently, the comet assay has been combined with human alkyladenine DNA glycosylase (hAAG), a commercially available enzyme, for the detection of alkylated nucleobases54. hAAG detects 3-methyladenine, 7-methylguanine, 1-methylguanine and the ring-opened purines derived from N7-methylguanines55,56. The hAAG-modified comet assay may also detect ethenoadenines and hypoxanthine54. The Fpg-modified comet assay, normally used for the detection of oxidized nucleobases, also detects alkylated lesions (by virtue of the ring-opened purines derived from 7-methylguanine)49,54,57–59. However, oxidatively damaged nucleobases are considered to be the predominant lesions detected in cells that have not been treated deliberately with alkylating agents.
Detection of DNA interstrand crosslinks
Certain types of DNA-damaging agents form covalent links between two nucleobases, either in the same DNA strand (intrastrand crosslinks), or in opposite DNA strands (interstrand crosslinks, ICLs)60. Chemotherapy is the main clinical source of ICL-inducing agents (e.g., cisplatin), but there are also environmental agents that cause ICLs, such as a high-lipid diet61, alcohol, natural psoralens (e.g., derived from the diet62), estrogens63 and ionizing radiation64. Clearly the assessment of ICLs is important, and there exists a variant of the comet assay to evaluate this class of DNA lesions65.
The principle of the ICL-modified comet assay is that the presence of ICLs in DNA will retard the electrophoretic migration of the DNA loops that form the comet tail (Fig. 2). As part of the assay, SBs are induced via exposure to certain genotoxic agents (e.g., H2O2 or ionizing radiation). In the absence of ICLs, these SBs will result in a notable comet tail. However, the greater the number of ICLs present in the sample, the shorter the tail will be, owing to ICL-induced retardation of migration, compared with a sample not treated with the crosslinking agent (Fig. 3). For a detailed protocol, see Supplementary Protocol 1.
Fig. 2 |. A schematic representation of interstrand crosslinks (ICLs) formation by cisplatin and detection with a variant of the alkaline comet assay.
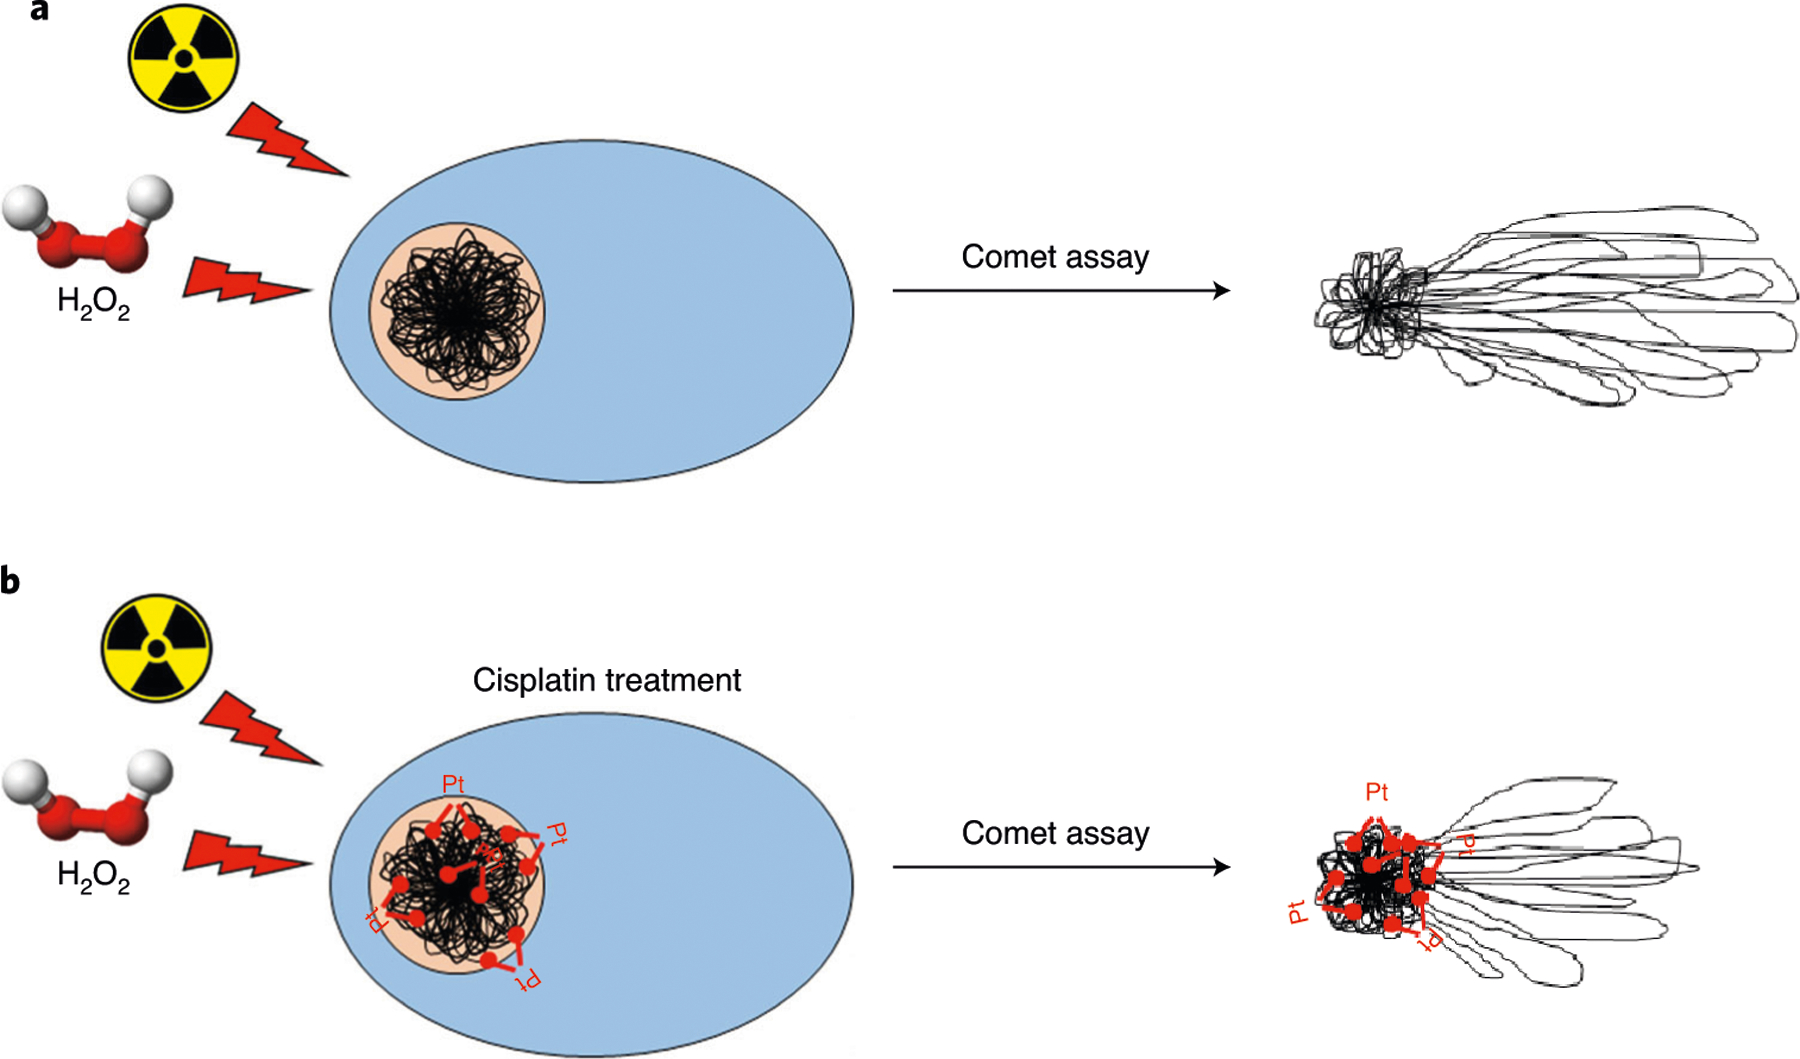
a, In the absence of cisplatin treatment, relaxed DNA loops migrate towards the anode forming the comet tail. b, In the presence of cisplatin, and with exposure to a strand-breaking agent such as ionizing radiation or H2O2, migration of the DNA is inhibited by the ICLs—the more ICLs, the less the migration of the DNA.
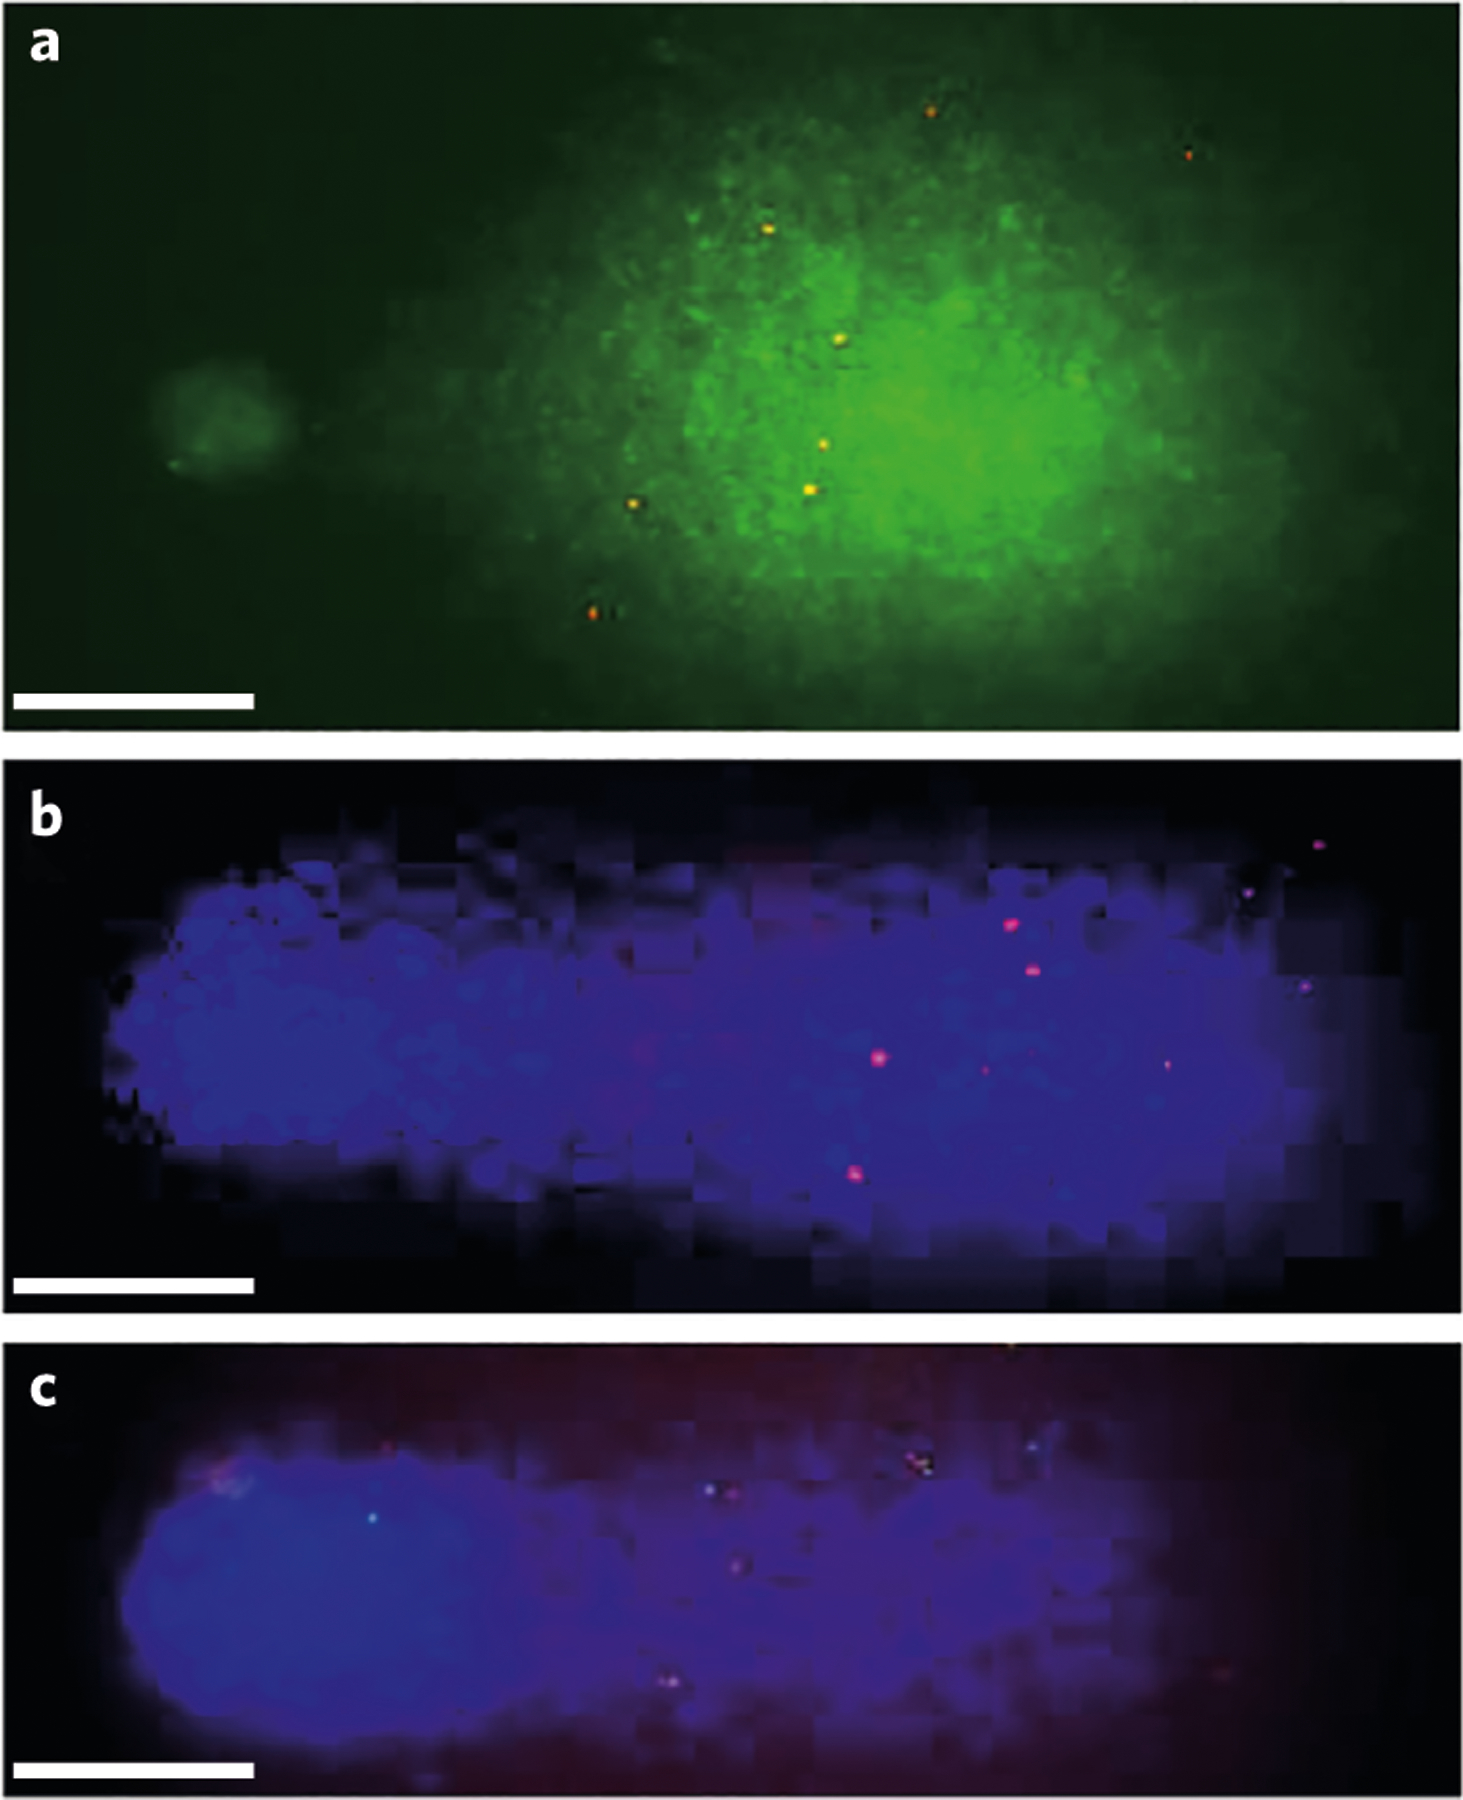
Fig. 3 |. Representative images of three comets illustrating interstrand crosslinks (ICLs) detection following cisplatin treatment.
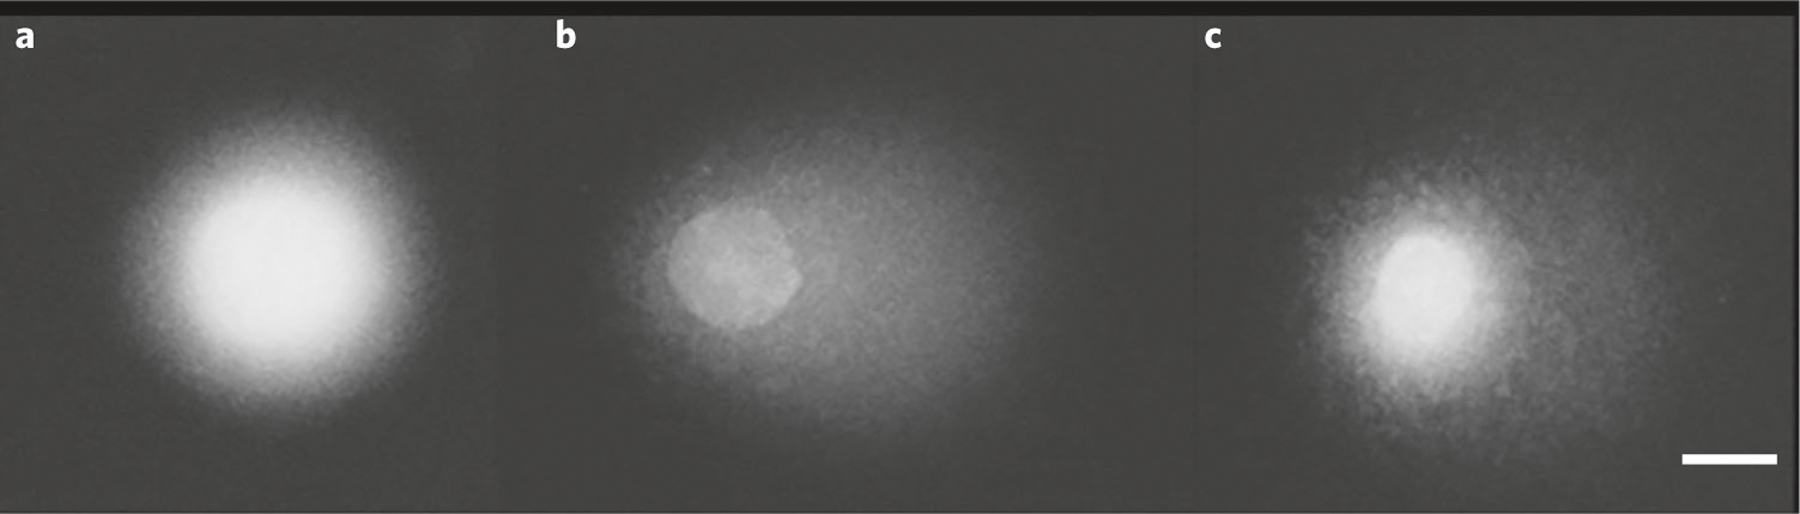
a–c, Cells from an ovarian cancer cell line (SKOV-3) were first treated with 0 µM or 200 µM cisplatin. SBs were then induced using H2O2 (50 µM). The presence of cisplatin-induced crosslinks resulted in a decrease in tail moment (TM) after DNA damage induced by H2O2 (50 µM), compared with the H2O2 treatment control, in the absence of cisplatin. Control cells without any treatment (a); cells treated with H2O2 (50 µM) only (b); cells treated with cisplatin (200 µM) and subsequently H2O2 (50 µM) (c). Scale bar, 10 µm.
Detection of UV-induced cyclobutane pyrimidine dimers and bulky DNA adducts
UV-induced cyclobutane pyrimidine dimers, predominantly thymine–thymine dimers, can be detected using the DNA repair enzyme T4 endonuclease V, as a variant of the enzyme-modified comet assay66. An alternative to this approach is to exploit the transient SSBs that occur when nucleotide excision repair (NER) enzymes act on UV-induced cyclobutane pyrimidine dimers, and other bulky lesions, in mammalian cells. These transient SSBs accumulate to a measurable level if an inhibitor of DNA synthesis is present, blocking resynthesis at the damage site and preventing ligation67,68. Originally, hydroxyurea (which blocks DNA precursor synthesis) and 1-β-d-arabinofuranosyl cytosine (araC, a cytosine structural analog and chain terminator) were used; later, aphidicolin (an inhibitor of B-family DNA polymerases, comprising Pol α, Pol δ, Pol ϵ and Pol ζ, which are involved in NER69–71) was found to be effective. For a detailed protocol, see Supplementary Protocol 2.
Recently, this approach was applied to the detection of benzo(a)pyrene diolepoxide (BPDE)-induced adducts, which are also repaired by NER, using the comet assay72,73. BPDE-treated cells were incubated with aphidicolin, and the accumulated breaks were easily measured with the standard comet assay. Most recently, Ngo et al.74 used hydroxyurea and araC to detect bulky adducts using the CometChip technology and HepaRG cells. Further work needs to be performed to demonstrate the potential of this DNA synthesis inhibitor approach as a component of genotoxicity testing regimes.
High-throughput versions
Most laboratories use standard glass microscope slides as the support substrate for one or two agarose gel samples per slide. In this case, with a standard electrophoresis tank holding ~20 slides, the assay has a low throughput, and sample manipulation can be time-consuming. However, the throughput can be improved by increasing the number of slides in the tank, or by applying mini-gels on glass slides or plastic film, or by precisely locating cells in a microarray format.
12-Gel comet assay.
A higher-throughput approach has been developed by setting 12 mini-gels on a microscope slide29. To incubate each gel independently with various solutions, a gasket with holes over the gel positions can be used (NorGenoTech AS, cat. no. 1201), allowing differential treatment with chemicals, insoluble materials (e.g., nanomaterials), reagents or enzymes (Fig. 4). Twenty slides can be run in a single experiment, resulting in a total of 240 gels. A benefit of the mini-gel approach is that it requires fewer cells and smaller volumes of test solutions compared with the conventional assay. The results obtained with the 12-gel comet assay format compare well with the traditional technology75. The various steps are suitable for further automation, and the formats can be adapted to fully automated scoring. The procedures save time at all stages as fewer slides are handled. A variant of this approach is the use of eight mini-gels on a microscope slide76,77. A step-by-step protocol to use the 12-gel comet assay was published in Vodenkova et al.22.
Fig. 4 |. Component parts of the 12-gel chamber unit.
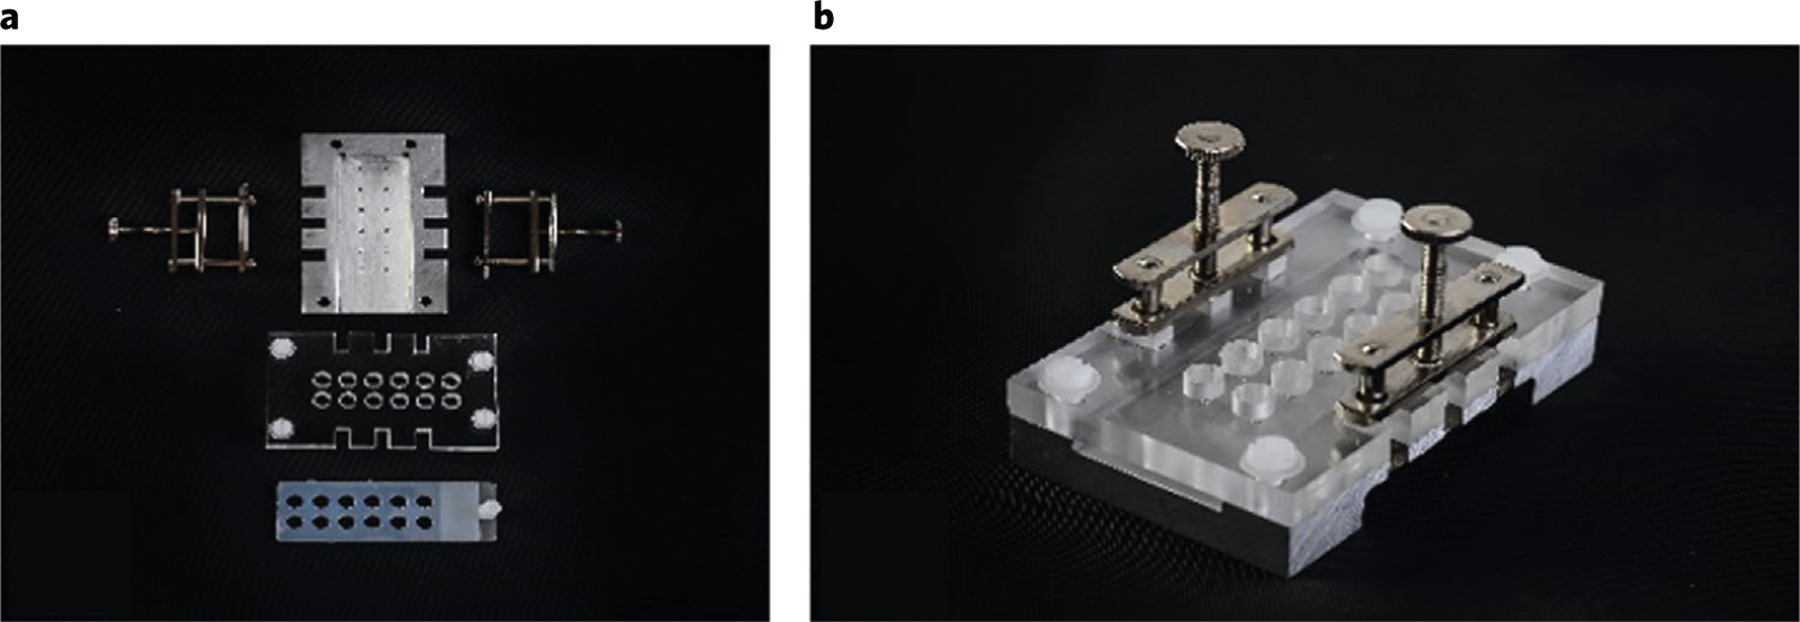
a, Top view, showing metal base with marks for positioning gels on slide, silicone rubber gasket, plastic top-plate with wells, and silicone rubber seal. b, Assembled unit.
96-Well format.
In addition to the 12-gel system, the comet assay technology has also been developed to accommodate up to 96 mini-gels, in a 96-well format, on one GelBond film30,78 (Fig. 5). GelBond film is a thin unbreakable film used generally as a support for agarose gels. It was first applied to the comet assay by McNamee et al.79. The cell-containing agarose samples are applied with a multi-channel pipette. The film, previously cut to the size of a standard microtiter plate, with holes in each corner, is at all stages of the comet assay attached to a plastic frame for ease of manipulation, and to protect the gels (Fig. 5). It is possible to process almost 400 gels in one electrophoresis tank, holding four films. Processing (per sample) takes in total (but excluding scoring) 5–10× less time than with glass slides30. However, the rate-limiting step is often the sample preparation before processing the gels. Apart from being cheaper, the use of GelBond film has two additional advantages over the use of glass slides: increased throughput, as it can be used to process as many gels as required up to 96 gels, with volumes ranging from 4 to 15 µL; and the hydrophilic plastic material reduces the likelihood of the gels detaching. For a detailed protocol, see Supplementary Protocol 3.
Fig. 5 |. Images illustrating the 96-gel format using GelBond film.
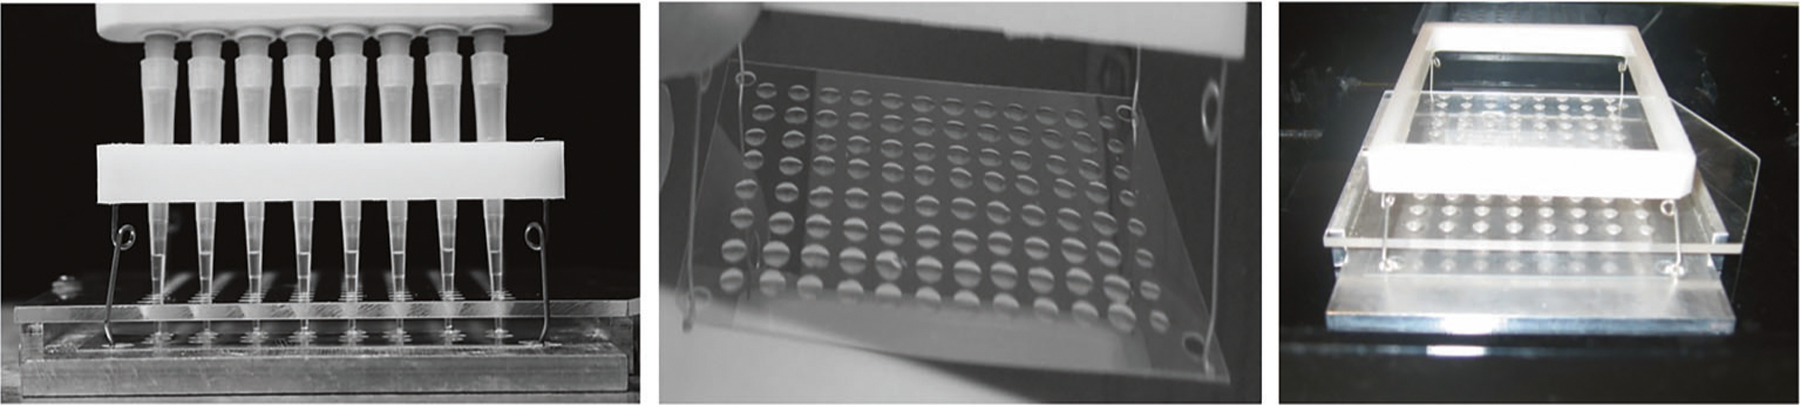
Figure reprinted with permission from ref. 30, Oxford University Press.
Using the 96-well (or the related 48-well) format and an electronic eight-channel pipette to apply samples helps to achieve precise positioning of the samples, facilitating automated scoring. This mini-gel system is amenable to full automation of all steps, including addition of samples, and processing of films. It has been validated using ionizing radiation, and a variety of genotoxic chemicals, together with the enzyme-modified variant of the comet assay30,75,80,81.
CometChip.
This is a high-throughput comet assay method that utilizes microfabrication techniques to pattern cells into an array (for a detailed protocol, see Supplementary Protocol 4)82–84. Cells are trapped for the duration of the assay within agarose microwells that are ~30–50 µm in diameter and spaced ~240 µm apart (Fig. 6). This results in a regularly spaced grid of comets arranged as in a 96-well plate format, allowing for dozens of samples to be analyzed in parallel within a single chip, and reducing sample-to-sample variation that may be introduced by running slides across multiple electrophoresis tanks. In addition, arraying the cells (rather than dispersing them in agarose) decreases the likelihood of overlapping comets, and ensures that all comets are within the same focal plane. This allows for automated imaging, and comet scoring, which substantially reduces assay labor, improves assay throughput by at least an order of magnitude and removes operator bias from the analysis process.
Fig. 6 |. The CometChip platform.
a, Cells in medium or PBS are loaded by gravity into a microwell array in agarose that was created using a mold with pegs approximately the diameter of a single cell82,89. Excess cells are removed by shear force, leaving behind an array of cells. Cells are retained with a layer of LMP agarose (not shown). b, An agarose slab with thousands of microwells is created with the dimensions of a 96-well plate. A bottomless 96-well plate is pressed into the agarose, creating 96 compartments, each with >100 microwells. After cell loading, rinsing, capping and treatment, the agarose slab is processed using standard comet assay protocol conditions. Cells can be either pretreated or treated on-chip. Each of the 96 wells substitutes for a single glass slide used in the traditional comet assay. c, For the EpiCometChip (see ‘Detection of global DNA methylation’), immediately after lysis, the agarose slab is rinsed and incubated with McrBC before processing using standard comet analysis conditions. C, nonmethylated cytosine; 5MeC, 5-methylcytosine. Panels b and c adapted with permission from ref. 42, Wiley.
The CometChip has been used to study DNA damage and DNA repair in a wide range of cell types and chemicals. For example, studies of oxidation and alkylation damage have been performed with H2O2 and methyl methanesulfonate84–87. It is also possible to apply the CometChip to detect DNA damage that requires metabolic activation by using metabolically competent cells, such as HepaRG86. Note that, while so far most experiments have been performed with cultured cells, it is also possible to use the CometChip to analyze cells harvested from minced tissues that have been frozen. Recently, the CometChip protocol has been modified to detect bulky adducts using NER inhibitors in BPDE-treated cells74, and it has also been applied in hepatocyte spheroids88. A list of CometChip applications can be found in a report by Chao and Engelward89.
High-throughput comet assay system.
Karbaschi and Cooke developed and patented a system whereby all the sample workup steps, electrophoresis and post-electrophoresis steps are performed with the comet slides held vertically, rather than horizontally, which is the convention90 (Fig. 7). A detailed protocol is described in Supplementary Protocol 5. Holding slides vertically in racks (up to 25 per rack, 100 gels per electrophoresis run, in a novel tank design) allows batch processing, decreasing the risk of damage to/loss of gels and increasing throughput; the footprint of the tank is decreased substantially (allowing tanks to be ‘multiplexed’ from the same powerpack), and cooling is integrated in the system.
Fig. 7 |. The vertical comet system.
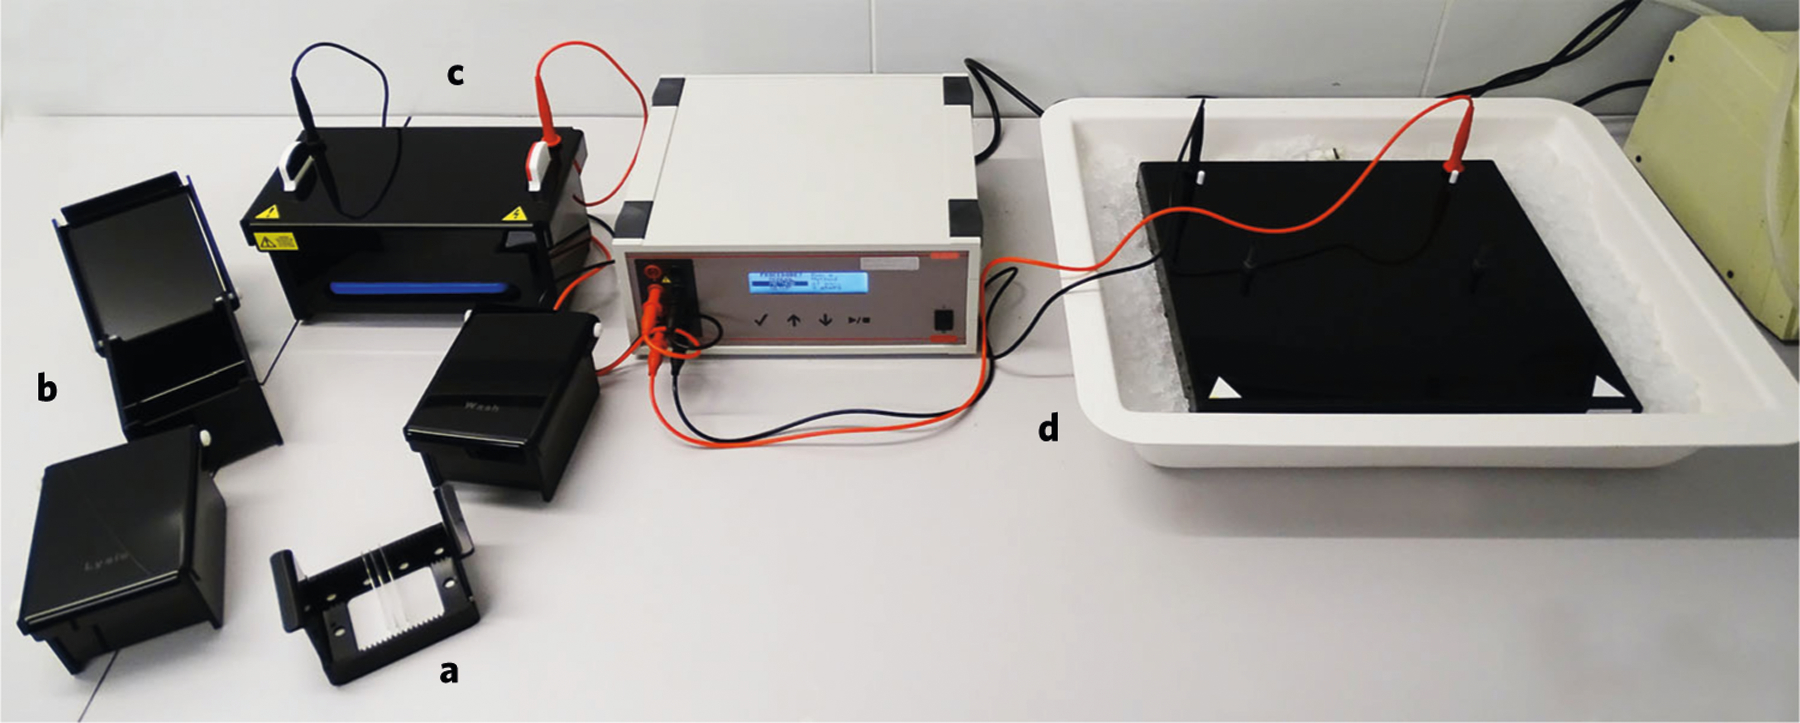
a, Racks hold slides vertically (up to 25 slides per rack). b, Treatment chambers that accommodate the slide-containing racks. c, High-throughput electrophoresis tank (possesses integrated cooling, so no wet ice needed) holding two racks. d, Standard comet assay tank in tray of wet ice; the improvement in size of the high-throughput tank (c) over the standard comet assay tank is clearly seen.
Detection of global DNA methylation
Apart from detecting SBs, and specific types of DNA damage in single cells, the comet assay has been utilized to evaluate the global DNA methylation status at the single-cell level. DNA methylation is tissue specific, and the comet assay, in combination with methylation-sensitive restriction endonucleases, can be used to measure changes in DNA methylation patterns of a variety of cells under different physiological conditions.
Originally, the difference in the methylation sensitivity of the restriction endonucleases HpaII and MspI was exploited in a modification of the comet assay to measure global DNA methylation levels in individual cells (Supplementary Protocol 6)91,92. These two isoschizomeric restriction enzymes recognize the same tetranucleotide sequence (5′-CCGG-3′), but display different sensitivities to DNA methylation, and have been employed in other techniques, such as the cytosine extension assay and the luminometric assay93,94. HpaII digests nonmethylated 5′-CCGG-3′ sequences and is inactive when the second cytosine in the recognition sequence is methylated (5′-CmCGG-3′). In contrast, MspI cuts nonmethylated 5′-CCGG-3′ and 5′-CmCGG-3′ sequences, but not 5′-mCCGG-3′. The global 5′-CCGG-3′methylation can be assessed by calculating the HpaII/MspI ratio (Fig. 8).
Fig. 8 |. Principle of the DNA methylation-sensitive comet assay.
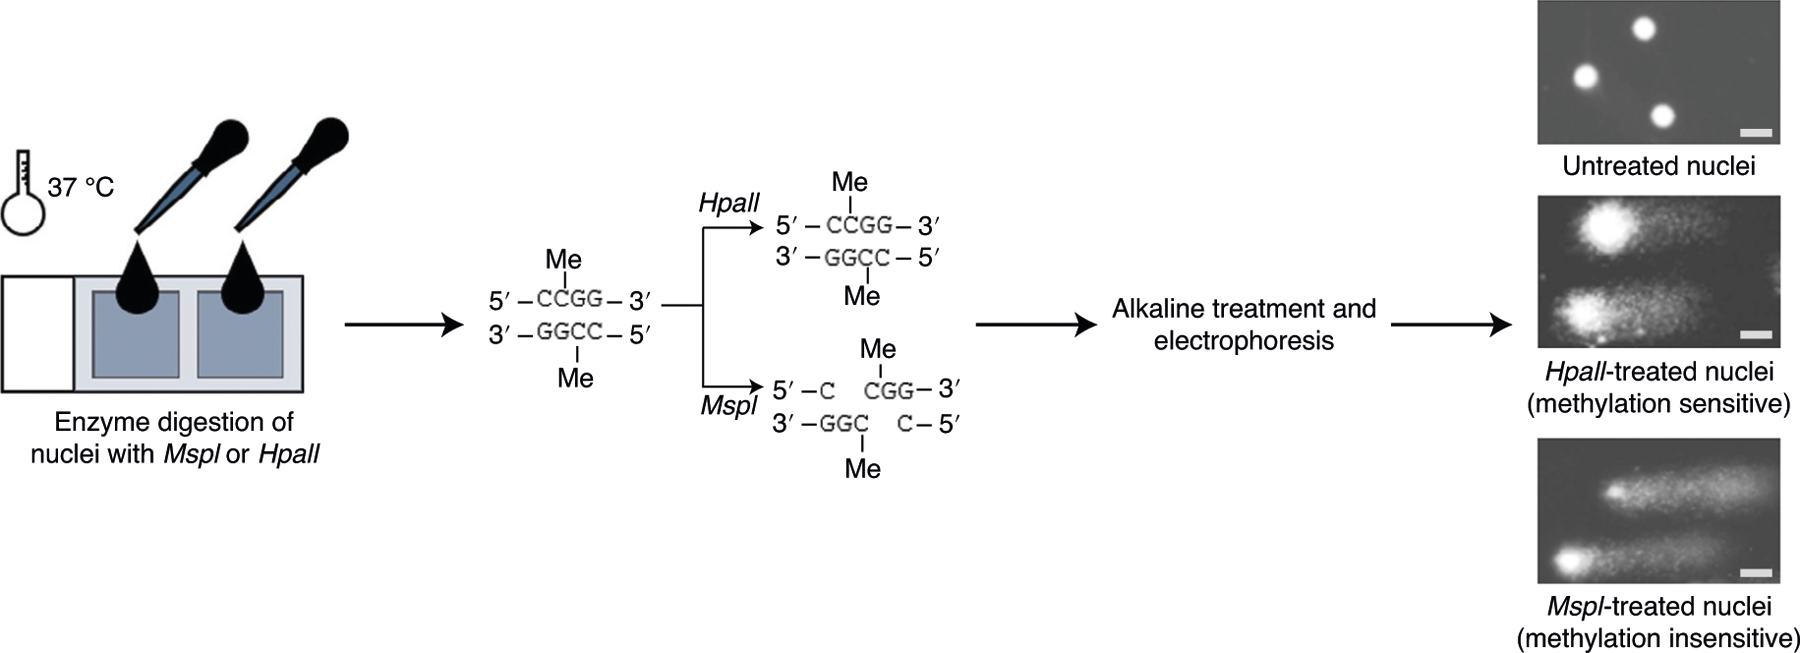
This assay uses two isoschizomeric restriction enzymes that recognize the same tetranucleotide sequence (5′-CCGG -3′), but display different sensitivities to DNA methylation; HpaII is inhibited by the presence of a methyl group on the second cytosine in the recognition sequence (it is able to recognize unmethylated sequences), while MspI is able to cut both methylated and unmethylated sequences. The global methylation can be assessed by calculating the HpaII/MspI ratio. Scale bars, 10 μm.
The newly developed modified comet assay, EpiComet-Chip (Fig. 6c) allows single-platform evaluation of genotoxicity (DNA damage) and global DNA methylation (specifically, 5‐methylcytosine (5‐mCyt)) status, of populations of single cells under user‐defined conditions42. McrBC specifically recognizes DNA sites of the form 5’‐ (G/A)mC‐3’ and cuts DNA at methylated Cyt, thus forming comets. McrBC, unlike other restriction enzymes, cleaves DNA containing 5‐methylcytosine, 5‐hydroxymethylcytosine or N4‐methylcytosine on one or both strands95,96. McrBC recognizes two half sites on DNA of the form (G/A)mC; these two halves of the recognition site can be separated by up to 3 kb, but the optimal separation is 55–103 bp (recognition site is 5’…PumC (N-40–3000) PumC… 3’). As McrBC has a very short consensus sequence (PumC), it potentially can recognize and cut a large proportion of the methylcytosines present in DNA. The EpiComet-Chip assay involves some modifications of the procedure steps, as described in Supplementary Protocol 7. It is worth mentioning that these methods have been applied by a few laboratories so far. Methylation is tissue- and cell-type-specific and the assay should be optimized for the cell/tissue of interest.
Detection of chromosomal breaks in yeast
The chromosome comet assay evaluates chromosomal DNA breaks and the occurrence of replication intermediates during clonal yeast culture, which may be a sign of replication stress as a consequence of DNA re-replication and/or R-loop formation97. Briefly, the yeast chromosomes are obtained using standard pulsed-field gel electrophoresis. The chromosomes are then cut from the gel, coated with LMP agarose between two layers of normal-melting-point (NMP) agarose, and then subjected to standard alkaline DNA electrophoresis (for detailed protocol, see Supplementary Protocol 8)98. The single chromosome comet assay is a useful approach for studying replication aberrations and replication stress as an alternative to traditional 2D gel analysis99. This method has been applied by a few laboratories so far.
BrdU comet assay: measurement of cell-cycle-specific comet formation
Incorporation of the thymidine analog 5′-bromo-2′-deoxyuridine (BrdU) is a popular method for determining cell proliferation rates in a wide variety of organisms, ranging from plants to mammalian cells100,101. The BrdU comet assay represents a combination of the immuno-fluorescent staining of incorporated BrdU, and the alkaline comet assay (for a detailed protocol, see Supplementary Protocol 9)102–104. This modification of the comet assay can be used for the measurement of DNA damage in cell populations that are unsynchronized, i.e., in different phases of the cell cycle. The advantage of this assay is that it allows discrimination between cells with induced DNA damage, and cells in the S phase of the cell cycle (undergoing DNA synthesis/replication), which contain a physiological level of DNA discontinuities or gaps (detected as DNA breaks in the comet assay), as a result of ongoing semiconservative replication. Since cells progressing through S phase form comet tails in the alkaline comet assay, this approach helps to distinguish replicating cells among the total population of cells forming comet tails (Fig. 9). Pulse labeling of cells with BrdU can also be used to test post-replication recovery after DNA damage where cells with compromised post-replication repair machinery show marked increase in the amount of BrdU-labeled DNA in comet tail. This method has been applied by a few laboratories so far.
Fig. 9 |. Visualization of all comets and BrdU-positive comets only by fluorescence microscopy, using two filters.
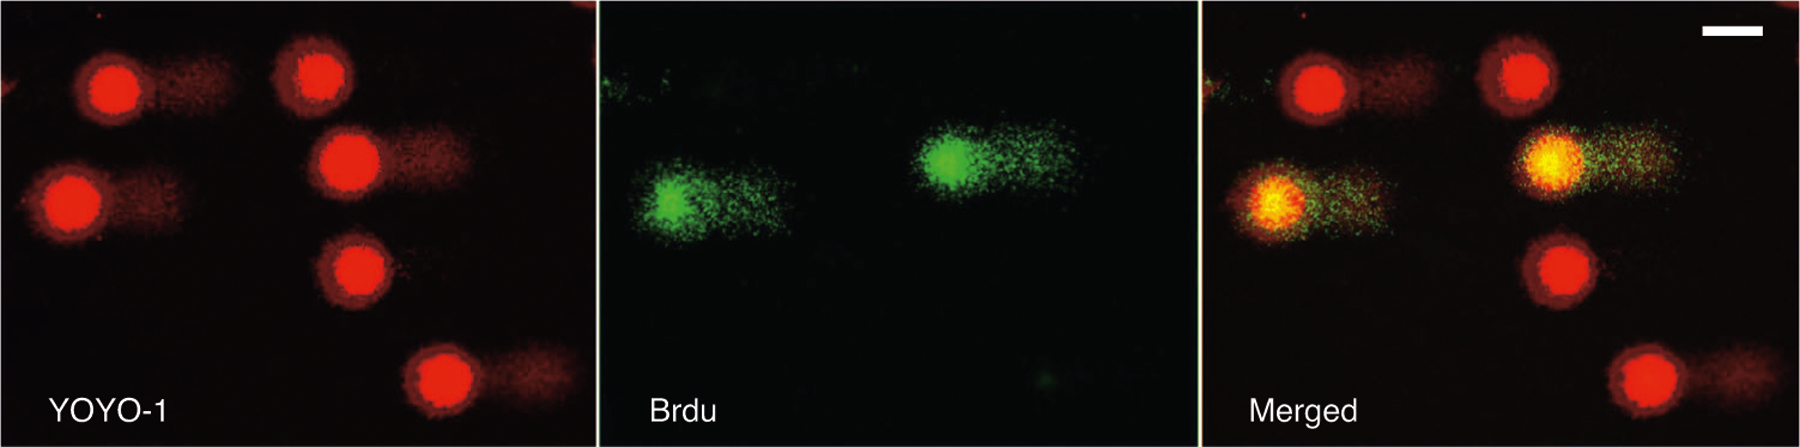
With the FITC filter (left), comets stained with YOYO-1 for detection of DNA breaks are visualized. With the TRITC filter (middle), BrdU-positive comets formed by cells in the S phase of the cell cycle are visualized. The image on the right shows both BrdU-positive and BrdU-negative comets. Scale bar, 40 μm.
Comet–FISH assay: measurement of damage in specific DNA sequences
While the comet assay enables the researcher to study DNA damage at the level of single cells, combination of this with FISH, using labeled probes targeting particular DNA sequences, allows the study of DNA damage at a gene level (reviewed in Shaposhnikov et al.38). In Supplementary Protocol 10, a step-by-step protocol is described. Depending on which target sequences are to be detected, different DNA probes have been applied in comet–FISH techniques (Fig. 10), including various repetitive elements; chromosome arm- or band-specific probes; whole-chromosome probes; DNA fragments cloned in artificial chromosomes; ‘padlock probes’, which are able to ‘lock’ around the target DNA sequence to allow circularized amplification; and peptide nucleic acid probes, in which the nucleobases are attached via methylene carbonyl bonds to repeating units of N-(2-aminoethyl) glycine. The application of this technique has provided information about rates of DNA repair of different genes, in relation to nuclear structure40,105,106.
Fig. 10 |. Example pictures of different types of signals seen in comet–FISH experiments after alkaline electrophoresis using U-2 OS cells.
a, Probe RPCI-1 213H19 labeled with two colors (digoxigenin as green dots and biotin as red dots), in comets from cells irradiated with UVC at 0.2 Jm−2. b, Probe RPCI1 213H19 labeled with biotin (red dots), in comets from cells treated with 0.1 mM H2O2. c, Probes RPCI-1 213H19 and RPCI-6 32H24 labeled with digoxigenin (green) and biotin (red), respectively, in comets from cells irradiated with UVC at 0.2 Jm−2. Scale bars, 20 μm. Figure adapted with permission from ref. 339, Wiley.
Applications of the method to different species, tissues and cell types
The comet assay can be applied to virtually any cell type derived from different organs and tissues of eukaryotic organisms (Fig. 11). Although it is mainly applied to human cells, the assay also has applications for the evaluation of DNA damage in cells in culture, yeast, plant and animal cells3–5,107–111. The assay can be performed on samples from across all invertebrate and vertebrate species111. Besides a large number of animal species, the comet assay has also been performed on a variety of cell types and tissues, including white blood cells, bone marrow, liver, kidney, brain, bladder, lung, stomach, gill, hemolymph, digestive gland, embryo cells, ovary and testis but also germ cells (oocytes and sperm) and even embryos3–5,110. Regarding plants, the comet assay can be performed on cells from leaves and roots109,112,113, and its use in higher terrestrial plants is increasing.
Fig. 11 |. Overview of various species and different sample types that have been used in the comet assay.
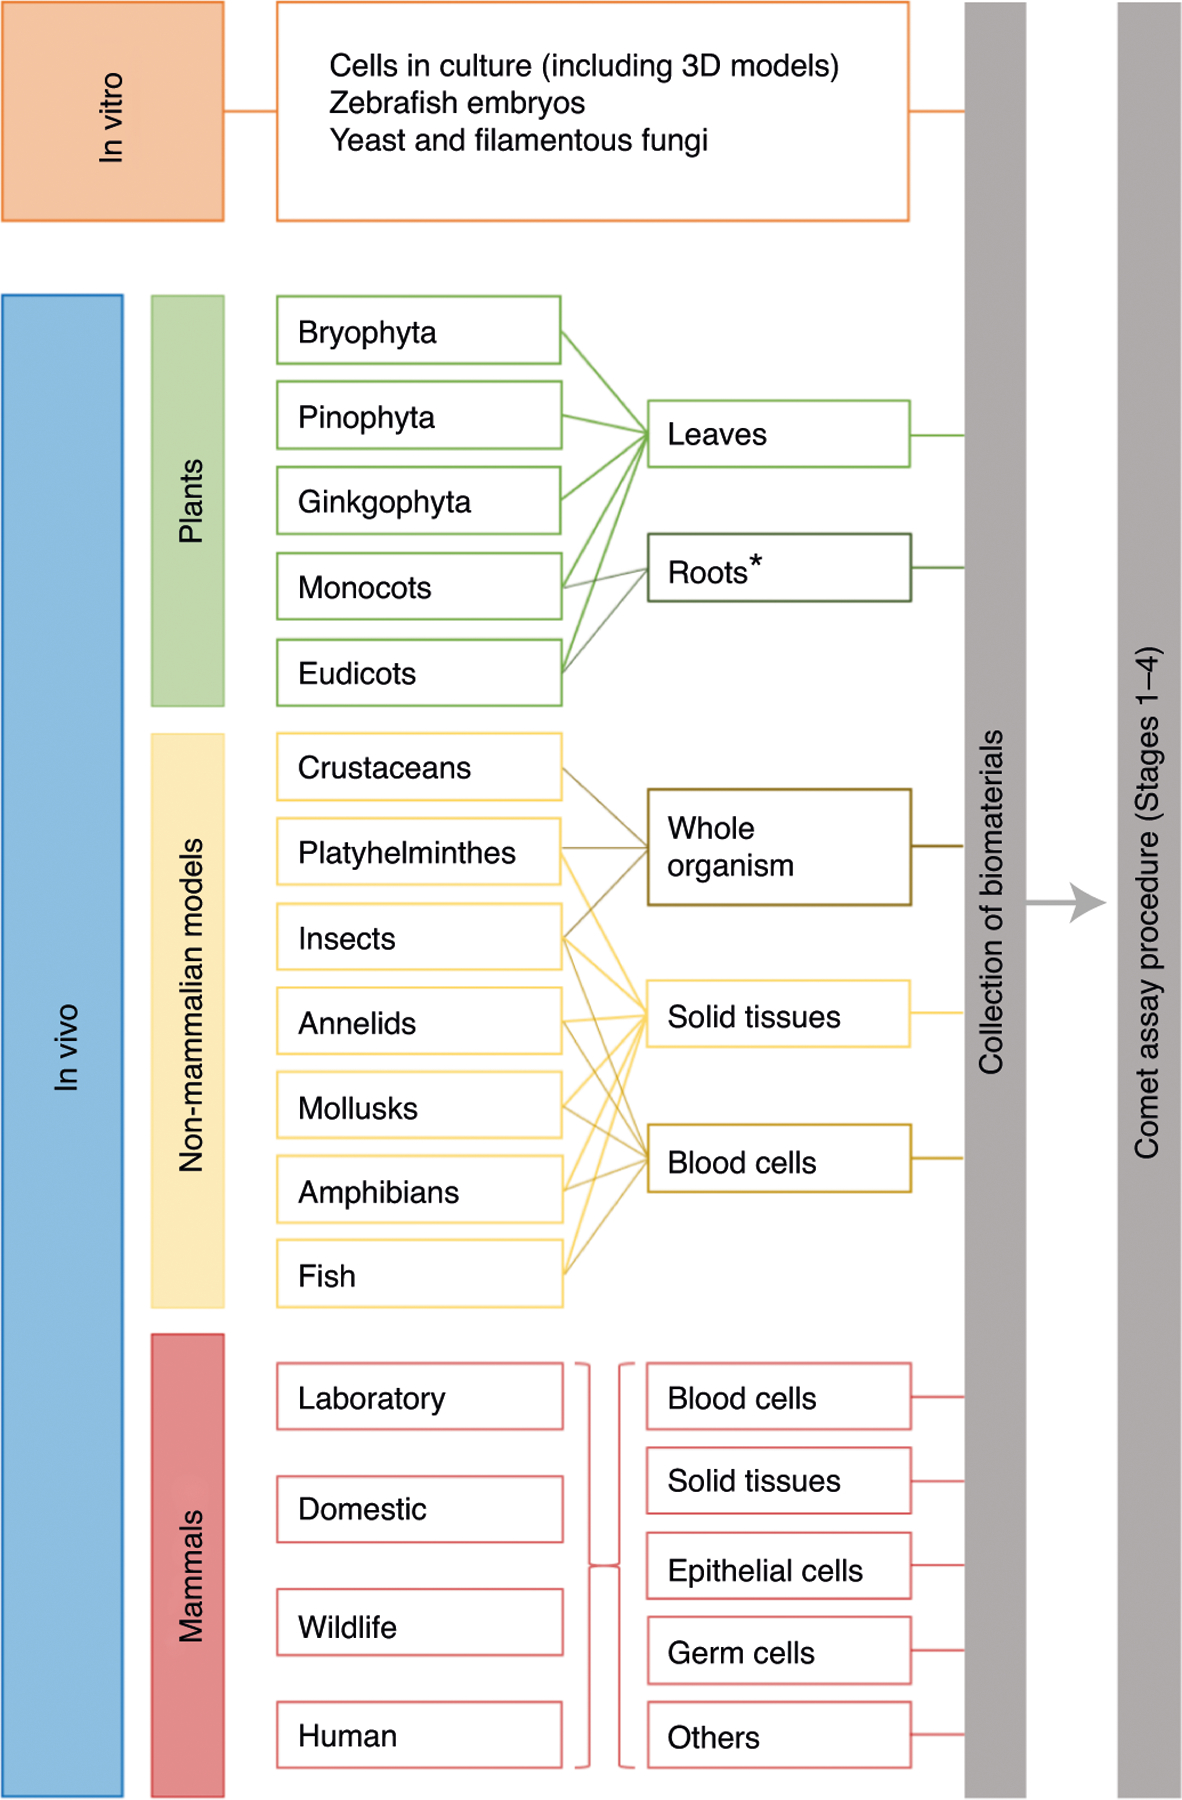
Preparation of cells from different sample types is described in Stage 1 of the Procedure. *So far, only roots from monocots and eudicots have been used for the comet assay, but there is no reason why roots from other plants could not be used as well.
The following sections illustrate the various applications of the in vitro and in vivo comet assay with different materials. Performing an exhaustive review of the literature is beyond the scope of this paper, and so we provide only key publications, and recent modifications for each of the models and biomatrices.
In vitro models
Cell lines.
The comet assay has been performed with numerous different cell types, either primary or immortalized cells, of human or animal origin, and from different organs and tissues114. Owing to their availability, immortalized cells, in particular, hepatic cells, have been the most frequently used for genotoxicity testing with the comet assay115–119. Among other tissue-derived cells, neural cells seem to be a reliable alternative to ex vivo primary cell culture, since access to brain tissue is challenging120. The liver, skin, lungs and intestines are among the main sites for exposure to environmental agents, and therefore established cell lines from such origins have been used in the comet assay121–124. These are just a few examples since the comet assay has been performed in monocultures of many different cell lines. Another interesting application of the comet assay is in co-culture experiments with combinations of different cell types, which provide physiologically more relevant culture conditions than monocultures. Examples include co-culture of Caco-2 and HT29 cells, as a model of the intestinal barrier125,126; co-culture of lung epithelial A549 and THP1 cells127–129 and a co-culture model of hepatocarcinoma HepG2 cells and endothelial cells (HUVEC)130. Fish cells have been used successfully for the detection of genotoxic effects, and can serve as an alternative to in vivo experiments in preliminary (eco-)genotoxicity studies131–133. The comet assay has also been used with stem cells from different species, including human mesenchymal stem cells134, human adipose tissue-derived mesenchymal stem cells135 and murine bone marrow mesenchymal stem cells136.
3D models.
Cellular organization and function are simulated more accurately in advanced 3D mini-tissue and mini-organ models, compared with traditional two-dimensional cultures with cells growing in monolayer. Utilizing cells of human origin in advanced in vitro models may also better reflect human biology compared with in vivo rodent models137–139. Three-dimensional skin models have now reached an advanced state of validation following over 10 years of development, while liver- and lung-based models show promise but are under development140. The 3D skin comet assay is now undergoing independent peer review by the European Union Reference Laboratory for alternatives to animal testing (EURL-ECVAM), followed by the development of an OECD Test Guideline141–145. The use of liver spheroids with the comet assay is a novel approach146,147, which has so far been used to assess the genotoxicity of nanoparticles and chemicals148,149. A protocol for applying the comet assay to 3D lung models was established using two commercially available human reconstructed 3D lung models, and one model developed in-house140,150.
Zebrafish embryos.
The zebrafish embryo, a widely used vertebrate model in (eco)toxicology, is regarded as an in vitro system until 120 hours post-fertilization (hpf). This allows stressful or invasive procedures to be performed on embryos, as they are not subjected to ethical regulation; only after 120 hpf must research on zebrafish be compliant with the European Union Directive 2010/63/EU151,152. The embryos have many advantages; being sensitive to toxic stressors, inexpensive, optically transparent, with rapid ex utero embryonic development. Thus, the zebrafish embryo has been considered as a powerful alternative model for traditional in vivo (geno)toxicity screening, with advantages of whole-animal investigations (e.g., intercellular signaling, intact organism and functional homeostatic feedback mechanisms) and convenience of cell culture (e.g., small quantities of test item, cost and time efficient, and minimal infrastructure). In 2006, the first comet assay study with zebrafish embryos was conducted in which authors systematically evaluated different protocols for generating a suspension of single cells from treated embryos in terms of cell viability, cell yield and genotoxic damage153. Despite the benefits of research on embryos, they are still not frequently used with the comet assay. Most studies have been conducted with adult fish and during the embryo–larval stage. Only a small number of studies have been performed on embryos (Canedo and Rocha132; more information is in ‘The use of non-mammalian samples’ section).
Yeast and filamentous fungi.
The yeast comet assay has been in use for >20 years. The ease of cultivation and preparation of yeast cells for the comet assay makes their use promising for the assessment of genotoxicity of environmental pollutants and natural products, and for elucidating mechanisms of action. A particular advantage is that mutants with different signaling pathways, and DNA repair activities, are available. Different yeast and filamentous fungi strains and species have been used for the assessment of spontaneous or agent-induced DNA damage107,108. In addition, they have been used to study the mechanisms of DNA damage and DNA repair at the level of individual cells154. As described in the ‘Technical modifications’ section, a modified comet assay protocol has been developed to examine damage in single yeast chromosomes97.
Plants
Application of the comet assay to plants has been focused on a few model species, such as Allium cepa, Nicotiana tabacum, Vicia faba or Arabidopsis thaliana, but its use in higher terrestrial plants is increasing (reviewed in Ghosh et al.112; Lanier et al.113; Santos et al.109). The neutral comet assay was used for the first time with plant tissues in 1993 (ref. 155); the alkaline version was modified and applied to broad bean (Vicia faba) a few years later156. Application of the comet assay to plants has mostly consisted of testing for genotoxicity of metals, pesticides and other organic pollutants, phytocompounds, nanomaterials, contaminated matrices (water, soils, sediments and air) and radiation; investigating the genotoxic mechanism of chemicals; and studying plant DNA repair157. The assay has also been used as a biomonitoring tool to assess environmental pollution, and to evaluate the potential of some plants for the phytoremediation of contaminated soils, sediments or waters (reviewed in Gichner et al.158; Lanier et al.113; Santos et al.109).
Non-mammalian samples
This and the following section (‘Non-human mammalian samples’) are brief summaries of the most commonly used models for the in vivo comet assay. Recently published reviews by Gajski et al.4,5 provide a comprehensive overview of all animal models that have been used for the comet assay.
Crustaceans (Daphnia magna, Ceriodaphnia dubia).
The comet assay has been applied to several freshwater and marine species. Crustaceans are suitable models for both genetic toxicology and environmental biomonitoring on a large scale4. Several freshwater zooplanktonic species are used to perform DNA damage assessments with the comet assay159–161. In these species, DNA damage is measured in cells from the hemolymph, or in cell preparations from whole animals exposed to various physical and chemical agents4,162,163.
Insects.
Insects could partially replace vertebrates in toxicological studies, avoiding certain ethical issues. Drosophila melanogaster is a valuable model organism for genetic studies, and also for studying the DNA damage response; the comet assay is performed mainly in vivo using different larval cell types (hemolymph, brain and midgut)164–166. In 2002, the first paper in which the comet assay was applied to brain ganglia cells of Drosophila was published167. Since then, other larval cell types have been used, such as midgut cells, alone or in combination with brain cells168–170. The comet assay has been applied to Drosophila neuroblasts in genotoxicity assessment studies164,168,169,171. It has also been used to study the antigenotoxic effect of macroalgae166, and to analyze the influence of protein overexpression on genome integrity in vivo172,173. Hemocytes of Drosophila, the equivalent of mammalian lymphocytes, represent a general cell model in which to evaluate the genotoxic risk associated with specific exposures. The application of the comet assay to hemocytes as a cell target for DNA damage detection started in 2011 (ref. 174). Augustyniak et al.175 published a review on the use of the comet assay in insects.
Mollusks.
Marine and freshwater bivalve mollusks have been used for many years as sentinel organisms for monitoring environmental pollution, in particular in coastal areas. Their filter-feeding activity and low metabolic rate favor bioaccumulation of contaminants176. A variety of mollusk species have been used with the comet assay, including bivalves, gastropods and cephalopods, although the majority of studies have been performed on mussels and clams (bivalves), starting in the late 1990s. Several modifications have been introduced to the initial approach177,178. The comet assay using bivalve mollusks was initially developed for hemolymph cells from the oyster Crasostrea virginica179, and from the marine mussel Mytilus edulis180, in gill cells from M. edulis181, and with digestive gland cells from the same species182. Since then, this assay has been routinely applied for a variety of purposes under laboratory and field conditions; the most commonly used species are described in review articles3,4,183.
Planarians.
Planarians are free-living flatworms (Platyhelminthes) with a long history of use in regeneration and stem cell biology as a unique in vivo model to study stem cell dynamics in various contexts184. An important application is the determination of DNA damage during developmental and regenerative processes, or following experimental treatment. Planarians are increasingly used for risk assessment and toxicity screenings as well as to investigate environmentally-induced genotoxicity or drug-related carcinogenicity185,186. The comet assay can be applied on whole organisms or on an isolated stem cell cell-enriched fraction (obtained via a dissociation protocol). The first use of the comet assay with planarians, in Dugesia schubarti, was to identify the genotoxic potential of copper sulfate185. Since then, planarians have been used to address various research questions in toxicology screening, as well as for mechanistic stem cell research in relation to the DNA damage response. Moreover, it has been used for dissecting molecular mechanisms in relation to stem cell processes, and regeneration187–189.
Annelids.
Since a study concerning noninvasive extrusion of coelomocytes from earthworms (Eisenia foetida) published by Eyambe et al.190, there have been only a few modifications to the protocol for collecting cells from these worms. Verschaeve and Gilles191 pioneered the use of the comet assay on coelomocytes from earthworms for the detection of genotoxic compounds in environmentally contaminated samples. Since then, numerous scientific studies have been published using the same method to monitor environmental contamination to reveal the genotoxic effects of xenobiotics, or to allocate ecotoxicological endpoints192–198.
Amphibians.
There are a large number of studies on amphibians for the evaluation of environmental pollution using the comet assay, either following environmental exposures, or under laboratory conditions5, the first study dating back to 1996 (ref. 199). The most frequently used amphibians are frogs and toads, with the comet assay having been conducted on both tadpoles and fully developed, adult specimens3,4,199,200. In both larval and adult stages, different cell types, such as blood (erythrocytes), liver and sperm, have been sampled. Most studies have been performed with environmental stressors, such as agrochemicals and heavy metals, to which amphibians are very sensitive (reviewed in Gajski et al.5).
Fish.
Fish (both marine and freshwater) are among the most widely used organisms in ecotoxicology3, and among the first animal models to which the comet assay was applied as a biomonitoring tool201. Studies are performed with several specimens, though most frequently on blood, followed by liver, gills, gonads and sperm5. The comet assay has also been used for the evaluation of the genoprotective properties of functional feeds with a combined nutritional–genetic approach202.
Non-human mammalian samples
In vivo comet assay experiments with mammalian samples normally utilize laboratory animals such as mice and rats, which are generally regarded as the standard experimental animal models for genetic toxicology studies. Multiple organs from mice and rats such as blood, liver, kidney, brain, lungs and bone marrow have been used for the genotoxicity testing of a large range of chemicals. Studies with laboratory rodents have been extensively reviewed8,203–208.
Rodents.
The alkaline comet assay was first used in rats in 1993 for the quantification of DNA SBs to assess the genotoxic effects of lindane in mucosal cells from the nasal cavity, stomach and colon209. An OECD guideline (TG 489) for the in vivo comet assay to detect DNA SBs was published in 2014, and updated in 2016. However, procedures for the detection of other DNA modifications in rodents, for example, oxidatively damaged DNA, were already published in the early 2000s210,211. Despite the extensive use of the comet assay to test for genotoxicity in solid tissues from rodents, there are no standardized procedures to collect, store and homogenize samples. The OECD guideline does not address the use of frozen tissue/cell suspensions (for more details, see ‘Technical modifications’). In general, rodent tissues can be used for genotoxicity testing of chemicals present in consumer products, diets, and environmental and occupational settings. Interestingly, the comet assay has been used in studies of complex mixtures such as ‘air pollution’123, as well as nanoparticles212 and physical agents such as radiation213.
Domestic and wild mammals.
Animals kept as pets (e.g., cats and dogs) may be considered as sentinels for environmental factors to which humans are exposed. Therefore, they can be used as a surrogate for human exposure. Although this is an interesting application, there are few reports and the majority used several breeds of both cats and dogs for the evaluation of different chemical and/or physical agents on the extent of DNA damage in blood and bone marrow cells as well as spermatozoa5. Apart from pets, the comet assay has been applied to several other domestic species, such as horses, donkeys, bulls, goats, sheep and boars, generally performed on sperm to test the semen quality after cryopreservation, and before artificial insemination, and this represents a broad field of research (reviewed by Gajski et al.5). A variety of wild species have been used to study pollution, and environmental conservation in both marine (e.g., dolphins) and terrestrial environments (mainly rodents and various large wildlife mammals). In addition, the comet assay was used for the evaluation of sperm DNA integrity of several metatherian species and rhinos3,5.
Human samples
The comet assay has been extensively used in human biomonitoring studies, mainly applied to white blood cells, for the purpose of assessing the effect of environmental and occupational exposures20. The effects of nutritional and therapeutic interventions on DNA damage have also been studied214–219. In addition, DNA damage has been assessed in connection with aging and high-prevalence diseases219,220. The technique has also been applied to umbilical cord blood cells221–223 and placenta224–226. The use of these samples is a suitable approach to assess exposure and genotoxicity during early life.
White blood cells.
Blood is one of the most suitable and widely used specimens in biomonitoring. Blood cells circulate in the body, and the cellular, nuclear and metabolic state of the blood cells may reflect the overall extent of body exposure227. Advantages and limitations of using whole blood, leukocytes, buffy coat (whole blood enriched with leukocytes) and isolated peripheral blood mononuclear cells (PBMCs) have recently been described228. The comet assay has been used for three decades in human biomonitoring studies; PBMCs are the most common sample material, though whole blood has also been widely used. Topics investigated include occupational or environmental exposure to air pollution and other genotoxic agents, dietary and lifestyle habits, the effects of oxidative stress related to exercise and nutrition, and so-called seasonal effects20,27,33,216,229–237. The comet assay has also been applied to assess DNA damage as a factor in diseases238,239 and also as a tool in diagnostic and medical treatment procedures19,240,241. A recent pooled (meta)analysis of a database of comet assay results from almost 20,000 individuals found that there was little effect of age on SBs, and no difference in SBs between males and females. Smoking had no effect, while occupational and environmental exposure to a variety of genotoxic agents had very significant effects242. It is possible to use isolated polymorphonuclear (PMN) cells in the comet assay243. PMN cells such as neutrophils244–247 and granulocytes248,249 have been used to assess DNA damage in relation to certain diseases and occupational exposures.
Cryopreservation of blood samples has been used in biomonitoring studies for many years (reviewed by Møller et al.228 and Marino et al.250); biobanks may contain samples of PBMCs, but more often whole blood or buffy coat was stored. The finding that the comet assay can be carried out with frozen whole blood251, or frozen leukocytes isolated from blood, makes it possible to carry out nested case–control studies to investigate associations between disease incidence (or mortality) and DNA damage measured decades earlier233,252.
Mononuclear cells (MNCs) can be isolated from cord blood, and used in the comet assay253–255. The comet assay has been applied to these cells to study DNA damage in preterm infants253–255, and the correlation between maternal blood glucose levels of women with diabetes or mild gestational hyperglycemia and the DNA damage levels in the MNCs from the offspring256.
Leukocytes from saliva.
Isolation of leukocytes from saliva (as an alternative to, or to complement, blood samples) represents a potential strategy for noninvasive, human biomonitoring studies using the comet assay257–259. These samples are of particular interest when the main route of exposure is by inhalation or ingestion, or when blood samples are difficult to collect (from children, patients with dementia, subjects with vein problems, etc).
Epithelial cells.
The comet assay has been applied to epithelial cells of the buccal mucosa, nasal epithelium and ocular cells including lens epithelium, cornea and tear duct260,261. Buccal cells have been used since 1996, with at least 50 articles reporting their use260,262,263; they are particularly appropriate for biomonitoring in children. A number of studies have used the comet assay on nasal cells in biomonitoring studies of environmental and occupational exposures264–271 to assess the potential antioxidant effects of several compounds272, and to assess oxidatively damaged DNA273. Concerning ocular cells, lens epithelial cells have been used to study age-related cataract274, and tear duct and corneal cells have been used to test the effect of environmental pollutants, principally ozone275.
Sperm.
The comet assay has been used extensively to study sperm in the context of the effects of environmental substances on fertility276,277, with the diagnosis of male infertility278, and in medically assisted human reproduction279,280. The proportion of sperm with highly damaged DNA, assessed by the comet assay, has been shown to have a predictive value for male infertility and to contribute significantly to a decrease in live births in assisted reproduction281,282. The latter authors proposed the use of novel comet assay parameters (high damage Comet Score, and low damage Comet Score), and introduced threshold levels for the proportion of damaged cells. Only a few papers describe the use of enzymes to detect oxidized DNA bases in sperm (for example, Simon et al.283, and Sipinen et al.277), and a high-throughput method has been described for the sperm comet assay284.
Placenta.
Placental cells have been used for the evaluation of prenatal exposure-induced developmental toxicity285. In humans, the placenta is a useful biomatrix that is obtained noninvasively286. There are a few published studies analyzing DNA damage using the comet assay in cells isolated from human placentas, either for cell characterization224 or for genotoxicity testing225.
Comparisons with other methods for assessing DNA damage
The alkaline comet assay, alkaline elution and alkaline unwinding are comparable in terms of ability to detect low levels of DNA breaks, in the sublethal range for mammalian cells, and all three have been employed in biomonitoring, genotoxicity testing and ecotoxicology as well as basic research. The principle of alkaline elution is that, when cells are lysed on a microporous filter and then an alkaline solution is gently pumped through the filter, the single-stranded DNA molecules (denatured by the high pH) elute through the filter at a rate inversely related to their size287. In the alkaline unwinding method288, cells are lysed in alkali for a certain time and then neutralized and sonicated, resulting in a mixture of single- and double-stranded fragments; these are separated by hydroxyapatite chromatography, and the proportion of single-stranded DNA is related to the break frequency. The main advantages of the comet assay are its simplicity, the number of samples that can be processed in a single experiment and the ability to visualize damage at the single-cell level.
These three methods were among the methods examined in the ESCODD project11, which aimed to resolve discrepancies in estimates of the background level of 8-oxoguanine found in human cells. Methods based on detection of the oxidized nucleobase with Fpg—including alkaline elution and alkaline unwinding as well as the comet assay—routinely came up with estimates an order of magnitude, or more, lower than the concentrations determined by analytical methods such as HPLC with electrochemical detection, gas chromatography–mass spectrometry, and HPLC with tandem mass spectrometry. By conducting controlled ring studies, an estimate of background levels of oxidatively damaged DNA in human lymphocytes was 4.2 8-oxoguanines per 106 guanines, obtained with chromatographic methods, compared with 0.3 8-oxoguanine per 106 guanines when employing Fpg11. Evidence289,290 points to adventitious oxidation occurring during the relatively drastic sample workup for chromatographic analyses, compared with the mild procedures employed for the enzyme-based assays. The results of ESCODD led to the development of improved DNA extraction methodology, and lower levels of damage detected by methods such as HPLC with tandem mass spectrometry.
The comet assay for determining DNA methylation status relies on the use of methylation-sensitive and insensitive restriction endonucleases. The first version by Wentzel et al.92 employed the most commonly used isoschizomer pair HpaII and MspI, and produced results that were consistent with those obtained with the well-established cytosine extension assay. This cytosine extension assay involves DNA digestion by HpaII/MspI, followed by single nucleotide extension using either radiolabeled [3H]dCTP93 or biotinylated dCTP291. More recently, the EpiComet-Chip was developed, involving the restriction enzyme McrBC. This EpiComet-Chip showed high validity compared with the MethylFlash Methylated DNA Quantification Assay (using capture and detection antibodies, followed by fluorometric quantification): single-sample hypermethylation (≥1.5-fold) was correctly identified at 87% (20/23) and hypomethylation (≥1.25-fold) at 100% (9/9), with a 4% (2/54) false negative rate and 10% (4/40) false positive rate42.
DNA–DNA crosslinks have been measured by both the comet assay and alkaline elution, and both assays rely on the ability of crosslinks to retard the migration or elution of DNA; however, there are apparently no reports in the literature of a direct comparison of the two approaches, nor a comparison of either with an approach that can provide absolute quantification of crosslinks, such as mass spectrometry.
Limitations, and attempts to overcome them
Despite its many advantages, the comet assay has limitations, related to the challenges of obtaining absolute quantification, and unequivocal identification of the damage. Other limitations include differences in results between laboratories, because of different ways to measure DNA migration and differences in comet assay procedures229,292.
The scoring of comets is the major technical limitation in the comet assay. The level of DNA damage is inferred from the extent of DNA migration. After staining, comets can be scored by either (semi-)automated image analysis or visual assessment. In the case of image analysis, there is a choice of descriptors; tail length, TI (also referred to as percentage of DNA in tail) and tail moment (TM). They give rise to results expressed in different units, which cannot be easily compared293,294. The tail length is proportional to the extent of DNA damage but reaches its maximum at a relatively low level of damage, which is why it is not recommended for biomonitoring purposes295. TI is expressed as percentage of total DNA fluorescence in the tail of the comet. TM is calculated as the product of the tail length and the fraction of total DNA in the comet tail. The TI is currently recommended by the OECD as the best descriptor for DNA break frequencies since it uses a quantitative measure of damage (from 0% to 100%)286. However, several researchers still tend to use TM, since it takes into account both the length and DNA content of the comet tail. TM has the disadvantage of not having standard units, and given a particular TM, it is impossible to visualize the level of damage being described294–300. Each of these primary comet descriptors can be transformed to a break frequency, such as breaks per million normal nucleotides or base pairs, using calibration with ionizing radiation that has a known relationship between the dose and induction of DNA SBs287,288,301. Such a transformation produces comet assay results that are much easier to understand than the primary comet assay descriptors294. However, lack of access to sources of X- or gamma-rays has limited the adoption of transformation of comet assay results to ‘real’ break frequencies.
Interlaboratory variation in the reported levels of DNA damage has been recognized as a limitation of the comet assay, dating back to the early 2000s302. It results from differences in technique between labs and variation in scoring19. Interlaboratory variation is especially recognized as a limitation in human biomonitoring studies as the apparent heterogeneity between DNA damage levels in different populations might in fact be due to variations in the technical procedures used in the laboratories involved17.
Attempts to standardize the comet assay protocol in validation trials have been partly successful in the sense that the interlaboratory variation is decreased by using standardized protocols14. The lab-to-lab variations in reported levels of DNA damage are probably the most serious limitation of the comet assay; resolving it will depend on the introduction and adoption of better protocols, and the rigorous application of assay controls; it follows that publications should include a detailed description of the protocol used21,23,231.
While there are no published data demonstrating that DNA damage levels measured by the comet assay can predict the development of cancer or other diseases, a recent analysis of prospective studies has shown that high levels of DNA SBs are significantly associated with higher overall mortality in a healthy human population303. Patients with the most prevalent noncommunicable diseases have elevated levels of DNA damage in PBMCs, but this association may be due to reverse causality as the observations stem from cross-sectional studies of patients and healthy controls220 There is evidence demonstrating that many genotoxic carcinogens cause DNA damage, measured by the comet assay, in animal organs and cell cultures207,304. Certainly, the comet assay is not expected to be a stand-alone test with the power to accurately predict individual risk of diseases such as cancer, but it is likely to be of value at the population level. The comet assay is typically combined with tests for clastogenic effects and mutations in animal models to characterize carcinogens with different genotoxic mechanisms of action305,306. This is not standard practice in biomonitoring studies of humans or sentinel species, and further research is needed to obtain information on the optimal combinations of biomarkers of genome stability.
A potential limitation of the comet assay, particularly in biomonitoring studies, is the logistical difficulty of processing large numbers of samples and analyzing them on the same day. However, for many years it has been standard practice with isolated PBMCs to suspend them in freezing medium (e.g., culture medium with 10% fetal bovine serum (FBS) and 10% dimethyl sulfoxide (DMSO)) and freeze them slowly to −80 °C. This avoids the risk of adventitious damage to the DNA through the formation of ice crystals. An important advance is the finding that whole blood can be snap-frozen in small volumes and successfully analyzed with the comet assay upon thawing, even after storage for 5 years228,239,251,307–311. The implication is that such samples could be used in large-scale human biomonitoring and long-term epidemiological studies. The risk of adventitious generation of DNA damage by freezing and thawing may have limited the use of tissue biopsies in the comet assay. However, it is possible to snap-freeze the tissue, store it at −80 °C and process it in such a way that the tissue remains frozen until the cells are in suspension, thus ensuring reliable comet assay results312.
Experimental design
It is recommended that comet assay experiments be designed to include specimens from different exposure groups in the same experiment, especially in the case of biomonitoring studies and low-dose toxicology studies used for risk assessment, which look for small increases in DNA damage levels that are easily obscured by interassay variation. Studies where specimens are analyzed ad hoc should incorporate cryopreserved assay control samples in the experimental design; these control samples can be used to standardize the results, if needed, to adjust for the variations between experiments, over time or between laboratories231.
Controls
If possible, comet assay experiments should have negative and positive controls. Negative controls are vehicle-exposed cells and animals, and human samples from placebo or unexposed groups. For positive controls, the OECD recommends a number of direct-acting alkylating agents for the standard comet assay in animal organs (OECD TG 489), which can be used as positive controls for in vitro studies too. Ionizing radiation is by far the best positive control for the standard comet assay because it is applicable to all species and cells, but it can be difficult to get access to X-ray equipment or gamma sources. Hydrogen peroxide is a reasonable alternative as a positive control in cell culture experiments, but is not suitable for in vivo studies. Unfortunately, there are no positive controls that can be used for all versions of the comet assay. A positive control agent for the enzyme-modified comet assay should generate DNA lesions that are excised by the relevant enzyme, but should not give rise to SBs. The photosensitizer Ro19-8022 has been the most widely used control for the Fpg- and hOGG1-modified comet assay, although 4-nitroquinoline-1-oxide and potassium bromate are also good candidates313. Potassium bromate has been tested in a multilaboratory ring trial, and shows consistent results in cell culture experiments from different laboratories23. It has also been used as a positive control by oral administration to animals for the hOGG1-modified comet assay in the liver and kidney314.
In certain cases, it is not possible to include a positive control group. For instance, a positive control group is not possible in human biomonitoring studies, because it is unethical to expose human beings to potentially carcinogenic compounds. This also applies to domestic and wild animals. The solution is to use positive assay controls, which are cells that have been exposed to DNA-damaging compounds and cryopreserved. Cryopreserved unexposed cells serve as negative assay controls. The assay controls thus serve the purpose of checking the quality of the comet assay experiment, and also allow comparison of results from different laboratories, if each laboratory has access to the same control samples.
Optimization
The relationship between the actual number of DNA SBs and a comet assay endpoint descriptor resembles a sigmoid curve. There is a flat section at the bottom of the curve because a minimum number of DNA SBs are required before the DNA will migrate and form a comet tail. At the upper part of the curve, there is a flattening of the curve because the assay reaches saturation, with virtually all the DNA in the tail, so that additional breaks will not cause further DNA migration. The middle part of the curve shows a linear relationship between the number of DNA SBs and the comet descriptor. This part of the curve determines the dynamic range of the comet assay (and therefore the upper limit of concentration or dose of genotoxic agent that can be analyzed). In optimization, there is a tradeoff between detection of low levels of DNA SBs (i.e., the sensitivity of the assay) and width of the dynamic range. Conditions that favor high sensitivity tend to narrow the dynamic range. Thus, the optimal comet assay protocol entails a reasonable sensitivity of the assay, together with a wide dynamic range. The optimization of the comet assay focuses on the best conditions for the specific specimen that is to be investigated. In the standard assay, DNA migration is affected by the percentage of agarose in which the cells are embedded, and the electrophoresis conditions (mainly the duration and strength of the electric field). For the enzyme-modified comet assay, it is important to optimize the enzyme concentration and incubation time.
Optimization of the number of cells
The number of cells in each gel should be optimized to have a sufficient number of comets to score, but to avoid the likelihood of cells overlapping. Optimization should take into account that the presence of breaks will produce comet tails that can overlap with other comets. Overlapping comets cannot be scored with an image analysis system, but they may be scored visually. Long comets are the result of highly damaged DNA and are more likely to overlap, and so if they are not scored there is a risk of underestimating the damage.
Optimization of the percentage of agarose
The optimal concentration of agarose ranges between 0.5% and 1.5% (wt/vol), with most laboratories using a final agarose concentration of ~0.7%21. A high percentage of agarose impedes the migration of DNA in the gel, whereas a low percentage increases the fluidity of the gel, and risks detachment of the gels from the slides. In between these extremes, the optimization of the agarose concentration depends on the type of specimen (i.e., specimens with high basal levels of DNA damage may require a higher percentage of agarose), and the substrate used (such as glass slides, plastic GelBond films and mini-gel formats).
Titration of enzyme concentration in the enzyme-modified comet assay
The enzyme-modified comet assay is based on the principle that treatment of gel-embedded nucleoids with an added DNA repair enzyme produces additional SBs because of the excision of specific lesions in DNA. This procedure is especially useful for studying DNA lesions that are not converted to SBs by the alkali treatment. It has been observed that the same enzyme from different producers may show substantial differences in activity and specificity313. Thus, it is of paramount importance to titrate the enzyme and vary the incubation period before analysis of test samples. The titration experiment aims at detecting all lesions that are recognized by the enzyme while avoiding nonspecific incisions of the DNA51. Figure 12 depicts an idealized two-step titration experiment with cells that have been treated with a genotoxic agent. First, gel-embedded nucleoids are incubated for a specific period with different concentrations of the enzyme. The optimal concentration of enzyme is obtained in the middle part of the titration curve where a plateau is reached. The subsequent step uses this concentration to determine the incubation time where all lesions are recognized, which is observed as a plateau in the comet score.
Fig. 12 |. Titration steps in the enzyme-modified comet assay.
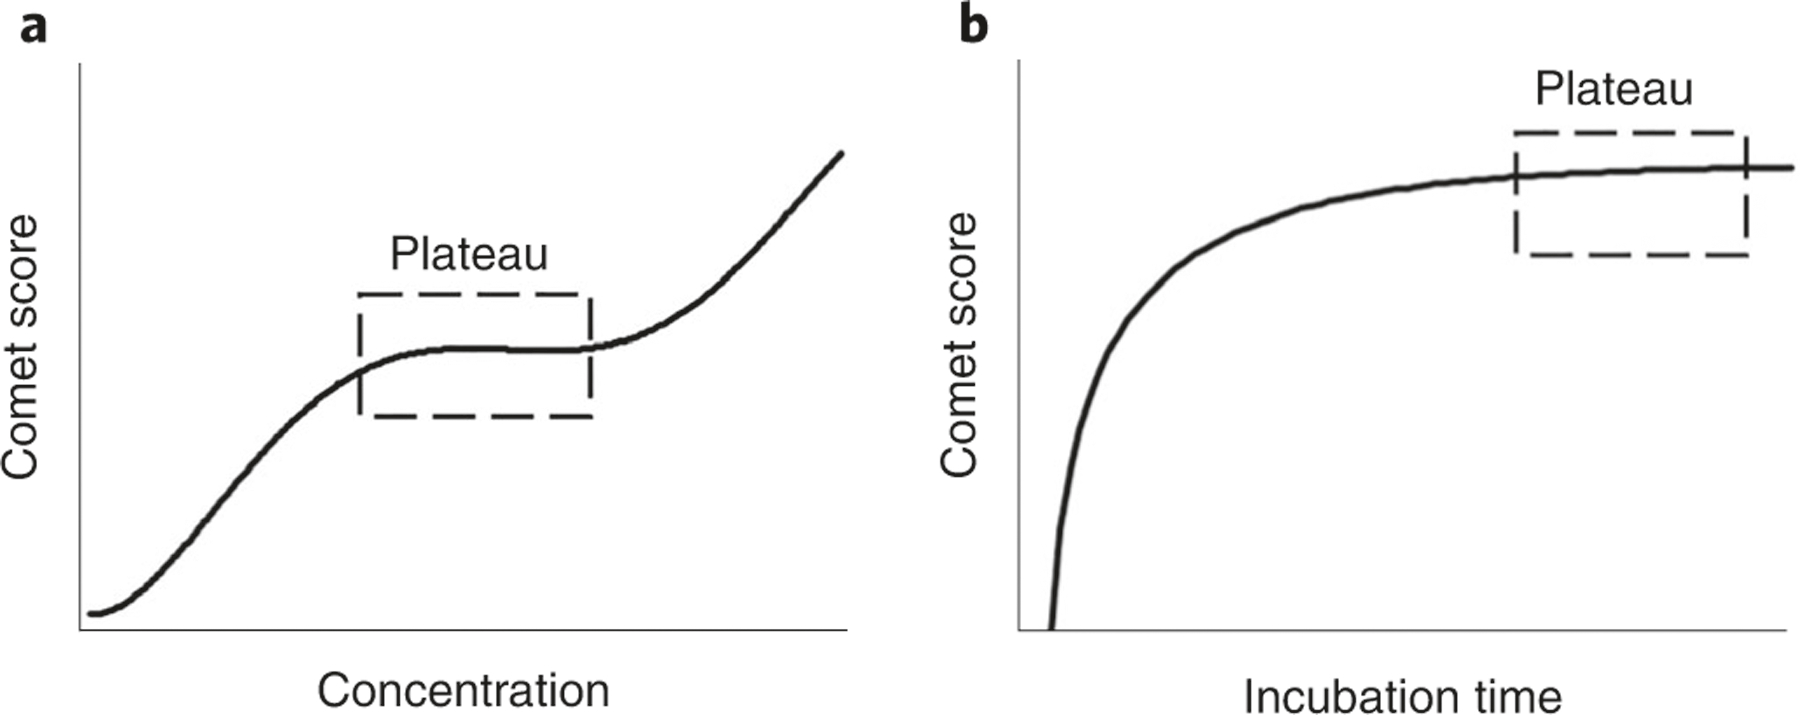
a, The graph illustrates the titration curve that is usually obtained when the optimal concentration of enzymes is found. Cells with a known level of DNA damage (e.g., potassium-bromate-treated cells) are incubated with different dilutions of the enzyme for a specific period (e.g., 30 min). The plateau represents a range of concentrations over which the enzyme has excised all available lesions (i.e., specific incisions), and the subsequent increase in comet score is attributed to nonspecific incisions. b, The graph illustrates the time curve from a comet assay experiment, where the optimal incubation time is selected to be on the plateau where all lesions are recognized by the enzyme.
Optimization of electrophoresis conditions
The electrophoresis conditions are critically important because they determine the extent of DNA migration. Careful control of the electrophoresis step decreases assay variation and increases sensitivity. There are proportional relationships between DNA migration levels and both the electrophoretic field strength (i.e., voltage drop in the electrophoresis tank) and the duration of electrophoresis. These factors should be optimized to make it possible to score all comets in the sample, including comets with long tails. For instance, it is not advisable to use electrophoresis conditions that favor the formation of very long comets because this will result in overlapping comets that are difficult or impossible to score in image software systems. As most comet assay researchers use image software systems to score comets, the practical solution is to use an electrophoresis condition that produces comets that can be captured as single isolated structures by the image analysis system. However, there are also other optimizations to consider, including achieving a homogeneous electrophoretic field and constant temperature during the electrophoresis. There is a proportional relationship between the temperature of the electrophoresis solution and the comet tail length6,315,316. Thus, care should be taken to avoid temperature differences in the electrophoresis tank because this can lead to intra-assay variation. This source of intra-assay variation can be avoided by using homogeneous chilling across the tank or by recirculating the electrophoresis solution30,317,318. If recirculation of the solution is not possible, it is recommended to check the voltage at different positions in the electrophoresis tank using a voltmeter, or to perform an experiment with identical samples of cells at all positions in the electrophoresis tank to assess the spatial variation in DNA damage.
Materials
Biological materials
▲CRITICAL Table 1 summarizes the various experimental models, and sample types that can be used with the procedures described in this protocol. For a full list of animal species in which DNA damage has been evaluated by the comet assay, see the reviews by Gajski et al.4 for invertebrates and Gajski et al.5 for vertebrates.
2D cell culture
The most commonly used suspension cells are leukemia cells (e.g., TK6 and THP-1 cells), while hepatic HepG2 or cervical HeLa cancer cell lines are the most commonly used cells grown in a monolayer. However, almost, if not all animal- and human-derived cell lines can be used. Primary cell cultures have also been used successfully122. ! CAUTION The cell lines used in research should be regularly checked to ensure that they are authentic, and are not infected with Mycoplasma, or any other organism, as this may have an effect on the results, in particular on the DNA damage response319.
3D cell models
-
Human reconstructed full-thickness (FT) skin tissues: e.g., Phenion FT skin (www.phenion.com) or EpiDerm FT skin tissue (www.mattek.com). A video showing how to perform the comet assay using the Phenion FT skin model can be found here: https://www.phenion.com/information-center
-
Human reconstructed 3D airway models: MucilAir produced by Epithelix Sàrl (https://www.epithelix.com/products/mucilair) and EpiAirway produced by MatTek Corporation (https://www.mattek.com/products/epiairway/), or investigator-established air–liquid interface airway epithelial cell cultures sources320
-
Liver minitissue models: hepatocellular carcinoma cells such as HepaRG, HepG2, Huh6 or C3A can be used to obtain 3D spheroids146–149
Zebrafish embryos
Embryos should be collected after spawning, and only freshly fertilized eggs (2 hpf) should be used for the experiments with a duration of exposure up to 96 hpf (refs. 153,321). It is also possible to freeze (at −80 °C) up to 2 weeks freshly harvested cells isolated from embryos in physiological buffer containing 10% (vol/vol) DMSO, without a significant increase of DNA damage322.
Yeast and fungi
When working with Saccharomyces cerevisiae, S. paradoxus, S. kudriavzevii, S. bayanus, Candida albicans, Cryptococcus neoformans and Schizosaccharomyces pombe, it is highly recommended to transfer a single colony to liquid cell culture and harvest yeast cells in the logarithmic phase of growth. The filamentous fungus Ashbya is usually cultivated on solidified Ashbya Full Medium.
Plants
Collect (preferably fresh) roots and leaves from plants to get the best results with low background DNA damage. Previously published studies reported the use of snap-frozen leaves323,324, but this remains to be optimized and validated with lab-to-lab comparisons.
Invertebrate samples
Collected hemolymph cells, coelomocytes, neuroblasts and cells from other tissues can be used depending on the species (Table 1). Heparinized hemolymph is normally used
The most frequently used organs from mollusks are digestive glands, and gills
For very small animals, such as some crustaceans and insects, whole body squashing can be performed to yield a generalized population of cells
Non-human vertebrate samples
The most frequently used tissues are blood (or isolated MNCs), liver, gills and gonads, though other tissues have also been used (e.g., kidney, spleen, heart, duodenum, glandular stomach, jejunum, colon, brain, bladder, adrenals, hypothalamus, thyroid, pituitary, pineal gland, pancreas, ovary, prostate, mammary gland, uterus, testis, etc). Tumor samples can also be used. Whole blood is collected with an anticoagulant such as citrate, EDTA or heparin
Rodents should be anesthetized and exanguinated before obtaining the tissue samples. Immediately after removal of the tissue, excess blood and debris are flushed from the tissue with mincing buffer, or ice-cold Merchant’s buffer before collecting a ~1 cm3 portion and submerging in 0.5 mL mincing buffer on ice. Anesthetization and exsanguination steps should be very brief (<3 min) and consistent between animals with sample collection immediately afterwards, to minimize sample degradation and variability. Alternatively, tissues from non-exsanguinated animals should be thoroughly washed to remove blood by performing several washes in mincing buffer or ice-cold Merchant’s buffer. Snapfrozen rodent solid tissues can also be used; the comet assay has been successfully applied to frozen tissues, such as liver, kidney, lung, brain and spleen (for examples of studies, see Azqueta et al.312). In fact, the OECD test guideline 489 recognizes that tissues can be frozen for later analysis, but currently there is no agreement on the best way to freeze and thaw tissues8. Azqueta et al.312 have described a protocol to freeze and thaw rodent liver, kidney and lung tissues before performing the standard and the Fpg-modified comet assay. The protocol is based on the study of Jackson et al.325. Freezing the whole tissue may not be convenient for some tissues such as the glandular stomach as scraped epithelial cells from this tissue are used for the comet assay analysis. In this case, freezing the cell suspension may be a better option
Regarding fish, zebrafish, mosquitofish (Gambuzia holbrooki), gilthead seabream (Sparus aurata), Senegalese sole (Solea soleganensis) and European eel (Anguilla anguilla) are the most frequently used species, while blood, liver, gills and gonads are the most often used biological matrices. The storage of snap-frozen fish tissues in liquid nitrogen is reported to lead to an increase in DNA breakage326; however, further investigation is required to confirm and/or ameliorate this effect. The use of snapfrozen amphibian solid tissue has not yet been reported in the literature ! CAUTION All experiments involving animals must be approved by the relevant animal care and use committee, and adhere to local and national regulations. ▲CRITICAL During any painful or stressful procedure, anesthetization is recommended by ethical principles and regulation. However, the impact of chemical anesthetics on the DNA integrity should be considered as some studies have shown the time-dependent induction of SBs in some tissues327.
Human samples
Whole blood: collect blood into an anticoagulant, such as Na2EDTA or heparin, by venipuncture or lancet; only if the blood sample is to be used immediately after obtaining via a lancet may the anticoagulant be omitted. Choice of anticoagulant should be kept consistent within one study ! CAUTION Do not use needles with very small diameter as this will cause a greater shearing effect, and may increase background DNA damage levels. It is recommended to use between 20 G (0.9 mm diameter) and 22 G (0.7 mm diameter) needles.
MNCs: MNCs can be obtained from cord, or peripheral blood after centrifugation by density gradient (https://youtu.be/tgNHWVqF52I). PBMCs can also be isolated from blood collected via lancet from a finger prick (https://youtu.be/drbMxbFf3TM)
PMN cells: after density gradient isolation of PBMCs, resuspend the remaining PMN-red cell mixture and isolate PMN cells by adding erythrocyte lysis buffer (https://youtu.be/tgNHWVqF52I) or polygelin solution243 (‘Procedure’: Stage 1, Step 1A)
Blood mononuclear cells (BMCs) from saliva: collect saliva samples by performing four consecutive mouth rinses with 10 mL of 0.9% (wt/vol) NaCl sterile solution for 1 min each. Combine the rinses in sterile 50 mL tubes. No changes in the oral hygiene habits are required, but consuming anything but water is prohibited for the hour before sampling. Centrifuge the oral rinses (15 min, 1,100g, at 4 °C), wash the cell pellet with cold PBS and resuspend in RPMI 1640 cell culture medium. Leukocytes are isolated from the cell suspension by standard density gradient centrifugation328,329
Buccal cells: before sampling, the subject should perform two consecutive rinses with water (room temperature (RT), ~22 °C). The sample is collected with a cytobrush or toothbrush ▲CRITICAL The initial collection/scraping of both cheeks (using separate brushes) is discarded. The superficial layer of the buccal mucosa is mainly composed of cells in early or late apoptotic phase (cells with condensed chromatin or in karyorrhexis) or necrosis (pycnotic or karyolytic cells). To collect viable buccal cells for use in the comet assay, scrape with new brush in circular movements of 10–15 circles on the same place on each cheek260,262.
Nasal cells: these samples are taken with a nylon brush or cytobrush. The participant must stand up, while the person taking the sample will hold their head to prevent it from moving during the sampling. The brush will be introduced slowly into either nostril, following the course of the nasal cavity vertically towards the superior turbinate and meatus; a delicate turn is made in the lower part of the cavity, and the brush is carefully removed330
Lachrymal cells: in parallel to collecting nasal cells, tears containing lachrymal duct and corneal cells can also be collected275. Once the brush is removed, given the stimulation of the olfactory bulb, reflex tearing occurs. To collect the tears, a capillary tube with a capacity of 10–30 µL is placed on the bridge of the nose in the direction of the tearing eye, and by capillarity the tear is introduced into the tube. The sample is maintained in the capillary tubes at RT before performing the comet procedure. The capillary should be placed in a microcentrifuge tube to subsequently elute the tears using a rubber bulb
Semen samples are obtained after 3 d of ejaculatory abstinence by ejaculation directly into sterile specimen beakers made of nontoxic plasticware. These need to be delivered to the laboratory, and analysis begun, within 1 h of collection
Placental tissue: collect a tissue section (5 × 5 × 3 cm) from the parenchyma villous of the fetal side, at least 4 cm from the cord insertion; discard the tissue immediately below the fetal membrane (~1 cm). Keep the sample in NaCl 0.9% at 4 °C until further processing
Biopsies: biopsies from different human tissues have also been used, such as eye lens331, colon104 and testis332 ! CAUTION All experiments involving human tissues must be approved by the relevant institutional ethical committee and adhere to local and national regulations, including the requirement for subjects to give written consent.
Reagents
▲CRITICAL For all the reagents mentioned below, an example of a commonly used supplier is mentioned, although reagents of the same quality, purchased from other providers, should perform equally well.
General reagents
Agarose, NMP (Merck KGaA, cat. no. A4718)
Agarose, LMP (Merck KGaA, cat. no. A9414)
PBS without Ca2+ and Mg2+ (Merck KGaA, cat. no. P4417)
Triton X-100 (Merck KGaA, cat. no. X100)
DMSO (Merck KGaA, cat. no. 41639) ! CAUTION DMSO readily penetrates the skin and may carry other dissolved chemicals into the body, so wear protective gloves.
Glycerol (Merck KGaA, cat. no. G5516)
4-(2-Hydroxyethyl) piperazine-1-ethanesulfonic acid (HEPES; Merck KGaA, cat. no. H3375)
Ethylenediaminetetraacetic acid disodium salt dihydrate (EDTA–Na2.2H2O; Merck KGaA, cat. no. E5134)
Trizma base (Merck KGaA, cat. no. T1503)
Tris hydrochloride (Tris–HCl; Merck KGaA, cat. no. 648317)
Potassium chloride (KCl; Merck KGaA, cat. no. P3911)
Sodium chloride (NaCl; Merck KGaA, cat. no. S9888)
Potassium hydroxide (KOH; Merck KGaA, cat. no. P5958) ! CAUTION KOH is caustic, so wear protective gloves.
Sodium hydroxide (NaOH; Merck KGaA, cat. no. 795429) ! CAUTION NaOH is caustic, so wear protective gloves.
Bovine serum albumin (BSA; Merck KGaA, cat. no. A2153)
Ethanol (EtOH) 96% (Merck KGaA, cat. no. 159010)
Liquid nitrogen (e.g., Linde Gas or Nippon Gases)
Isopropanol (Merck KGaA, cat. no. I9516)
N-Lauroylsarcosine sodium salt (Merck KGaA, cat. no. L9150)
Hydrochloric acid (HCl; Merck KGaA, cat. no. 1090571003)
Trypan blue (Merck KGaA, cat. no. T8154) ! CAUTION HCl is a strong acid, so wear protective gloves.
Cell lines and 3D models
Cell culture medium. Medium may be specific for each cell type, or 3D tissue model, and should be chosen and supplemented according to the advice given by the manufacturer, or literature recommendations
FBS (Merck KGaA, cat. no. F2442)
Trypsin–EDTA 0.05% (Gibco, Thermo Fisher Scientific, cat. no. 25300062)
Trypsin–EDTA 0.25% (Gibco, Thermo Fisher Scientific, cat. no. 11560626)
TrypLE without phenol red (Gibco, Thermo Fisher Scientific, cat. no. 12604013)
Hank’s balanced salt solution, phenol red-free and with Ca2+ and Mg2+ ions (HBSS; Merck KGaA, cat. no. 55037C)
Saline solution (B. Braun, cat. no. 10258674)
Thermolysin (Merck KGaA, cat. no. T7902)
Zebrafish embryos
Pronase E (Merck KGaA, cat. no. 1.07433)
Leibowith L-15 medium (ATCC, cat. no. 30–2008)
Planarians
Papain (Merck KGaA, cat. no. P4762)
L-Cystein-hydrochloride monohydrate (Applichem, cat. no. A3665)
Sodium dihydrogen phosphate monohydrate (NaH2PO4.H2O; Merck KGaA, cat. no. 106346)
Sodium bicarbonate (NaHCO3; Acros Organics, cat. no. 123360010)
Glucose (Thermo Fisher Scientific, cat. no. G/0450/53)
Drosophila
Collagenase type IV (Merck KGaA cat. no. C4-BIOC)
N-Phenyltiourea (Merck KGaA cat. no. P7629)
Annelids
EtOH (Merck KGaA, cat. no. 51976)
EDTA (Merck KGaA, cat. no. E9884)
Guaiacol glycerol ether (Merck KGaA, cat. no. G5627)
Mollusks
Glucose (Merck KGaA, cat. no. G7021)
Sodium citrate (Na3C6H5O7) (Supelco, cat. no. 106448)
Di-potassium hydrogen phosphate anhydrous (K2HPO4; PanReac-AppliChem, cat. no. 131512)
Sodium bicarbonate (NaHCO3; Merck KGaA, cat. no. S5761)
HBSS (Merck KGaA, cat. no. 55037C)
Dispase II (Merck KGaA cat. no. D4693)
Fish
Ethyl meta-aminobenzoate or methanesulfonate salt (MS-222; Merck KGaA, cat. no. E10521)
HBSS (Merck KGaA, cat. no. 55037C)
Rodent tissues
HBSS (Merck KGaA, cat. no. 55037C)
Human samples
Polygelin solution normally used as plasma expander (Emagel, Hoechst)
Proteinase K (Merck KGaA, cat. no. 70663)
Enzymes for enzyme-modified comet assay
▲CRITICAL Some enzymes can be produced ‘in-house’ as crude extracts from E. coli transformed with the corresponding expression vector.
Escherichia coli endonuclease III (Endo III) detects damaged pyrimidines, including thymine glycol and 5, 6-dihydroxythymine (New England Biolabs, cat. no. M0268S)
E. coli formamidopyrimidine DNA glycosylase (Fpg) detects 8-oxo-7,8-dihydroguanine and open ring forms of 7-methylguanine, formamidopyrimidines (FaPy), 5-hydroxycytosine and 5-hydroxyuracil (New England Biolabs, cat. no. M0240S; NorGenoTech AS, cat. no. E0103-10)
Human 8-oxoguanine DNA glycosylase 1 (hOGG1) catalyzes the removal of 8-oxoguanine and formamidopyrimidine moieties in double-stranded DNA, followed by cleavage of the resulting AP site ▲CRITICAL Previously, hOGG1 from Trevigen (cat. no. 4130-100-EB) and New England Biolabs (cat. no. M0241) was used in the comet assay; however, it was recently discontinued. Alternative suppliers could be Prospec (cat. no. ENZ-253) or Abbexa (cat. no. abx073274), but these sources of hOGG1 still need to be tested for their enzyme activity in the comet assay.
T4 endonuclease V (T4endoV) detects cis-syn cyclobutane pyrimidine dimers, including T<>T, T<>C and C<>C, (New England BioLabs, cat. no. M0308S)
hAAG detects a wide variety of alkylated and oxidized purines, including 3-methyladenine, 7-methylguanine, 1,N6-ethenoadenine and hypoxanthine as major substrates (New England Biolabs, cat. no. M0313S)
Uracil DNA glycosylase (Udg) detects misincorporated uracil in DNA followed by cleavage of the resulting AP site by alkaline treatment (Merck KGaA, cat. no. 1144464001)
Reagents for comet visualization
▲CRITICAL Several fluorescent DNA dyes are suitable; the most commonly used are listed below. Other newly developed ‘safer-to-use’ dyes can be used as well. ! CAUTION These dyes are known or potential mutagens; wear protective gloves, and dispose of waste in proper containers.
SYBR Gold (Thermo Fisher Scientific, cat. no. S11494) ! CAUTION Potential mutagen.
SYBR Green (Thermo Fisher Scientific, cat. no. S7567) ! CAUTION Potential mutagen.
Ethidium bromide (EtBr; Thermo Fisher Scientific, cat. no. 17898) ! CAUTION Mutagenic.
DAPI (Thermo Fisher Scientific, cat. no. D1306) ! CAUTION Mutagenic.
GelRed (Biotium cat. no. 41003; Merck KGaA, cat. no. SCT123) is an ultrasensitive, very stable replacement for EtBr DNA/RNA gel stain, safe for humans and the environment, shown to be nonmutagenic and noncytotoxic
Equipment
▲CRITICAL Equipment and consumables needed for the comet assay can be procured from a variety of providers, unless otherwise specified. Although certain providers may be recommended, the protocol should work with standard laboratory equipment of any brand.
General laboratory equipment and consumables
Microwave oven
Freezers
Refrigerator
pH meter
Cooled centrifuge
Automatic cell counter
Plastic tubes, well plates, Petri dishes, etc.
Vortex mixer
Plastic tips
Pipettors
Plastic Pasteur pipettes
Micropipettes
Hemocytometer
Mr. Frosty container (or cell freezing container)
Equipment and consumables for cell culture
Cell culture laminar flow cabinet
Cell culture incubator with CO2
Cell counter
Culture flasks and dishes
Visible light inverted microscope
12- or 24-well Transwell
Equipment and consumables for other sources of cells
For 3D models and planarians: cell strainer with 35–70 µm pores
For mollusks: hypodermic syringe, dissection scissors and tweezers
For solid tissues: cylindrical stainless-steel metal sieve (NorGenoTech AS, cat. no. 1202)
100 µm nylon mesh
Special equipment and consumables needed for the comet assay
Microscope slides: standard microscope slides with frosted end are used (VWR, cat. no. HECH42406020; slides are also available as part of the TREVIGEN Kit, cat. no. 3950-075-02). Alternatively, fully frosted slides can also be used (Surgipath Fully Frosted Slides, cat. no. 3800280) ▲CRITICAL Fully frosted slides do not need to be coated with NMP agarose, but they present some background when viewed under a fluorescence microscope.
GelBond films (Lonza, cat. no. 53734) can be used as support for the gels instead of microscope slides. These polyester films may be cut to the size of standard glass slides; technology has been developed so that larger films can accommodate up to 96 mini-gels on one GelBond film in a 96-well format. The GelBond film is versatile as it can be used to process as many mini-gels as desired. A major advantage is that the agarose gels stick very firmly to the plastic, and seldom fall off, which is sometimes experienced with glass slides. The reader should note that, each time the protocol refers to slides, it also applies to GelBond film
20 × 20 mm, 21 × 26 mm or 22 × 22 mm glass coverslips to form gels
24 × 60 mm glass coverslips
Water bath or thermoblock
Staining (Coplin) jars, for cell lysis and slide washing
For 3D skin model: 40 µm cell strainers (Corning, cat. no. 352340)
Metal trays or plates, to keep slides cold and prevent enzyme reactions from starting (a convenient example is the Slide Chilling Plate from Cleaver Scientific Ltd)
Incubator and humidified box, for the enzyme-modified comet assay (an alternative is a heating plate or ‘slide moat’, for example, those available from Boekel Scientific)
Large-bed horizontal gel electrophoresis tank (for horizontal slide electrophoresis)
Power supply. It is advised to use one that can reach 1–2 A at 20–50 V, i.e., at a voltage that is sufficient to give 1 V/cm on the platform of an electrophoresis tank. The amperage increases with the width of the tank and the depth of the electrophoresis solution over the platform; the latter should always be more than a few millimeters. Consort (BE) is an example of a suitable brand (cat. nos. EV2000 and EV3000)
External peristaltic pump to recirculate the electrophoresis solution, such as those used in aquariums (optional). Alternatively, a gel system with built-in recirculation may be purchased (Fisher Scientific). The stabilization of conditions allows more precise measurement of the electric potential
Recirculating chiller or metal coil in ice bath, to cool the platform of the electrophoresis tank (optional). Alternatively, the electrophoresis tank can be put in a cold room or dedicated fridge, or even put on ice (Fig. 7).
Optional: slide warmer/incubator for drying slides
Epifluorescence microscope and appropriate filter blocks optimized for the fluorochrome, charge-coupled device camera (8-bit black-and-white camera is adequate); high sensitivity and high pixel density are preferred
Software
For scoring comets, using commercially available software for image analysis is recommended, as it gives the most reproducible results. Examples of scoring software include Comet assay IV (Instem), Comet Analysis software (Trevigen), Lucia Comet Assay software (Laboratory Imaging), Metafer (MetaSystems) and KOMET 6 (Andor)
Several free scoring programs are available, such as Casplab (https://casplab.com) or CometScore (http://rexhoover.com/index.php?id=cometscore), among others
Reagent setup
General solutions
1% (wt/vol) NMP agarose in distilled water (for precoating slides).
Microwave to dissolve the agarose and cool to ~50–60 °C in a water bath before use. Approximately 100 mL are sufficient to coat 75–100 microscope slides. 1% NMP agarose is usually made up fresh, but can be reheated once or twice, with the lid placed loosely on top to minimize evaporation.
1% (wt/vol) LMP agarose in PBS (for embedding cells in agarose).
Microwave to dissolve the agarose (or put in a 100 °C water bath for 5 min). It is advisable to make aliquots of 2–5 mL that can be stored at 4 °C and are stable for at least 6 months. Before use, microwave or immerse the aliquot in boiled water to melt the agarose, and then cool to 37 °C (in a water bath or thermoblock).▲CRITICAL It is best not to reheat LMP agarose aliquots (as evaporation can cause a considerable increase in concentration). ▲CRITICAL A lower percentage of LMP agarose can be used to increase sensitivity. The final agarose concentration, after mixing with the cells, is normally 0.7–0.8% (wt/vol). Higher concentrations decrease the sensitivity of the assay (in some cases, a reduced sensitivity is intended, as with human sperm, and therefore higher concentrations are acceptable). Do not use percentages below 0.5% as this will increase the risk of gels detaching or breaking, especially during the enzyme-modified comet assay. ▲CRITICAL At higher relative humidity (>60%), the LMP agarose solution may absorb atmospheric moisture over time, reducing the LMP concentration and leading to variable DNA migration. At lower relative humidity (<30%) the LMP agarose solution might lose atmospheric moisture, increasing the LMP agarose concentration and thus decreasing DNA migration.
Lysis solution
2.5 M NaCl, 0.1 M Na2EDTA and 10 mM Trizma base, pH 10 (with 10 M NaOH). Stable for at least 6 months when stored at 4 °C. Before use, add 1 mL of Triton X-100 per 100 mL. ▲CRITICAL Lysis solution can be freshly supplemented with 10% (vol/vol) DMSO and/or 1% (wt/vol) N-lauroylsarcosine sodium salt. The addition of 10% DMSO to the lysis solution may be useful to prevent potential radical-induced DNA damage associated with the iron released during lysis from erythrocytes present in blood, and tissue samples. The addition of 1% (wt/vol) N-lauroylsarcosine is optional but considered redundant for most purposes, except for the use of buccal cells.
Electrophoresis solution
0.3 M NaOH and 1 mM Na2EDTA. Store at 4 °C for up to 1 week. Another option is to prepare concentrated stock solutions and mix them on the day.
Neutralizing solutions
PBS (Store at 4 °C, or according to manufacturer’s instructions); or Tris–HCl: 0.4 M Tris (Trizma base) in 1 L of distilled H2O (adjust pH to 7.5 using HCl). ▲CRITICAL For the neutralization step, both PBS and Tris–HCl work equally well. If using PBS, perform a single wash for 10 min; if using Tris–HCl, perform three washes, 5 min each (15 min in total).
TE buffer (for staining with SYBR Gold and SYBR Green)
10 mM Trizma base and 1 mM EDTA–Na. Store at RT. Stable for at least 6 months. Alternatively, it is possible to use TBE or TAE buffer as recommended by the manufacturer of the staining dye.
Reagents for enzyme-modified comet assay
Buffer B (post-lysis washing buffer and enzyme reaction buffer for Fpg, hOGG1, EndoIII, Udg and hAAG).
40 mM HEPES, 0.5 mM Na2EDTA, 0.2 mg/mL BSA, 0.1 M KCl, pH 8 (with 10 M KOH). We advise preparing 500 mL of 10× concentrated stock solution of buffer B and freezing (−20 °C) in 50 mL tubes (to use for washing slides after lysis) and in 1 mL aliquots (to use as incubation reaction buffer). Washing can also be done using buffer B without BSA, but you need to add BSA for the incubation step. Stable for at least 6 months. Dilute 10× in distilled water on the day of use. The diluted buffer B can be stored at 4 °C for use in a second assay within the same week.
Buffer N (washing buffer after lysis and incubation reaction buffer for T4endoV).
45 mM HEPES, 0.25 mM Na2EDTA, 0.3 mg/mL BSA and 2% (vol/vol) glycerol, pH 7.8 (with 10 M KOH). We advise preparing 500 mL of 10× concentrated stock and freezing (−20 °C) in 50 mL tubes (to use for washing slides after lysis) and in 1 mL aliquots (to use as incubation reaction buffer). Stable for at least 6 months. Dilute 10× in distilled water on the day of use. The diluted buffer N could be stored at 4 °C for usage in a second assay within the same week. ▲CRITICAL The names of the buffers (buffer B and buffer N) are kept consistent with the nomenclature used in the paper on the comet-based in vitro DNA repair assay22.
Prepare the enzymes according to the manufacturer’s instructions, and titrate them to optimize the enzyme concentration and incubation time before use. For guidelines for your own titrations, see Table 2. Keep the same experimental conditions within one series of experiments. Muruzabal et al.51 describe how to perform the titration using the enzymes in combination with the comet assay. Normally, incubation times of 30–60 min are used. Buffer B and buffer N work with the corresponding enzymes (see the preparation of buffers, above), although other buffers suggested by the manufacturers can also be used.
Table 2 |.
Suggested enzyme concentration based on titration experiments
| Enzyme | Format | Final enzyme concentration | Duration of incubation at 37 °C |
|---|---|---|---|
| Fpg (NorGenoTech) | 2 gels (70 µL of gel; 20 × 20 mm coverslip) 45–50 µL enzyme per gel (22 × 22 mm coverslip) |
0.16 ng/µL | 30 min |
| Fpg (New England Biolabs) | 12 mini-gels (5 µL of gel) 30 µL enzyme per gel using the 12-well chamber unit |
0.026 U/mL | 1 h |
| Endo III (New England Biolabs) | 12 mini-gels (5 µL of gel) 30 µL enzyme per gel using the 12-well chamber unit |
33.3 U/mL | 1 h |
| hOGG1 (Trevigen)a | 2 gels (80 µL of gel; 20 × 20 mm coverslip) 50 µL enzyme per gel (22 × 22 mm coverslip) |
1.6 U/mL | 10 min |
| hOGG1 (Trevigen)a | 12 mini-gels (5 µL of gel) 30 µL enzyme per gel using the 12-well chamber unit |
6.66 U/mL | 1 h |
| T4endoV (New England Biolabs) | 2 gels (70 µL of gel; 20 × 20 mm coverslip) 45–50 µL enzyme per gel (22 × 22 mm coverslip) Incubation in slide moat |
3.33 U/mL | 30 min |
Discontinued from sale. See potential alternatives in the reagents list.
Cell lines and 3D models
Cell culture medium for growing cells.
Some cell culture media must be supplemented with different substances such as serum or nonessential amino acids. Check with the cell line provider the medium needed to grow the cells, or the 3D tissues.
Cell freezing medium.
DMEM, 10% (vol/vol) FBS and 10% (vol/vol) DMSO. Mix 8 mL of DMEM, with 1 mL FBS and 1 mL DMSO. Prepare fresh on the day of use. The proportion of FBS in the freezing medium will depend on the cell type used. If needed, the freezing medium can be stored at 4 °C for up to 24 h.
For 3D skin models.
Thermolysin (0.5 mg/mL in buffer containing 10 mM HEPES, pH 7.2–7.5; 33 mM KCl, 50 mM NaCl and 7 mM CaCl2) to aid dissociation of epidermis and dermis.
For cell dissociation.
Mincing buffer (20 mM EDTA in HBSS without Ca2+/Mg2+, 10% (vol/vol) DMSO added freshly, pH 7.0–7.5). Freezing of the skin models or isolated cells thereof has not yet been attempted.
Planarians
10× CMF (Ca2+/Mg2+-free buffer).
25.6 mM NaH2PO4.H2O, 142.8 mM NaCl, 102.1 mM KCl and 94.2 mM NaHCO3 in distilled water (pH 7). Store at 4 °C.
CMFH: 0.1% BSA (wt/vol), 0.5% glucose (wt/vol) and 15 mM HEPES in 1× CMF (pH 7).
Prepare fresh on the day of use.
Papain solution.
30 units papain/mL, plus 2 mM L-cysteine–HCl prepared in CMFH. Prepare fresh on the day of use. Stock solution of 0.2M L-cysteine–HCl prepared in distilled water can be kept in aliquots at −20 °C for at least 3 months (avoid multiple freeze–thaw cycles).
2% (wt/vol) L-cysteine–HCl in distilled water (pH 7).
Prepare fresh on the day of use. Adjust pH using NaOH.
Drosophila
Ringer’s solution.
Prepare 250 mL containing 130 mM NaCl, 35 mM KCl and 2 mM CaCl2. Adjust the pH to 6.5 with NaOH, and sterilize by autoclaving. Stable for at least 3 months, at 4 °C.
Annelids
Extrusion buffer.
5% (vol/vol) EtOH, 2.5 mg/mL EDTA and 10 mg/mL guaiacol glycerol ether in PBS; pH 7.3
Mollusks
Alsever’s anticoagulant solution.
382 mM NaCl, 115 mM glucose, 27 mM sodium citrate and 11.5 mM EDTA. Store at RT. Stable for at least 1 month.
Ca2+/Mg2+-free saline solution (CMFS).
20 mM HEPES, 500 mM NaCl, 12.5 mM KCl and 5 mM EDTA. Store at RT. Stable for at least 1 month.
Kenny’s salt solution (KSS).
0.4 M NaCl, 9 mM KCl, 0.7 mM K2HPO4 and 2 mM NaHCO3. Store at RT. Stable for at least 1 month.
Rodent tissues
Mincing solution.
HBSS and 20 mM Na2EDTA, pH 7.5 (adjusted with NaOH). Add 10% (vol/vol) DMSO just before using.
Merchant’s buffer.
0.14 M NaCl, 1.47 mM KH2PO4, 2.7 mM KCl, 8.1 mM Na2HPO4 and 10 mM Na2EDTA; pH 7.4. Stable for at least 1 month. Stored at 4 °C.
Human samples
For blood.
(1) Erythrocyte lysis buffer (8.29 g NH4Cl (155 mM), 1.0 g KHCO3 (10 mM) and 0.372 g EDTA (1.0 mM), dissolved in 1,000 mL H2O; pH 7.4, sterile filtered. (2) Freezing medium for blood cells typically contains cell medium, DMSO and FBS, but there is no consensus on the proportion of each ingredient, except that DMSO should be 10% of the final volume.
For saliva.
(1) For sample collection (mouth rinses): dissolve NaCl (0.9% (wt/vol)) in distilled water, and sterilize the solution; (2) for freezing samples: resuspend cells in freezing medium containing FBS (50% (vol/vol)), RPMI 1640 (40% (vol/vol)) and DMSO (10% (vol/vol)) at a concentration of 2.5 × 10⁶ cells/mL (prepare the freezing medium fresh on the day of use in 0.5 mL aliquots by mixing 250 µL of FBS, with 200 µL RPMI 1640 and 50 µL DMSO). Store 0.5 mL aliquots of cells + medium at −80 °C for up to 5 months.
Buccal cell buffer.
0.1 M Tris–HCl, 0.1 M Na4EDTA and 0.02 M NaCl; pH 7.0 (by adding HCl). Autoclave at 121 °C for 15 min. When cold, store the buffer at 4 °C.
Buccal lysis solution 1.
2.5 M NaCl, 100 mM EDTA tetrasodium, 10 mM Tris–HCl and 1% (wt/vol) N-lauroylsarcosine sodium salt. Then adjust pH to 10 using NaOH. Before use, add 1% (vol/vol) Triton X-100 and 10% (vol/vol) DMSO.
Buccal lysis solution 2.
2.5 M NaCl, 100 mM EDTA tetrasodium, 10 mM Tris–HCl and 1% (wt/vol) N-lauroylsarcosine sodium salt. Add 1% (vol/vol) Triton X-100 and 10% (vol/vol) DMSO just before use. Then adjust pH to 7 using HCl, which is optimal for proteinase K activity, and warm to 37 °C.
Mincing solution for placenta tissue.
PBS without Ca2+ and Mg2+, 20 mM Na2EDTA. Store at 4 °C; stable for at least 2 months.
Equipment setup
▲CRITICAL Most of the equipment does not require any special setup, apart from those mentioned below. These setups are also demonstrated in the associated video protocols, which are available here: https://youtu.be/23IcSCZ-kuQ; https://youtu.be/NE2U8f5gwc8; https://youtu.be/s52tkqVNTUA.
Precoating microscope slides
▲CRITICAL When using GelBond films, precoating is not needed. The films can simply be cut to the desired size/shape, and LMP agarose (including the cells) can be applied directly to the hydrophilic side. Generally, for use in the comet assay, the films are cut to the size of a microscope slide to fit 2 or 12 gels,but bigger formats can be used (Supplementary Protocol 3). ▲CRITICAL Various methods exist to coat slides, of which the most common one (and its variations) are described step by step below (tutorial video: https://youtu.be/23IcSCZ-kuQ). Additional steps to improve gel adherence, if needed, have been described before24.
Prepare 1% (wt/vol) NMP agarose solution in H2O, dissolve in the microwave (‘Reagent setup’), and keep at 50–60 °C in a water bath. For the 3D airway model, a 1.5% (wt/vol) NMP agarose solution is used. ▲CRITICAL To prevent boiling, you can use the lowest power setting of the microwave for a longer time, until you see bubbles. At that point, you can give the agarose a stir, and put it back in the microwave. Repeat this until all the agarose has dissolved. To minimize evaporation, put a loose lid on top.
Dip the slides into the agarose gel briefly and wipe the back of the slide clean. Alternatively, pipette ~100 μL of NMP agarose on the slide and cover with a coverslip, or spread agarose over the slide with a clean fingertip. ▲CRITICAL In both cases, make sure to cover in agarose ~4 mm of the frosted part of the slide.
Put the slide flat on a heating plate/slide warmer/incubator (~40–50 °C) until dried, or overnight on the bench. Remember to mark the frosted part to indicate which side of the slide is coated. ▲CRITICAL Slides coated with NMP agarose should be dried, and maintained at <60% relative humidity to minimize the risk of gels coming off during, or immediately after, electrophoresis.
-
Store coated slides in slide boxes at RT (after removing coverslips if used). They can be kept for at least 12 months.
? TROUBLESHOOTING
Electrophoresis setup
▲CRITICAL As the duration of electrophoresis (Stage 3, Step 30), and the electric potential (voltage drop across the electrophoresis tank platform) are the most important drivers of DNA migration, these parameters should be measured, and standardized for all experiments. Video instructions are available here: https://youtu.be/s52tkqVNTUA.
Ensure that the tank is flat using a spirit level.
Measure the distance between the electrodes in the electrophoresis tank.
Add enough electrophoresis solution to cover the microscope slides with at least 5 mm of liquid covering the gels.
Switch on the power supply, and measure the voltage over the platform using a voltmeter (holding an electrode at each edge of the platform). Alternatively, an approximate measure can be obtained by dividing the applied electrode voltage by the distance between the electrodes, but it is more accurate to use a voltmeter. ▲CRITICAL Ensure that the power supply can provide the output current at a constant voltage and that the tank is filled with a sufficient volume of liquid (a power supply that reaches 1–2 A should suffice for most tanks, but higher currents may be needed for larger tanks). The samples should be covered with at least 5 mm of liquid. The depth above the samples should not be made too shallow in order to enable the use of a power supply with low capacity.
The electrophoresis conditions normally used are ~1 V/cm (on the platform of the tank) and ~20 min. ▲CRITICAL The electrophoresis conditions can differ depending on the biological samples used; exceptions are mentioned in the Procedure and Supplementary Protocols. Other electrophoresis conditions can also work. ▲CRITICAL The same electrophoresis conditions should be used for all experiments within the same study. ▲CRITICAL The electric potential × time (EPT) value (dimension: (V/cm) × min) can be calculated and designates a specific assay sensitivity. This value allows the comparison of the electrophoresis conditions between labs. EPT ~20 is advised for most biological samples; exceptions are indicated in the Procedure and Supplementary Protocols. As an example, if a tank has a platform that is 25 cm wide and the voltage over the platform is 16.5 V as measured by a voltmeter, the electrophoresis needs to run for 30 min to reach an EPT of 20 (0.66 V/cm × 30 min = 20).
Procedure
▲CRITICAL If the comet assay for genotoxicity testing is used, the treatment of the cells/3D models/ animals should be performed before the collection of the samples for the comet analysis. The same applies when the comet assay is used in human biomonitoring after, for example, a nutritional intervention study. However, lymphocytes (or other cells) from animals or humans can be treated in vitro; in that case, they should be isolated in advance and processed as cells in suspension.
▲CRITICAL Keep the tubes/samples on ice during all steps until the embedding of the cells in LMP agarose, or until freezing of the cell suspension, to avoid repair of DNA lesions.
▲CRITICAL Stage 1 can be performed on the day of the comet assay (i.e., Stages 2A, 2B and 3). In this case, we advise to prepare the materials described in Steps 4–8 before starting. Alternatively, cell suspensions can be frozen and stored until later analysis. Before starting the enzyme-modified comet assay, it is essential to have optimized the concentration of the lesion-specific enzymes and to determine their suitable incubation time with gel-embedded nucleoids (‘Experimental design’).
▲CRITICAL In all cell handling: never vortex cells, avoid rapid pipetting (especially through narrow-bore tips) and keep cells on ice after harvesting. Minimize as much as possible the time from harvesting of the samples until lysis. In all cases, information about cell viability can be obtained using the Trypan blue stain.
▲CRITICAL Stages 1–4 are identical for all specimens, except for yeast and filamentous fungi, plant and sperm cells, which require modified protocols as specified in Supplementary Protocols 11–13, respectively.
Stage 1: preparation of cells from frozen (day 0) or fresh (day 1) samples ● Timing 0.5–3h (depending on the cell type and the number of samples)
- I Prepare a cell pellet when possible. In some cases, the sample obtained is a cell suspension (e.g., cultured cells in suspension, blood or saliva; option A), but when working with other in vitro models (options B–D), whole invertebrate organisms or tissues (options E–K), vertebrate tissues (options L–N) or human tissue samples (options O and P), a mechanical and/or enzymatic processing in specific buffers is required, and a cell pellet is not always obtained. Proceed immediately to Step 2 after preparing the cells.
- Preparation of cells from (co-)cultures, blood or saliva
- Collect the required number of cells:
- Grow the desired cell line in suspension according to the provider’s instructions. Collect an aliquot from the cell suspension
- To isolate PMN cells, after density gradient isolation of MNCs, resuspend the remaining PMN–erythrocyte mixture and add erythrocyte lysis buffer (https://youtu.be/tgNHWVqF52I). Using this procedure, ~2.5 × 10⁷ PMN cells are typically isolated from 10 mL of blood, viability >95%. Alternatively, dilute the PMN–erythrocyte mixture 1:5 with PBS and mix with an equal volume of a 3.5% polygelin solution for ~45 min at RT, to separate the red cells in the lower layer and PMN cells in the upper layer (containing mainly neutrophils)243
- Count the number of cells in the cell suspension using a hemocytometer or an automatic cell counter.
- Centrifuge cells at ~150–300g for 5 min at 4 °C.
-
Wash cells with ice-cold PBS, and centrifuge again.▲CRITICAL STEP Whole blood or buffy coat can be mixed directly with LMP agarose (Stage 2A).
- Preparation of cells from adherent cell (co-)cultures or 3D liver spheroids
-
Grow cells in a flask or dish in culture medium to near confluence. For 3D liver spheroids: grow hepatocellular carcinoma cells (such as HepaRG, HepG2, Huh6 or C3A) in a 96-well according to previously published protocols146,147,149 and use spheroids at specific age (depending on cell line and application).▲CRITICAL STEP The spheroids grown in static conditions can develop a necrotic core after 10 d.
- Remove medium, wash cells with PBS and dissociate cells.
- For adherent (co-)cultures: trypsinize according to standard procedures using 0.25% trypsin–EDTA.
- For spheroids obtained with HepaRG: pool 11 spheroids in a 1.5 mL microtube, and dissociate by adding 200 μL of TrypLE for 40 min at 37 °C.
-
For liver spheroids obtained from nonquiescent cells such as HepG2, Huh6, etc., add 50 µL 0.25% trypsin–EDTA, or TrypLE, and incubate for 10 min at 37 °C.▲CRITICAL STEP Avoid long trypsin treatment as this can increase background levels of DNA damage. Scraping off the cells can be an option in some cases.
- Neutralize trypsin with cell culture medium containing 10% FBS.
- Transfer the cells to appropriate tubes, and centrifuge for 5 min at 150–300g at 4 °C (depending on cell line).
-
- Preparation of cells from 3D airway models
- Culture the MucilAir models on 12- or 24-well Transwell culture supports at the air–liquid interface.
- Following exposure, wash the airway model with 800 µL saline (add 600 μL to each well and 200 μL on the insert (24-well plate)) and incubate for 2 min at RT.
- Transfer the inserts to a new 24-well culture plate filled with 600 µL 0.05% trypsin–EDTA per well, and add another 200 µL 0.05% trypsin–EDTA to each insert.
- Following a 10 min incubation at 37 °C, resuspend the cells and transfer the cell suspension to 15 mL centrifuge tubes that are filled with 2 mL 10% FBS.
- Harvest the cells by centrifugation (5 min, 200g, RT).
- Preparation of cells from 3D skin models
- When using the Phenion FT skin model, after exposure, wash the tissue with 1 mL PBS.
- Place the Phenion FT tissue on 300 µL thermolysin in a 12-well plate, and incubate 2 h at 4 °C.
- Separate the dermis and epidermis using forceps.
- Transfer each layer separately to 1 mL of cold mincing buffer, cut into small pieces with scissors and leave to incubate on ice for 5 min.
- Resuspend by pipetting, and filter through 40 µm cell strainers.
- Harvest the mixture of cells and nuclei by centrifugation (5 min, 250–300g, 4 °C).
- Preparation of zebrafish embryos
-
Whole body squashing (for embryos at the age of maximum 48 hpf): only freshly fertilized eggs (2 hpf) should be used for the experiments. After the treatment with genotoxic agent, submerge the embryo in a minimal volume of fresh medium supplemented with pronase E (2 g/L) for 4 min to soften the chorion. Then rinse the embryos with fresh medium (without pronase E). Place the embryos directly in a drop of LMP agarose, cover with a coverslip and gently squash to obtain single cells. The cells will spread all over the microscope slide, remaining embedded in the agarose. Optionally, another layer of 1% LMP agarose (80 μL) can be added on top of the squashed embryo.▲CRITICAL STEP Ensure that the embryos are gently squashed in LMP agarose.
- Whole body cell isolation using a mechanical isolation procedure (for embryos at the age of up to 96 hpf): gently dissociate the embryos into single cells (usually pool of eight to ten, depending on required single-cell yield) in 2 mL cold PBS using a tissue grinder (glass–glass homogenizer), or scissors followed by gentle pipetting. Filter the cell suspension through a gauze/mesh with 70 µm pores, and then centrifuge the suspension (10 min, 200g, 4 °C). Resuspend the pellet with cold PBS, and repeat centrifugation (7 min, 180g, 4 °C). Finally, resuspend the pellet in ice-cold PBS (or Leibowith L-15 medium). Before proceeding to Stage 2A or 2B, assess viability using a Trypan blue dye assay or similar.
-
- Preparation of cells from invertebrates: crustaceans (Daphnia magna and Ceriodaphnia dubia)
- After exposure to the test compound, transfer the organisms to tubes.
- Add 1 mL of lysis solution (1 mL PBS containing 20 mM EDTA and 10% DMSO) to dissociate the exoskeleton.
- Isolate cells by repeated, light pipetting for 5 min.
- Centrifuge (10 min, 2,292g, 4 °C).
- Preparation of cells from invertebrates: planarians
- Using a plastic Pasteur pipette, transfer the worm(s) to a Petri dish with 2% L-cysteine–HCl to remove mucus. Incubate for 2 min with gentle shaking. You can pool multiple worms per biological sample to increase yield.
- Transfer worm(s) to a Petri dish with CMFH to rinse.
- Transfer worm(s) to a glass slide; remove as much CMFH as possible, and cut worm(s) into small pieces using a scalpel. Regularly wipe the scalpel to avoid mucus accumulation.
- Transfer the pieces to a 1.5 mL tube using CMFH (125 µL for 1 worm, 250 µL if using multiple worms per sample).
- Add an equal volume of papain solution to the tube, and incubate for 1 h at 26 °C without shaking (e.g., in a thermoblock).
- Add 700 µL CMFH, vigorously pipette up and down repeatedly to further macerate the fragments and filter into a plastic centrifuge tube using a 35 µm strainer. Keep samples on ice.
- Centrifuge (5 min, 350g, 4 °C); discard the supernatant, and resuspend the pellet in 4 mL CMFH. Keep sample on ice.
- Optional: perform an additional filtration with a cell strainer with smaller mesh size. Mesh size can be adjusted on the basis of the cell types under investigation.
- Centrifuge (5 min, 350g, 4 °C); discard supernatant, and resuspend the pellet in 1 mL CMFH. Keep sample on ice.
- Transfer the sample to a 1.5 mL tube, and centrifuge for 5 min at 350g at 4 °C.
- Preparation of cells from invertebrates: Drosophila
- Collect the tissue of interest (e.g., brain ganglia, anterior region of the midgut, or hemocytes) and pool from 5–50 larvae.
- Transfer solid tissues to washing solution (Ringer’s solution or PBS containing phenylthiourea may be used): 100 µL per tissue from five larvae. Hemocytes are mixed with PBS plus 0.07% phenylthiourea.
- Treat solid tissues with collagenase for 15 min at 24 ± 1 °C or disaggregate them physically by breaking/tearing/shredding them with tungsten wires, and pass the tissues through nylon mesh to prepare a single-cell suspension.
- Centrifuge for 20 min at 300g at 4 °C.
- Preparation of cells from Chironomus riparius larvae
-
Whole body squashing: use a pool of at least ten fourth-instar larvae to ensure that a sufficient number of cells are obtained. If larvae are from earlier stages, more will be needed. Place the larvae on a fine mesh strainer (0.3 mm mesh) laid over a mortar containing 3 mL of ice-cold 1× PBS.▲CRITICAL STEP Keep the sample on the strainer immersed in cold PBS until Step 1(I)(iv) to avoid DNA damage caused by oxidation.
- Make several transverse cuts in the larval bodies with a scalpel to facilitate cell extraction, as larvae have a hard exoskeleton.
- Use a pestle to gently grind up the sample (mechanical mincing) to obtain the cell suspension. Avoid as much as possible the presence of cuticle debris.
- Homogenize the sample by pipetting and transfer to 1.5 mL tubes (on ice).
- Centrifuge cells at ~150–300g for 5 min at 4 °C.
-
- Preparation of cells from invertebrates: annelids (Oligochaetes, earthworms)
- Collect the earthworms from experimental soil, and rinse in cold PBS at 4 °C.
- Place each earthworm on paper moistened with PBS, and massage half of its posterior length to expel the contents from the lower gut to reduce faecal contamination of the extrusion fluid.
- Place each worm in a tube containing 3 mL of the extrusion buffer for 3 min at RT.
-
Collect the extruded coelomic fluid containing coelomocytes by centrifugation at 150g for 10 min at RT, and wash the resulting pellet in 3 mL of PBS three times.▲CRITICAL STEP An alternative method to extract coelomocytes involves stimulating worms electrically twice for 1 s with 4.5 V, which results in extrusion of coelomocytes through the dorsal pores.
- Preparation of cells from invertebrates: mollusks (Bivalvia)
- Hemolymph cells:
- Make an incision in the mollusk shell, and withdraw ~1.5 mL hemolymph from the posterior adductor muscle with a sterilized hypodermic syringe containing precooled modified Alseve’s anticoagulant solution (1:5 (vol/vol), hemolymph: Alsever)
- Keep the samples on ice until centrifugation for 5 min at 250g at 4 °C.
- Solid tissue (gills and digestive glands):
- Solid tissue (gills and digestive glands):
- Dissect and slice the tissue into small pieces using dissection scissors and tweezers
- Place excised tissues in tubes containing 3 mL of CMFS, and incubate for 1 h at RT with gentle, horizontal shaking
- Place the tubes in a vertical position for 5 min to allow the fragments of tissue to settle
- Collect the supernatant containing the suspended cells with a pipette, transfer to another clean tube and centrifuge for 5 min at 500g at 4°C
- Remove the supernatant, and wash cells twice in 1.5 mL KSS with centrifugations of 3 min at 1,000g at 4 °C
- Alternatively, if not enough single cells are obtained, dispase II digestion can be conducted: after rinsing dissected tissues with HBSS, add 1 mL of 1.6 mg/mL dispase II solution freshly prepared in HBSS and incubate for 30 min at 37 °C in the dark, shaking every 10 min. After digestion, spin samples for 5 min at 160g at RT. Collect the supernatant containing the cells in suspension, and centrifuge again for 2 min at 775g at RT
- Preparation of cells from vertebrates: amphibians
- Blood cells from tadpoles:
- Section tadpoles in the ventral position at the level of the operculum
- Obtain blood samples by soaking the tadpole and dripping blood into PBS, followed by centrifugation for 9 min at 160g at RT. Up to 5 µL of blood can be obtained from a single tadpole
- Blood cells from fully developed specimens:
- Draw blood through heart puncture using heparinized syringes/collection tubes, collect in individual microtubes and refrigerate at 4 °C until slide preparation
- Preparation of cells from vertebrates: fish
- Blood cells:
- Collect blood using a method such as caudal puncture, which is easily applicable to specimens weighing >200 g
- Alternatively, adopt more invasive methods such as caudal peduncle transection (e.g., Danio rerio), decapitation and sampling with heparinized capillary tubes in the cardiac region (recommended for very small fish, such as G. holbrooki, and larval stages), or puncture on posterior cardinal vein or heart (most species)
-
Even if a large amount of blood is collected (e.g., S. aurata, S. soleganensis and A. anguilla), only 2 µL is required▲CRITICAL STEP When <2 µL of blood is available, to avoid obtaining an insufficient cell number in the cell suspension, mix the sampled blood with <1 mL of ice-cold PBS (defined on a case-by-case basis).
- Organs (liver, gills and gonads):
- Collect organs (ensuring proper exsanguination of the fish), and place (and rinse) them immediately in ice-cold PBS, to remove blood cells
- Obtain a cell suspension by briefly homogenizing/mincing in PBS a small portion of the tissue into small pieces, using scissors, tweezers or a scalpel. This can be followed by a soft mechanical dissociation (pipetting up and down) to further promote cell dissociation
- Additional digestion with trypsin (and/or collagenase) can increase the cells’ dispersion (10–15 min depending on the enzyme concentration and temperature of incubation). To get rid of larger tissue pieces, filter the cell suspension using a sterile mesh (usually with 50–100 µm pores). If necessary, centrifuge the cell suspension (5–10 min, 200g, 4 °C), discard the supernatant and resuspend the pellet in 1 mL of ice-cold PBS. Repeat the centrifugation/washing step (usually twice)
- Preparation of cells from vertebrates: rodents
- From fresh tissue:
- Rinse the tissue using cold PBS (Ca2+ and Mg2+ free, 20 mM EDTA), mincing buffer or Merchant’s buffer. The buffer should be ice-cold (4 °C) to avoid the risk of artifactual generation of DNA damage
- Add 200 µL of the preferred cold buffer (i.e., PBS, mincing buffer or Merchant’s buffer) to ~5 mg wet tissue (~15 mm3). Recommendations about the size of the different organs can be seen in Table 3
- Use one of the following methods to obtain a cloudy suspension: (1) mince the tissue using scissors or surgical blade, (2) aspirate tissue in a 1 mL syringe (13 × 0.45 mm, without a needle) and move the suspension back and forth five to ten times, or (3) filter the suspension through a cylindrical stainless-steel metal sieve (NorGenoTech) using a plastic plunger from a 1 mL syringe
- Collect cell suspension after large tissue debris have settled (5 min) or filter the suspension through a 100 µm nylon mesh
- From frozen tissue:
- Place the cryotube containing the sample on dry ice
- Add a drop of Merchant’s buffer or mincing buffer on top of the sample to create a protective ice cap
- Transfer the deep-frozen tissue, using tweezers chilled on dry ice, into a cylindrical stainless-steel metal sieve (NorGenoTech) previously immersed in ice-cold Merchant’s buffer or mincing buffer
- Homogenize the tissue by moving a plastic plunger from a 1 mL syringe up and down several times (forcing the tissue to pass through the sieve)
- Collect the homogenized samples in 3 mL Merchant’s buffer or mincing buffer (kept on ice)
-
Alternatively, frozen tissues can be pulverized by a single sharp impact with a dry ice-cooled hammer after placing the tissue in a dry, ice-chilled metal pulverizer. The powder is then resuspended in 3 mL Merchant’s buffer or mincing buffer (kept on ice)▲CRITICAL STEP To prepare the cell suspension from frozen tissues, the sample should still be frozen when starting the homogenization.
- Human samples: preparation of cells from placenta
- Wash the fresh placenta piece using cold PBS (Ca2+ and Mg2+ free, 20 mM Na2EDTA).
- Add 5 mL of cold (4 °C) PBS, and mince the tissue using scissors.
- Recover 2 mL of cell suspension, avoiding transfer of debris, and run it slowly through a 23 G needle.
- Add 5 mL of PBS, and centrifuge twice (15 min, 350g, 4 °C).
-
Human samples: preparation of cells from epithelial cells (buccal, nasal and tears)▲CRITICAL Tears can be mixed directly with LMP agarose.
- Collect cells with a spatula or cyto/toothbrush as described in ‘Biological materials’.
-
Immerse the cytobrush or spatula in 1 mL of cold (4 °C) buccal cell buffer or PBS (Ca2+ and Mg2+ free), gently shaking to collect as many of the cells as possible, while keeping the tube on ice. Discard the brush.▲CRITICAL STEP PBS can be used if you are going to process cells immediately, while buccal cell solution should be used in case cells need to be stored or transported (as might happen during human biomonitoring).
- Centrifuge for 5–10 min at 250g at 4 °C.
To use the cells directly for embedding in LMP agarose, remove supernatant and go to Stage 2A (Step 10).
-
Optional) If desired, freeze cell suspensions for later use.
▲CRITICAL If the freezing procedure for a specific species/sample type is not described in this step, this means it has not been tested yet.- Freezing cells from cultures, blood (PBMCs and leukocytes), placental tissues or saliva BMCs using freezing medium
-
Resuspend the cell pellet in cold freezing medium at ~1 × 10⁶ cells/mL.▲CRITICAL STEP Cell suspension of placental tissues can be cryopreserved using 90% FBS, 10% DMSO as freezing medium.
- Prepare aliquots, for instance, 0.5 mL (containing ~500,000 cells) in 1.5 mL microtubes. Each aliquot will have enough cells for 20 gels in 2 gels/slide format (Stage 2A). Larger aliquots can be prepared in case you plan to run more gels or slides per assay. When using the high-throughput formats with mini-gels (Supplementary Protocols 3 and 4), smaller aliquots can be frozen.
- Cryopreserve at −80 °C (the vials can be slowly frozen using Mr. Frosty containers with isopropanol or in a thick-walled polystyrene box).
-
- Freezing whole blood with cryopreservative
- Centrifuge 100 μL whole blood for 1 min at 1,000g at RT, and remove the excess plasma.
- Add 100 μL ice-cold (4 °C) freezing medium (i.e., 70% RPMI 1640 cell culture medium, 20% FBS and 10% DMSO).
- Cryopreserve at −80 °C (the vials can be slowly frozen using Mr. Frosty containers with isopropanol or in a thick-walled polystyrene box).
-
Freezing harvested cells from zebrafish embryo
- After the treatment (48 hpf), place the embryos (n = 4) in 200 µL of 10% (vol/vol) DMSO in PBS (pH 7.4) and gently mince with scissors and gentle pipetting.
- Centrifuge the suspension (2 min, 250g, 4°C).
- Collect the supernatant in a new tube.
- Store supernatant at −80°C up to 2 weeks.
- Mix 20 µL of supernatant with 180 µL 1 % LMP agarose, and add to the precoated slide.
■ PAUSE POINT In case samples can be frozen, the next stages can be performed later on; ensure that samples are stable during storage (this needs to be tested for each type of sample; as an example of a stability study, check Azqueta et al.312). When ready to thaw cells, prepare the materials as explained in Steps 4–8, and follow instructions in Step 9 to embed the cells in LMP agarose.
Table 3 |.
Recommended cell suspension processing and embedding in LMP agarose, as a starting guide for own optimizations
| Species/cell type | Cell suspension | Dilution in LMP agarose | Final cell density (final LMP agarose %)a |
|---|---|---|---|
| In vitro models | |||
| Cell (co-)cultures | Resuspend the cell pellet to ~1 × 10⁶ cells/mL using cold (4 °C) PBS | Mix 3:7 with 1% LMP agarose | ~2.1 × 10⁴ per 70 µL gel (0.7% LMP agarose) |
| Liver spheroids prepared from HepaRG cells | 20,000 cells/mL | Mix cell suspension pellet with 100 μL of 0.5% LMP agarose | 150,000 cells/mL (0.5% LMP agarose) |
| Liver spheroids prepared from HepG2 cells | 130,000 cells/mL; resuspend pellet in 70 µL cell culture medium | Mix 50 μL of the cell suspension 1:3 with 0.8% LMP agarose | ~3.2 × 10⁴ per 70 µL gel (0.6% LMP agarose) |
| 3D airway model | Resuspend in LMP agarose | Add 150 µL of 0.5% LMP agarose | Not determined, but a good comet density for scoring is achieved (0.5% LMP agarose) |
| 3D skin model | Resuspend the cell pellet in remaining buffer (~200 µL) | Add 300 µL of 0.75% LMP agarose | 3–6 × 10⁴ per 75 µL gel (~0.5% LMP agarose) |
| Zebrafish embryos | Whole-body squashing (one embryo per slide) | 1 embryo directly in 60 µL of 1.5% LMP agarose | 1.5% LMP agarose |
| Whole-body cell isolation (from a pool of up to 8 embryos, depending on single cells yield, 5–6 × 10⁶ cells/mL) | 20 µL of cell suspension in 180 µL of 1% LMP agarose | Up to 5–6× 10⁶ cells/mL (0.9% LMP agarose) | |
| Non-mammalian models | |||
| Crustaceans | ~1.0 × 10⁵ cells per 140 µL | Resuspend cells in 0.7% LMP agarose | ~5 × 10⁴ per 70 µL gel (0.7% LMP agarose) |
| Planarians | Lyse entire animal + filter with cell strainer to obtain cell suspension. Cells are generally not counted | Resuspend the cell pellet directly in 160–180 µL 0.8% LMP agarose | One sample can be one or multiple worms. This sample is then divided, 70 µL per gel (two technical duplicates) |
| Insects—Drosophila melanogaster | Resuspend the obtained cells (~1,000 cells/µL) in Poel’s salt solution, Ringer solution or PBS containing phenylthiourea | Mix 2:8 with 1% LMP agarose | 50–100 cells/µL gel (0.8% LMP agarose) |
| Insects—Chironomus riparius | Resuspend the cell pellet to ~1 × 10⁴ cells/mL using cold (4 °C) PBS (if the pellet contains cells from 10 fourth-instar larvae, ~250 µL should be added) | Mix 10 µL of the cell suspension with 100 µL of 1% LMP agarose | ~300 cells per 75 µL gel (0.91% LMP agarose) |
| Annelids—earthworm | Resuspend the cell pellet to ~1.5 × 10⁴ cells/mL using cold (4 °C) PBS (1 mL of PBS is normally used per earthworm) | Mix 1:1 with 1% agarose | ~450 cells in 60 µL (0.5% LMP agarose) |
| Mollusks—mussels | Gills and digestive glands: resuspend the cell pellet to ~5 × 10⁵ cells/mL in KSS Hemolymph: dilute hemolymph from one animal in modified Alsever (1:5) |
Resuspend the cell pellet in 75 µL 0.5–0.85% LMP agarose | 2.5 × 10³ cells/µL (0.45–0.75% LMP agarose) |
| Amphibians | Resuspend the blood cell pellet in 50 µL cold (4 °C) PBS (~1.0 × 10⁶ ± 0.3 cells/mL) | Mix 3:7 with 0.5% LMP agarose | 4 × 10⁴ cells per 250 µL gel (0.5% LMP agarose) |
| Large fish (e.g., Gilthead seabream, Senegalese sole and European eel) | Blood: 2 µL peripheral blood mixed with 1 mL PBS Liver and gills: after mincing, to complete cell dissociation, resuspend the small pieces of tissue in 1 mL PBS by pipetting up and down |
Mix 20 µL of the cell suspension with 70 µL (1%) LMP agarose Mix 20 µL of the cell suspension with 70 µL (1%) LMP agarose |
~2 × 10⁴ cells in 70 µL gel (0.8% LMP agarose) ~2 × 10⁴ cells in 70 µL gel (0.8% LMP agarose) |
| Small fish (zebrafish) | Blood: mix 10 µL peripheral blood with 90 µL PBS without Ca2+/Mg2+ | Mix 10 µL of peripheral blood cells in PBS with 70 µL 1% LMP) | ~1.5 × 10³ cells in 70 µL gel (0.9% LMP agarose) |
| Liver, gills and gonads: resuspend the minced (and washed) small portion of the tissue in 1 mL PBS supplemented with 0.02% EDTA | Liver: mix 10 µL of cell suspension in PBS with 70 µL 1% LMP Gills and gonads: mix 25 µL of cell suspension with 75 µL 1% LMP |
Liver: ~1.5–3.0 × 10³ in 70 µL gel (0.9% LMP agarose) Gills and gonads: ~2.5 × 10⁴ cells in 70 µL gel (0.75% LMP agarose) |
|
| Mammalian models | |||
| Rodent tissues | Liver: 3 × 3 × 3 mm Kidney: 2 × 3 × 5 mm Lung: 5 × 5 × 5 mm Spleen: 1 × 1 × 1 mm Brain: 2 × 3 × 5 mm Duodenum, jejunum, ileum, colon: 1.5 cm segments (Cells from the gastrointestinal tract can also be obtained by scraping off the inner part of the organ) Add 1.5 mL (mice) or 2 mL (rat) of cold PBS (Ca2+- and Mg2+-free, 20 mM EDTA), mincing buffer or Merchant’s buffer to the minced tissues Cells are generally not counted |
Mix 30 µL of cell suspension with 140 µL 1% LMP agarose | (0.82% LMP agarose) |
| Whole blood | Use 5–20 µL whole blood directly. Alternatively, mix 10 µL whole blood with 40 µL PBS | Mix 20 µL of whole blood with 480 µL 0.8% LMP agarose. Alternatively, add 160 µL of 1% LMP agarose to the whole blood/PBS mixture |
50–125 cells/µL gel (0.5–0.7% LMP agarose) |
| Buffy coat | Use 5 µL buffy coat directly | Mix 5 µL of buffy coat with 200 µL 0.8% LMP agarose | Sufficient number of cells to carry out the assay (~0.8% LMP agarose) |
| Leukocytes, PBMCs | Resuspend the cell pellet to ~1 × 10⁶ cells/mL using cold (4 °C) PBS | Mix 3:7 with 1% LMP agarose | ~2.1 × 10⁴ per 70 µL gel (0.7% LMP agarose) |
| Salivary BMCs | ~2 × 10⁵ cells per 160 µL | Resuspend the cell pellet in 0.7% LMP agarose | ~1 × 10⁵ per 80 µL gel (0.7% LMP agarose) |
| Buccal cells | 100,000–500,000 cells per 1 mL PBS | Resuspend the cell pellet in 0.5% LMP agarose | 10,000–50,000 cells per 75 µL gel (0.5% LMP agarose) |
| Nasal cells | 50,000 cells per 50 µL of PBS | Resuspend the cell pellet in 0.5% LMP agarose | 50,000–100,000 cells per 75 µL gel (0.5% LMP agarose) |
| Tears (lachrymal duct and cornea cells) | Use tear directly | Mix the tears (30 µL) with 30 µL 1% LMP agarose | 100–1,000 cells (0.5% LMP agarose) |
| Placenta | Centrifuge a cell suspension of ~2.5 × 10⁴ cells/mL (in PBS) | Add 200 µL 0.6% LMP agarose to cell pellet | ~500 cells per 5 µL gel (0.6% LMP agarose) (12-gel format) |
This is the most commonly used percentage of LMP agarose for each sample type, but other concentrations between 0.5 and 1.5% may work as well (see also ‘Optimization of percentage of LMP agarose’). For other species/cell types, see Supplementary Protocols 11–13.
Stage 2A: processing gels for the standard alkaline comet assay (day 1) ● Timing ~2–24 h (depending on the number of samples and the lysis time used)
Prepare materials
-
4
Immerse the required number of LMP agarose aliquots in boiling water to melt the agarose, and then cool to 37 °C (in water bath or thermoblock).
▲CRITICAL STEP LMP agarose should be mixed with cells at physiological temperature (i.e., ~37 °C) to prevent the artifactual generation of DNA damage.
-
5
Precool the centrifuge to 4 °C.
-
6Prepare standard lysis solution according to option A, or option B for fish samples (blood, liver and gills) and 3D skin models, or option C for human buccal cells (100 mL lysis solution are needed for a Coplin jar that can hold 16 slides):
- Standard lysis solution:
- To 99 mL of lysis stock solution (4 °C) add 1 mL of Triton X-100, and mix, put into a Coplin jar and store at 4 °C until use.
- Lysis solution for fish samples and 3D skin models:
- To 89 mL of lysis stock solution (4 °C) freshly add 10 mL of DMSO and 1 mL of Triton X-100, and mix.
- Lysis solution for human buccal cells:
- Buccal lysis solution 1: add 10% DMSO and 1% Triton X-100 to buccal lysis solution, and keep at 4 °C.
-
Buccal lysis solution 2: add 10% DMSO and 1% Triton X-100 to buccal lysis solution, and adjust pH to 7 (optimal condition for the activity of Proteinase K); pre-warm to reach 37 °C. Just before transferring the slides, add proteinase K to a final concentration of 30 µg/mL.▲CRITICAL STEP When working with whole blood, buffy coat, tissues or similar samples that may still contain hemoglobin, add 10% DMSO to the lysis solution to prevent artifactual DNA damage associated with the iron released during lysis from erythrocytes present in blood.
-
7
Place a metal chilling plate on ice in a box, or use a commercially available slide chilling plate.
-
8
Label the slides on the frosted end using a pencil or a diamond pen.
Embedding cells in LMP agarose and cell lysis
-
4(Optional) If starting from an aliquot of frozen cells (Step 3):
- Thaw the aliquot of cells quickly at 37 °C (in water bath or thermoblock)
- As soon as the aliquot is thawed, add 1 mL of cold (4 °C) PBS to the 1.5 mL microtube and centrifuge for 5 min at 150–300g at 4 °C to wash cells
- Suspend cell pellets in cold PBS, centrifuge again and remove the supernatant before proceeding to Step 10
-
5Either resuspend the cells/nuclei in PBS and mix them with LMP agarose as suggested in Table 3 (option A) or mix the cell pellet directly with LMP agarose (option B).
- Embedding a suspension of cells:
- Mix LMP agarose with the cell suspension by pipetting gently up and down while avoiding the introduction of air bubbles, according to instructions in Table 3. For example, for cultured cells, take 45 µL of the cell suspension (~1 × 10⁶ cells/mL) and mix with 105 µL of 1% LMP agarose at 37 °C, resulting in a final concentration of 0.7% LMP agarose. This option is often used when working with a large number of samples, so that cells can be kept on ice until use.
- Embedding a cell pellet:
-
Disperse the pelleted cells by mixing with the required volume of LMP agarose at 37 °C by pipetting up and down (or tapping the bottom of the tube vigorously) to reach a concentration of 2 × 10⁵ cells/mL, or the concentration specified in Table 3.▲CRITICAL STEP See modifications for using high-throughput formats with mini-gels in Supplementary Protocols 3 and 4.
-
-
6
From each LMP agarose–cell suspension, transfer two 40–75 µL drops to each precoated microscope slide. In the case of amphibian samples, 250 µL drops are used. For specifications per sample type, see Table 3.
-
7
Cover gels with 20 × 20 mm coverslips.
▲CRITICAL STEP It is important to work fast, to avoid gels solidifying before the coverslip is put on. When covering the gels with coverslips, it is important to avoid bubble formation.
-
8
Keep for 5–10 min at 4 °C or place on a metal plate on ice for ~5 min.
▲CRITICAL STEP Sometimes an extra layer of LMP agarose is applied to achieve a flatter gel and remove bubbles that may have occurred accidentally in the first layer. In the case of whole body squashing of zebrafish embryos, additional LMP agarose is applied to fixate the squashed embryo. However, this additional layer should not be included when planning to perform an enzyme incubation step, as it will limit the movement of the enzymes through the gel to reach the nucleoids.
-
9Carefully remove the coverslips and perform standard lysis according to option A, or use option B for lysis of human buccal cells.
- Standard lysis:
- Place slides in standard lysis solution for at least 1 h in a Coplin jar or any other container at 4 °C in the dark.
- Lysis of human buccal cells:
- Place slides in buccal lysis solution 1 for at least 1 h at 4 °C in the dark.
- After this first lysis step, add proteinase K (final concentration 10 mg/mL) to the prewarmed (37 °C) buccal lysis solution 2.
- Transfer the slides to the second buccal lysis solution and incubate for 1.5 h, maintaining a temperature of 37 °C.
▲CRITICAL STEP When working with whole blood, especially fresh blood, we advise incubating the slides for 24 h to ensure lysis of all the erythrocytes, resulting in slides with much cleaner gels than after only 1 h lysis. Three-dimensional skin models also require overnight lysis. To split experiments over 2 d, the specimens can stay in lysis solution overnight, with no detriment to their integrity.
▲CRITICAL STEP After lysis, any excess lysis solution can be removed by gently placing the longer edge of the slides against a paper towel, or the slides can be washed briefly using cold (4 °C) PBS before alkaline treatment. Washing of the slides after lysis is necessary in the case of subsequent incubation of nucleoids with enzymes (enzyme-modified comet assay; Stage 2B, Step 20), where the presence of lysis solution could interfere with enzyme activity.
■PAUSE POINT Slides can be left in lysis solution for a period between 1 h and 48 h. Longer lysis periods can be applied, but it is advised to leave them no more than 1 week. The duration of lysis should be kept identical within a set of experiments.
? TROUBLESHOOTING
Stage 2B: processing gels for the enzyme-modified comet assay (day 1) ● Timing ~2 h Prepare materials
-
4
Prepare two slides per sample (one slide to incubate with reaction buffer and one slide to incubate with the enzyme), and lyse the cells as outlined in Stage 2A. If different buffers/enzymes will be used, extra slides should be prepared.
-
5
Place a metal tray or plate on a box of ice.
-
6
Prepare a humidified chamber/box in a 37 °C incubator, containing suitable racks above water to ensure humidity, without the slides getting wet. Alternatively, use a slide moat at 37 °C.
-
7
Thaw aliquots of working solutions of the lesion-specific enzymes of interest on ice.
-
8
Dilute an aliquot of the 10× reaction buffer B or N in water to 1× working solution. Alternatively, thaw or prepare the reaction buffer specific for the enzyme that will be used.
Detection of specific DNA lesions
-
4
Wash slides in buffer B or N or another reaction buffer, three times for 5 min at 4 °C (using a Coplin jar or another container).
-
5
Place slides on a metal plate on ice to prevent premature incision activity when the enzyme is added.
-
6Prepare enzyme solutions, using the optimal enzyme concentration determined by the titration experiments (‘experimental design’), and control solutions for the incubation reaction. For a two gels/slide format, it is advised to prepare at least 250 µL of enzyme mixed with incubation reaction buffer. If using Fpg, hOGG1, EndoIII, Udg or hAAG, follow option A. If applying enzyme T4endoV, follow option B. Table 2 provides recommendations on final enzyme concentrations that can be applied for the incubation.
- To detect Fpg-, hOGG1-, EndoIII-, Udg- or hAAG-sensitive lesions
- Mix an aliquot of the enzyme with the required volume of reaction buffer B, to achieve the final concentrations based on your own titration experiments.
- Prepare a control solution (i.e., buffer B or a buffer provided with the enzyme).
- To detect T4endoV-sensitive sites
- Mix an aliquot of the enzyme with the required volume of reaction buffer N, to achieve the final concentrations based on your own titration experiments.
- Prepare a control solution (i.e., buffer N or a buffer provided with the enzyme).
▲CRITICAL STEP Keep enzyme and control solutions on ice during Steps 18–23.
▲CRITICAL STEP Enzyme reaction buffers provided by enzyme suppliers can also be used.
▲CRITICAL STEP In case glycerol is used in the enzyme storage buffer (e.g., buffer B with 10% glycerol), it may be important to match its concentration in the control solution.
-
7
Add 50 µL of the enzyme or control solution to each gel (containing nucleoids of samples, experimental controls or assay controls; Fig. 1). Incubate duplicate aliquots of each sample (i.e., two gels incubated with enzyme and two gels with control solution).
-
8
Cover gels with coverslips (22 × 22 mm for each gel or 24 × 60 mm to cover both gels).
-
9
Incubate at 37 °C in a humidified chamber/box in the incubator or slide moat for the required time. The incubation time is generally 30 min but needs to be tested/optimized (‘Experimental design’ and ‘Reagent setup’). For incubation reactions using 12 gels/slide or other high-throughput formats, see Supplementary Protocols 3 and 4.
▲CRITICAL STEP It is important to keep the slides moist during the incubation to prevent gels from drying out. Alternatively, enzyme incubations can be performed in a bath, where microscope slides are fully immersed in an enzyme solution, and a second set in the control solution.
-
10
After the incubation of the gel-embedded nucleoids with the enzyme(s)/control solution(s), place slides immediately on ice to stop the reactions.
-
11
Keep on ice and carefully remove the coverslips just before alkaline treatment.
-
12
? TROUBLESHOOTING
Stage 3: comet formation (day 1) ● Timing ~3 h (including washing steps)
Alkaline treatment and electrophoresis
Transfer the microscope slides directly to the electrophoresis tank containing electrophoresis solution. Avoid direct light.
-
Incubate in cold (4 °C) electrophoresis solution in the tank for 20–40 min at 4 °C in the dark, while keeping the power supply switched off; alternatively, perform the alkaline treatment in a separate Coplin jar, placing the slides in the tank just before electrophoresis.
▲CRITICAL STEP 4 °C conditions can be obtained in several ways: by putting the system in the fridge at 4 °C, by placing the tank on ice, by working in a cold room or by having a tank with a cooling system. If doing alkaline treatment in a Coplin jar (or another container), this can be placed at 4 °C. Variation in the temperature may occur between labs; the temperature should be kept constant for all experiments and should not be >10 °C.
-
Electrophorese at ~1 V/cm for ~20 min at 4 °C (EPT ~20).
▲CRITICAL STEP Cells from 3D lung models require an EPT = 30 (1 V/cm for 30 min). For instructions for yeast and filamentous fungi and plant cells, respectively, see Supplementary Protocols 11 and 12.
▲CRITICAL STEP To ensure an accurate calculation of the voltage gradient, the voltage across the platform should be measured using a voltmeter. Alternatively, an approximate measure can be obtained by dividing the applied electrode voltage by the distance between the electrodes. Please see ‘Equipment setup’.
▲CRITICAL STEP When possible, samples from the same experiment together with corresponding controls (negative, solvent and positive) should undergo the same electrophoresis run. When a large number of samples need to be analyzed, use interassay controls in each electrophoresis run.
Neutralization and washing
-
4
Neutralize gels by washing slides in the neutralizing solution, in cold (4 °C) PBS for 10 min or cold (4 °C) 400 mM Tris–HCl (pH 7.5) three times for 5 min. Afterwards, wash slides (optional) for 10 min in cold (4 °C) dH2O (use a Coplin jar, or lay slides flat in a dish).
▲CRITICAL STEP It is advisable to wash the slides with dH2O after the neutralization (i.e., after washing with PBS/Tris–HCl), before drying the gels (optional).
-
5
(Optional) Allow gels to air dry overnight, or dehydrate them by immersing them in 70% and subsequently 96–100% EtOH for 5–15 min and then let them air dry. Alternatively, EtOH can be gently added on top of the gels using a Pasteur pipette. Before each EtOH addition, remove previous EtOH by slowly leaning the tray with slides to one side.
▲CRITICAL STEP Dry slides facilitate the scoring since comets in dry slides are in the same plane in the gel.
■PAUSE POINT Dried gels/slides can be stored in the dark at RT for years. Usually, slides are stained and scored immediately. Alternatively, they can be stored unstained in dark until analysis for months. Stained slides can also be stored and restained before scoring or rescoring.
Stage 4: comet visualization and analysis (day 2) ● Timing ~2 h to several days (depending on the number of samples)
Comet visualization
-
4
Stain gels with DNA fluorescent dye (‘Reagents’). When using dyes that allow direct visualization, follow option A. For dyes that require a longer incubation time, follow option B.
▲CRITICAL All the following steps should be performed away from direct light, since the DNA fluorescent dyes are light sensitive.
! CAUTION All dyes may be mutagenic, apart from GelRed. Wear protective gloves when using them, and dispose waste in containers labeled for hazardous chemicals.- Use of dyes for direct visualization
-
For staining with EtBr (10 µg/mL in water) or DAPI (1 µg/mL in water), add 20–40 µL of staining solution to each gel, and cover with a coverslip.▲CRITICAL STEP It is advisable to wash the excess of EtBr by immersing the slides in Tris––HCl (0.4 M Tris–HCl, pH 7.5) before covering them with coverslips.▲CRITICAL STEP It is advisable to incubate the gels for 20 min at RT when DAPI is used. DAPI cannot be used with GelBond films owing to autofluorescence of the GelBond at the wavelengths used to detect DAPI.
- If using GelRed, dilute the GelRed stock (10,000× in water) 1:3,333 in water, add 20–40 µL to each gel and cover with a coverslip.
-
- Use of dyes requiring longer incubation times
- For staining with SYBR Gold or SYBR Green, which give intense fluorescence, immerse slides in a bath of the dye at a dilution of 1:10,000 in TE buffer for 20 min, followed by two 10 min washes with dH2O. Alternatively, dilute SYBR Gold 1:10,000, add 50 µL on top of each gel and cover with a coverslip (in this case, skip Step 33B(ii)).
- Allow slides to dry (up to overnight). Immediately before viewing, add 20 µL of dH2O to each gel and cover with a coverslip.
-
5
Visualize comets with a fluorescence microscope using appropriate filters.
■PAUSE POINT Stained gels can be stored overnight in the dark at RT and hydrated before scoring them the following morning.
Comet analysis
-
4
Score at least 50 comets per gel, i.e., 100 comets per slide/sample when working in duplicates (or 100 comets if using only one gel). The OECD guideline for the in vivo comet assay advises to score 150 comets per sample.
-
5
Assess the level of DNA damage by means of image analysis software (option A) or visual scoring (option B).
▲CRITICAL All slides, including those of the negative/positive and assay controls, should be independently coded before microscopic analysis and scored without knowledge of the code. Within one study, one set of experiments or a trial, all comets should be scored by the same person to minimize interoperator variations using the same software for the entire experiment/trial. Score the comets in gel in a logical and methodical way. The usual start point is in the top left of the gel, then score across the gel to the top right and adjust the stage so you are viewing comets slightly below the ones you just scored, staying on the right side of the gel. Journey back across the gel to the left side. Then, continue moving back and forth across the slide, getting further and further towards the bottom of the gel. Continue until you have scored the required number of comets. This helps to avoid scoring a single comet multiple times. Comets near the edges of the gel should not be scored as they may appear distorted (this could be due to the drying effect on the gel on the microscope slide). The same advice should be followed if you have any other imperfections in the gel, such as cracks or bubbles.- Using image analysis software
-
Obtain the TI (i.e., percentage of DNA in tail) values per sample using the image analysis system by first calculating the median TI for each gel over the scored comets (i.e., the 50 comets in each gel) and then the mean TI over the replicate gels. Alternatively, the median of the 100 comets can also be used.▲CRITICAL STEP It is possible to use other central estimates of nonnormal distribution of comets, or arithmetic mean. All estimates are highly correlated, and using one or the other has minimal practical implications because the statistical inference is based on differences between samples and not individual comets in the same sample. However, the same type of central estimate should be used for all samples in the same experiment.▲CRITICAL STEP Comet analysis by using fully automated image analysis systems omits interoperator heterogeneity in scoring. However, bias related to omission of unmeasurable comets is a concern for analysis by fully automated image analysis systems. The risk of biased analysis by automated image analysis systems can be inferred by comparing the ratio of measured/total objects (i.e., a decreased ratio should alert the investigator to the risk of measurement bias).
-
- Using visual scoring
-
Assess DNA damage from comets by discriminating between the degrees of damage according to comet appearance (Fig. 13). Scoring comets using the classification system composed of five classes, from 0 (no tail) to 4 (almost all DNA in tail) results in sufficient resolution229. If 100 comets are scored, and each comet is assigned a value of 0–4 according to its class, the total score for the sample gel will be between 0 and 400 ‘arbitrary units’.? TROUBLESHOOTING
-
Fig. 13 |. Representative images of comets classified in five different classes for visual scoring.
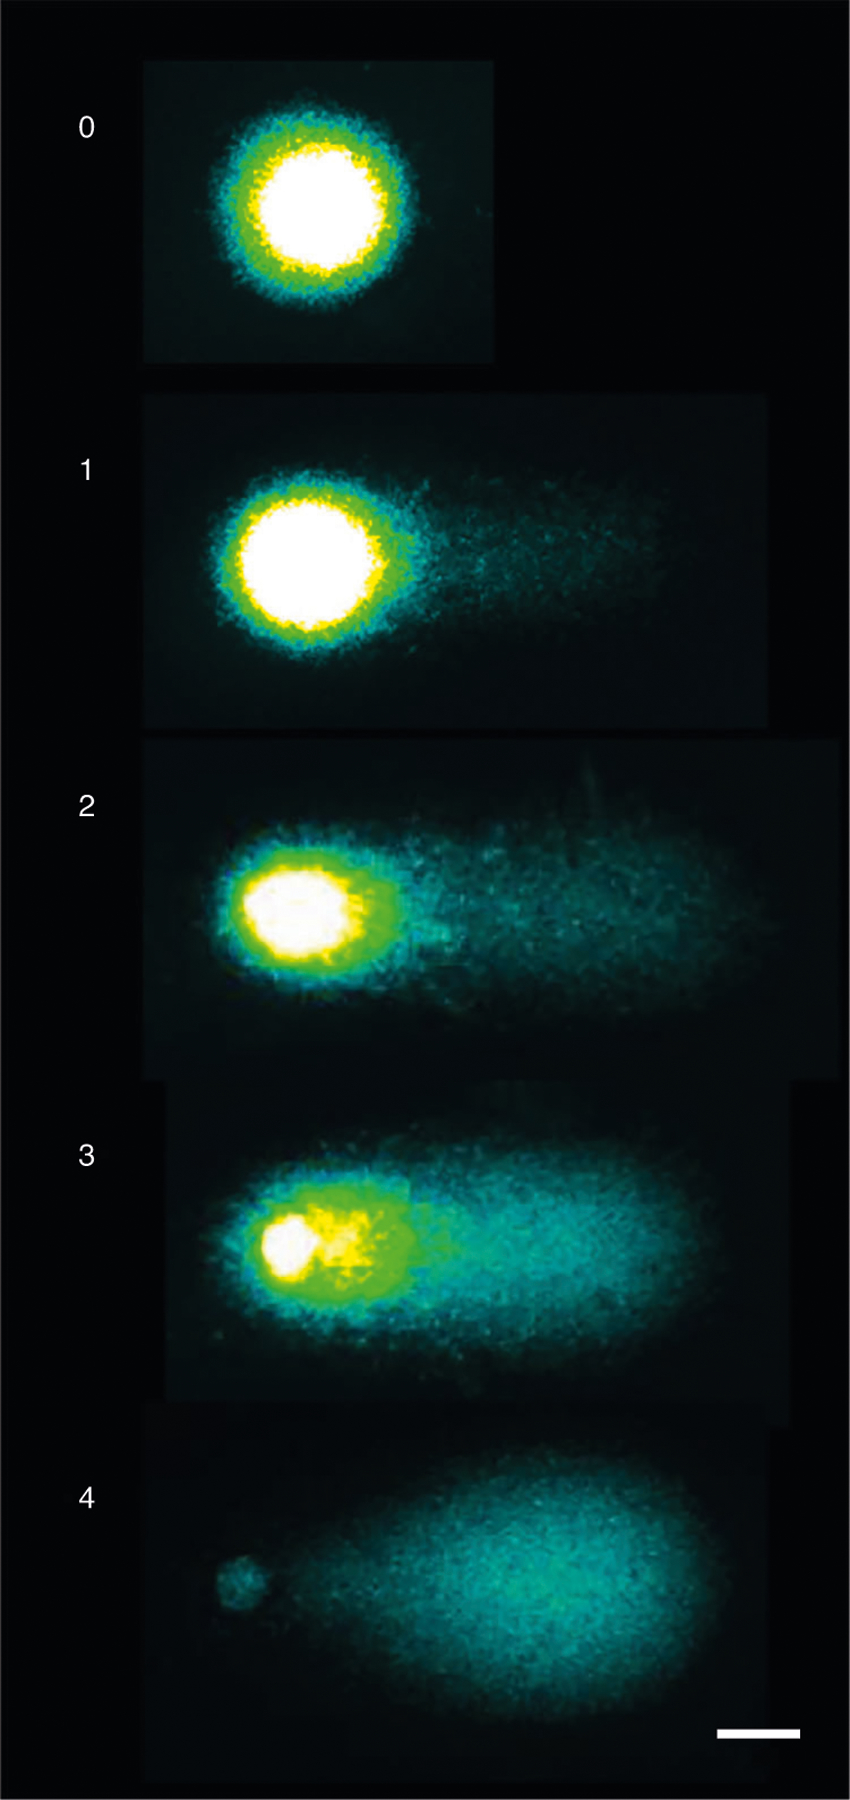
0 (no tail), 1, 2, 3 and 4 (almost all DNA in tail; sometimes described as a hedgehog). The colorectal cancer cell line HCT116 was used to obtain the images. Scale bar, 20 μm.
Troubleshooting
Troubleshooting advice can be found in Table 4.
Table 4 |.
Troubleshooting table
| Step | Problem | Possible reason | Solution |
|---|---|---|---|
| Experimental design | High interassay variation | Alterations in RT, equipment performance, reagent lots, etc | Use internal controls and create own historical data to identify and control variability |
| Equipment setup: precoating microscope slides | Agarose does not attach to the slides | Presence of grease and dust on the slides | Degrease the slides by washing them with EtOH. Leave them to dry at RT or pass the slides through the flame of a Bunsen burner |
| Agarose is not mixed well | Ensure agarose is fully dissolved before coating slides (see instructions in ‘Equipment setup’) | ||
| 14 | Loss of gels while removing the coverslip | Gels may not set properly because of condensation in rooms with high temperature and/or humidity | Cool the working room, ideally to ~20 °C. Embedding cells in gels in an air-conditioned room is a good option. You can also provide direct airflow from a heating fan over the slides |
| Use of slides with charge | Use recommended slides (‘Equipment’) | ||
| Agarose concentration is too high, not well mixed or gels are too thin | Mix agarose well | ||
| 27 | Loss of gels during the enzyme incubation at 37 °C | Gels may be weakened by being at 37 °C, causing them to detach when the coverslips are removed for the next step | Cool the slides very quickly before removing the coverslips after enzyme incubation. Consider increasing the agarose concentration |
| 34 | Too many or too few cells in the gel | It can be due to several reasons depending on the biological material use Cells in suspension: wrong counting or bad isolation (e.g., MNCs) Organoids or solid tissues: incorrect size of the portion used to obtain the cell suspension |
Optimization in the number of cells, isolation process or size of the solid tissue to use is recommended before starting the experiments (‘Experimental design’) |
| No increase in DNA migration in the enzyme-incubated positive control cells compared with buffer-incubated cells | Enzyme used after expiration date or subjected to variations in storage temperature | Check the expiration date, or use a cooler block when the enzyme is out of the freezer. Aliquot enzyme in appropriate concentration to prevent multiple freeze–thaw cycles | |
| Comets cannot be scored owing to high background on slides | The presence of dust or other impurities in agarose | Prepare new agarose solution and/or slides | |
| Contamination of agarose solution with mold | |||
| Reused slides | |||
| Low levels of DNA damage in positive controls | Problems with electrophoresis Improper setting of the image analysis software and/or low intensity of fluorescence in the microscope |
Check the power supply Adjust the software according to the manufacturer’s instructions. Change the bulb in the microscope |
|
| Supplementary Protocol 3 | Comet tails are oriented in all directions at the edge of mini-gels | Uneven drying of the mini-gels | Take care to dry the gels using EtOH immediately after the neutralization. Dehydration is crucial to avoid this edge effect |
| Supplementary Protocol 4 | Few cells loaded into the microwells of the CometChip | Excessive rinsing of unloaded cells might lead to loss of cells embedded in the microwells | Reduce the intensity of the PBS rinse step by tilting the chip and slowly pipetting 5 mL of PBS across the top macrowells Use vacuum around the macrowells to remove excess cells |
| Supplementary Protocol 11 | Variability in the levels of DNA damage among cells | Incomplete cell lysis | Lyse and digest samples on slides with proteinase K (0.5 mg/mL) and reduced glutathione (2 mg/mL) for 15 min at RT |
Timing
Day 0 or 1
Steps 1–3, Stage 1: preparation of cells from frozen or fresh samples: 0.5–3 h (depending on the cell type and the number of samples)
Day 1
Steps 4–14, Stage 2A: embedding cells in LMP agarose and cell lysis: ~2–24 h (depending on the number of samples and the lysis time used)
Steps 15–27, Stage 2B: optional extra steps for enzyme-modified comet assay: ~2 h Steps 28–32, Stage 3: comet formation: ~3 h (including washing steps)
Day 2
Steps 33–36, Stage 4: comet visualization and analysis: ~2 h to several days (depending on the number of samples)
Anticipated results
The comet assay can detect between ~50 and ~10,000 lesions per cell24. It should be emphasized that the primary comet assay descriptors are merely proxy measures of the true level of DNA damage; therefore, the actual percentage of tail DNA depends on the assay conditions, in addition to the amount of damage present. As a rule of thumb, the level of SBs should not exceed 10% tail DNA (or TI) in unexposed cells and tissues.
Cell death is a problem in all genotoxic assays because it is associated with degradation of DNA and so adds to the DNA damage caused directly by the genotoxic exposure. It has been demonstrated that cell death after exposure to nongenotoxic detergents produced comets with >90% tail DNA and shapes of comets that are commonly described as ‘hedgehogs’, ‘clouds’ or ‘ghosts’333. However, the effect of cell death (or apoptosis) decreases with less severe exposure conditions. It has been shown that the presence of >25% dead cells, assessed by the Trypan blue assay, results in an increase of the mean level of DNA migration in the comet assay334. Thresholds of cytotoxicity and cell death reported in the literature are usually between 20% and 30%. However, there are no gold standard method(s) that can be recommended for the evaluation of cytotoxicity, and there is considerable uncertainty about the validity of a threshold of viability for reducing biases due to cell death7. The effect of cytotoxicity on comet assay endpoints should be assessed by a case-by-case approach rather than by adopting a predetermined threshold; cytotoxicity assays may be test system specific, and they measure different types and severity of the toxicity endpoints. In addition, it should be noted that ‘hedgehogs’, ‘clouds’ or ‘ghosts’ do not necessarily represent apoptotic or dead cells333. Thus, omission of such comets is not recommended as a way of avoiding biases due to cell death.
Detection of DNA crosslinks
DNA crosslinking may appear to be nongenotoxic in the standard comet assay. If a compound is suspected to cause DNA crosslinks, it is advisable to confirm this by testing in the DNA-crosslink variant of the comet assay. Figure 14 illustrates the anticipated results from a confirmatory experiment where the increased DNA SB levels by a direct DNA strand breaking agent are lowered when cells are treated with the suspected crosslinking agent as compared with the control exposure with the DNA strand breaking agent only36,335.
Fig. 14 |. Detection of DNA crosslinks in a theoretical cell culture study.
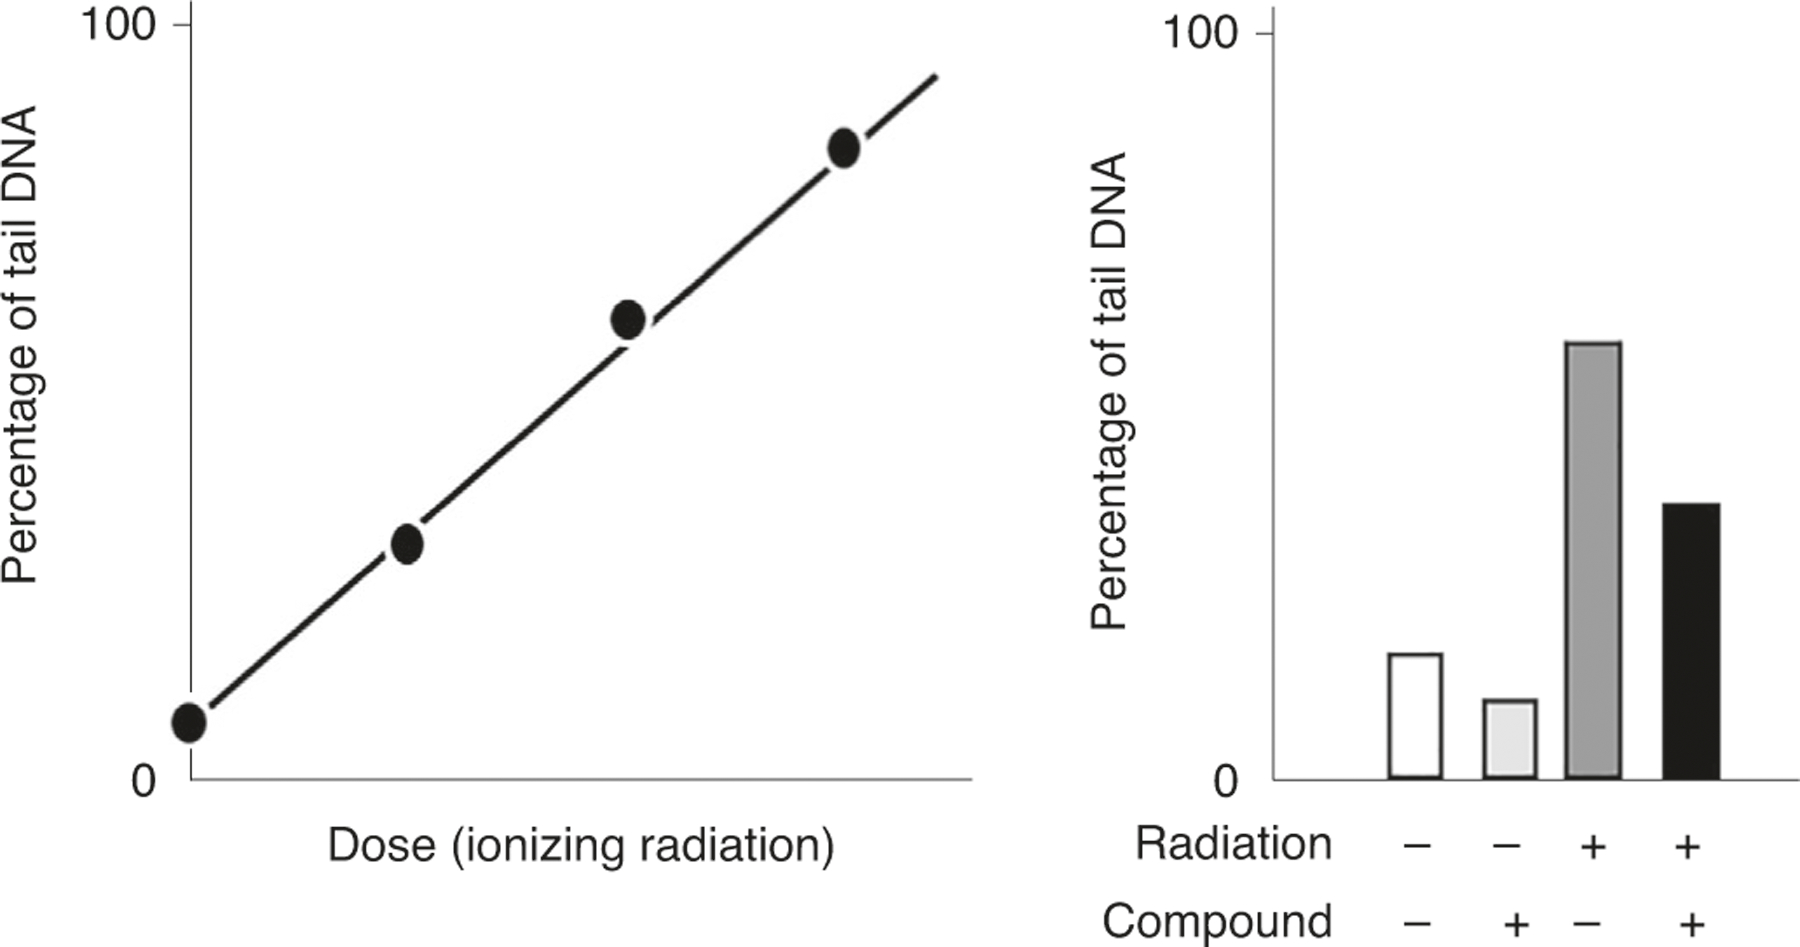
Experiments are first carried out to find a suitable level of DNA SBs, using an agent that directly causes breaks in DNA such as H2O2 or ionizing radiation (left). Subsequently, experiments are done where cells are exposed to the test agent (compound) and ionizing radiation. The presence of crosslinks in DNA is concluded if the irradiated samples plus the tested compound have less DNA migration as compared with the irradiated samples without the tested compounds (black bars compared with gray bars).
DNA SBs formed by repair processes
Certain agents (e.g., UVC) do not produce ALS and SBs, but SBs are generated by excision repair enzymes in the cells68,336. To study such a case, it is advisable to incubate the cells with DNA repair inhibitors that blocks DNA polymerases or other enzymes in the late stage of the excision repair process (e.g., aphidicolin or hydroxyurea/Ara-C). DNA SBs will then accumulate as incomplete repair sites as the cells are incubated with the test compound and DNA repair inhibitors (Fig. 15).
Fig. 15 |. Assessment of DNA lesions by inhibition of late-stage excision repair processes in a theoretical cell culture study.
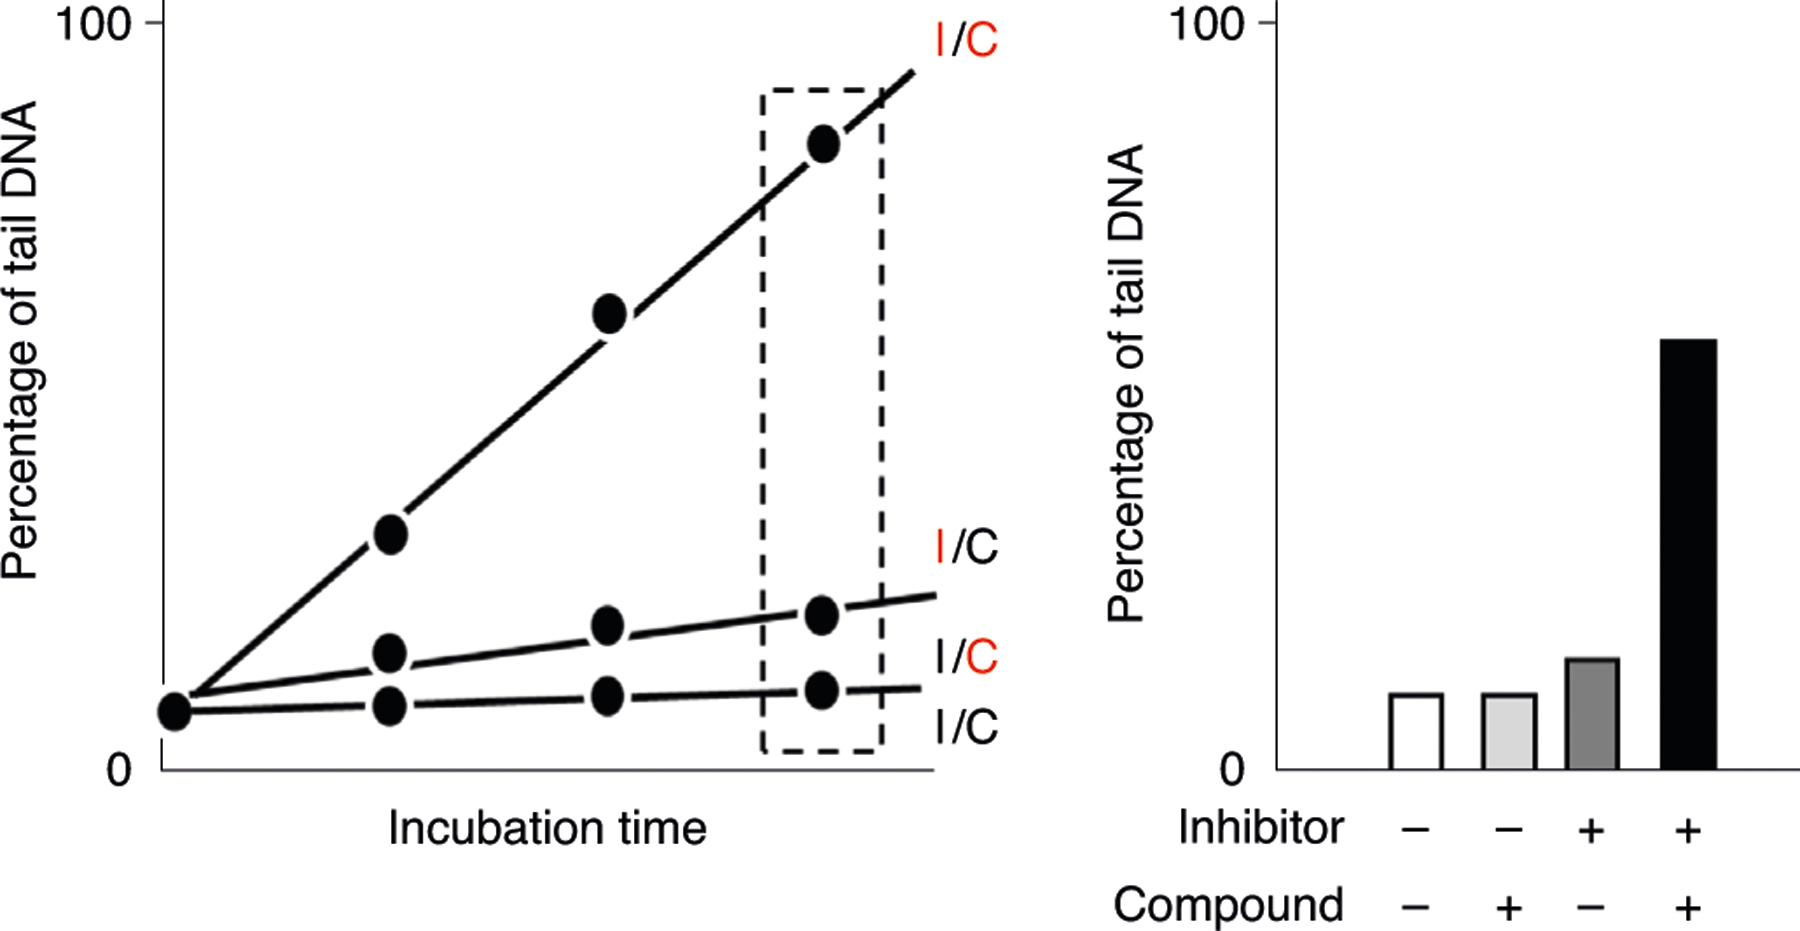
The cells are incubated with the test agent (compound, C) and inhibitor (I) (red letter in the left graph refers to the presence of compound or inhibitor; in case of incubations with I/C-red and I/C the lines overlap). The data included in the dashed box are represented in the bar graph on the right. The effect of DNA repair on the determination of genotoxicity is inferred by the higher level of DNA migration in samples that have been exposed to both the compound and repair inhibitors (right).
Enzyme-sensitive sites
Results from enzyme-modified comet assays should be reported as levels of DNA migration with the corresponding background (no enzyme) subtracted, using the following formula (assuming migration is measured as percentage of tail DNA):
The measurement of enzyme-sensitive sites and global methylation requires an additional step in the comet assay protocol that affects the level of DNA migration. The variability in DNA damage levels between samples is also increased because the experimental variation in the extra step is added to the variation in the standard comet assay; this can be checked by comparing the standard deviations of the standard DNA SBs and those as a result of enzyme-sensitive sites. As a rule of thumb, there should be at least as many oxidatively damaged DNA lesions as DNA SBs in cells/tissues that have not been exposed to a genotoxic agent. The background level of DNA SBs and enzyme-sensitive sites should not be too different, unless there are special circumstances such as cells or tissues from DNA repair knockout variants. However, chemical agents have different mechanisms of action, and it is therefore possible that certain agents cause mainly DNA SBs, while other agents produce mainly enzyme-sensitive sites.
It is very important to understand that the anticipated results from the enzyme-modified comet assay are substantially different from DNA SBs. Figure 16 illustrates the anticipated results of enzyme-sensitive sites, using theoretical data from four different samples. The first two samples are measurements where the level of DNA SBs (i.e., ‘buffer’) differs, whereas the levels of enzyme-sensitive sites are identical. Thus, it is misleading to conclude that the enzyme-modified comet assay shows that sample 2 has a higher level of DNA damage than sample 1 when in fact it only has a higher level of DNA SBs. Samples 3 and 4 illustrate situations where negative values of enzyme-sensitive sites are obtained. It is not biologically meaningful to measure fewer than zero DNA lesions; thus, it is not an option to use enzyme-sensitive sites with negative values. Sample 3 represents a situation where the DNA has no enzyme-sensitive sites; thus, the buffer and enzyme treatment should have had the same level of DNA migration. The experimental uncertainty in the scoring of comets (i.e., results are usually based on analysis of 50–100 images in two gels) can by chance alone result in lower values in enzyme-treated slides than the buffer-treated slides. In this case, it is advisable to set the enzyme-sensitive sites to zero. Sample 4 also has a negative value of enzyme-sensitive sites, but in this example, it is due to a high level of DNA SBs. As the comet assay has a ceiling of 100% tail DNA, there is increasingly less DNA migration left for the determination of enzyme-sensitive sites. In this case, the enzyme-modified comet assay cannot be applied, although reducing the concentration of DNA-damaging agent, if possible, might solve the problem.
Fig. 16 |. Examples of data output of the enzyme-modified comet assay in theoretical samples.
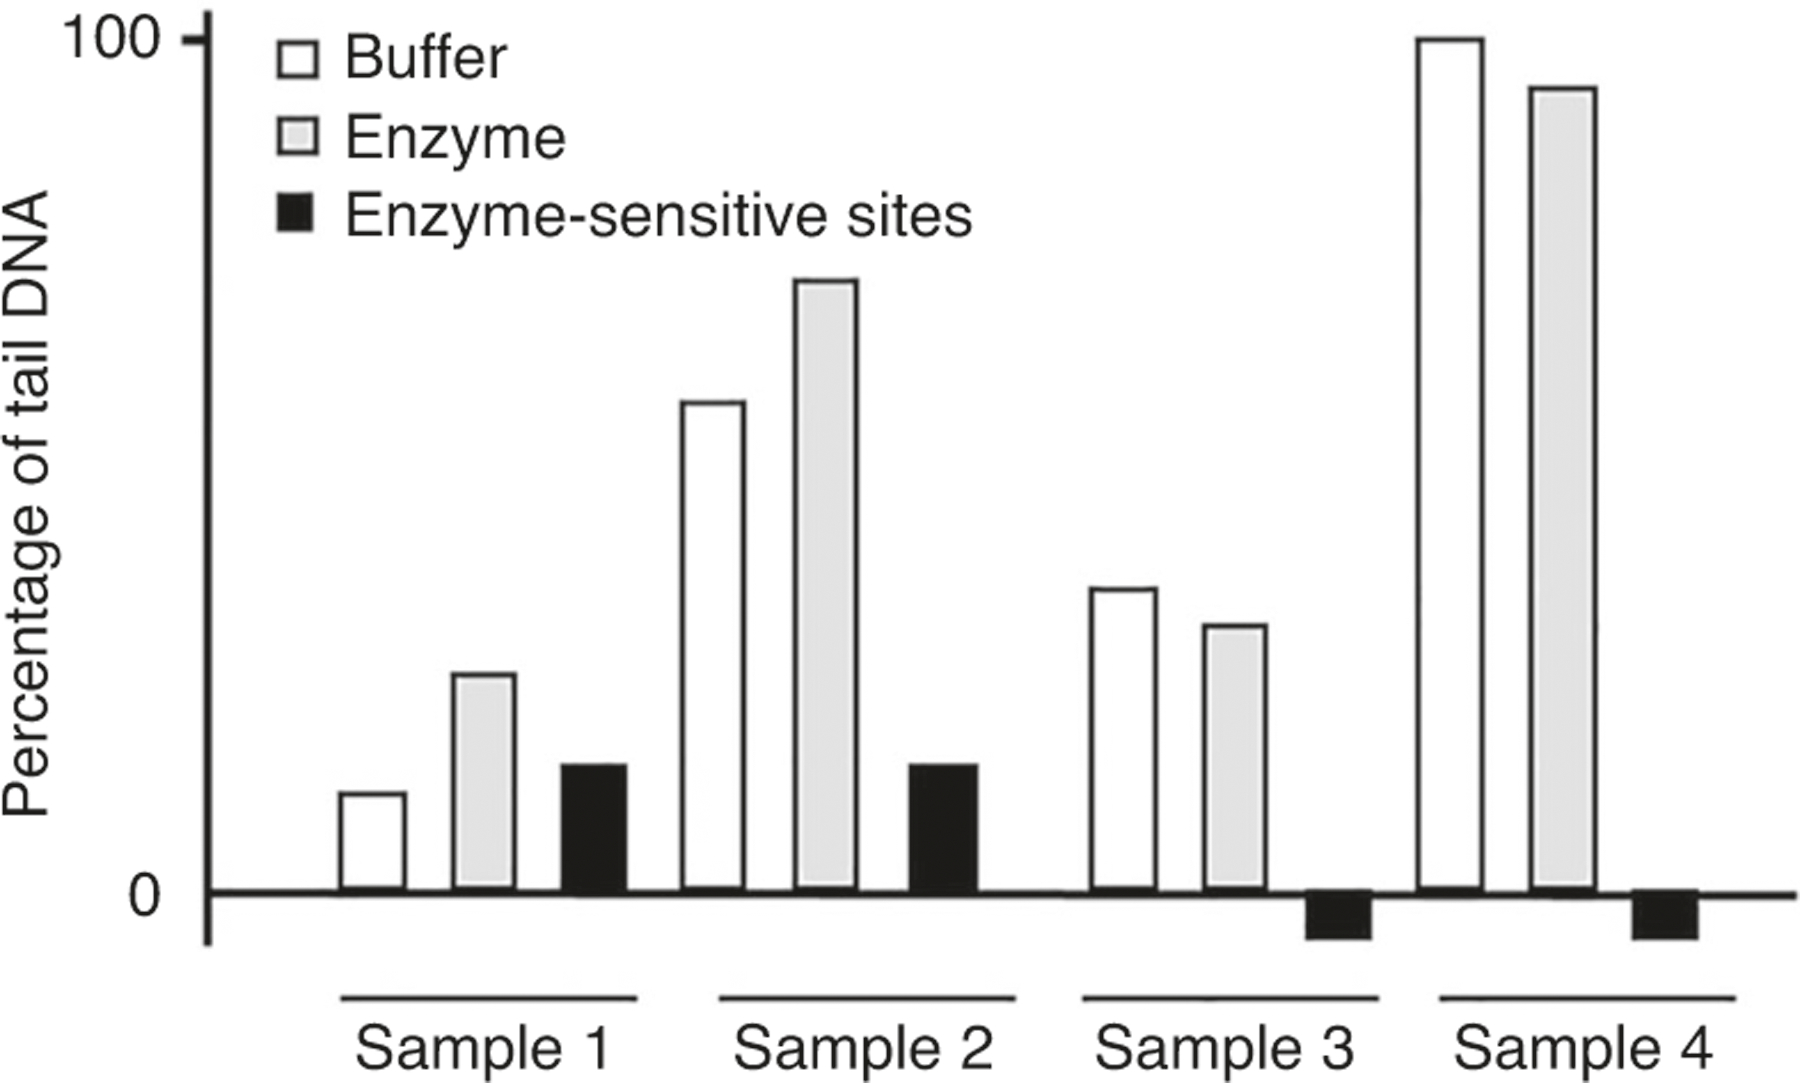
Samples 1 and 2 exemplify two different samples where the levels of DNA SBs differ, whereas the levels of enzyme-sensitive sites are identical. The total level of DNA damage (i.e., ‘enzyme’ treatment) is higher in sample 2 than in sample 1, but interpreting that as a higher level of DNA damage in the enzyme-modified comet assay is misleading. Samples 3 and 4 exemplify two different samples that have few enzyme-sensitive sites, but low or high levels of DNA SBs, respectively. In these samples, the DNA damage level measured by the ‘buffer’ and ‘enzyme’ treatments is identical. Negative values of enzyme-sensitive sites will occur in some samples because of experimental variation in the scoring of comet assay slides. Sample 3 represents a situation with a valid measurement of few enzyme-sensitive sites because the level of total DNA damage is relatively low (i.e., close to 10% tail DNA). In sample 4, the level of DNA SBs is so high that the comet assay is saturated (i.e., DNA migration is close to 100% tail DNA). Therefore, it is not possible for the enzyme treatment to increase the DNA migration, and so enzyme-sensitive levels are underestimated.
Variation in DNA damage levels
The variation in DNA damage in different samples stems from interindividual, intraindividual and technical (assay) variation. The contribution of these sources to the overall variation depends on the type of study. For instance, biomonitoring studies encompass all sources of variation, whereas the latter two are only relevant for cell culture studies (i.e., the variation in different passages of cell cultures is equivalent to intraindividual variation in a biomonitoring study).
In general, a relatively large variation in DNA damage levels by the comet assay should be anticipated. For instance, a systematic review has shown a mean intragroup coefficient of variation in DNA SBs in leukocytes of 36% (95% confidence interval (CI) 27%, 46%) in cross-sectional studies on healthy humans337. Likewise, a systematic review obtained a coefficient of variation of 66% (95% CI 51%, 82%) for Fpg-sensitive sites and 103% (95% CI 56%, 151%) for hOGG1-sensitive sites in leukocytes from healthy humans in cross-sectional studies313.
It should be anticipated that the variation in enzyme-sensitive sites is similar to or higher than the variation in DNA SBs because the variances are additive. It should also be anticipated that assay control samples display some interday variation. This is illustrated in Fig. 17, using results from assay controls from a human biomonitoring study338. The mean and standard deviations of the samples are 0.29 ± 0.14, 0.85 ± 0.35 and 1.43 ± 0.26 lesions per 106 bp DNA SBs in samples that were incubated with buffer, hOGG1 and Fpg, respectively. Note the larger standard deviation in the enzyme-treated samples as compared with the buffer-treated sample.
Fig. 17 |. Levels of DNA migration in assay control samples from a biomonitoring study, encompassing 11 d of comet assay experiments.
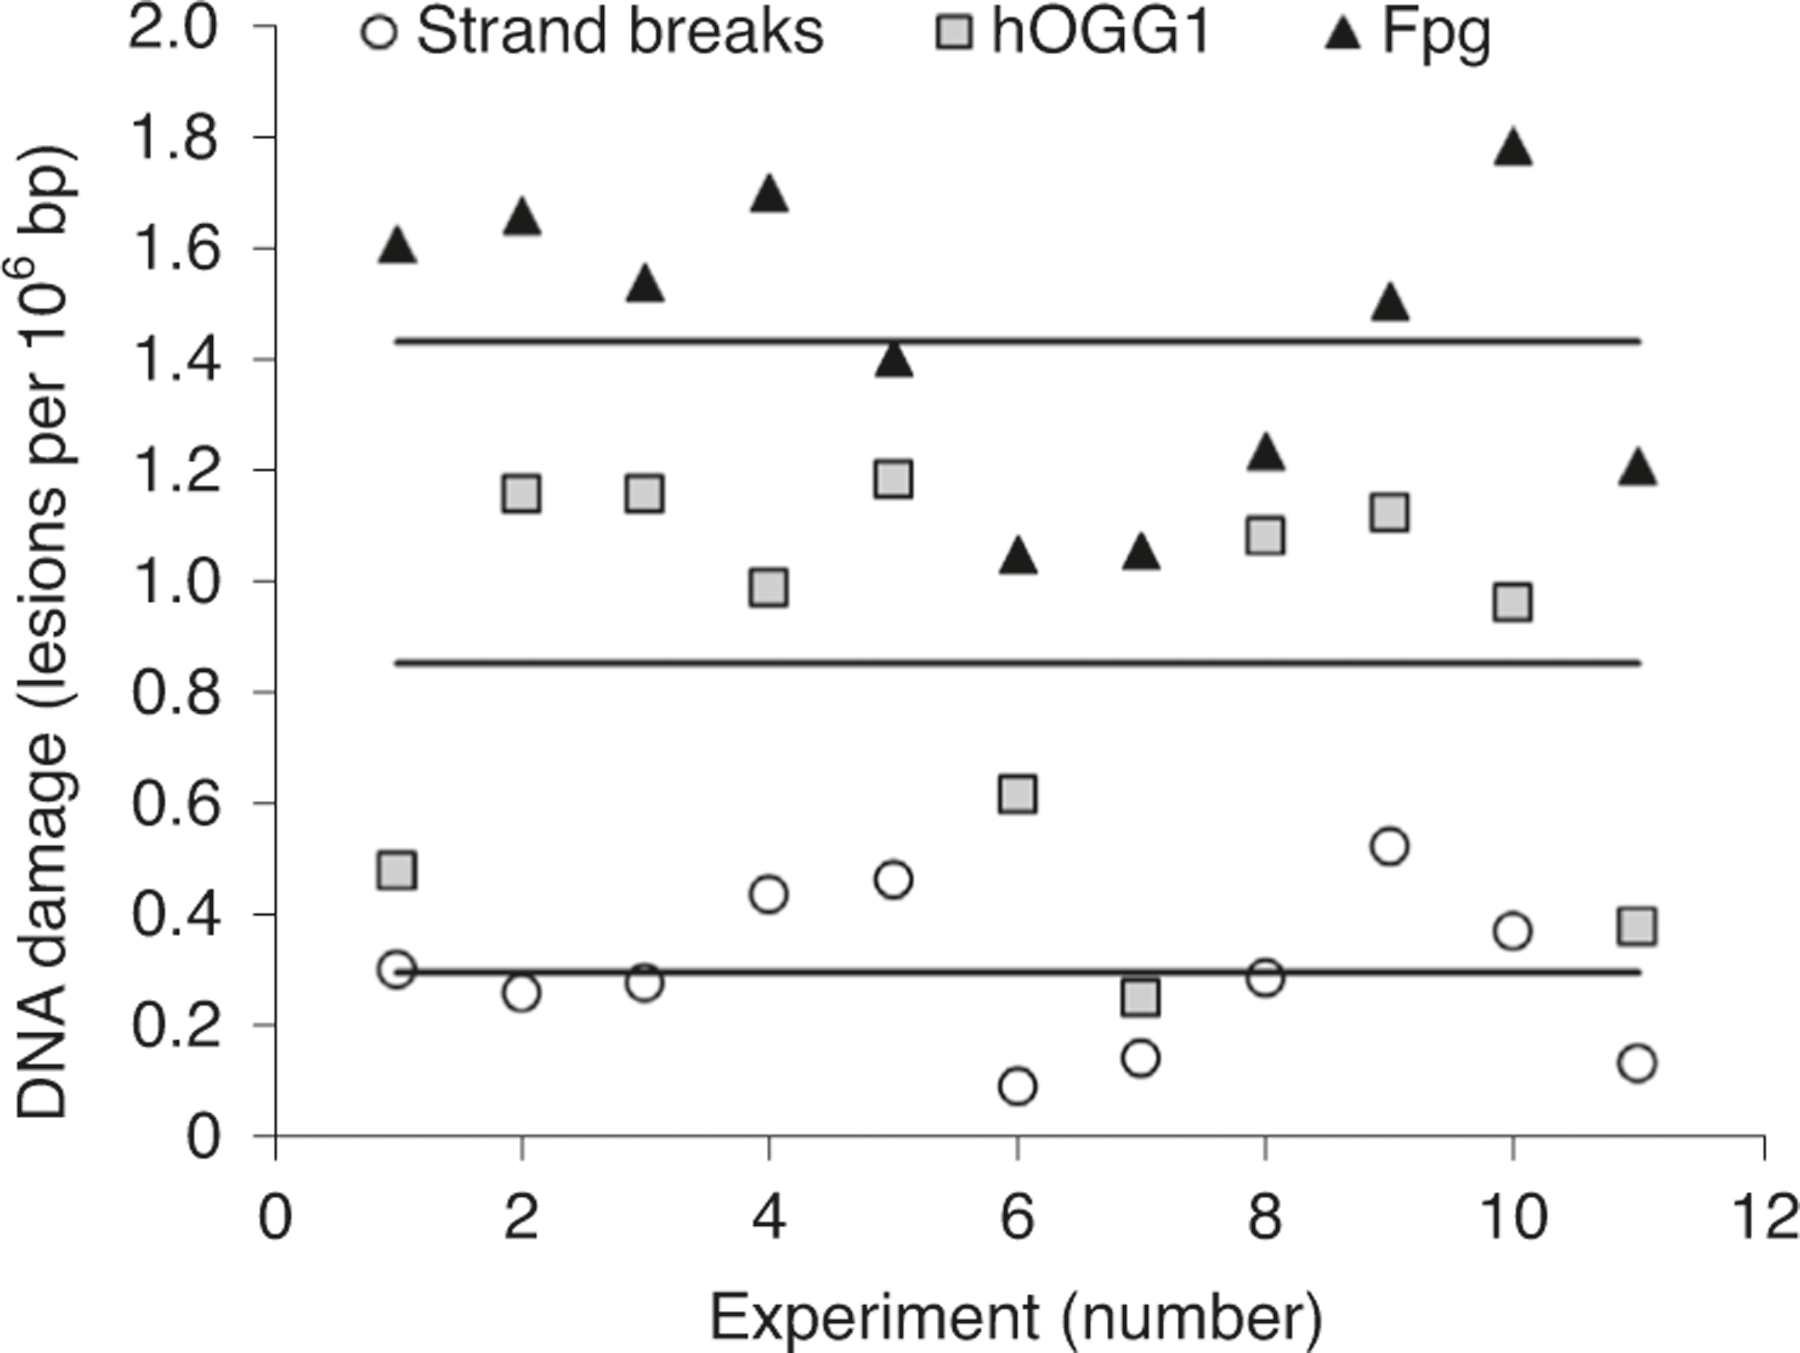
PBMCs were exposed to 1 µM Ro-19–8022 and irradiated for 4 min with white light, and subsequently cryopreserved. The DNA migration is depicted as lesions per 106 bp in samples treated with buffer (i.e., DNA SBs), formamidopyrimidine glycosylase (Fpg) or human oxoguanine DNA glycosylase (hOGG1). Figure adapted with permission from ref. 338, Elsevier.
Lastly, it should be expected that exposure to a genotoxic agent increases both the level of DNA damage and the intragroup variation in biomonitoring, animal and cell culture studies. This is illustrated by the example in Fig. 18 that depicts levels of Fpg-sensitive sites in cells after exposure to a genotoxic agent (i.e., diesel exhaust particles). As can be seen, the DNA damage level increases as the concentration of the diesel exhaust particles increases. The standard deviation also increases as the level of exposure increases (seen as wider error bars in Fig. 18). It is common to obtain a larger standard deviation in treated specimens than in unexposed specimens irrespective of whether the specimens originate from cell cultures, animals or biomonitoring studies.
Fig. 18 |. Example results from a study of Fpg-sensitive sites after exposure to diesel exhaust particles in cultured human HepG2 cells.
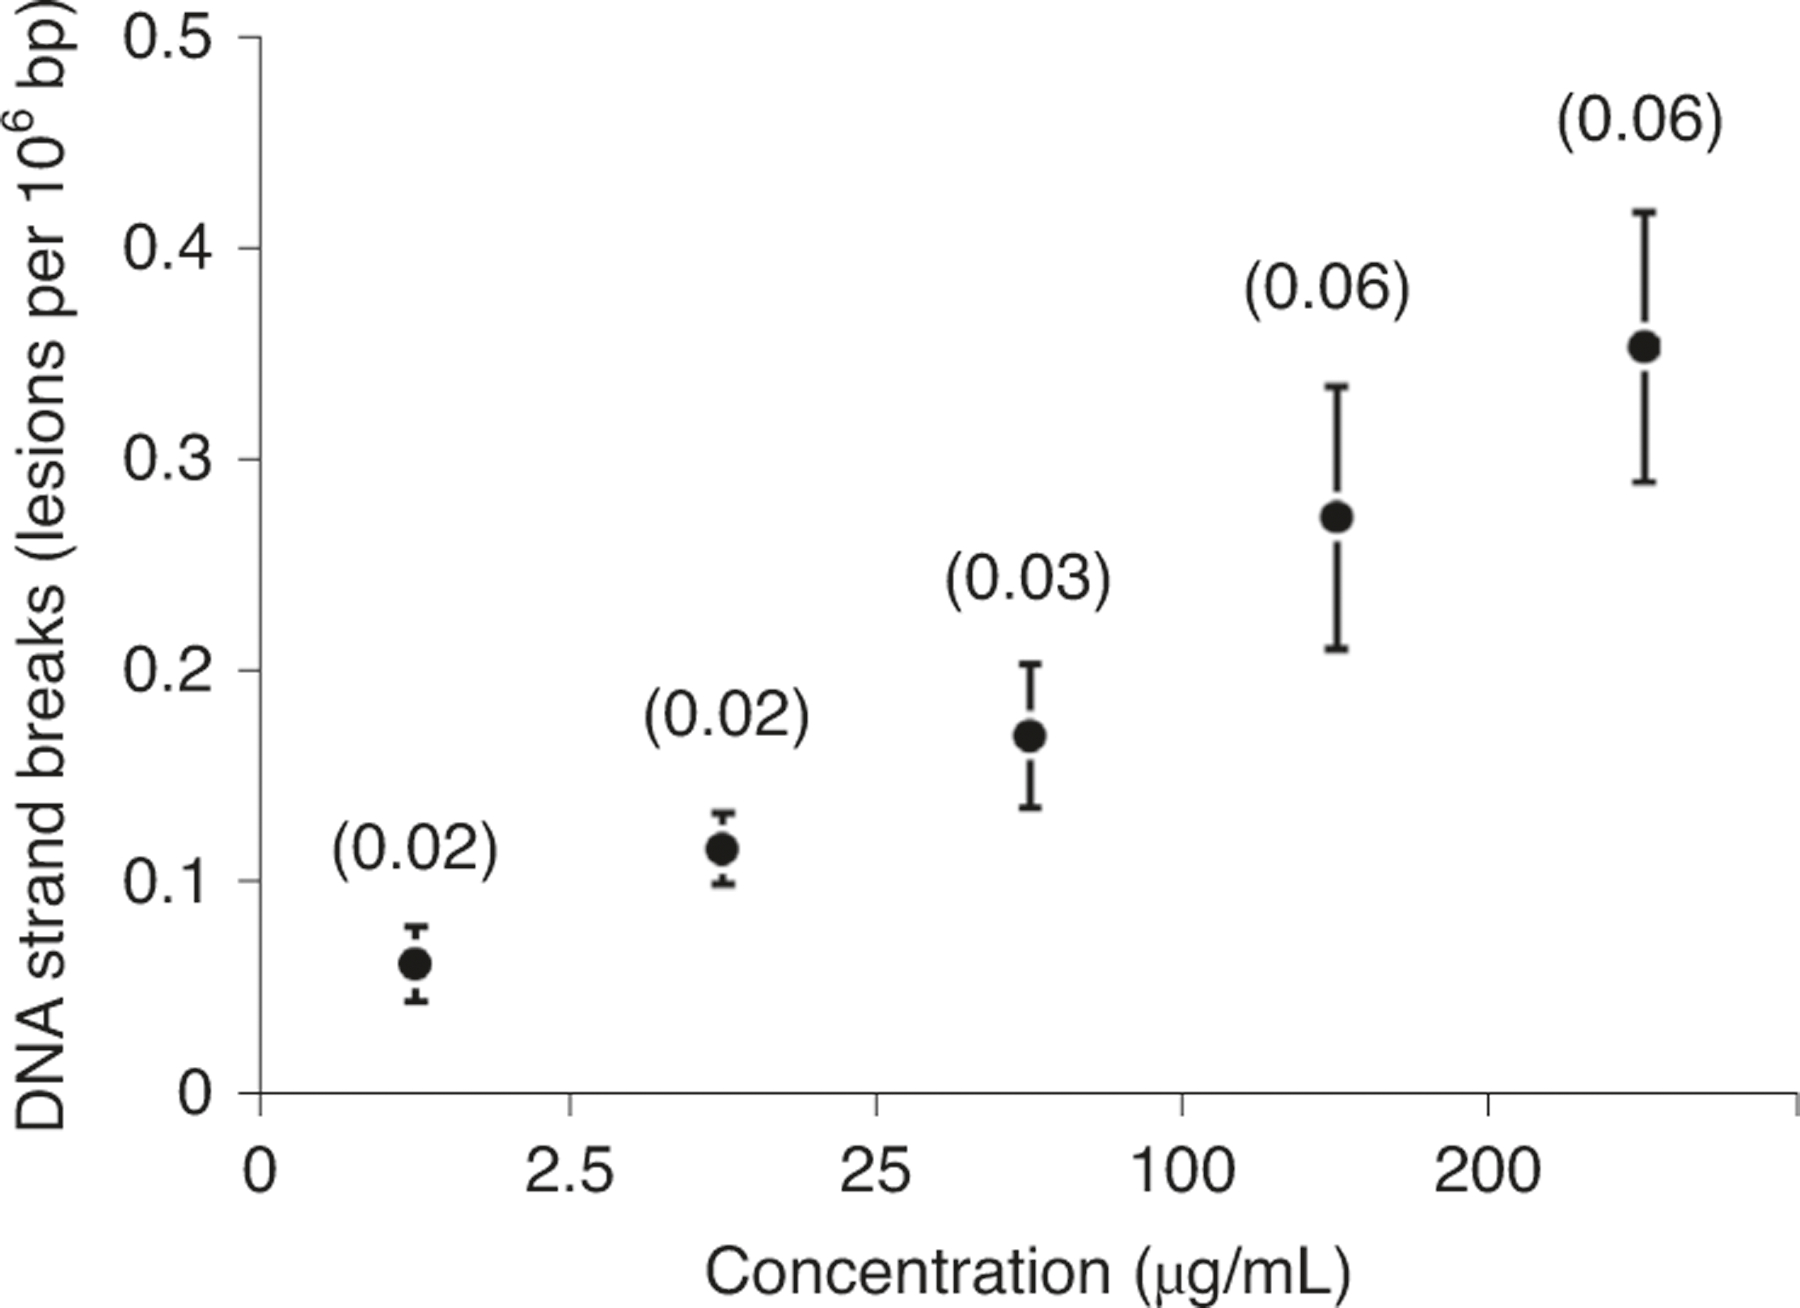
Filled circles and whiskers are mean value and standard deviation, respectively, of six experiments (numbers in brackets are standard deviation). The concentration of diesel exhaust particles is shown on the x axis. Figure adapted with permission from ref. 340, Elsevier.
Supplementary Material
Acknowledgements
We thank the hCOMET project (COST Action, CA 15132) for support. A. Azqueta thanks the Ministry of Science and Innovation (AGL2015-70640-R and PID2020-115348RB-I00) of the Spanish Government. S.G. thanks the national funds (OE), through FCT—Fundação para a Ciência e a Tecnologia (IP, in the scope of the framework contract foreseen in the numbers 4, 5 and 6 of the article 23, of the Decree-Law 57/2016, of 29 August, changed by Law 57/2017, of 19 July) for personal support. V.M.d.A. thanks the National Council of Technological and Scientific Development (CNPq—304203/2018–1) for personal support. D.M. thanks the program ‘Ayudas para la formación de profesorado universitario (FPU)’ of the Spanish Government for the predoctoral grant received. N.O. thanks the NIEHS Superfund Research Program ES ES027707 for personal support. J.S.-S. thanks the Government of Navarra for the predoctoral grant received. V.V. thanks the Ministerio de Educación, Cultura y Deporte (‘Beatriz Galindo’ program, BEAGAL18/00142) of the Spanish Government for personal support. M.S.C. acknowledges personal support from the National Institute of Environmental Health Sciences of the National Institutes of Health under award number: 1R41ES030274-01. This paper reflects the views of the authors and does not necessarily reflect those of the US Food and Drug Administration or the National Institutes of Health.
Footnotes
Competing interests
The authors declare no competing interests.
Additional information
Supplementary information The online version contains supplementary material available at https://doi.org/10.1038/s41596-022-00754-y. Correspondence and requests for materials should be addressed to Amaya Azqueta.
Peer review information Nature Protocols thanks Vilena Kašuba and Bryant Nelson for their contribution to the peer review of this work.
Reprints and permissions information is available at www.nature.com/reprints.
Data availability
The majority of the data shown here as examples or anticipated results are available in the original papers. Figures 12 and 14–16 are theoretical results, which are inspired by unpublished work from the authors’ laboratories. Other supporting data are available upon reasonable request to the corresponding author.
References
- 1.Olive P, Banáth J & Durand R Heterogeneity in radiation-induced DNA damage and repair in tumor and normal cells measured using the ‘comet’ assay. Radiat. Res 122, 86–94 (1990). [PubMed] [Google Scholar]
- 2.Neri M et al. Worldwide interest in the comet assay: a bibliometric study. Mutagenesis 30, 155–163 (2015). [DOI] [PubMed] [Google Scholar]
- 3.de Lapuente J et al. The comet assay and its applications in the field of ecotoxicology: a mature tool that continues to expand its perspectives. Front. Genet 6, 180 (2015). [DOI] [PMC free article] [PubMed] [Google Scholar]
- 4.Gajski G et al. The comet assay in animal models: from bugs to whales—(Part 1 Invertebrates). Mutat. Res. Rev. Mutat. Res 779, 82–113 (2019). [DOI] [PubMed] [Google Scholar]
- 5.Gajski G et al. The comet assay in animal models: from bugs to whales—(Part 2 Vertebrates). Mutat. Res. Rev. Mutat. Res 781, 130–164 (2019). [DOI] [PubMed] [Google Scholar]
- 6.McKelvey-Martin VJ et al. The single cell gel electrophoresis assay (comet assay): a European review. Mutat. Res. Mol. Mech. Mutagen 288, 47–63 (1993). [DOI] [PubMed] [Google Scholar]
- 7.Tice RR et al. Single cell gel/comet assay: guidelines for in vitro and in vivo genetic toxicology testing. Environ. Mol. Mutagen 35, 206–221 (2000). [DOI] [PubMed] [Google Scholar]
- 8.OECD. Test No. 489: In Vivo Mammalian Alkaline Comet Assay (OECD Publishing, 2014). [Google Scholar]
- 9.ESCODD (European Standards Committee on Oxidative DNA Damage). Comparative analysis of baseline 8-oxo-7,8-dihydroguanine in mammalian cell DNA, by different methods in different laboratories: an approach to consensus. Carcinogenesis 23, 2129–2133 (2002). [DOI] [PubMed] [Google Scholar]
- 10.ESCODD (European Standards Committee on Oxidative DNA Damage). Measurement of DNA oxidation in human cells by chromatographic and enzymic methods. Free Radic. Biol. Med 34, 1089–1099 (2003). [DOI] [PubMed] [Google Scholar]
- 11.Gedik CM & Collins A Establishing the background level of base oxidation in human lymphocyte DNA: results of an interlaboratory validation study. FASEB J 19, 82–84 (2005). [DOI] [PubMed] [Google Scholar]
- 12.Møller P, Moller L, Godschalk RWL & Jones GDD Assessment and reduction of comet assay variation in relation to DNA damage: studies from the European Comet Assay Validation Group. Mutagenesis 25, 109–111 (2010). [DOI] [PubMed] [Google Scholar]
- 13.Forchhammer L et al. Variation in the measurement of DNA damage by comet assay measured by the ECVAG inter-laboratory validation trial. Mutagenesis 25, 113–123 (2010). [DOI] [PubMed] [Google Scholar]
- 14.Forchhammer L et al. Inter-laboratory variation in DNA damage using a standard comet assay protocol. Mutagenesis 27, 665–672 (2012). [DOI] [PubMed] [Google Scholar]
- 15.Johansson C et al. An ECVAG trial on assessment of oxidative damage to DNA measured by the comet assay. Mutagenesis 25, 125–132 (2010). [DOI] [PMC free article] [PubMed] [Google Scholar]
- 16.Godschalk RWL et al. DNA-repair measurements by use of the modified comet assay: an inter-laboratory comparison within the European Comet Assay Validation Group (ECVAG). Mutat. Res. Toxicol. Environ. Mutagen 757, 60–67 (2013). [DOI] [PubMed] [Google Scholar]
- 17.Godschalk RWL et al. Variation of DNA damage levels in peripheral blood mononuclear cells isolated in different laboratories. Mutagenesis 29, 241–249 (2014). [DOI] [PubMed] [Google Scholar]
- 18.Ersson C et al. An ECVAG inter-laboratory validation study of the comet assay: inter-laboratory and intra-laboratory variations of DNA strand breaks and FPG-sensitive sites in human mononuclear cells. Mutagenesis 28, 279–286 (2013). [DOI] [PubMed] [Google Scholar]
- 19.Møller P et al. Potassium bromate as positive assay control for the Fpg-modified comet assay. Mutagenesis 35, 341–348 (2020). [DOI] [PubMed] [Google Scholar]
- 20.Azqueta A et al. Application of the comet assay in human biomonitoring: an hCOMET perspective. Mutat. Res. Mutat. Res 783, 108288 (2020). [DOI] [PubMed] [Google Scholar]
- 21.Azqueta A et al. Technical recommendations to perform the alkaline standard and enzyme-modified comet assay in human biomonitoring studies. Mutat. Res. Toxicol. Environ. Mutagen 843, 24–32 (2019). [DOI] [PubMed] [Google Scholar]
- 22.Vodenkova S et al. An optimized comet-based in vitro DNA repair assay to assess base and nucleotide excision repair activity. Nat. Protoc 15, 3844–3878 (2020). [DOI] [PubMed] [Google Scholar]
- 23.Møller P et al. Minimum Information for Reporting on the Comet Assay (MIRCA): recommendations for describing comet assay procedures and results. Nat. Protoc 15, 3817–3826 (2020). [DOI] [PMC free article] [PubMed] [Google Scholar]
- 24.Olive PL & Banáth JP The comet assay: a method to measure DNA damage in individual cells. Nat. Protoc 1, 23–29 (2006). [DOI] [PubMed] [Google Scholar]
- 25.Ostling O & Johanson KJ Microelectrophoretic study of radiation-induced DNA damages in individual mammalian cells. Biochem. Biophys. Res. Commun 123, 291–298 (1984). [DOI] [PubMed] [Google Scholar]
- 26.Singh NP, McCoy MT, Tice RR & Schneider EL A simple technique for quantitation of low levels of DNA damage in individual cells. Exp. Cell Res 175, 184–191 (1988). [DOI] [PubMed] [Google Scholar]
- 27.Møller P The comet assay: ready for 30 more years. Mutagenesis 33, 1–7 (2018). [DOI] [PubMed] [Google Scholar]
- 28.Olive PL, Wlodek D & Banáth JP DNA double-strand breaks measured in individual cells subjected to gel electrophoresis. Cancer Res 51, 4671–4676 (1991). [PubMed] [Google Scholar]
- 29.Shaposhnikov S et al. Twelve-gel slide format optimised for comet assay and fluorescent in situ hybridisation. Toxicol. Lett 195, 31–34 (2010). [DOI] [PubMed] [Google Scholar]
- 30.Gutzkow KB et al. High-throughput comet assay using 96 minigels. Mutagenesis 28, 333–340 (2013). [DOI] [PubMed] [Google Scholar]
- 31.Watson C et al. High-throughput screening platform for engineered nanoparticle-mediated genotoxicity using CometChip technology. ACS Nano 8, 2118–2133 (2014). [DOI] [PMC free article] [PubMed] [Google Scholar]
- 32.Collins AR Measuring oxidative damage to DNA and its repair with the comet assay. Biochim. Biophys. Acta 1840, 794–800 (2014). [DOI] [PubMed] [Google Scholar]
- 33.Collins AR Investigating oxidative DNA damage and its repair using the comet assay. Mutat. Res. Mutat. Res 681, 24–32 (2009). [DOI] [PubMed] [Google Scholar]
- 34.Muruzabal D, Collins A & Azqueta A The enzyme-modified comet assay: past, present and future. Food Chem. Toxicol 147, 111865 (2021). [DOI] [PubMed] [Google Scholar]
- 35.Wu JH & Jones NJ Assessment of DNA interstrand crosslinks using the modified alkaline comet assay. Methods Mol. Biol 817, 165–181 (2012). [DOI] [PubMed] [Google Scholar]
- 36.Merk O & Speit G Detection of crosslinks with the comet assay in relationship to genotoxicity and cytotoxicity. Environ. Mol. Mutagen 33, 167–172 (1999). [DOI] [PubMed] [Google Scholar]
- 37.Spanswick VJ, Hartley JM & Hartley JA in Drug–DNA Interaction Protocols. Methods in Molecular Biology (Methods and Protocols) (ed. Fox K) 267–282 (Humana Press, 2010). [Google Scholar]
- 38.Shaposhnikov S, Frengen E & Collins AR Increasing the resolution of the comet assay using fluorescent in situ hybridization—a review. Mutagenesis 24, 383–389 (2009). [DOI] [PubMed] [Google Scholar]
- 39.Glei M, Hovhannisyan G & Pool-Zobel BL Use of comet–FISH in the study of DNA damage and repair: review. Mutat. Res 681, 33–43 (2009). [DOI] [PubMed] [Google Scholar]
- 40.Horváthová E, Dusinská M, Shaposhnikov S & Collins AR DNA damage and repair measured in different genomic regions using the comet assay with fluorescent in situ hybridization. Mutagenesis 19, 269–276 (2004). [DOI] [PubMed] [Google Scholar]
- 41.Spivak G Fluorescence in situ hybridization (FISH). Methods Mol. Biol 659, 129–145 (2010).20809308 [Google Scholar]
- 42.Townsend TA, Parrish MC, Engelward BP & Manjanatha MG The development and validation of EpiComet-Chip, a modified high-throughput comet assay for the assessment of DNA methylation status. Environ. Mol. Mutagen 58, 508–521 (2017). [DOI] [PMC free article] [PubMed] [Google Scholar]
- 43.Perotti A, Rossi V, Mutti A & Buschini A Methy-sens Comet assay and DNMTs transcriptional analysis as a combined approach in epigenotoxicology. Biomarkers 20, 64–70 (2015). [DOI] [PubMed] [Google Scholar]
- 44.McKinnon PJ & Caldecott KW DNA strand break repair and human genetic disease. Annu. Rev. Genomics Hum. Genet 8, 37–55 (2007). [DOI] [PubMed] [Google Scholar]
- 45.Chatterjee N & Walker GC Mechanisms of DNA damage, repair, and mutagenesis. Environ. Mol. Mutagen 58, 235–263 (2017). [DOI] [PMC free article] [PubMed] [Google Scholar]
- 46.Cheng K, Cahill D, Kasai H, Nishimura S & Loeb L 8-Hydroxyguanine, an abundant form of oxidative DNA damage, causes G––T and A––C substitutions. J. Biol. Chem 267, 166–172 (1992). [PubMed] [Google Scholar]
- 47.Collins AR, Duthie SJ & Dobson VL Direct enzymic detection of endogenous oxidative base damage in human lymphocyte dna. Carcinogenesis 14, 1733–1735 (1993). [DOI] [PubMed] [Google Scholar]
- 48.Dusinska M & Collins A Detection of oxidised purines and UV-induced photoproducts in DNA of single cells, by inclusion of lesion-specific enzymes in the comet assay. Altern. Lab. Anim 24, 405–411 (1996). [Google Scholar]
- 49.Smith CC, O’Donovan MR & Martin EA hOGG1 recognizes oxidative damage using the comet assay with greater specificity than FPG or ENDOIII. Mutagenesis 21, 185–190 (2006). [DOI] [PubMed] [Google Scholar]
- 50.Evans MD et al. Detection of purine lesions in cellular DNA using single cell gel electrophoresis with Fpg protein. Biochem. Soc. Trans 23, 434S (1995). [DOI] [PubMed] [Google Scholar]
- 51.Muruzabal D, Langie SAS, Pourrut B & Azqueta A The enzyme-modified comet assay: enzyme incubation step in 2 vs 12-gels/slide systems. Mutat. Res. Toxicol. Environ. Mutagen 845, 402981 (2019). [DOI] [PubMed] [Google Scholar]
- 52.Collins A, Dusinská M & Horská A Detection of alkylation damage in human lymphocyte DNA with the comet assay. Acta Biochim. Pol 48, 11–14 (2001). [PubMed] [Google Scholar]
- 53.Hašplová K et al. DNA alkylation lesions and their repair in human cells: modification of the comet assay with 3-methyladenine DNA glycosylase (AlkD). Toxicol. Lett 208, 76–81 (2012). [DOI] [PubMed] [Google Scholar]
- 54.Muruzabal D et al. Novel approach for the detection of alkylated bases using the enzyme-modified comet assay. Toxicol. Lett 330, 108–117 (2020). [DOI] [PubMed] [Google Scholar]
- 55.Connor TRO Purification and characterization of human 3-methyladenine-DNA glycosylase. Nucleic Acids Res 21, 5561–5569 (1993). [DOI] [PMC free article] [PubMed] [Google Scholar]
- 56.Lee C-YI et al. Recognition and processing of a new repertoire of DNA substrates by human 3-methyladenine DNA glycosylase (AAG). Biochemistry 48, 1850–1861 (2009). [DOI] [PMC free article] [PubMed] [Google Scholar]
- 57.Azqueta A, Arbillaga L, Lopez de Cerain A & Collins A Enhancing the sensitivity of the comet assay as a genotoxicity test, by combining it with bacterial repair enzyme FPG. Mutagenesis 28, 271–277 (2013). [DOI] [PubMed] [Google Scholar]
- 58.Hansen SH et al. Using the comet assay and lysis conditions to characterize DNA lesions from the acrylamide metabolite glycidamide. Mutagenesis 33, 31–39 (2018). [DOI] [PubMed] [Google Scholar]
- 59.Speit G, Schütz P, Bonzheim I, Trenz K & Hoffmann H Sensitivity of the FPG protein towards alkylation damage in the comet assay. Toxicol. Lett 146, 151–158 (2004). [DOI] [PubMed] [Google Scholar]
- 60.Noll DM, Mason TM & Miller PS Formation and repair of interstrand cross-links in DNA. Chem. Rev 106, 277–301 (2006). [DOI] [PMC free article] [PubMed] [Google Scholar]
- 61.Folmer V, Soares JCM, Gabriel D & Rocha JBT A high fat diet inhibits δ-aminolevulinate dehydratase and increases lipid peroxidation in mice (Mus musculus). J. Nutr 133, 2165–2170 (2003). [DOI] [PubMed] [Google Scholar]
- 62.Ljunggren B Severe phototoxic burn following celery ingestion. Arch. Dermatol 126, 1334–1336 (1990). [PubMed] [Google Scholar]
- 63.Bennetts LE et al. Impact of estrogenic compounds on DNA integrity in human spermatozoa: evidence for cross-linking and redox cycling activities. Mutat. Res. Mol. Mech. Mutagen 641, 1–11 (2008). [DOI] [PubMed] [Google Scholar]
- 64.Dextraze M-E, Gantchev T, Girouard S & Hunting D DNA interstrand cross-links induced by ionizing radiation: an unsung lesion. Mutat. Res. Rev. Mutat. Res 704, 101–107 (2010). [DOI] [PubMed] [Google Scholar]
- 65.Olive PL & Banáth JP Sizing highly fragmented DNA in individual apoptotic cells using the comet assay and a DNA crosslinking agent. Exp. Cell Res 221, 19–26 (1995). [DOI] [PubMed] [Google Scholar]
- 66.Collins AR et al. UV-sensitive rodent mutant cell lines of complementation groups 6 and 8 differ phenotypically from their human counterparts. Environ. Mol. Mutagen 29, 152–160 (1997). [PubMed] [Google Scholar]
- 67.Collins A DNA repair in ultraviolet-irradiated HeLa cells is disrupted by aphidicolin. Biochim. Biophys. Acta Gene Struct. Expr 741, 341–347 (1983). [DOI] [PubMed] [Google Scholar]
- 68.Gedik CM, Ewen SWB & Collins AR Single-cell gel electrophoresis applied to the analysis of UV-C damage and its repair in human cells. Int. J. Radiat. Biol 62, 313–320 (1992). [DOI] [PubMed] [Google Scholar]
- 69.Baranovskiy AG et al. Structural basis for inhibition of DNA replication by aphidicolin. Nucleic Acids Res 42, 14013–14021 (2014). [DOI] [PMC free article] [PubMed] [Google Scholar]
- 70.Cheng CH & Kuchta RD DNA polymerase epsilon: aphidicolin inhibition and the relationship between polymerase and exonuclease activity. Biochemistry 32, 8568–8574 (1993). [DOI] [PubMed] [Google Scholar]
- 71.Goscin LP & Byrnes JJ DNA polymerase delta: one polypeptide, two activities. Biochemistry 21, 2513–2518 (1982). [DOI] [PubMed] [Google Scholar]
- 72.Bausinger J, Schütz P, Piberger AL & Speit G Further characterization of benzo[a]pyrene diol-epoxide (BPDE)-induced comet assay effects. Mutagenesis 31, 161–169 (2016). [DOI] [PubMed] [Google Scholar]
- 73.Vande Loock K, Decordier I, Ciardelli R, Haumont D & Kirsch-Volders M An aphidicolin-block nucleotide excision repair assay measuring DNA incision and repair capacity. Mutagenesis 25, 25–32 (2010). [DOI] [PubMed] [Google Scholar]
- 74.Ngo LP et al. Sensitive CometChip assay for screening potentially carcinogenic DNA adducts by trapping DNA repair intermediates. Nucleic Acids Res . 48, e13 (2020). [DOI] [PMC free article] [PubMed] [Google Scholar]
- 75.Azqueta A et al. A comparative performance test of standard, medium- and high-throughput comet assays. Toxicol. Vitr 27, 768–773 (2013). [DOI] [PubMed] [Google Scholar]
- 76.Guilherme S, Santos MA, Barroso C, Gaivão I & Pacheco M Differential genotoxicity of Roundup® formulation and its constituents in blood cells of fish (Anguilla anguilla): considerations on chemical interactions and DNA damaging mechanisms. Ecotoxicology 21, 1381–1390 (2012). [DOI] [PubMed] [Google Scholar]
- 77.Guilherme S, Santos MA, Gaivão I & Pacheco M Are DNA-damaging effects induced by herbicide formulations (Roundup® and Garlon®) in fish transient and reversible upon cessation of exposure? Aquat. Toxicol 155, 213–221 (2014). [DOI] [PubMed] [Google Scholar]
- 78.Brunborg G et al. High throughput sample processing and automated scoring. Front. Genet 5, 373 (2014). [DOI] [PMC free article] [PubMed] [Google Scholar]
- 79.McNamee J, McLean J, Ferrarotto C & Bellier P Comet assay: rapid processing of multiple samples. Mutat. Res. Toxicol. Environ. Mutagen 466, 63–69 (2000). [DOI] [PubMed] [Google Scholar]
- 80.Perdry H et al. Validation of Gelbond® high-throughput alkaline and Fpg-modified comet assay using a linear mixed model. Environ. Mol. Mutagen 59, 595–602 (2018). [DOI] [PubMed] [Google Scholar]
- 81.Enciso JM et al. Standardisation of the in vitro comet assay: influence of lysis time and lysis solution composition on the detection of DNA damage induced by X-rays. Mutagenesis 33, 25–30 (2018). [DOI] [PubMed] [Google Scholar]
- 82.Wood DK, Weingeist DM, Bhatia SN & Engelward BP Single cell trapping and DNA damage analysis using microwell arrays. Proc. Natl Acad. Sci. USA 107, 10008–10013 (2010). [DOI] [PMC free article] [PubMed] [Google Scholar]
- 83.Weingeist DM et al. Single-cell microarray enables high-throughput evaluation of DNA double-strand breaks and DNA repair inhibitors. Cell Cycle 12, 907–915 (2013). [DOI] [PMC free article] [PubMed] [Google Scholar]
- 84.Ge J et al. Micropatterned comet assay enables high throughput and sensitive DNA damage quantification. Mutagenesis 30, 11–19 (2015). [DOI] [PMC free article] [PubMed] [Google Scholar]
- 85.Ge J et al. Standard fluorescent imaging of live cells is highly genotoxic. Cytom. Part A 83A, 552–560 (2013). [DOI] [PMC free article] [PubMed] [Google Scholar]
- 86.Seo J-E et al. Quantitative comparison of in vitro genotoxicity between metabolically competent HepaRG cells and HepG2 cells using the high-throughput high-content CometChip assay. Arch. Toxicol 93, 1433–1448 (2019). [DOI] [PubMed] [Google Scholar]
- 87.Mutamba JT et al. XRCC1 and base excision repair balance in response to nitric oxide. DNA Repair 10, 1282–1293 (2011). [DOI] [PMC free article] [PubMed] [Google Scholar]
- 88.Chao C, Ngo LP & Engelward BP SpheroidChip: patterned agarose microwell compartments harboring HepG2 spheroids are compatible with genotoxicity testing. ACS Biomater. Sci. Eng 6, 2427–2439 (2020). [DOI] [PMC free article] [PubMed] [Google Scholar]
- 89.Chao C & Engelward BP Applications of CometChip for environmental health studies. Chem. Res. Toxicol 33, 1528–1538 (2020). [DOI] [PMC free article] [PubMed] [Google Scholar]
- 90.Karbaschi M & Cooke MS Novel method for the high-throughput processing of slides for the comet assay. Sci. Rep 4, 7200 (2015). [DOI] [PMC free article] [PubMed] [Google Scholar]
- 91.Lewies A, Van Dyk E, Wentzel JF & Pretorius PJ Using a medium-throughput comet assay to evaluate the global DNA methylation status of single cells. Front. Genet 5, 215 (2014). [DOI] [PMC free article] [PubMed] [Google Scholar]
- 92.Wentzel JF et al. Assessing the DNA methylation status of single cells with the comet assayt Anal. Biochem 400, 190–194 (2010). [DOI] [PubMed] [Google Scholar]
- 93.Pogribny I, Yi P & James SJ A sensitive new method for rapid detection of abnormal methylation patterns in global DNA and within CpG islands. Biochem. Biophys. Res. Commun 262, 624–628 (1999). [DOI] [PubMed] [Google Scholar]
- 94.Mohsen K, Johansson S & Ekström TJ Using LUMA: a luminometric-based assay for global DNA-methylation. Epigenetics 1, 46–49 (2006). [DOI] [PubMed] [Google Scholar]
- 95.Gowher H, Leismann O & Jeltsch A DNA of Drosophila melanogaster contains 5-methylcytosine. EMBO J 19, 6918–6923 (2000). [DOI] [PMC free article] [PubMed] [Google Scholar]
- 96.Zhou Y, Bui T, Auckland LD & Williams CG Undermethylated DNA as a source of microsatellites from a conifer genome. Genome 45, 91–99 (2002). [DOI] [PubMed] [Google Scholar]
- 97.Adamczyk J et al. Affected chromosome homeostasis and genomic instability of clonal yeast cultures. Curr. Genet 62, 405–418 (2016). [DOI] [PMC free article] [PubMed] [Google Scholar]
- 98.Lewinska A, Miedziak B & Wnuk M Assessment of yeast chromosome XII instability: single chromosome comet assay. Fungal Genet. Biol 63, 9–16 (2014). [DOI] [PubMed] [Google Scholar]
- 99.Krol K et al. Lack of G1/S control destabilizes the yeast genome via replication stress-induced DSBs and illegitimate recombination. J. Cell Sci 131, jcs226480 (2018). [DOI] [PubMed] [Google Scholar]
- 100.Cecchini MJ, Amiri M & Dick FA Analysis of cell cycle position in mammalian cells. J. Vis. Exp 3491 (2012). [DOI] [PMC free article] [PubMed]
- 101.Nagar S, Hanley-Bowdoin L & Robertson D Host DNA replication is induced by geminivirus infection of differentiated plant cells. Plant Cell 14, 2995–3007 (2002). [DOI] [PMC free article] [PubMed] [Google Scholar]
- 102.Mórocz M, Gali H, Raskó I, Downes CS & Haracska L Single cell analysis of human RAD18-dependent DNA post-replication repair by alkaline bromodeoxyuridine comet assay. PLoS ONE 8, e70391 (2013). [DOI] [PMC free article] [PubMed] [Google Scholar]
- 103.McGlynn AP, Wasson G, O’Connor J, McKelvey-Martin VJ & Downes CS The bromodeoxyuridine comet assay: detection of maturation of recently replicated DNA in individual cells. Cancer Res 59, 5912–5916 (1999). [PubMed] [Google Scholar]
- 104.McGlynn AP et al. Detection of replicative integrity in small colonic biopsies using the BrdUrd comet assay. Br. J. Cancer 88, 895–901 (2003). [DOI] [PMC free article] [PubMed] [Google Scholar]
- 105.Guo J, Hanawalt PC & Spivak G Comet–FISH with strand-specific probes reveals transcription-coupled repair of 8-oxoGuanine in human cells. Nucleic Acids Res 41, 7700–7712 (2013). [DOI] [PMC free article] [PubMed] [Google Scholar]
- 106.Mladinic M, Zeljezic D, Shaposhnikov SA & Collins AR The use of FISH–comet to detect c-Myc and TP 53 damage in extended-term lymphocyte cultures treated with terbuthylazine and carbofuran. Toxicol. Lett 211, 62–69 (2012). [DOI] [PubMed] [Google Scholar]
- 107.Azevedo F, Marques F, Fokt H, Oliveira R & Johansson B Measuring oxidative DNA damage and DNA repair using the yeast comet assay. Yeast 28, 55–61 (2011). [DOI] [PubMed] [Google Scholar]
- 108.Oliveira R & Johansson B in DNA Repair Protocols, Methods in Molecular Biology (ed. Bjergbæk L) 101–109 (Humana Press, 2012). [Google Scholar]
- 109.Santos CLV, Pourrut B & Ferreira de Oliveira JMP The use of comet assay in plant toxicology: recent advances. Front. Genet 6, 216 (2015). [DOI] [PMC free article] [PubMed] [Google Scholar]
- 110.Dhawan A, Bajpayee M & Parmar D Comet assay: a reliable tool for the assessment of DNA damage in different models. Cell Biol. Toxicol 25, 5–32 (2009). [DOI] [PubMed] [Google Scholar]
- 111.Jha AN Ecotoxicological applications and significance of the comet assay. Mutagenesis 23, 207–221 (2008). [DOI] [PubMed] [Google Scholar]
- 112.Ghosh M, Ghosh I, Godderis L, Hoet P & Mukherjee A Genotoxicity of engineered nanoparticles in higher plants. Mutat. Res. Toxicol. Environ. Mutagen 842, 132–145 (2019). [DOI] [PubMed] [Google Scholar]
- 113.Lanier C, Manier N, Cuny D & Deram A The comet assay in higher terrestrial plant model: review and evolutionary trends. Environ. Pollut 207, 6–20 (2015). [DOI] [PubMed] [Google Scholar]
- 114.Bajpayee M, Kumar A & Dhawan A in Genotoxicity Assessment: Methods and Protocols (Methods in Molecular Biology series) (eds Dhawan A & Bajpayee M) Vol 2031, 237–257 (Humana Press, 2019). [DOI] [PubMed] [Google Scholar]
- 115.Pedron J et al. Novel 8-nitroquinolin-2(1H)-ones as NTR-bioactivated antikinetoplastid molecules: Synthesis, electrochemical and SAR study. Eur. J. Med. Chem 155, 135–152 (2018). [DOI] [PMC free article] [PubMed] [Google Scholar]
- 116.Le Hégarat L et al. Performance of comet and micronucleus assays in metabolic competent HepaRG cells to predict in vivo genotoxicity. Toxicol. Sci 138, 300–309 (2014). [DOI] [PubMed] [Google Scholar]
- 117.Cowie H et al. Suitability of human and mammalian cells of different origin for the assessment of genotoxicity of metal and polymeric engineered nanoparticles. Nanotoxicology 9, 57–65 (2015). [DOI] [PubMed] [Google Scholar]
- 118.Naik UC, Das MT, Sauran S & Thakur IS Assessment of in vitro cyto/genotoxicity of sequentially treated electroplating effluent on the human hepatocarcinoma HuH-7 cell line. Mutat. Res. Toxicol. Environ. Mutagen 762, 9–16 (2014). [DOI] [PubMed] [Google Scholar]
- 119.Waldherr M et al. Use of HuH6 and other human-derived hepatoma lines for the detection of genotoxins: a new hope for laboratory animals? Arch. Toxicol 92, 921–934 (2018). [DOI] [PMC free article] [PubMed] [Google Scholar]
- 120.Kruszewski M et al. Comet assay in neural cells as a tool to monitor DNA damage induced by chemical or physical factors relevant to environmental and occupational exposure. Mutat. Res. Toxicol. Environ. Mutagen 845, 402990 (2019). [DOI] [PubMed] [Google Scholar]
- 121.Borm PJA, Fowler P & Kirkland D An updated review of the genotoxicity of respirable crystalline silica. Part. Fibre Toxicol 15, 23 (2018). [DOI] [PMC free article] [PubMed] [Google Scholar]
- 122.Bankoglu EE, Kodandaraman G & Stopper H A systematic review of the use of the alkaline comet assay for genotoxicity studies in human colon-derived cells. Mutat. Res. Toxicol. Environ. Mutagen 845, 402976 (2019). [DOI] [PubMed] [Google Scholar]
- 123.Møller P et al. Applications of the comet assay in particle toxicology: air pollution and engineered nanomaterials exposure. Mutagenesis 30, 67–83 (2015). [DOI] [PubMed] [Google Scholar]
- 124.Wischermann K, Boukamp P & Schmezer P Improved alkaline comet assay protocol for adherent HaCaT keratinocytes to study UVA-induced DNA damage. Mutat. Res. Toxicol. Environ. Mutagen 630, 122–128 (2007). [DOI] [PubMed] [Google Scholar]
- 125.García-Rodríguez A, Vila L, Cortés C, Hernández A & Marcos R Effects of differently shaped TiO2NPs (nanospheres, nanorods and nanowires) on the in vitro model (Caco-2/HT29) of the intestinal barrier. Part. Fibre Toxicol 15, 33 (2018). [DOI] [PMC free article] [PubMed] [Google Scholar]
- 126.Domenech J, Hernández A, Demir E, Marcos R & Cortés C Interactions of graphene oxide and graphene nanoplatelets with the in vitro Caco-2/HT29 model of intestinal barrier. Sci. Rep 10, 2793 (2020). [DOI] [PMC free article] [PubMed] [Google Scholar]
- 127.Ventura C et al. Cytotoxicity and genotoxicity of MWCNT-7 and crocidolite: assessment in alveolar epithelial cells versus their coculture with monocyte-derived macrophages. Nanotoxicology 14, 479–503 (2020). [DOI] [PubMed] [Google Scholar]
- 128.Ventura C, Lourenço AF, Sousa-Uva A, Ferreira PJT & Silva MJ Evaluating the genotoxicity of cellulose nanofibrils in a co-culture of human lung epithelial cells and monocyte-derived macrophages. Toxicol. Lett 291, 173–183 (2018). [DOI] [PubMed] [Google Scholar]
- 129.Jantzen K et al. Oxidative damage to DNA by diesel exhaust particle exposure in co-cultures of human lung epithelial cells and macrophages. Mutagenesis 27, 693–701 (2012). [DOI] [PubMed] [Google Scholar]
- 130.Machado ART et al. Cytotoxic, genotoxic, and oxidative stress-inducing effect of an l-amino acid oxidase isolated from Bothrops jararacussu venom in a co-culture model of HepG2 and HUVEC cells. Int. J. Biol. Macromol 127, 425–432 (2019). [DOI] [PubMed] [Google Scholar]
- 131.Žegura B & Filipič M The application of the comet assay in fish cell lines. Mutat. Res. Toxicol. Environ. Mutagen 842, 72–84 (2019). [DOI] [PubMed] [Google Scholar]
- 132.Canedo A & Rocha TL Zebrafish (Danio rerio) using as model for genotoxicity and DNA repair assessments: Historical review, current status and trends. Sci. Total Environ 762, 144084 (2021). [DOI] [PubMed] [Google Scholar]
- 133.Reeves JF, Davies SJ, Dodd NJF & Jha AN Hydroxyl radicals (OH) are associated with titanium dioxide (TiO2) nanoparticle-induced cytotoxicity and oxidative DNA damage in fish cells. Mutat. Res. Mol. Mech. Mutagen 640, 113–122 (2008). [DOI] [PubMed] [Google Scholar]
- 134.Fuchs R et al. Modification of the alkaline comet assay with human mesenchymal stem cells. Cell Biol. Int 36, 113–117 (2012). [DOI] [PubMed] [Google Scholar]
- 135.Tomc J et al. Adipose tissue stem cell-derived hepatic progenies as an in vitro model for genotoxicity testing. Arch. Toxicol 92, 1893–1903 (2018). [DOI] [PubMed] [Google Scholar]
- 136.Garcia ALH et al. Fluorosilicic acid induces DNA damage and oxidative stress in bone marrow mesenchymal stem cells. Mutat. Res. Toxicol. Environ. Mutagen 861–862, 503297 (2021). [DOI] [PubMed] [Google Scholar]
- 137.Hiemstra PS, Grootaers G, van der Does AM, Krul CAM & Kooter IM Human lung epithelial cell cultures for analysis of inhaled toxicants: lessons learned and future directions. Toxicol. Vitr 47, 137–146 (2018). [DOI] [PubMed] [Google Scholar]
- 138.Štampar M, Tomc J, Filipič M & Žegura B Development of in vitro 3D cell model from hepatocellular carcinoma (HepG2) cell line and its application for genotoxicity testing. Arch. Toxicol 93, 3321–3333 (2019). [DOI] [PubMed] [Google Scholar]
- 139.Mišík M et al. Use of human derived liver cells for the detection of genotoxins in comet assays. Mutat. Res. Toxicol. Environ. Mutagen 845, 402995 (2019). [DOI] [PubMed] [Google Scholar]
- 140.Pfuhler S et al. Use of in vitro 3D tissue models in genotoxicity testing: strategic fit, validation status and way forward. Report of the working group from the 7th International Workshop on Genotoxicity Testing (IWGT). Mutat. Res. Toxicol. Environ. Mutagen 850–851, 503135 (2020). [DOI] [PubMed] [Google Scholar]
- 141.Pfuhler S et al. A tiered approach to the use of alternatives to animal testing for the safety assessment of cosmetics: genotoxicity. A COLIPA analysis. Regul. Toxicol. Pharmacol 57, 315–324 (2010). [DOI] [PubMed] [Google Scholar]
- 142.Pfuhler S et al. The Cosmetics Europe strategy for animal-free genotoxicity testing: project status up-date. Toxicol. Vitr 28, 18–23 (2014). [DOI] [PubMed] [Google Scholar]
- 143.Reisinger K et al. Validation of the 3D Skin Comet assay using full thickness skin models: transferability and reproducibility. Mutat. Res. Toxicol. Environ. Mutagen 827, 27–41 (2018). [DOI] [PubMed] [Google Scholar]
- 144.Reus AA et al. Comet assay in reconstructed 3D human epidermal skin models–investigation of intra- and inter-laboratory reproducibility with coded chemicals. Mutagenesis 28, 709–720 (2013). [DOI] [PMC free article] [PubMed] [Google Scholar]
- 145.Pfuhler S et al. Validation of the 3D reconstructed human skin comet assay, an animal-free alternative for following-up positive results from standard in vitro genotoxicity assays. Mutagenesis 36, 19–35 (2021). [DOI] [PMC free article] [PubMed] [Google Scholar]
- 146.Elje E et al. The comet assay applied to HepG2 liver spheroids. Mutat. Res. Toxicol. Environ. Mutagen 845, 403033 (2019). [DOI] [PubMed] [Google Scholar]
- 147.Mandon M, Huet S, Dubreil E, Fessard V & Le Hégarat L Three-dimensional HepaRG spheroids as a liver model to study human genotoxicity in vitro with the single cell gel electrophoresis assay. Sci. Rep 9, 10548 (2019). [DOI] [PMC free article] [PubMed] [Google Scholar]
- 148.Elje E et al. Hepato(geno)toxicity assessment of nanoparticles in a HepG2 liver spheroid model. Nanomaterials 10, 545 (2020). [DOI] [PMC free article] [PubMed] [Google Scholar]
- 149.Štampar M et al. Hepatocellular carcinoma (HepG2/C3A) cell-based 3D model for genotoxicity testing of chemicals. Sci. Total Environ 755, 143255 (2021). [DOI] [PubMed] [Google Scholar]
- 150.Kooter IM et al. Cellular effects in an in vitro human 3D cellular airway model and A549/BEAS-2B in vitro cell cultures following air exposure to cerium oxide particles at an air–liquid interface. Appl. Vitr. Toxicol 2, 56–66 (2016). [Google Scholar]
- 151.Strähle U et al. Zebrafish embryos as an alternative to animal experiments—a commentary on the definition of the onset of protected life stages in animal welfare regulations. Reprod. Toxicol 33, 128–132 (2012). [DOI] [PubMed] [Google Scholar]
- 152.Kelly JR & Benson SA Inconsistent ethical regulation of larval zebrafish in research. J. Fish. Biol 97, 324–327 (2020). [DOI] [PubMed] [Google Scholar]
- 153.Kosmehl T et al. A novel contact assay for testing genotoxicity of chemicals and whole sediments in zebrafish embryos. Environ. Toxicol. Chem 25, 2097–2106 (2006). [DOI] [PubMed] [Google Scholar]
- 154.Deregowska A et al. Shifts in rDNA levels act as a genome buffer promoting chromosome homeostasis. Cell Cycle 14, 3475–3487 (2015). [DOI] [PMC free article] [PubMed] [Google Scholar]
- 155.Cerda H, Hofsten B & Johanson K in Proceedings of the Workshop on Recent Advances on Detection of Irradiated Food (eds. Leonardi M, Bessiardo J & Raffi J) 401–405 (Commission of the European Communities, 1993). [Google Scholar]
- 156.Koppen G & Verschaeve L The alkaline comet test on plant cells: a new genotoxicity test for DNA strand breaks in Vicia faba root cells. Mutat. Res. Mutagen. Relat. Subj 360, 193–200 (1996). [DOI] [PubMed] [Google Scholar]
- 157.Einset J & Collins AR DNA repair after X-irradiation: lessons from plants. Mutagenesis 30, 45–50 (2015). [DOI] [PubMed] [Google Scholar]
- 158.Gichner T, Znidar I, Wagner ED & Plewa MJ in The Comet Assay in Toxicology (eds. Dhawan A & Anderson D) 98–119 (Royal Society of Chemistry, 2009). [Google Scholar]
- 159.Pellegri V, Gorbi G & Buschini A Comet assay on Daphnia magna in eco-genotoxicity testing. Aquat. Toxicol 155, 261–268 (2014). [DOI] [PubMed] [Google Scholar]
- 160.Parrella A, Lavorgna M, Criscuolo E, Russo C & Isidori M Eco-genotoxicity of six anticancer drugs using comet assay in daphnids. J. Hazard. Mater 286, 573–580 (2015). [DOI] [PubMed] [Google Scholar]
- 161.Russo C, Kundi M, Lavorgna M, Parrella A & Isidori M Benzalkonium chloride and anticancer drugs in binary mixtures: reproductive toxicity and genotoxicity in the freshwater crustacean Ceriodaphnia dubia. Arch. Environ. Contam. Toxicol 74, 546–556 (2018). [DOI] [PubMed] [Google Scholar]
- 162.Lavorgna M, Russo C, D’Abrosca B, Parrella A & Isidori M Toxicity and genotoxicity of the quaternary ammonium compound benzalkonium chloride (BAC) using Daphnia magna and Ceriodaphnia dubia as model systems. Environ. Pollut 210, 34–39 (2016). [DOI] [PubMed] [Google Scholar]
- 163.Kundi M et al. Prediction and assessment of ecogenotoxicity of antineoplastic drugs in binary mixtures. Environ. Sci. Pollut. Res 23, 14771–14779 (2016). [DOI] [PubMed] [Google Scholar]
- 164.Sario S, Silva AM & Gaivão I Titanium dioxide nanoparticles: toxicity and genotoxicity in Drosophila melanogaster (SMART eye-spot test and comet assay in neuroblasts). Mutat. Res. Toxicol. Environ. Mutagen 831, 19–23 (2018). [DOI] [PubMed] [Google Scholar]
- 165.Gaivão I & Sierra LM Drosophila comet assay: insights, uses, and future perspectives. Front. Genet 5, 304 (2014). [DOI] [PMC free article] [PubMed] [Google Scholar]
- 166.Marques A et al. Comparative genoprotection ability of wild-harvested vs. aqua-cultured Ulva rigida coupled with phytochemical profiling. Eur. J. Phycol 56, 105–118 (2021). [Google Scholar]
- 167.Bilbao C, Ferreiro JA, Comendador MA & Sierra LM Influence of mus201 and mus308 mutations of Drosophila melanogaster on the genotoxicity of model chemicals in somatic cells in vivo measured with the comet assay. Mutat. Res. Mol. Mech. Mutagen 503, 11–19 (2002). [DOI] [PubMed] [Google Scholar]
- 168.Mukhopadhyay I, Chowdhuri DK, Bajpayee M & Dhawan A Evaluation of in vivo genotoxicity of cypermethrin in Drosophila melanogaster using the alkaline comet assay. Mutagenesis 19, 85–90 (2004). [DOI] [PubMed] [Google Scholar]
- 169.Siddique HR, Chowdhuri DK, Saxena DK & Dhawan A Validation of Drosophila melanogaster as an in vivo model for genotoxicity assessment using modified alkaline comet assay. Mutagenesis 20, 285–290 (2005). [DOI] [PubMed] [Google Scholar]
- 170.Sharma A, Shukla AK, Mishra M & Chowdhuri DK Validation and application of Drosophila melanogaster as an in vivo model for the detection of double strand breaks by neutral comet assay. Mutat. Res. Toxicol. Environ. Mutagen 721, 142–146 (2011). [DOI] [PubMed] [Google Scholar]
- 171.Ribeiro IP & Gaivão I Efeito genotóxico do etanol em neuroblastos de Drosophila melanogaster. Rev. Port. Saúde. Pública 28, 199–204 (2010). [Google Scholar]
- 172.Brennan LJ, Haukedal JA, Earle JC, Keddie B & Harris HL Disruption of redox homeostasis leads to oxidative DNA damage in spermatocytes of Wolbachia-infected Drosophila simulans. Insect Mol. Biol 21, 510–520 (2012). [DOI] [PubMed] [Google Scholar]
- 173.Verma A, Sengupta S & Lakhotia SC DNApol-ϵ gene is indispensable for the survival and growth of Drosophila melanogaster. Genesis 50, 86–101 (2012). [DOI] [PubMed] [Google Scholar]
- 174.Carmona ER, Guecheva TN, Creus A & Marcos R Proposal of an in vivo comet assay using haemocytes of Drosophila melanogaster. Environ. Mol. Mutagen 52, 165–169 (2011). [DOI] [PubMed] [Google Scholar]
- 175.Augustyniak M, Gladysz M & Dziewięcka M The Comet assay in insects—Status, prospects and benefits for science. Mutat. Res. Rev. Mutat. Res 767, 67–76 (2016). [DOI] [PubMed] [Google Scholar]
- 176.Kadhim MA Methodologies for monitoring the genetic effects of mutagens and carcinogens accumulated in the body of marine mussels. Rev. Aquat. Sci 2, 83–107 (1990). [Google Scholar]
- 177.Prego-Faraldo MV, Valdiglesias V, Laffon B, Eirín-López JM & Méndez J In vitro analysis of early genotoxic and cytotoxic effects of okadaic acid in different cell types of the mussel Mytilus galloprovincialis. J. Toxicol. Environ. Heal. Part A 78, 814–824 (2015). [DOI] [PubMed] [Google Scholar]
- 178.Jha AN, Dogra Y, Turner A & Millward GE Impact of low doses of tritium on the marine mussel, Mytilus edulis: genotoxic effects and tissue-specific bioconcentration. Mutat. Res. Toxicol. Environ. Mutagen 586, 47–57 (2005). [DOI] [PubMed] [Google Scholar]
- 179.Nacci DE, Cayula S & Jackim E Detection of DNA damage in individual cells from marine organisms using the single cell gel assay. Aquat. Toxicol 35, 197–210 (1996). [Google Scholar]
- 180.Steinert SA Contribution of apoptosis to observed DNA damage in mussel cells. Mar. Environ. Res 42, 253–259 (1996). [Google Scholar]
- 181.Wilson J, Pascoe P, Parry J & Dixon D Evaluation of the comet assay as a method for the detection of DNA damage in the cells of a marine invertebrate, Mytilus edulis L. (Mollusca: Pelecypoda). Mutat. Res. Mol. Mech. Mutagen 399, 87–95 (1998). [DOI] [PubMed] [Google Scholar]
- 182.Mitchelmore C & Chipman J DNA strand breakage in aquatic organisms and the potential value of the comet assay in environmental monitoring. Mutat. Res. Mol. Mech. Mutagen 399, 135–147 (1998). [DOI] [PubMed] [Google Scholar]
- 183.Frenzilli G, Nigro M & Lyons B The comet assay for the evaluation of genotoxic impact in aquatic environments. Mutat. Res. Rev. Mutat. Res 681, 80–92 (2009). [DOI] [PubMed] [Google Scholar]
- 184.Gentile L, Cebrià F & Bartscherer K The planarian flatworm: an in vivo model for stem cell biology and nervous system regeneration. Dis. Model. Mech 4, 12–19 (2011). [DOI] [PMC free article] [PubMed] [Google Scholar]
- 185.Guecheva T, Henriques JA & Erdtmann B Genotoxic effects of copper sulphate in freshwater planarian in vivo, studied with the single-cell gel test (comet assay). Mutat. Res. Toxicol. Environ. Mutagen 497, 19–27 (2001). [DOI] [PubMed] [Google Scholar]
- 186.Stevens A-S et al. Planarians customize their stem cell responses following genotoxic stress as a function of exposure time and regenerative state. Toxicol. Sci 162, 251–263 (2018). [DOI] [PubMed] [Google Scholar]
- 187.Peiris TH et al. Regional signals in the planarian body guide stem cell fate in the presence of genomic instability. Development 143, 1697–1709 (2016). [DOI] [PMC free article] [PubMed] [Google Scholar]
- 188.Thiruvalluvan M, Barghouth PG, Tsur A, Broday L & Oviedo NJ SUMOylation controls stem cell proliferation and regional cell death through Hedgehog signaling in planarians. Cell. Mol. Life Sci 75, 1285–1301 (2018). [DOI] [PMC free article] [PubMed] [Google Scholar]
- 189.Yin S et al. SmedOB1 is required for planarian homeostasis and regeneration. Sci. Rep 6, 34013 (2016). [DOI] [PMC free article] [PubMed] [Google Scholar]
- 190.Eyambe GS, Goven AJ, Fitzpatrick LC, Venables BJ & Cooper EL A non-invasive technique for sequential collection of earthworm (Lumbricus terrestris) leukocytes during subchronic immunotoxicity studies. Lab. Anim 25, 61–67 (1991). [DOI] [PubMed] [Google Scholar]
- 191.Verschaeve L & Gilles J Single cell gel electrophoresis assay in the earthworm for the detection of genotoxic compounds in soils. Bull. Environ. Contam. Toxicol 54, 112–119 (1995). [DOI] [PubMed] [Google Scholar]
- 192.Reinecke SA & Reinecke AJ The comet assay as biomarker of heavy metal genotoxicity in earthworms. Arch. Environ. Contam. Toxicol 46, 208–215 (2004). [DOI] [PubMed] [Google Scholar]
- 193.Lourenço JI et al. Genotoxic endpoints in the earthworms sub-lethal assay to evaluate natural soils contaminated by metals and radionuclides. J. Hazard. Mater 186, 788–795 (2011). [DOI] [PubMed] [Google Scholar]
- 194.Lladó S, Solanas AM, de Lapuente J, Borràs M & Viñas M A diversified approach to evaluate biostimulation and bioaugmentation strategies for heavy-oil-contaminated soil. Sci. Total Environ 435–436, 262–269 (2012). [DOI] [PubMed] [Google Scholar]
- 195.Sforzini S et al. Genotoxicity assessment in Eisenia andrei coelomocytes: a study of the induction of DNA damage and micronuclei in earthworms exposed to B[a]P- and TCDD-spiked soils. Mutat. Res. Toxicol. Environ. Mutagen 746, 35–41 (2012). [DOI] [PubMed] [Google Scholar]
- 196.Saez G et al. Genotoxic and oxidative responses in coelomocytes of Eisenia fetida and Hediste diversicolor exposed to lipid-coated CdSe/ZnS quantum dots and CdCl2. Environ. Toxicol 30, 918–926 (2015). [DOI] [PubMed] [Google Scholar]
- 197.Ramadass K et al. Earthworm comet assay for assessing the risk of weathered petroleum hydrocarbon contaminated soils: need to look further than target contaminants. Arch. Environ. Contam. Toxicol 71, 561–571 (2016). [DOI] [PubMed] [Google Scholar]
- 198.Jiang X et al. Toxicological effects of polystyrene microplastics on earthworm (Eisenia fetida). Environ. Pollut 259, 113896 (2020). [DOI] [PubMed] [Google Scholar]
- 199.Ralph S, Petras M, Pandrangi R & Vrzoc M Alkaline single-cell gel (comet) assay and genotoxicity monitoring using two species of tadpoles. Environ. Mol. Mutagen 28, 112–120 (1996). [DOI] [PubMed] [Google Scholar]
- 200.Cotelle S FJ Comet assay in genetic ecotoxicology: a review. Environ. Mol. Mutagen 34, 246–255 (1999). [PubMed] [Google Scholar]
- 201.Pandrangi R, Petras M, Ralph S & Vrzoc M Alkaline single cell gel (comet) assay and genotoxicity monitoring using bullheads and carp. Environ. Mol. Mutagen 26, 345–356 (1995). [DOI] [PubMed] [Google Scholar]
- 202.Pereira V et al. Marine macroalgae as a dietary source of genoprotection in gilthead seabream (Sparus aurata) against endogenous and exogenous challenges. Comp. Biochem. Physiol. Part C. Toxicol. Pharmacol 219, 12–24 (2019). [DOI] [PubMed] [Google Scholar]
- 203.Burlinson B et al. Fourth International Workgroup on Genotoxicity testing: results of the in vivo comet assay workgroup. Mutat. Res. Toxicol. Environ. Mutagen 627, 31–35 (2007). [DOI] [PubMed] [Google Scholar]
- 204.Hartmann A et al. Recommendations for conducting the in vivo alkaline comet assay. Mutagenesis 18, 45–51 (2003). [DOI] [PubMed] [Google Scholar]
- 205.Uno Y et al. JaCVAM-organized international validation study of the in vivo rodent alkaline comet assay for the detection of genotoxic carcinogens: II. Summary of definitive validation study results. Mutat. Res. Toxicol. Environ. Mutagen 786–788, 45–76 (2015). [DOI] [PubMed] [Google Scholar]
- 206.Morita T et al. The JaCVAM international validation study on the in vivo comet assay: selection of test chemicals. Mutat. Res. Toxicol. Environ. Mutagen 786–788, 14–44 (2015). [DOI] [PubMed] [Google Scholar]
- 207.Sasaki YF et al. The comet assay with multiple mouse organs: comparison of comet assay results and carcinogenicity with 208 chemicals selected from the IARC Monographs and U.S. NTP Carcinogenicity Database. Crit. Rev. Toxicol 30, 629–799 (2000). [DOI] [PubMed] [Google Scholar]
- 208.Uno Y et al. JaCVAM-organized international validation study of the in vivo rodent alkaline comet assay for the detection of genotoxic carcinogens: I. Summary of pre-validation study results. Mutat. Res. Toxicol. Environ. Mutagen 786–788, 3–13 (2015). [DOI] [PubMed] [Google Scholar]
- 209.Pool-Zobel BL et al. Assessment of genotoxic effects by Lindane. Food Chem. Toxicol 31, 271–283 (1993). [DOI] [PubMed] [Google Scholar]
- 210.Giovannelli L, Decorosi F, Dolara P & Pulvirenti L Vulnerability to DNA damage in the aging rat substantia nigra: a study with the comet assay. Brain Res 969, 244–247 (2003). [DOI] [PubMed] [Google Scholar]
- 211.Vestergaard S, Loft S & Møller P Role of inducible nitrogen oxide synthase in benzene-induced oxidative DNA damage in the bone marrow of mice. Free Radic. Biol. Med 32, 481–484 (2002). [DOI] [PubMed] [Google Scholar]
- 212.Doak SH & Dusinska M NanoGenotoxicology: present and the future. Mutagenesis 32, 1–4 (2017). [DOI] [PubMed] [Google Scholar]
- 213.Risom L, Møller P, Kristjansen P, Loft S & Vogel U X-ray-induced oxidative stress: DNA damage and gene expression of HO-1, ERCC1 and OGG1 in mouse lung. Free Radic. Res 37, 957–966 (2003). [DOI] [PubMed] [Google Scholar]
- 214.Schupp N, Schmid U, Heidland A & Stopper H New Approaches for the Treatment of Genomic Damage in End-Stage Renal Disease. J. Ren. Nutr 18, 127–133 (2008). [DOI] [PubMed] [Google Scholar]
- 215.Gunasekarana V A comprehensive review on clinical applications of comet assay. J. Clin. Diagnostic Res 9, GE01–GE05 (2015). [DOI] [PMC free article] [PubMed] [Google Scholar]
- 216.Gajski G et al. Analysis of health-related biomarkers between vegetarians and non-vegetarians: a multi-biomarker approach. J. Funct. Foods 48, 643–653 (2018). [Google Scholar]
- 217.Fagundes GE et al. Vitamin D3 as adjuvant in the treatment of type 2 diabetes mellitus: modulation of genomic and biochemical instability. Mutagenesis 34, 135–145 (2019). [DOI] [PubMed] [Google Scholar]
- 218.Macan TP et al. Brazil nut prevents oxidative DNA damage in type 2 diabetes patients. Drug Chem. Toxicol 45, 1066–1072 (2022). [DOI] [PubMed] [Google Scholar]
- 219.Kuchařová M et al. Comet assay and its use for evaluating oxidative DNA damage in some pathological states. Physiol. Res 68, 1–15 (2019). [DOI] [PubMed] [Google Scholar]
- 220.Møller P, Stopper H & Collins AR Measurement of DNA damage with the comet assay in high-prevalence diseases: current status and future directions. Mutagenesis 35, 5–18 (2020). [DOI] [PubMed] [Google Scholar]
- 221.Gomolka M et al. Age-dependent differences in DNA damage after in vitro CT exposure. Int. J. Radiat. Biol 94, 272–281 (2018). [DOI] [PubMed] [Google Scholar]
- 222.Ziegler BL et al. Short-term effects of early-acting and multilineage hematopoietic growth factors on the repair and proliferation of irradiated pure cord blood (CB) CD34 hematopoietic progenitor cells. Int. J. Radiat. Oncol 40, 1193–1203 (1998). [DOI] [PubMed] [Google Scholar]
- 223.Wyatt N et al. In vitro susceptibilities in lymphocytes from mothers and cord blood to the monofunctional alkylating agent EMS. Mutagenesis 22, 123–127 (2007). [DOI] [PubMed] [Google Scholar]
- 224.Wang L et al. Characterization of placenta-derived mesenchymal stem cells cultured in autologous human cord blood serum. Mol. Med. Rep 6, 760–766 (2012). [DOI] [PubMed] [Google Scholar]
- 225.Menon R et al. Senescence of primary amniotic cells via oxidative DNA damage. PLoS ONE 8, e83416 (2013). [DOI] [PMC free article] [PubMed] [Google Scholar]
- 226.Želježić D, Herceg Romanić S, Klinčić D, Matek Sarić M & Letinić JG Persistent organochlorine pollutants in placentas sampled from women in Croatia and an evaluation of their DNA damaging potential in vitro. Arch. Environ. Contam. Toxicol 74, 284–291 (2018). [DOI] [PubMed] [Google Scholar]
- 227.Chao M-R et al. Biomarkers of nucleic acid oxidation—a summary state-of-the-art. Redox Biol 42, 101872 (2021). [DOI] [PMC free article] [PubMed] [Google Scholar]
- 228.Møller P et al. Collection and storage of human white blood cells for analysis of DNA damage and repair activity using the comet assay in molecular epidemiology studies. Mutagenesis 36, 193–212 (2021). [DOI] [PubMed] [Google Scholar]
- 229.Collins AR The comet assay for DNA damage and repair: principles, applications, and limitations. Mol. Biotechnol 26, 249–261 (2004). [DOI] [PubMed] [Google Scholar]
- 230.Ladeira C & Smajdova L The use of genotoxicity biomarkers in molecular epidemiology: applications in environmental, occupational and dietary studies. AIMS Genet 4, 166–191 (2017). [DOI] [PMC free article] [PubMed] [Google Scholar]
- 231.Collins AR et al. Controlling variation in the comet assay. Front. Genet 5, 359 (2014). [DOI] [PMC free article] [PubMed] [Google Scholar]
- 232.Valverde M & Rojas E Environmental and occupational biomonitoring using the comet assay. Mutat. Res. Rev. Mutat. Res 681, 93–109 (2009). [DOI] [PubMed] [Google Scholar]
- 233.Gajski G et al. Application of the comet assay for the evaluation of DNA damage from frozen human whole blood samples: implications for human biomonitoring. Toxicol. Lett 319, 58–65 (2020). [DOI] [PubMed] [Google Scholar]
- 234.Gajski G, Gerić M, Oreščanin V & Garaj-Vrhovac V Cytogenetic status of healthy children assessed with the alkaline comet assay and the cytokinesis-block micronucleus cytome assay. Mutat. Res. Toxicol. Environ. Mutagen 750, 55–62 (2013). [DOI] [PubMed] [Google Scholar]
- 235.Garaj-Vrhovac V et al. Assessment of cytogenetic damage and oxidative stress in personnel occupationally exposed to the pulsed microwave radiation of marine radar equipment. Int. J. Hyg. Environ. Health 214, 59–65 (2011). [DOI] [PubMed] [Google Scholar]
- 236.Gerić M, Gajski G, Oreščanin V & Garaj-Vrhovac V Seasonal variations as predictive factors of the comet assay parameters: a retrospective study. Mutagenesis 33, 53–60 (2018). [DOI] [PubMed] [Google Scholar]
- 237.Azqueta A, Shaposhnikov S & Collins AR in The Comet Assay in Toxicology (eds Dhawan A & Anderson D) Ch. 2, 57–78 (RSC Publishing, 2009). [Google Scholar]
- 238.Gerić M et al. Cytogenetic status and oxidative stress parameters in patients with thyroid diseases. Mutat. Res. Toxicol. Environ. Mutagen 810, 22–29 (2016). [DOI] [PubMed] [Google Scholar]
- 239.Milić M et al. Alkaline comet assay results on fresh and one-year frozen whole blood in small volume without cryo-protection in a group of people with different health status. Mutat. Res. Toxicol. Environ. Mutagen 843, 3–10 (2019). [DOI] [PubMed] [Google Scholar]
- 240.Bankoglu EE et al. Reduction of DNA damage in peripheral lymphocytes of obese patients after bariatric surgery-mediated weight loss. Mutagenesis 33, 61–67 (2018). [DOI] [PubMed] [Google Scholar]
- 241.Milković Đ et al. Primary DNA damage assessed with the comet assay and comparison to the absorbed dose of diagnostic X-rays in children. Int. J. Toxicol 28, 405–416 (2009). [DOI] [PubMed] [Google Scholar]
- 242.Milić M et al. The hCOMET project: international database comparison of results with the comet assay in human biomonitoring. Baseline frequency of DNA damage and effect of main confounders. Mutat. Res. Rev. Mutat. Res 787, 108371 (2021). [DOI] [PMC free article] [PubMed] [Google Scholar]
- 243.Giovannelli L, Pitozzi V, Riolo S & Dolara P Measurement of DNA breaks and oxidative damage in polymorphonuclear and mononuclear white blood cells: a novel approach using the comet assay. Mutat. Res. Toxicol. Environ. Mutagen 538, 71–80 (2003). [DOI] [PubMed] [Google Scholar]
- 244.Martelli-Palomino G et al. DNA damage increase in peripheral neutrophils from patients with rheumatoid arthritis is associated with the disease activity and the presence of shared epitope. Clin. Exp. Rheumatol 35, 247–254 (2017). [PubMed] [Google Scholar]
- 245.McConnell JR, Crockard AD, Cairns AP & Bell AL Neutrophils from systemic lupus erythematosus patients demonstrate increased nuclear DNA damage. Clin. Exp. Rheumatol 20, 653–660 (2003). [PubMed] [Google Scholar]
- 246.Wong CH et al. Sevoflurane-induced oxidative stress and cellular injury in human peripheral polymorphonuclear neutrophils. Food Chem. Toxicol 44, 1399–1407 (2006). [DOI] [PubMed] [Google Scholar]
- 247.Zielińska-Przyjemska M, Olejnik A, Dobrowolska-Zachwieja A, Łuczak M & Baer-Dubowska W DNA damage and apoptosis in blood neutrophils of inflammatory bowel disease patients and in Caco-2 cells in vitro exposed to betanin. Postepy Hig. Med. Dosw 70, 265–271 (2016). [DOI] [PubMed] [Google Scholar]
- 248.Sul D et al. Single strand DNA breaks in T- and B-lymphocytes and granulocytes in workers exposed to benzene. Toxicol. Lett 134, 87–95 (2002). [DOI] [PubMed] [Google Scholar]
- 249.Sul D et al. DNA damage in T- and B-lymphocytes and granulocytes in emission inspection and incineration workers exposed to polycyclic aromatic hydrocarbons. Mutat. Res. Toxicol. Environ. Mutagen 538, 109–119 (2003). [DOI] [PubMed] [Google Scholar]
- 250.Marino M et al. Impact of 12-month cryopreservation on endogenous DNA damage in whole blood and isolated mononuclear cells evaluated by the comet assay. Sci. Rep 11, 363 (2021). [DOI] [PMC free article] [PubMed] [Google Scholar]
- 251.Al-Salmani K et al. Simplified method for the collection, storage, and comet assay analysis of DNA damage in whole blood. Free Radic. Biol. Med 51, 719–725 (2011). [DOI] [PubMed] [Google Scholar]
- 252.Bøhn SK, Vebraite V, Shaposhnikov S & Collins AR Isolation of leukocytes from frozen buffy coat for comet assay analysis of DNA damage. Mutat. Res. Toxicol. Environ. Mutagen 843, 18–23 (2019). [DOI] [PubMed] [Google Scholar]
- 253.Decordier I et al. Genetic susceptibility of newborn daughters to oxidative stress. Toxicol. Lett 172, 68–84 (2007). [DOI] [PubMed] [Google Scholar]
- 254.Knudsen LE & Hansen ÅM Biomarkers of intermediate endpoints in environmental and occupational health. Int. J. Hyg. Environ. Health 210, 461–470 (2007). [DOI] [PubMed] [Google Scholar]
- 255.Norishadkam M, Andishmand S, Zavar reza J, Zare Sakhvidi MJ & Hachesoo VR Oxidative stress and DNA damage in the cord blood of preterm infants. Mutat. Res. Toxicol. Environ. Mutagen 824, 20–24 (2017). [DOI] [PubMed] [Google Scholar]
- 256.Gelaleti RB, Damasceno DC, Santos DP, Calderon IMP & Rudge MVC Increased DNA damage is related to maternal blood glucose levels in the offspring of women with diabetes and mild gestational hyperglycemia. Reprod. Sci 23, 318–323 (2016). [DOI] [PubMed] [Google Scholar]
- 257.Oßwald K, Mittas A, Glei M & Pool-Zobel BL New revival of an old biomarker: characterisation of buccal cells and determination of genetic damage in the isolated fraction of viable leucocytes. Mutat. Res. Rev. Mutat. Res 544, 321–329 (2003). [DOI] [PubMed] [Google Scholar]
- 258.Feretti D et al. Monitoring air pollution effects on children for supporting public health policy: the protocol of the prospective cohort MAPEC study. BMJ Open 4, e006096 (2014). [DOI] [PMC free article] [PubMed] [Google Scholar]
- 259.Zani C et al. Comet test in saliva leukocytes of pre-school children exposed to air pollution in North Italy: the Respira study. Int. J. Environ. Res. Public Health 17, 3276 (2020). [DOI] [PMC free article] [PubMed] [Google Scholar]
- 260.Rojas E, Lorenzo Y, Haug K, Nicolaissen B & Valverde M Epithelial cells as alternative human biomatrices for comet assay. Front. Genet 5, 386 (2014). [DOI] [PMC free article] [PubMed] [Google Scholar]
- 261.Souto EB et al. Ocular cell lines and genotoxicity assessment. Int. J. Environ. Res. Public Health 17, 2046 (2020). [DOI] [PMC free article] [PubMed] [Google Scholar]
- 262.Rojas E, Valverde M, Sordo M & Ostrosky-Wegman P DNA damage in exfoliated buccal cells of smokers assessed by the single cell gel electrophoresis assay. Mutat. Res. Toxicol 370, 115–120 (1996). [DOI] [PubMed] [Google Scholar]
- 263.Sánchez-Alarcón J, Milić M, Gómez-Arroyo S, Montiel-González JMR & Valencia-Quintana R in Environmental Health Risk - Hazardous Factors to Living Species (eds Larramendy ML & Soloneski S) (IntechOpen, 2016); 10.5772/62760 [DOI] [Google Scholar]
- 264.Valverde M et al. DNA damage in leukocytes and buccal and nasal epithelial cells of individuals exposed to air pollution in Mexico City. Environ. Mol. Mutagen 30, 147–152 (1997). [PubMed] [Google Scholar]
- 265.Calderón-Garcidueñas L et al. 8-Hydroxy-2′-deoxyguanosine, a major mutagenic oxidative DNA lesion, and DNA strand breaks in nasal respiratory epithelium of children exposed to urban pollution. Environ. Health Perspect 107, 469–474 (1999). [DOI] [PMC free article] [PubMed] [Google Scholar]
- 266.Godderis L et al. Influence of genetic polymorphisms on biomarkers of exposure and genotoxic effects in styrene-exposed workers. Environ. Mol. Mutagen 44, 293–303 (2004). [DOI] [PubMed] [Google Scholar]
- 267.Koreck A et al. Effects of intranasal phototherapy on nasal mucosa in patients with allergic rhinitis. J. Photochem. Photobiol. B Biol 89, 163–169 (2007). [DOI] [PubMed] [Google Scholar]
- 268.Akkaş H, Aydın E, Türkoğlu-Babakurban S, Yurtcu E & Yılmaz-Özbek Ö Effect of mometasone furoate nasal spray on the DNA of nasal mucosal cells. Turk. J. Med. Sci 48, 339–345 (2018). [DOI] [PubMed] [Google Scholar]
- 269.Anderson D Factors that contribute to biomarker responses in humans including a study in individuals taking vitamin C supplementation. Mutat. Res. Mol. Mech. Mutagen 480–481, 337–347 (2001). [DOI] [PubMed] [Google Scholar]
- 270.Baumeister P, Huebner T, Reiter M, Schwenk-Zieger S & Harréus U Reduction of oxidative DNA fragmentation by ascorbic acid, zinc and N-acetylcysteine in nasal mucosa tissue cultures. Anticancer Res 29, 4571–4574 (2009). [PubMed] [Google Scholar]
- 271.Koehler C et al. Aspects of nitrogen dioxide toxicity in environmental urban concentrations in human nasal epithelium. Toxicol. Appl. Pharmacol 245, 219–225 (2010). [DOI] [PubMed] [Google Scholar]
- 272.Reiter M, Rupp K, Baumeister P, Zieger S & Harréus U Antioxidant effects of quercetin and coenzyme Q10 in mini organ cultures of human nasal mucosa cells. Anticancer Res 29, 33–39 (2009). [PubMed] [Google Scholar]
- 273.Mrowicka M, Zielinska-Blizniewska H, Milonski J, Olszewski J & Majsterek I Evaluation of oxidative DNA damage and antioxidant defense in patients with nasal polyps. Redox Rep 20, 177–183 (2015). [DOI] [PMC free article] [PubMed] [Google Scholar]
- 274.Zhang J et al. DNA damage in lens epithelial cells and peripheral lymphocytes from age-related cataract patients. Ophthalmic Res 51, 124–128 (2014). [DOI] [PubMed] [Google Scholar]
- 275.Rojas E et al. Evaluation of DNA damage in exfoliated tear duct epithelial cells from individuals exposed to air pollution assessed by single cell gel electrophoresis assay. Mutat. Res. Toxicol. Environ. Mutagen 468, 11–17 (2000). [DOI] [PubMed] [Google Scholar]
- 276.Gajski G et al. Application of the comet assay for the evaluation of DNA damage in mature sperm. Mutat. Res. Rev. Mutat. Res 788, 108398 (2021). [DOI] [PubMed] [Google Scholar]
- 277.Sipinen V et al. In vitro evaluation of baseline and induced DNA damage in human sperm exposed to benzo[a]pyrene or its metabolite benzo[a]pyrene-7,8-diol-9,10-epoxide, using the comet assay. Mutagenesis 25, 417–425 (2010). [DOI] [PMC free article] [PubMed] [Google Scholar]
- 278.Hamilton TR, dos S & Assumpção MEOD Sperm DNA fragmentation: causes and identification. Zygote 28, 1–8 (2020). [DOI] [PubMed] [Google Scholar]
- 279.Agarwal A, Barbăroșie C, Ambar R & Finelli R The impact of single- and double-strand DNA breaks in human spermatozoa on assisted reproduction. Int. J. Mol. Sci 21, 3882 (2020). [DOI] [PMC free article] [PubMed] [Google Scholar]
- 280.Sugihara A, Van Avermaete F, Roelant E, Punjabi U & De Neubourg D The role of sperm DNA fragmentation testing in predicting intra-uterine insemination outcome: a systematic review and meta-analysis. Eur. J. Obstet. Gynecol. Reprod. Biol 244, 8–15 (2020). [DOI] [PubMed] [Google Scholar]
- 281.Simon L, Aston KI, Emery BR, Hotaling J & Carrell DT Sperm DNA damage output parameters measured by the alkaline comet assay and their importance. Andrologia 49, e12608 (2017). [DOI] [PubMed] [Google Scholar]
- 282.Nicopoullos J et al. Novel use of COMET parameters of sperm DNA damage may increase its utility to diagnose male infertility and predict live births following both IVF and ICSI. Hum. Reprod 34, 1915–1923 (2019). [DOI] [PubMed] [Google Scholar]
- 283.Simon L et al. Clinical significance of sperm DNA damage in assisted reproduction outcome. Hum. Reprod 25, 1594–1608 (2010). [DOI] [PubMed] [Google Scholar]
- 284.Albert O, Reintsch WE, Chan P & Robaire B HT-COMET: a novel automated approach for high throughput assessment of human sperm chromatin quality. Hum. Reprod 31, 938–946 (2016). [DOI] [PMC free article] [PubMed] [Google Scholar]
- 285.Fry RC, Bangma J, Szilagyi J & Rager JE Developing novel in vitro methods for the risk assessment of developmental and placental toxicants in the environment. Toxicol. Appl. Pharmacol 378, 114635 (2019). [DOI] [PMC free article] [PubMed] [Google Scholar]
- 286.Vähäkangas K et al. in Biomarkers in Toxicology 325–360 (Elsevier, 2014). [Google Scholar]
- 287.Kohn KW, Ewig RAG, Erickson LC & Zwelling LA in DNA Repair: A Laboratory Manual of Research Procedures (eds. Friedberg EC & Hanawalt PC) 379–401 (Marcel Dekker Inc, 1981). [Google Scholar]
- 288.Ahnström G & Erixon K in DNA Repair: A Laboratory Manual of Research Procedures (eds. Friedberg EC & Hanawalt PC) 403–418 (Marcel Dekker Inc, 1981). [Google Scholar]
- 289.Gedik CM, Boyle SP, Wood SG, Vaughan NJ & Collins AR Oxidative stress in humans: validation of biomarkers of DNA damage. Carcinogenesis 23, 1441–1446 (2002). [DOI] [PubMed] [Google Scholar]
- 290.Pflaum M, Will O & Epe B Determination of steady-state levels of oxidative DNA base modifications in mammalian cells by means of repair endonucleases. Carcinogenesis 18, 2225–2231 (1997). [DOI] [PubMed] [Google Scholar]
- 291.Fujiwara H & Ito M Nonisotopic cytosine extension assay: a highly sensitive method to evaluate CpG island methylation in the whole genome. Anal. Biochem 307, 386–389 (2002). [DOI] [PubMed] [Google Scholar]
- 292.Azqueta A & Collins A The essential comet assay: a comprehensive guide to measuring DNA damage and repair. Arch. Toxicol 87, 949–968 (2013). [DOI] [PubMed] [Google Scholar]
- 293.Azqueta A et al. The influence of scoring method on variability in results obtained with the comet assay. Mutagenesis 26, 393–399 (2011). [DOI] [PubMed] [Google Scholar]
- 294.Møller P et al. On the search for an intelligible comet assay descriptor. Front. Genet 17, 217 (2014). [DOI] [PMC free article] [PubMed] [Google Scholar]
- 295.Collins A et al. The comet assay as a tool for human biomonitoring studies: the ComNet Project. Mutat. Res. Rev. Mutat. Res 759, 27–39 (2014). [DOI] [PubMed] [Google Scholar]
- 296.Azqueta A, Gutzkow KB, Brunborg G & Collins AR Towards a more reliable comet assay: optimising agarose concentration, unwinding time and electrophoresis conditions. Mutat. Res. Toxicol. Environ. Mutagen 724, 41–45 (2011). [DOI] [PubMed] [Google Scholar]
- 297.Ersson C & Moller L The effects on DNA migration of altering parameters in the comet assay protocol such as agarose density, electrophoresis conditions and durations of the enzyme or the alkaline treatments. Mutagenesis 26, 689–695 (2011). [DOI] [PubMed] [Google Scholar]
- 298.Kumaravel TS, Vilhar B, Faux SP & Jha AN Comet assay measurements: a perspective. Cell Biol. Toxicol 25, 53–64 (2009). [DOI] [PubMed] [Google Scholar]
- 299.Kumaravel TS & Jha AN Reliable comet assay measurements for detecting DNA damage induced by ionising radiation and chemicals. Mutat. Res 605, 7–16 (2006). [DOI] [PubMed] [Google Scholar]
- 300.Langie SAS, Azqueta A & Collins AR The comet assay: past, present, and future. Front. Genet 6, 266 (2015). [DOI] [PMC free article] [PubMed] [Google Scholar]
- 301.Kohn KW, Erickson LC & Ewig RAG Fractionation of DNA from mammalian cells by alkaline elution. Biochemistry 15, 4629–4637 (1976). [DOI] [PubMed] [Google Scholar]
- 302.García O et al. Sensitivity and variability of visual scoring in the comet assay. Mutat. Res. Mol. Mech. Mutagen 556, 25–34 (2004). [DOI] [PubMed] [Google Scholar]
- 303.Bonassi S et al. DNA damage in circulating leukocytes measured with the comet assay may predict the risk of death. Sci. Rep 11, 16793 (2021). [DOI] [PMC free article] [PubMed] [Google Scholar]
- 304.Anderson D, Yu T-W & McGregor DB Comet assay responses as indicators of carcinogen exposure. Mutagenesis 13, 539–555 (1998). [DOI] [PubMed] [Google Scholar]
- 305.Bowen DE et al. Evaluation of a multi-endpoint assay in rats, combining the bone-marrow micronucleus test, the comet assay and the flow-cytometric peripheral blood micronucleus test. Mutat. Res. Toxicol. Environ. Mutagen 722, 7–19 (2011). [DOI] [PubMed] [Google Scholar]
- 306.Kirkland D et al. A comparison of transgenic rodent mutation and in vivo comet assay responses for 91 chemicals. Mutat. Res. Toxicol. Environ. Mutagen 839, 21–35 (2019). [DOI] [PMC free article] [PubMed] [Google Scholar]
- 307.Akor-Dewu MB et al. Leucocytes isolated from simply frozen whole blood can be used in human biomonitoring for DNA damage measurement with the comet assay. Cell Biochem. Funct 32, 299–302 (2014). [DOI] [PubMed] [Google Scholar]
- 308.Ladeira C, Koppen G, Scavone F & Giovannelli L The comet assay for human biomonitoring: effect of cryopreservation on DNA damage in different blood cell preparations. Mutat. Res. Toxicol. Environ. Mutagen 843, 11–17 (2019). [DOI] [PubMed] [Google Scholar]
- 309.Hininger I et al. Assessment of DNA damage by comet assay on frozen total blood: method and evaluation in smokers and non-smokers. Mutat. Res. Toxicol. Environ. Mutagen 558, 75–80 (2004). [DOI] [PubMed] [Google Scholar]
- 310.Koppen G et al. The comet assay in human biomonitoring: cryopreservation of whole blood and comparison with isolated mononuclear cells. Mutagenesis 33, 41–47 (2018). [DOI] [PubMed] [Google Scholar]
- 311.Bankoglu EE et al. Effect of cryopreservation on DNA damage and DNA repair activity in human blood samples in the comet assay. Arch. Toxicol 95, 1831–1841 (2021). [DOI] [PMC free article] [PubMed] [Google Scholar]
- 312.Azqueta A, Enciso JM, Pastor L, López de Cerain A & Vettorazzi A Applying the comet assay to fresh vs frozen animal solid tissues: a technical approach. Food Chem. Toxicol 132, 110671 (2019). [DOI] [PubMed] [Google Scholar]
- 313.Møller P et al. Searching for assay controls for the Fpg- and hOGG1-modified comet assay. Mutagenesis 33, 9–19 (2018). [DOI] [PubMed] [Google Scholar]
- 314.Pfuhler S, Downs TR, Allemang AJ, Shan Y & Crosby ME Weak silica nanomaterial-induced genotoxicity can be explained by indirect DNA damage as shown by the OGG1-modified comet assay and genomic analysis. Mutagenesis 32, 5–12 (2017). [DOI] [PubMed] [Google Scholar]
- 315.Speit G, Trenz K, Schütz P, Rothfuß A & Merk O The influence of temperature during alkaline treatment and electrophoresis on results obtained with the comet assay. Toxicol. Lett 110, 73–78 (1999). [DOI] [PubMed] [Google Scholar]
- 316.Sirota NP et al. Some causes of inter-laboratory variation in the results of comet assay. Mutat. Res. Toxicol. Environ. Mutagen 770, 16–22 (2014). [DOI] [PubMed] [Google Scholar]
- 317.Singh NP, Stephens RE & Schneider EL Modifications of alkaline microgel electrophoresis for sensitive detection of DNA damage. Int. J. Radiat. Biol 66, 23–28 (1994). [DOI] [PubMed] [Google Scholar]
- 318.Møller P, Loft S, Lundby C & Olsen NV Acute hypoxia and hypoxic exercise induce DNA strand breaks and oxidative DNA damage in humans. FASEB J 15, 1181–1186 (2001). [DOI] [PubMed] [Google Scholar]
- 319.Ji Y, Karbaschi M & Cooke MS Mycoplasma infection of cultured cells induces oxidative stress and attenuates cellular base excision repair activity. Mutat. Res. Toxicol. Environ. Mutagen 845, 403054 (2019). [DOI] [PMC free article] [PubMed] [Google Scholar]
- 320.Zarcone MC et al. Cellular response of mucociliary differentiated primary bronchial epithelial cells to diesel exhaust. Am. J. Physiol. Cell. Mol. Physiol 311, L111–L123 (2016). [DOI] [PubMed] [Google Scholar]
- 321.Eleršek T, Plazar J & Filipič M A method for the assessment of DNA damage in individual, one day old, zebrafish embryo (Danio rerio), without prior cell isolation. Toxicol. Vitr 27, 2156–2159 (2013). [DOI] [PubMed] [Google Scholar]
- 322.Martins C & Costa PM Technical updates to the comet assay in vivo for assessing DNA damage in zebrafish embryos from fresh and frozen cell suspensions. Zebrafish 17, 220–228 (2020). [DOI] [PubMed] [Google Scholar]
- 323.Koppen G & Angelis KJ Repair of X-ray induced DNA damage measured by the comet assay in roots of Vicia faba. Environ. Mol. Mutagen 32, 281–285 (1998). [PubMed] [Google Scholar]
- 324.Koppen G, Toncelli L, Triest L & Verschaeve L The comet assay: a tool to study alteration of DNA integrity in developing plant leaves. Mech. Ageing Dev 110, 13–24 (1999). [DOI] [PubMed] [Google Scholar]
- 325.Jackson P et al. Validation of freezing tissues and cells for analysis of DNA strand break levels by comet assay. Mutagenesis 28, 699–707 (2013). [DOI] [PMC free article] [PubMed] [Google Scholar]
- 326.Belpaeme K, Cooreman K & Kirsch-Volders M Development and validation of the in vivo alkaline comet assay for detecting genomic damage in marine flatfish. Mutat. Res. Toxicol. Environ. Mutagen 415, 167–184 (1998). [DOI] [PubMed] [Google Scholar]
- 327.Braz MG & Karahalil B Genotoxicity of anesthetics evaluated in vivo (animals). Biomed. Res. Int 2015, 1–8 (2015). [DOI] [PMC free article] [PubMed] [Google Scholar]
- 328.Fernández-Bertólez N, Azqueta A, Pásaro E, Laffon B & Valdiglesias V Salivary leucocytes as suitable biomatrix for the comet assay in human biomonitoring studies. Arch. Toxicol 95, 2179–2187 (2021). [DOI] [PMC free article] [PubMed] [Google Scholar]
- 329.Russo C, Acito M, Fatigoni C, Villarini M & Moretti M B-comet assay (comet assay on buccal cells) for the evaluation of primary DNA damage in human biomonitoring studies. Int. J. Environ. Res. Public Health 17, 9234 (2020). [DOI] [PMC free article] [PubMed] [Google Scholar]
- 330.Fortoul TI et al. Single-cell gel electrophoresis assay of nasal epithelium and leukocytes from asthmatic and nonasthmatic subjects in Mexico City. Arch. Environ. Health 58, 348–352 (2003). [PubMed] [Google Scholar]
- 331.Osnes-Ringen Ø et al. DNA damage in lens epithelium of cataract patients in vivo and ex vivo. Acta Ophthalmol 91, 652–656 (2013). [DOI] [PubMed] [Google Scholar]
- 332.Olsen A-K et al. Highly efficient base excision repair (BER) in human and rat male germ cells. Nucleic Acids Res 29, 1781–1790 (2001). [DOI] [PMC free article] [PubMed] [Google Scholar]
- 333.Lorenzo Y, Costa S, Collins AR & Azqueta A The comet assay, DNA damage, DNA repair and cytotoxicity: hedgehogs are not always dead. Mutagenesis 28, 427–432 (2013). [DOI] [PubMed] [Google Scholar]
- 334.Henderson L, Wolfreys A, Fedyk J, Bourner C & Windebank S The ability of the comet assay to discriminate between genotoxins and cytotoxins. Mutagenesis 13, 89–94 (1998). [DOI] [PubMed] [Google Scholar]
- 335.Pfuhler S & Wolf HU Detection of DNA-crosslinking agents with the alkaline comet assay. Environ. Mol. Mutagen 27, 196–201 (1996). [DOI] [PubMed] [Google Scholar]
- 336.Møller P, Wallin H, Dybdahl M, Frentz G & Nexø BA Psoriasis patients with basal cell carcinoma have more repair-mediated DNA strand-breaks after UVC damage in lymphocytes than psoriasis patients without basal cell carcinoma. Cancer Lett 151, 187–192 (2000). [DOI] [PubMed] [Google Scholar]
- 337.Møller P, Knudsen LE, Loft S & Wallin H The comet assay as a rapid test in biomonitoring occupational exposure to DNA-damaging agents and effect of confounding factors. Cancer Epidemiol. Biomark. Prev 9, 1005–1015 (2000). [PubMed] [Google Scholar]
- 338.Jensen A et al. Influence of the OGG1 Ser326Cys polymorphism on oxidatively damaged DNA and repair activity. Free Radic. Biol. Med 52, 118–125 (2012). [DOI] [PubMed] [Google Scholar]
- 339.Shaposhnikov SA, Salenko VB, Brunborg G, Nygren J & Collins AR Single-cell gel electrophoresis (the comet assay): loops or fragments? Electrophoresis 29, 3005–3012 (2008). [DOI] [PubMed] [Google Scholar]
- 340.Vesterdal LK et al. Accumulation of lipids and oxidatively damaged DNA in hepatocytes exposed to particles. Toxicol. Appl. Pharmacol 274, 350–360 (2014). [DOI] [PubMed] [Google Scholar]
Associated Data
This section collects any data citations, data availability statements, or supplementary materials included in this article.
Supplementary Materials
Data Availability Statement
The majority of the data shown here as examples or anticipated results are available in the original papers. Figures 12 and 14–16 are theoretical results, which are inspired by unpublished work from the authors’ laboratories. Other supporting data are available upon reasonable request to the corresponding author.