

SUMMARY
Enabling and constraining immune activation is of fundamental importance in maintaining cellular homeostasis. Depleting BAK1 and SERK4, the co-receptors of multiple pattern recognition receptors (PRRs), abolishes pattern-triggered immunity but triggers intracellular NLR-mediated autoimmunity with an elusive mechanism. By deploying RNAi-based genetic screens in Arabidopsis, we identified BAK-TO-LIFE 2 (BTL2), an uncharacterized receptor kinase, sensing BAK1/SERK4 integrity. BTL2 induces autoimmunity through activating Ca2+ channel CNGC20 in a kinase-dependent manner when BAK1/SERK4 are perturbed. To compensate for BAK1 deficiency, BTL2 complexes with multiple phytocytokine receptors, leading to potent phytocytokine responses mediated by helper NLR ADR1 family immune receptors, suggesting phytocytokine signaling as a molecular link connecting PRR- and NLR-mediated immunity. Remarkably, BAK1 constrains BTL2 activation via specific phosphorylation to maintain cellular integrity. Thus, BTL2 serves as a surveillance rheostat sensing the perturbation of BAK1/SERK4 immune co-receptors in promoting NLR-mediated phytocytokine signaling to ensure plant immunity.
Keywords: Immune homeostasis, leucine-rich repeat receptor kinase, pattern recognition receptor (PRR), NOD-like receptor (NLR), coreceptor, phytocytokine, phosphorylation
Graphical Abstract

IN BRIEF
In Arabidopsis, BTL2 functions as an alternative surveillance system for activating multiple phytocytokine signaling in the absence of the core co-receptors of various pattern recognition receptors, which highlights insights into the maintenance of immune homeostasis.
INTRODUCTION
Plants have evolved an expanded number of plasma membrane-resident receptor kinases (RKs) to regulate growth, reproduction, and immunity1–3. Leucine-rich repeat (LRR)-RKs constitute the largest group of the RK family in Arabidopsis4. The extracellular LRR domain perceives cognate ligands and contributes to the LRR-RK functional specificity4. LRR-RKs FLAGELLIN SENSING 2 (FLS2) and EF-Tu RECEPTOR (EFR) are pattern recognition receptors (PRRs) that perceive microbe-associated molecular patterns (MAMPs) bacterial flagellin and elongation factor-Tu (EF-Tu), respectively, and induce pattern-triggered immunity (PTI)5,6. PTI is interconnected with effector-triggered immunity (ETI) mediated by intracellular NOD-like receptors (NLRs) with mutual potentiation7–10.
LRR-RKs also recognize plant-derived danger-associated molecular patterns (DAMPs) and immunomodulatory phytocytokines for danger-triggered immunity (DTI)11–15. PLANT ENDOGENOUS PEPTIDE 1 (PEP1) RECEPTOR 1 (PEPR1)/PEPR2 recognize PEP peptides to amplify the immune signaling16,17, and PLANT SCREW UNRESPONSIVE RECEPTOR (NUT) perceives SMALL PHYTOCYTOKINES REGULATING DEFENSE AND WATER LOSS (SCREWs) peptides to regulate water potential during infection18,19. MALE DISCOVERER 1-INTERACTING RECEPTOR-LIKE KINASE 2 (MIK2) mediates plant immunity by recognizing plant- and microbe-derived SERINE-RICH ENDOGENOUS PEPTIDEs (SCOOPs)20,21.
Upon the ligand perception, LRR-RK receptors often recruit the co-receptors of BRASSINOSTEROID (BR) INSENSITIVE 1 (BRI1)-ASSOCIATED RECEPTOR KINASE 1 (BAK1), also named SOMATIC EMBRYOGENESIS RECEPTOR-LIKE KINASE 3 (SERK3), and other SERKs22–24. BAK1 and SERK4 redundantly and negatively regulate plant autoimmunity25,26. The bak1–4/serk4–1 null mutant is post-embryonic seedling lethal with H2O2 and pathogenesis-related (PR) protein elevation25. RNAi-based genetic screens using virus-induced gene silencing (VIGS) of BAK1 and SERK4 on Arabidopsis T-DNA insertional mutants have identified regulators of bak1/serk4 autoimmunity, including STAUROSPORIN AND TEMPERATURE SENSITIVE3 (STT3a), a subunit of oligosaccharyltransferase complex involved in protein N-glycosylation, and CYCLIC NUCLEOTIDE-GATED CHANNEL 20 (CNGC20)/CNGC19 regulating calcium homeostasis27,28. Suppressor screens of the bak1–3/serk4–1 weak allele revealed that nucleoporin proteins and DEAD-box RNA helicase DRH1, which might mediate nucleocytoplasmic trafficking of mRNAs regulating defense hormone salicylic acid, are involved in bak1/serk4 autoimmunity29. Helper NLRs ACTIVATED DISEASE RESISTANCE 1 (ADR1), ADR1-L1, and ADR1-L2, and paired NLRs CHILLING SENSITIVE 3 (CHS3) and CONSTITUTIVE SHADE-AVOIDANCE1 (CSA1) are also involved in bak1–3/serk4–1 autoimmunity30–32.
In this study, we identified a previously uncharacterized LRR-RK, named BAK-TO-LIFE 2 (BTL2), mutations of which nearly completely suppress the autoimmunity of the bak1–4/serk4–1 null allele. The increased BTL2 expression triggers autoimmunity, which is suppressed by BAK1-mediated phosphorylation. BTL2 associates with CNGC20 and activates its Ca2+ channel activity in promoting autoimmunity. Furthermore, BTL2 is essential for PEP- and SCOOP-triggered immune responses in bak1 mutants, highlighting its role in promoting multiple phytocytokine signaling to compensate for the absence of BAK1. Moreover, PEP/SCOOP-mediated resistance depends on helper NLR ADR1s, implying the activation of DTI by PTI further links to ETI. Thus, the BAK1-mediated BTL2 phosphorylation keeps BTL2 inactive to suppress autoimmunity, which otherwise activates Ca2+ channels and phytocytokine signaling, leading to NLR-mediated immune overactivation. BTL2 is likely evolved as an alternative surveillance system, functioning with multiple phytocytokine receptors to compensate for the compromised PTI upon the perturbation of BAK1/SERK4 coreceptors.
RESULTS
The btl2 mutants specifically suppress bak1/serk4 autoimmunity.
Multiple RKs deploy BAK1/SERK4 as co-receptors in regulating diverse cellular signaling33,34. We examined the involvement of RKs in BAK1/SERK4-regulated cell death by a VIGS-based suppressor screen towards homozygous T-DNA insertion rk mutants (Table S1). One mutant bak to life 2–1 (btl2–1, salk_033924c), carrying a T-DNA insertion in AT1G34420 (BTL2), suppressed the growth defects triggered by silencing BAK1/SERK4 compared to wild-type (WT) Col-0 plants (Figures 1A and S1A). Two additional mutant alleles, CS800007 (btl2–2) and salk_109214c (btl2–3), exhibited similar suppression phenotypes as btl2–1 (Figures 1A, S1A, and S1B). RT-PCR analysis showed diminished BTL2 transcripts in btl2 mutants (Figure S1C). Trypan blue and 3, 3’-diaminobenzidine (DAB) staining indicated that spontaneous cell death and elevated H2O2 accumulation were abolished in btl2 mutants upon silencing BAK1/SERK4 (Figure 1B). Additionally, the expression of PR1 and PR2, as well as SENESCENCE-ASSOCIATED GENE 13 (SAG13) and SAG14, was reduced in btl2 mutants compared to WT plants upon silencing BAK1/SERK4 (Figures 1C and S1D).
Figure 1. The btl2 mutants suppress BAK1/SERK4-regulated autoimmunity.

(A) The btl2 mutants suppress growth defects triggered by RNAi-BAK1/SERK4. Plant phenotypes are shown two weeks after VIGS of BAK1/SERK4 or the empty vector (Ctrl). Scale bars, 1 cm. (B) The btl2 mutants suppress cell death and H2O2 production triggered by RNAi-BAK1/SERK4. Plant leaves were stained with trypan blue for cell death (top) and DAB for H2O2 accumulation (bottom). Scale bars, 5 mm.
(C) The btl2 mutants suppress PR1 and PR2 expression triggered by RNAi-BAK1/SERK4. The expression of PR1 and PR2 was normalized to that of UBQ10. The data are shown as mean ± SD (n = 4). Different letters denote statistically significant differences according to one-way ANOVA followed by the Tukey test (P < 0.05).
(D-F) Complementation of btl2 with pBTL2::gBTL2-HA restores growth defects (D), cell death and H2O2 production (E), PR1 and PR2 expression (F) triggered by RNAi-BAK1/SERK4. CL1 and CL2 are two lines with protein shown by an α-HA immunoblot (IB) (D). Protein loading is shown by Ponceau S staining (Ponc.) for RuBisCo (RBC). The experiments and data analysis were performed as in A-C, respectively.
(G-H) The btl2–1 mutant rescues the seedling lethality of bak1–4/serk4–1. Soil-grown seedlings are shown at 21 days post-germination (dpg) (G), 35 dpg (H, left), and 49 dpg (H, right). bak1–4/serk4–1 was at 12 dpg (G). Scale bars, 1 cm (G, top). Cell death and H2O2 accumulation are shown on the middle and bottom panels (G), respectively. Scale bars, 1 mm.
(I) The btl2 mutant does not suppress cell death triggered by RNAi-BIR1 or RNAi-MEKK1. Scale bars, 1 cm.
The experiments were repeated three times with similar results.
To verify whether T-DNA insertions in BTL2 suppress RNAi-BAK1/SERK4 cell death, we transformed the BTL2 genomic DNA with an HA tag under its native promoter (pBTL2::gBTL2-HA) into btl2–1. Two representative complementation lines restored the growth defects triggered by RNAi-BAK1/SERK4 (Figure 1D). Furthermore, silencing BAK1/SERK4 restored cell death, H2O2 accumulation, and expression of PR1, PR2, SAG13, and SAG14 in complementation lines comparable to WT (Figures 1E, 1F, and S1E). The data validate that mutations in BTL2 suppressed RNAi-BAK1/SERK4 cell death.
The bak1–4/serk4–1/btl2–1 triple mutant substantially overcame the seedling lethality of bak1–4/serk4–1 (Figures 1G and S1F). Plants developed stems and seeds, although short petioles and compact rosette leaves were observed at the flowering stage (Figure 1H), likely due to defects in plant hormone BR signaling35–37. In addition, elevated cell death, H2O2 accumulation, and expression of PR1, PR2, SAG13, and SAG14 were blocked in bak1–4/serk4–1/btl2–1 compared to bak1–4/serk4–1 (Figures 1G, S1G, and S1H). Thus, mutations in BTL2 suppressed bak1–4/serk4–1 autoimmunity.
Depletion of BAK1-INTERACTING RLK 1 (BIR1) or downstream mitogen-activated protein kinase (MAPK) kinase kinase MEKK1 induces autoimmunity38–40. However, silencing MEKK1 or BIR1 triggered similar growth defects in btl2–1 and WT (Figure 1I), suggesting that BTL2 might not be involved in MEKK1- or BIR1-regulated autoimmunity. The data corroborate distinct mechanisms regulating bak1/serk4, bir1, and mekk1 autoimmunity27,28,41 and highlight a specific role of BTL2 in regulating bak1/serk4 autoimmunity.
Increased BTL2 expression induces autoimmunity.
The BTL2 transcript level was elevated in bak1–4/serk4–1 compared to WT (Figure 2A). To test whether the bak1–4/serk4–1 autoimmunity is associated with the increased expression of BTL2, we transformed pBTL2::gBTL2-HA into bak1–4/serk4–1/btl2–1. The restoration of growth defects, cell death, H2O2 accumulation, and PR gene expression in bak1–4/serk4–1/btl2–1 was positively correlated with the BTL2-HA protein accumulation (Figures 2B–2D), strengthening the importance of the BTL2 protein abundance in triggering autoimmunity. When pBTL2::gBTL2-HA was transformed into WT, among 55 T1 transgenic lines, 22 (40%) exhibited different levels of growth defects, including 7% tiny not viable plants (L1), 11% severely dwarfed plants (L2), and 22% moderately stunted plants with dark green leaves (L3) (Figure 2E). The BTL2-HA expression in transgenic plants was correlated with the severity of cell death, H2O2 accumulation, and PR gene expression (Figures 2F and 2G). In addition, BTL2 over-expression activated the PR1 promoter fused with the luciferase reporter (pPR1::LUC) (Figure 2H). Together, increased expression of BTL2 induces plant autoimmunity.
Figure 2. Increased expression of BTL2 induces autoimmunity.
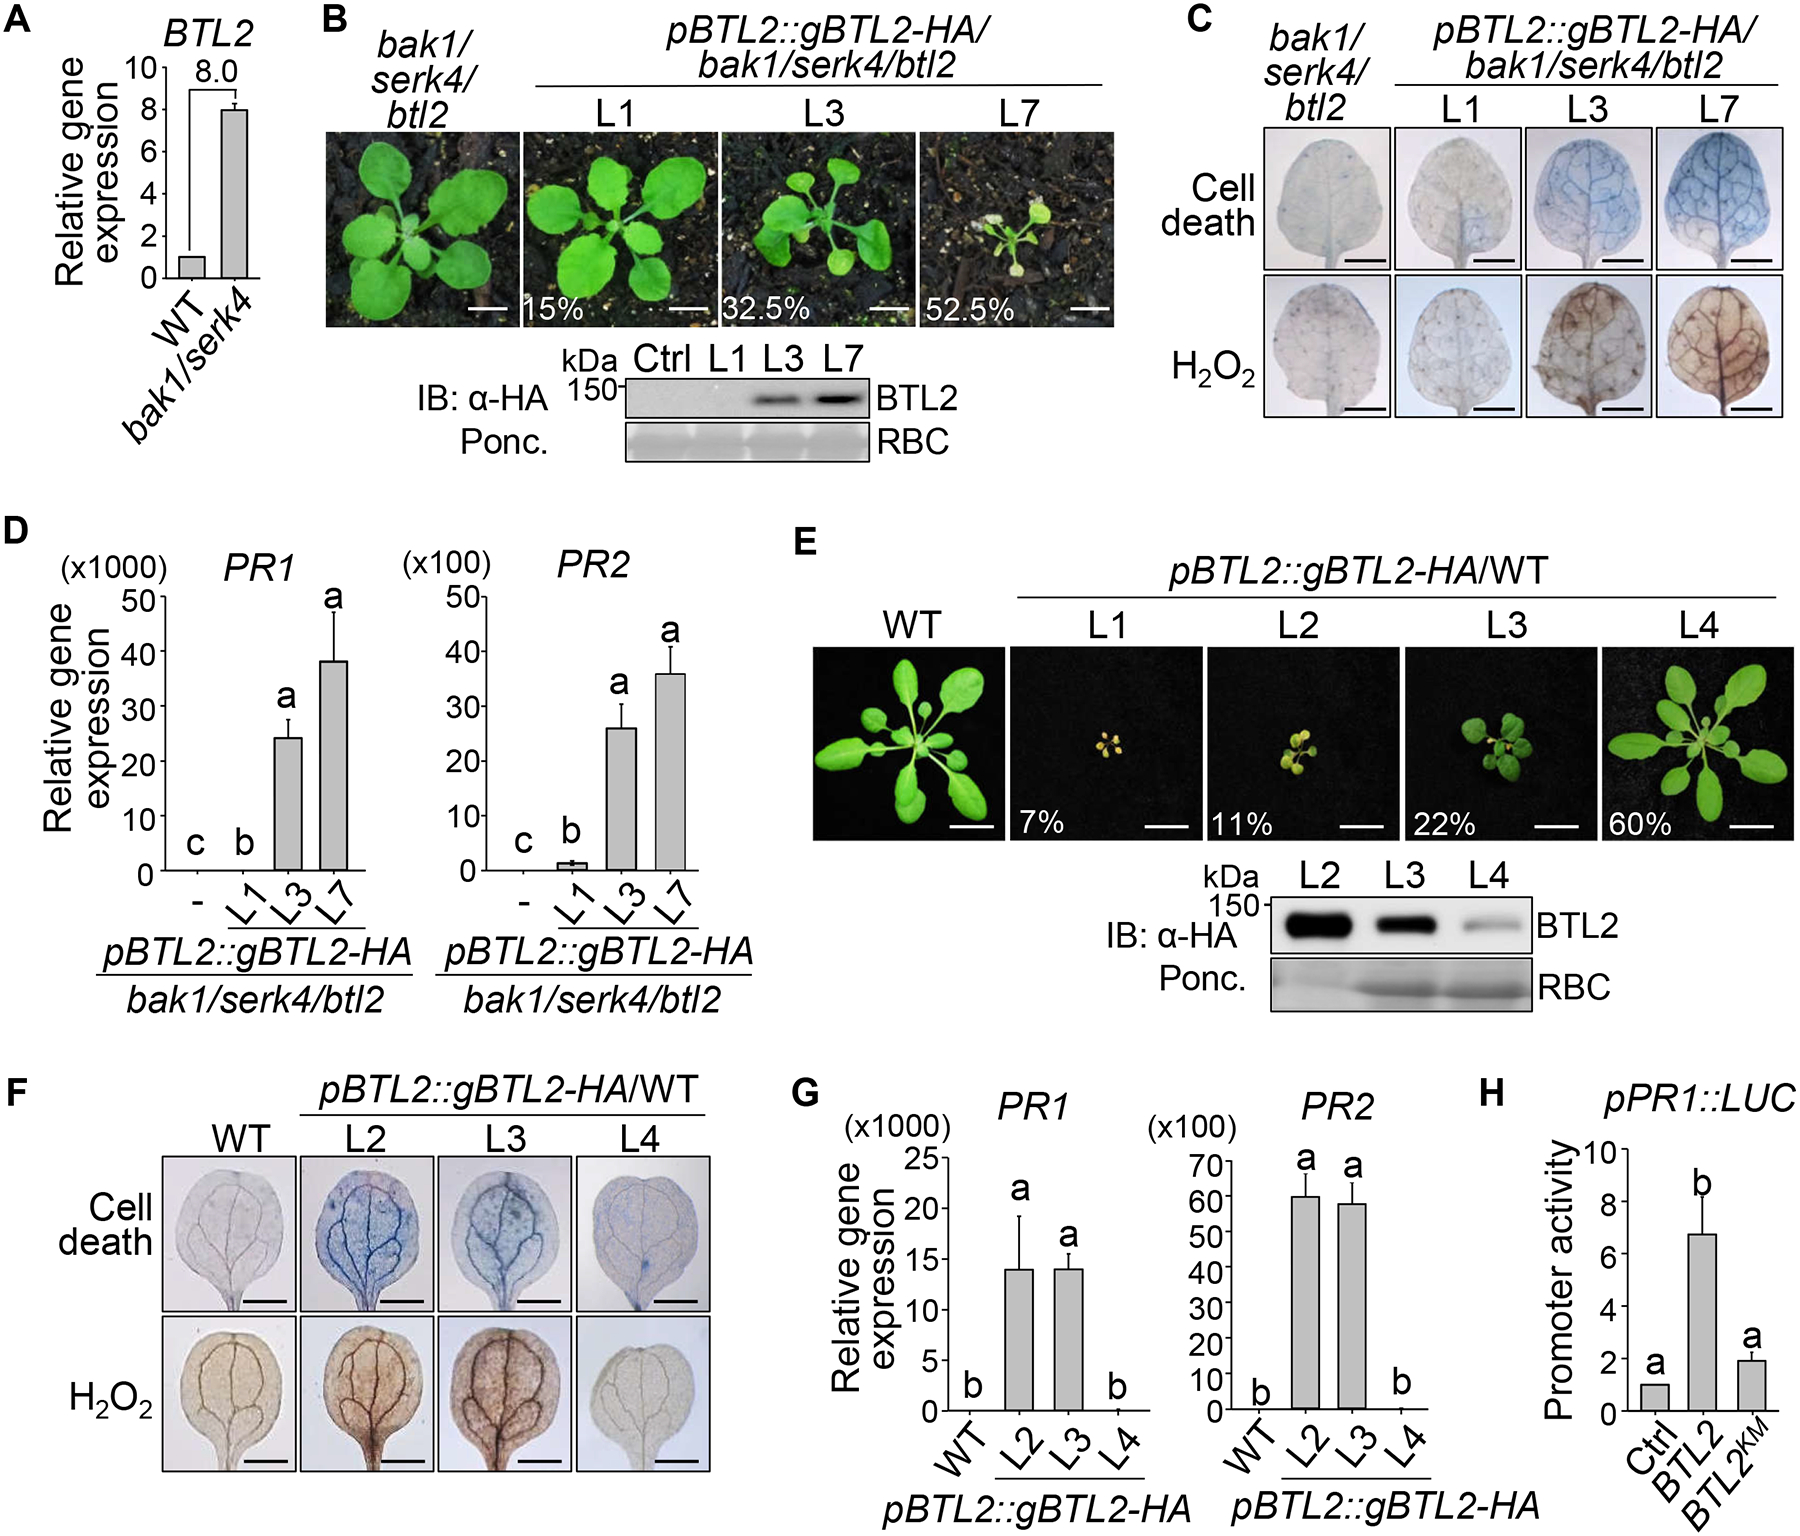
(A) Transcripts of BTL2 are up-regulated in bak1–4/serk4–1. Gene expression levels of BTL2 in WT and bak1–4/serk4–1 are shown as mean ± SD from two independent repeats of RNA-seq data27. The number indicates the fold change.
(B-D) Complementation of bak1–4/serk4–1/btl2–1 with pBTL2::gBTL2-HA restores growth defects (B), cell death and H2O2 production (C), and PR expression (D). Transgenic plants L1, L3, and L7 representing three categories of growth defects, with the percentages of each category and protein expression, are shown (B). Scale bars, 1 cm. Plant leaves were stained with trypan blue for cell death and DAB for H2O2 accumulation (C). Scale bars, 5 mm. The expression of PRs is shown as mean ± SD (n = 4) (D).
(E-G) Increased expression of gBTL2 in WT triggers growth defects (E), elevated cell death and H2O2 production (F), and PR expression (G). Four categories of pBTL2::gBTL2-HA transgenic plants with BTL2-HA expression are shown (E). Scale bars, 1 cm. Plant cotyledons were stained with trypan blue for cell death and DAB for H2O2 accumulation (F). Scale bars, 1 mm. The PR expression (G) was performed as (D).
(H) BTL2 but not the kinase mutant (BTL2KM), activates the PR1 promoter. The pPR1::LUC was co-transfected with BTL2-HA, BTL2KM-HA, or the empty vector (Ctrl) with pUBQ::GUS as an internal transfection control in protoplasts. The relative luciferase activity was normalized with GUS activity. The data are shown as mean ± SD (n = 3).
Different letters in (D), (G), and (H) denote statistically significant differences according to one-way ANOVA followed by the Tukey test (P < 0.05).
The experiments in B-H were repeated three times with similar results.
BTL2 encodes a non-RD LRR-RK.
BTL2 encodes a functionally uncharacterized LRR-RK with 20 LRRs in the extracellular domain (Figures 3A and Data S1.1A). BTL2 contains 11 subdomains in the kinase domain with an activation loop between subdomains VII and VIII. Instead of arginine (R), proline (P) precedes the catalytic aspartate (D) residue in subdomain VI, indicating that BTL2 is a non-RD LRR-RK (Data S1.1B). BTL2 fused with GFP localized along the cell periphery in Nicotiana benthamiana (Figure 3B), Arabidopsis protoplasts (Figure S2A), and pBTL2::gBTL2-GFP/btl2–1 transgenic plants (Figures 3C). BTL2 belongs to the LRR-XI subfamily with the closest homology (40% identity and 58% similarity) to AT2G41820 (Data S1.2A). Mutation in AT2G41820 did not affect RNAi-BAK1/SERK4 cell death (Figure S2B). BTL2 is conserved within Brassicaceae with an identity above 75% and exhibits more than 50% conservation in dicots (Data S1.2B).
Figure 3. BTL2 kinase activity is required for BAK1/SERK4-regulated autoimmunity.
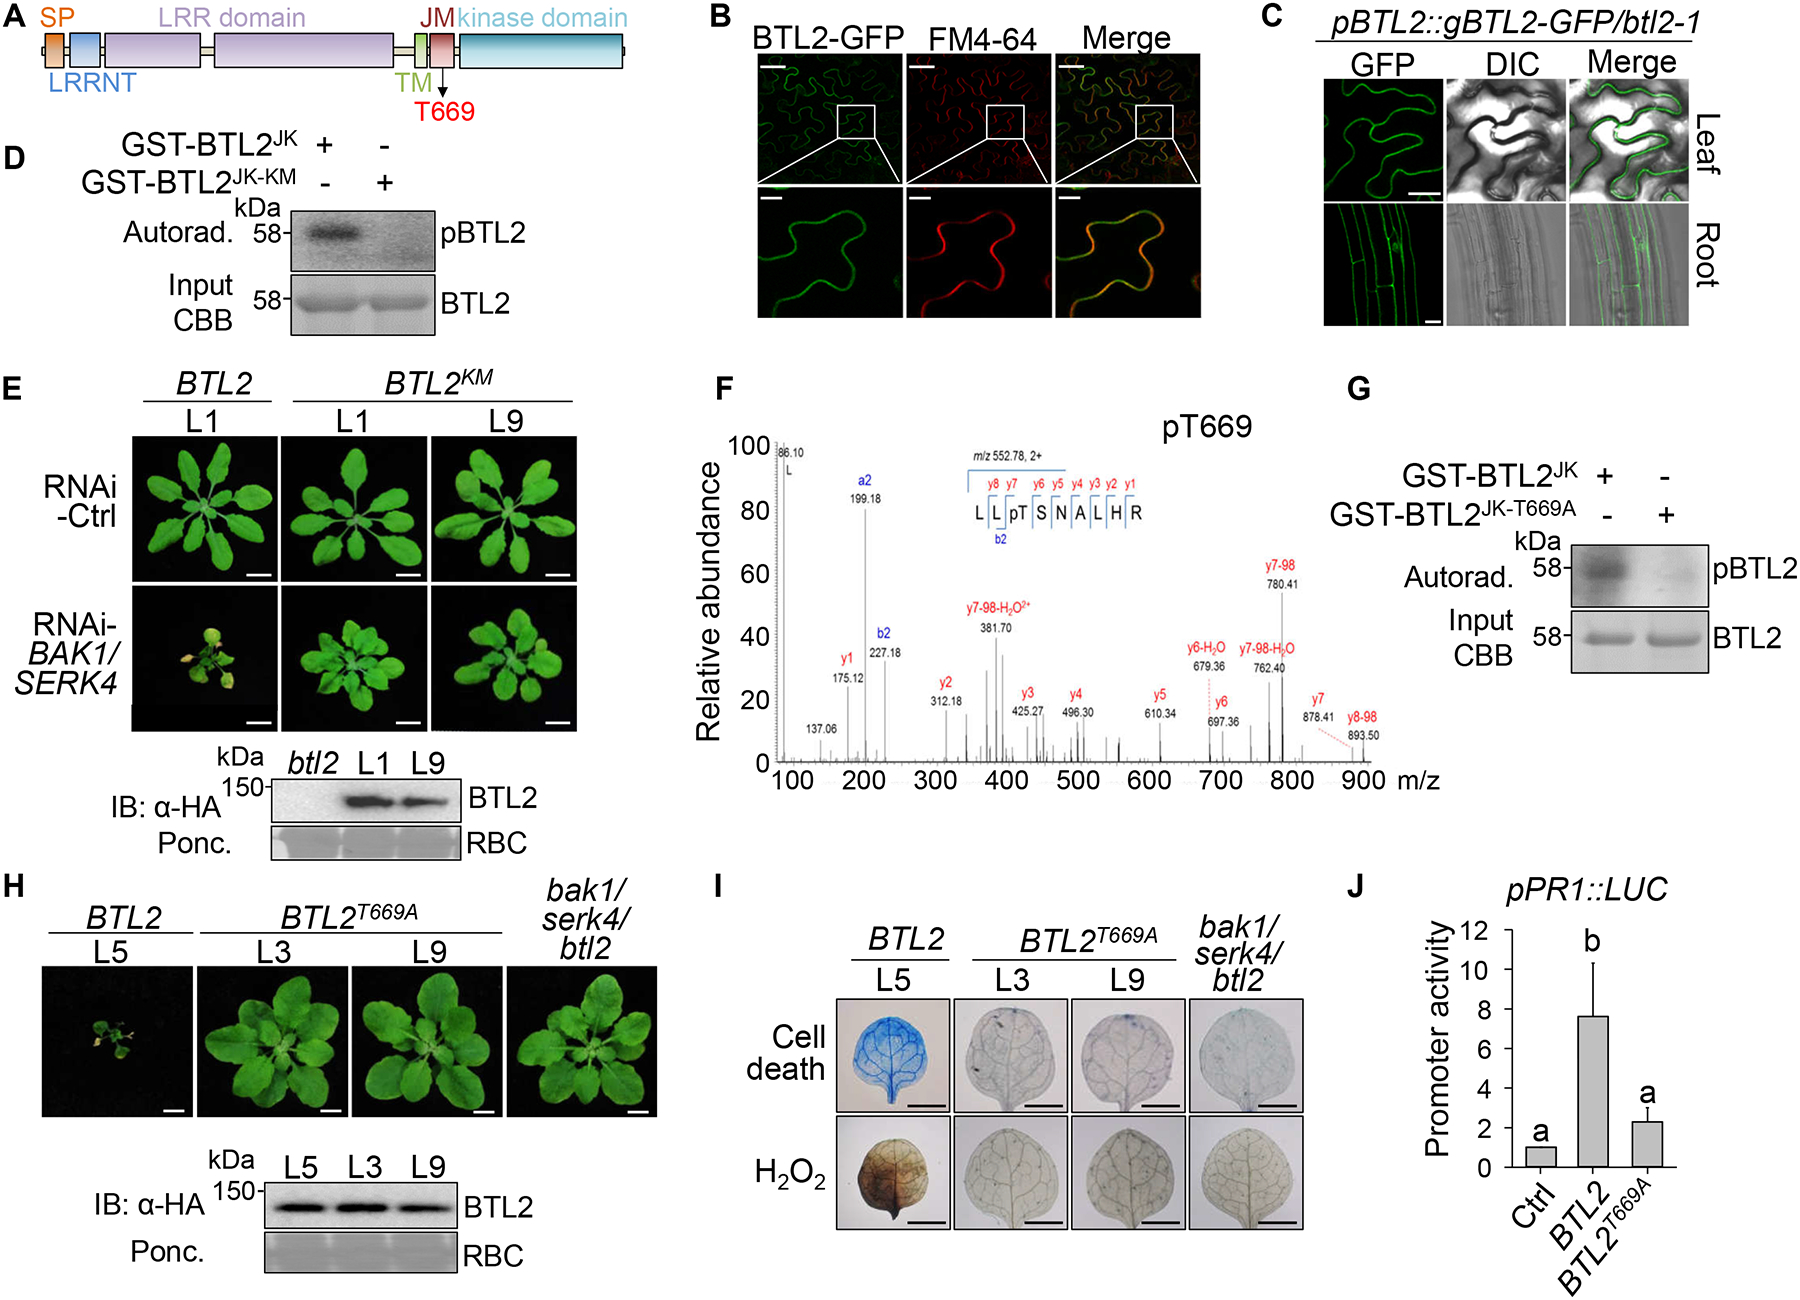
(A) Schematic diagram of BTL2 domains. Signal peptide (SP), LRR N-terminal domain (LRRNT), LRR, transmembrane (TM), juxtamembrane (JM), and kinase domains with autophosphorylation T669 are shown.
(B) BTL2-GFP colocalized with FM4–64 on the plasma membrane of N. benthamiana leaves. Scale bars, 50 μm (top) and 10 μm (bottom).
(C) BTL2-GFP is localized in the leaf and root cell periphery of pBTL2::gBTL2-GFP/btl2–1 transgenic plants. Scale bars, 20 μm.
(D) BTL2JK but not BTL2JK-KM undergoes autophosphorylation. Phosphorylation was analyzed by autoradiography (top) with protein loading shown by Coomassie blue staining (CBB) (bottom).
(E) Complementation of btl2–1 with pBTL2::gBTL2KM-HA cannot restore growth defects triggered by RNAi-BAK1/SERK. Two gBTL2KM complementation lines (L1 & L9) and one gBTL2 complementation line (L1) are shown. Scale bars, 1 cm.
(F) T669 of BTL2JK is autophosphorylated in LC-MS/MS analysis.
(G)BTL2 T669 is an essential autophosphorylation site in vitro.
(H-I) Complementation of bak1–4/serk4–1/btl2–1 with pBTL2::gBTL2T669A-HA cannot restore growth defects (H), cell death and H2O2 production (I). Scale bars, 5 mm.
(J) BTL2T669A is unable to activate the PR1 promoter. The data are shown as mean ± SD (n = 3). Different letters denote statistically significant differences according to one-way ANOVA followed by the Tukey test (P < 0.05). The experiments in B-E and G-J were repeated three times with similar results.
See also Figures S2, Data S1.1, and S1.2.
An in vitro kinase assay using the juxtamembrane and kinase domain of BTL2 (BTL2JK) fused with GST showed that BTL2JK exhibited a kinase activity (Figures 3D and S2C). The kinase activity was abolished in the kinase-inactive mutant BTL2JK-KM, which bears a lysine (K)-to-glutamate (E) substitution in the ATP-binding site (K716E) (Figure 3D). Next, we assessed whether the kinase activity of BTL2 is required for bak1/serk4 cell death by transforming BTL2KM (pBTL2::gBTL2KM-HA) into btl2–1. Unlike BTL2, BTL2KM did not restore cell death (Figure 3E), H2O2 accumulation (Figure S2D), and PR gene expression (Figure S2E) caused by silencing BAK1/SERK4. Additionally, BTL2KM did not activate the pPR1::LUC promoter compared to BTL2 (Figure 2H). Thus, BTL2 kinase activity is essential for its autoimmune regulation.
To determine the auto-phosphorylation sites, we performed liquid chromatography-tandem mass spectrometry (LC-MS/MS) analysis of GST-BTL2JK after in vitro kinase assays. Among two phosphorylation sites detected, threonine (T) 669 in the cytosolic juxtamembrane domain of BTL2 was identified with a confident phosphorylation score (Figures 3F and S2F). Importantly, mutation of Thr669 to alanine (A) (BTL2T669A) blocked BTL2JK autophosphorylation (Figure 3G). To determine the role of BTL2 auto-phosphorylation, BTL2T669A (pBTL2::gBTL2T669A-HA) was transformed into bak1–4/serk4–1/btl2–1. Independent lines with similar protein expression to BTL2 transgenic lines were not able to restore cell death (Figure 3H), H2O2 accumulation (Figure 3I), and PR gene expression (Figure S2G). Consistently, the complementation of BTL2T669A into btl2–1 did not cause any growth defects and failed to restore cell death triggered by silencing BAK1/SERK4 (Figure S2H). Furthermore, BTL2T669A could not activate the pPR1::LUC promoter (Figure 3J). Thus, BTL2 autophosphorylation is essential for bak1/serk4 cell death regulation.
BTL2 interacts with BAK1.
BTL2-FLAG immunoprecipitated BAK1 as detected by α-BAK1 antibodies in pBTL2::gBTL2-FLAG/WT transgenic plants (Figure 4A). BTL2-BAK1 association was also detected in N. benthamiana with a co-immunoprecipitation (Co-IP) assay (Figure S2I). The association between BAK1 and BTL2 on the plasma membrane was confirmed by a bimolecular fluorescence complementation (BiFC) assay (Figure 4B). BTL2JK, but not the kinase domain (BTL2K) alone, interacted with BAK1JK in a yeast two-hybrid assay (Figure S2J). Likewise, BAK1JK, but not BAK1K, interacted with BTL2JK (Figure S2J and Data S1.3A). In addition, glutathione sepharose coupled with GST-BTL2JK pulled down MBP-BAK1JK-HA, which was more efficient than GST-BTL2K and MBP-BAK1JK-HA interaction (Figure 4C). Thus, the juxtamembrane domains of BTL2 and BAK1 promote the BTL2-BAK1 interaction. Furthermore, GST-BTL2JK could weakly pull down MBP-BAK1JK-KM compared to MBP-BAK1JK (Figure 4C). Notably, the juxtamembrane domain is required for the kinase activity of BTL2 (Data S1.3B) and BAK142. Thus, transphosphorylation between BTL2 and BAK1 might stabilize their interaction.
Figure 4. BAK1 phosphorylates BTL2 at Ser676 to suppress BTL2-induced cell death.

(A) BTL2 associates with BAK1. T1 plants of pBTL2::gBTL2-FLAG/WT with normal (N) or cell death (D) phenotypes were harvested for immunoprecipitation (IP) with α-FLAG agarose and immunoblotting (IB) with α-BAK1 or α-FLAG (top two panels). Protein inputs are shown (bottom two panels).
(B) Interaction between BTL2 and BAK1 by the BiFC assay. BAK1-cYFP and BTL2-nYFP or empty vector (EV) were co-expressed in protoplasts for detecting YFP and chloroplast (Chloro.) signals under confocal microscopy. Scale bars, 10 μm.
(C) BAK1JK interacts with BTL2JK in the pull-down (PD) assay. GST, GST-BTL2JK, or GST-BTL2K immobilized on glutathione sepharose was incubated with MBP, MBP-BAK1JK-HA, or MBP-BAK1JK-KM-HA, and pelleted for immunoblotting with α-HA antibody (top) with CBB for input proteins (bottom).
(D) BAK1 phosphorylates BTL2. The kinase assay using MBP-BAK1JK-HA as kinases and GST-BTL2JK variants as substrates is shown.
(E) Ser676 of BTL2JK is phosphorylated by BAK1JK in LC-MS/MS analysis.
(F) BTL2S676D is compromised in activating the PR1 promoter. The data are shown as mean ± SD (n = 3).
(G) S676 of BTL2 is an important phosphorylation site by BAK1.
(H-J) Complementation of bak1–4/serk4–1/btl2–1 by pBTL2::gBTL2S676D-HA cannot restore growth defects (H), cell death and H2O2 production (I), and the PR expression (J). Scale bars, 5 mm. The data in (J) are shown as mean ± SD (n = 4).
Different letters in (F) and (J) denote statistically significant differences according to one-way ANOVA followed by the Tukey test (P < 0.05).
The experiments except E were repeated three times with similar results.
See also Figure S2 and Data S1.3.
BAK1 phosphorylates BTL2 and suppresses BTL2 cell death-inducibility.
An in vitro kinase assay indicated that BAK1JK strongly phosphorylated BTL2JK, but weakly phosphorylated the autophosphorylation mutant BTL2JK-T669A or kinase-inactive mutant BTL2JK-KM (Figure 4D). We determined BAK1-mediated BTL2 phosphorylation sites by LC-MS/MS analysis. In addition to the autophosphorylation T669 residue, T657 and S676 in the JM domain of BTL2 were identified as confident BAK1JK phosphorylation sites (Figures 4E and S2K). To determine the function of these residues in BTL2 cell death regulation, we generated the phosphoinactive BTL2T657A and BTL2S676A, and phosphomimetic BTL2T657D and BTL2S676D variants, and screened for activating the pPR1::LUC promoter (Figure 4F). BTL2S676D, but not others, compromised the pPR1::LUC promoter activation (Figure 4F). Notably, BTL2S676D had the same autophosphorylation activity as BTL2JK (Figure S2L). BTL2JK-KM-S676A compromised its phosphorylation by BAK1JK (Figure 4G), implying that S676 was a primary phosphorylation site of BTL2 by BAK1. To elucidate the role of BAK1 phosphorylation on BTL2, we generated pBTL2::BTL2S676D-HA transgenic plants in bak1–4/serk4–1/btl2–1. The expression of BTL2S676D in bak1–4/serk4–1/btl2–1 could not restore plant growth defects, cell death, H2O2 accumulation, and PR gene expression as that of BTL2 (Figures 4H–J). Our data suggest that BAK1-mediated phosphorylation of BTL2 on S676 suppresses the BTL2 cell death inducibility, thereby keeping BTL2 inactive to avoid autoimmunity in WT plants.
BTL2 promotes CNGC20 Ca2+ channel activities.
The homeostasis of CNGC20 is vital in activating bak1/serk4 autoimmunity28. How CNGC20 is activated remains unknown. Co-expression of BTL2-HA and CNGC20-FLAG triggered strong cell death in N. benthamiana (Figure 5A). Similarly, co-expression of BTL2-HA and CNGC20-FLAG further activated the pPR1::LUC promoter in Arabidopsis protoplasts (Figure 5B). BTL2T669A, the autophosphorylation mutant, did not induce cell death when co-expressed with CNGC20 (Figure 5C). Furthermore, bak1–4/serk4–1/btl2–1 phenotypically resembles bak1–4/serk4–1/cngc19/cngc20–1 (Figure S3A). Silencing BAK1/SERK4/BTL2 in cngc19/20 or CNGC19/20 in bak1–4/serk4–1/btl2–1 did not affect the growth of the corresponding mutant, implying BTL2 and CNGC19/20 function in the same pathway in regulating bak1/serk4 cell death (Data S1.3C). BTL2/CNGC20-triggered cell death or pPR1::LUC activation was suppressed in the presence of BAK1-GFP (Figures 5A and 5B), supporting the negative regulation of BAK1 phosphorylation on the BTL2 activity. Furthermore, the BAK1-mediated phosphomimetic mutant BTL2S676D reduced BTL2/CNGC20-triggered cell death (Figure 5C). The cell death mediated by expression of pBTL2::gBTL2-HA was compromised in cngc20–1, with only 2 of 36 plants (5.6%) displaying slightly stunted growth without apparent cell death (Figure 5D). The BTL2-induced pPR1::LUC activities were also blocked in cngc20–1 (Figure S3B). Thus, CNGC20 is required for BTL2 cell death inducibility.
Figure 5. BTL2 activates CNGC20 to induce cell death.

(A) Co-expression of BTL2 and CNGC20 induce cell death, which is suppressed by BAK1. Combinations of BTL2-HA, CNGC20-FLAG, BAK1-GFP, or a GFP vector (Ctrl) were expressed in N. benthamiana. Cell death was visualized as autofluorescence under UV light (top) and H2O2 was stained by DAB (middle). The stacked bars show the percentage of different categories (0–3) of cell death severity (bottom).
(B) Co-expression of BTL2 and CNGC20 activates the PR1 promoter, which is suppressed by BAK1 in protoplasts. The data are shown as mean ± SD (n = 3). Different letters denote statistically significant differences according to one-way ANOVA followed by the Tukey test (P < 0.05).
(C) S676 is important for BTL2-induced cell death in N. benthamiana.
(D) The pBTL2::gBTL2-HA transgenic plants do not show severe growth defects in cngc20–1. Scale bar, 1 cm.
(E) BTL2 associates with CNGC20. Protoplasts expressing BTL2-HA and CNGC20-FLAG or an empty vector (Ctrl) were subjected to IP with α-FLAG and IB with α-HA or α-FLAG (top two panels) with input proteins shown (bottom two panels).
(F) BTL2, but not BTL2KM, promotes the CNGC20 channel activity. The current-voltage relationship was recorded in Xenopus oocytes injected with water (Ctrl, n = 7), CNGC20-YFP (n = 16), CNGC20-YFP+BTL2-CFP (n = 9), or CNGC20-YFP+BTL2KM-CFP (n = 4) in the presence of 30 mM CaCl2.
(G) Tunicamycin treatment affects BTL2 migration. Protoplasts from WT or stt3a-2 expressing BTL2-HA treated without or with tunicamycin were subjected to an α-HA immunoblotting.
(H) BTL2N240/477/545Q induces weaker cell death than BTL2 when co-expressing with CNGC20 in N. benthamiana.
(I) Localization of CNGC20-GFP and CNGC20N430/452/455Q-GFP in WT and stt3a-2. Protoplasts from WT or stt3a-2 were transfected with CNGC20-GFP or CNGC20N430/452/455Q-GFP. Scale bar, 10 μm.
The experiments were repeated three times with similar results.
See also Figures S3, S4, and Data S1.3.
Both BTL2 and CNGC20 localized on the plasma membrane of Arabidopsis leaves (Figure S3C). Co-IP assays indicated that BTL2 associated with CNGC20 in N. benthamiana leaves (Figure S3D) and Arabidopsis protoplasts (Figure 5E). Additionally, Förster resonance energy transfer (FRET)-fluorescence lifetime imaging microscopy (FLIM) revealed that BTL2-GFP and CNGC20-mCherry were in close proximity when co-expressed in Arabidopsis protoplasts (Figure S3E). Furthermore, BTL2 interacted with CNGC20 in a pull-down assay (Figure S3F) and phosphorylated the CNGC20 N-terminus (CNGC20N) (Figure S3G).
Co-expression of BTL2 with CNGC20 increased the Ca2+ influx in N. benthamiana (Figure S3H). BTL2, but not BTL2KM, increased CNGC20 inward currents with two-electrode voltage-clamp recording in Xenopus laevis oocytes (Figure 5F, and Data S1.3D and S1.3E). In addition, the BTL2-promoted CNGC20 channel activity was inhibited by BAK1, but not BAK1KM (Figure S3I). BAK1-mediated phosphomimetic BTL2S676D no longer promoted the CNGC20 channel activity (Figure S3J). The data support that BTL2 phosphorylates and promotes the CNGC20 Ca2+ channel activity, leading to autoimmunity.
BTL2 and CNGC20 undergo STT3a-mediated glycosylation.
STT3a-mediated protein N-glycosylation is important in bak1/serk4 cell death27. As membrane-resident proteins, BTL2 and CNGC20 are possibly N-glycosylated. Treatments of tunicamycin, an inhibitor of protein N-glycosylation, reduced the migration rate of BTL2-HA, suggesting that BTL2 is likely N-glycosylated in Arabidopsis cells (Figure 5G). BTL2-HA proteins migrated faster in protein N-glycosylation mutant stt3a-2 than in WT (Figure 5G), indicating that BTL2 undergoes STT3a-mediated glycosylation. Similarly, treatment with endoglycosidase H, which cleaves within the chitobiose core of high mannose and some hybrid oligosaccharides from N-linked glycoproteins, also reduced the migration rate of BTL2-HA (Figure S4A). Importantly, all transgenic plants (48 lines) of pBTL2::BTL2-HA in stt3a-2 exhibited no cell death, indicating that BTL2 cell death inducibility depends on STT3a (Figure S4B). Notably, the protein level of BTL2 was reduced in stt3a-2 compared to that in WT (Figure S4B). Furthermore, BTL2N240/477/545Q bearing mutations on three putative N-glycosylation sites (N in N-X-S/T with X as any amino acid except P) to Q, migrated faster than BTL2 (Figure S4C). Unlike BTL2, BTL2N240/477/545Q no longer triggered cell death when coexpressed with CNGC20 in N. benthamiana (Figure 5H). Co-expression of BTL2 and CNGC20-triggered pPR1::LUC activation was also compromised in stt3a-2 (Figure S4D). Together, STT3a-mediated glycosylation is required for BTL2 cell death-inducibility.
Similarly, CNGC20 migrated faster after tunicamycin treatment than without treatment (Figure S4E), and in stt3a-2 than in WT (Figure S4F), indicating that STT3a is also required for CNGC20 glycosylation. The N-glycosylation mutant CNGC20N430/452/455Q migrated faster than CNGC20 (Figure S4G), resembling CNGC20 expressed in stt3a-2 (Figure S4F). The plasma membrane-localization of CNGC20-GFP was detected in WT but disappeared into apparent endomembrane structures in stt3a-2, similar to CNGC20N430/452/455Q-GFP in WT (Figure 5I), indicating that STT3a-dependent glycosylation of CNGC20 assists its plasma membrane localization.
BTL2 mediates the elevated PEP-triggered responses in the absence of BAK1.
The btl2–1 mutant did not affect ROS burst and seedling growth inhibition triggered by MAMP flg22, a 22-amino acid peptide corresponding to bacterial flagellin (Figures S4H and S4I). Furthermore, btl2–1 did not affect plant resistance against virulent bacterial pathogens Pseudomonas syringae pv. tomato (Pst) DC3000 and P. syringae pv. maculicola (Psm) ES4326 (Figure S4J), and fungal pathogens Botrytis cinerea and Sclerotinia sclerotiorum (Figures S4K and S4L). Additionally, btl2–1 exhibited similar resistance and progression of hypersensitive response (HR) against avirulent bacterial pathogens Pst DC3000 carrying avrRpt2, avrRps4, or avrRpm1 as WT plants (Figures S4M and S4N). The results indicate that BTL2 might not have a detectable contribution to plant immunity in WT plants.
As a co-receptor of multiple MAMP receptors, BAK1 is essential in plant immunity and targeted by pathogen effectors43–45. In bak1 mutants where PTI is compromised, the phytocytokine PEP-triggered response is enhanced, likely to ensure basal immunity46. However, since BAK1 is a co-receptor of PEPR1/PEPR247–49, it remains enigmatic how PEP-triggered response is enhanced without BAK1. Notably, BTL2 is highly induced upon PEP2 treatment in bak1–4 compared to WT (Figure S5A), which prompted us to examine whether BTL2 is involved in the hypersensitivity of bak1–4 to PEP treatments. As reported previously46, bak1–4 showed elevated sensitivity to PEPs, evidenced by the growth inhibition caused by PEP1 or PEP2 treatment (Figures 6A, 6B, and S5B). Remarkably, the PEP-triggered severe seedling growth inhibition in bak1–4 was abolished in bak1–4/btl2–1 (Figures 6A, 6B, and S5B). In addition, bak1–4/btl2–1 showed a much-reduced sensitivity to PEP1 or PEP2 treatment than WT. Moreover, bak1–4/serk4–1/btl2–1 was nearly insensitive to PEP1 or PEP2 treatment (Figures 6A, 6B, and S5B). The data imply that BTL2 mediates enhanced PEP-triggered response when BAK1-mediated signaling is compromised. Pretreatment of PEPs primed plant resistance against Pst DC3000 infection. Likely attributed to the enhanced PEP-triggered responses, bak1–4 showed an elevated PEP1-induced resistance compared to WT (Figure 6C). The PEP1-induced resistance to Pst DC3000 was not observed in bak1–4/btl2–1 (Figure 6C). In addition, the increased resistance to Pst DC3000 in bak1–4 depended on BTL2 (Figure S5C). Thus, the enhanced PEP-triggered immunity in bak1–4 is mediated through BTL2.
Figure 6. BTL2 activates PEP and SCOOP signaling upon depletion of BAK1.
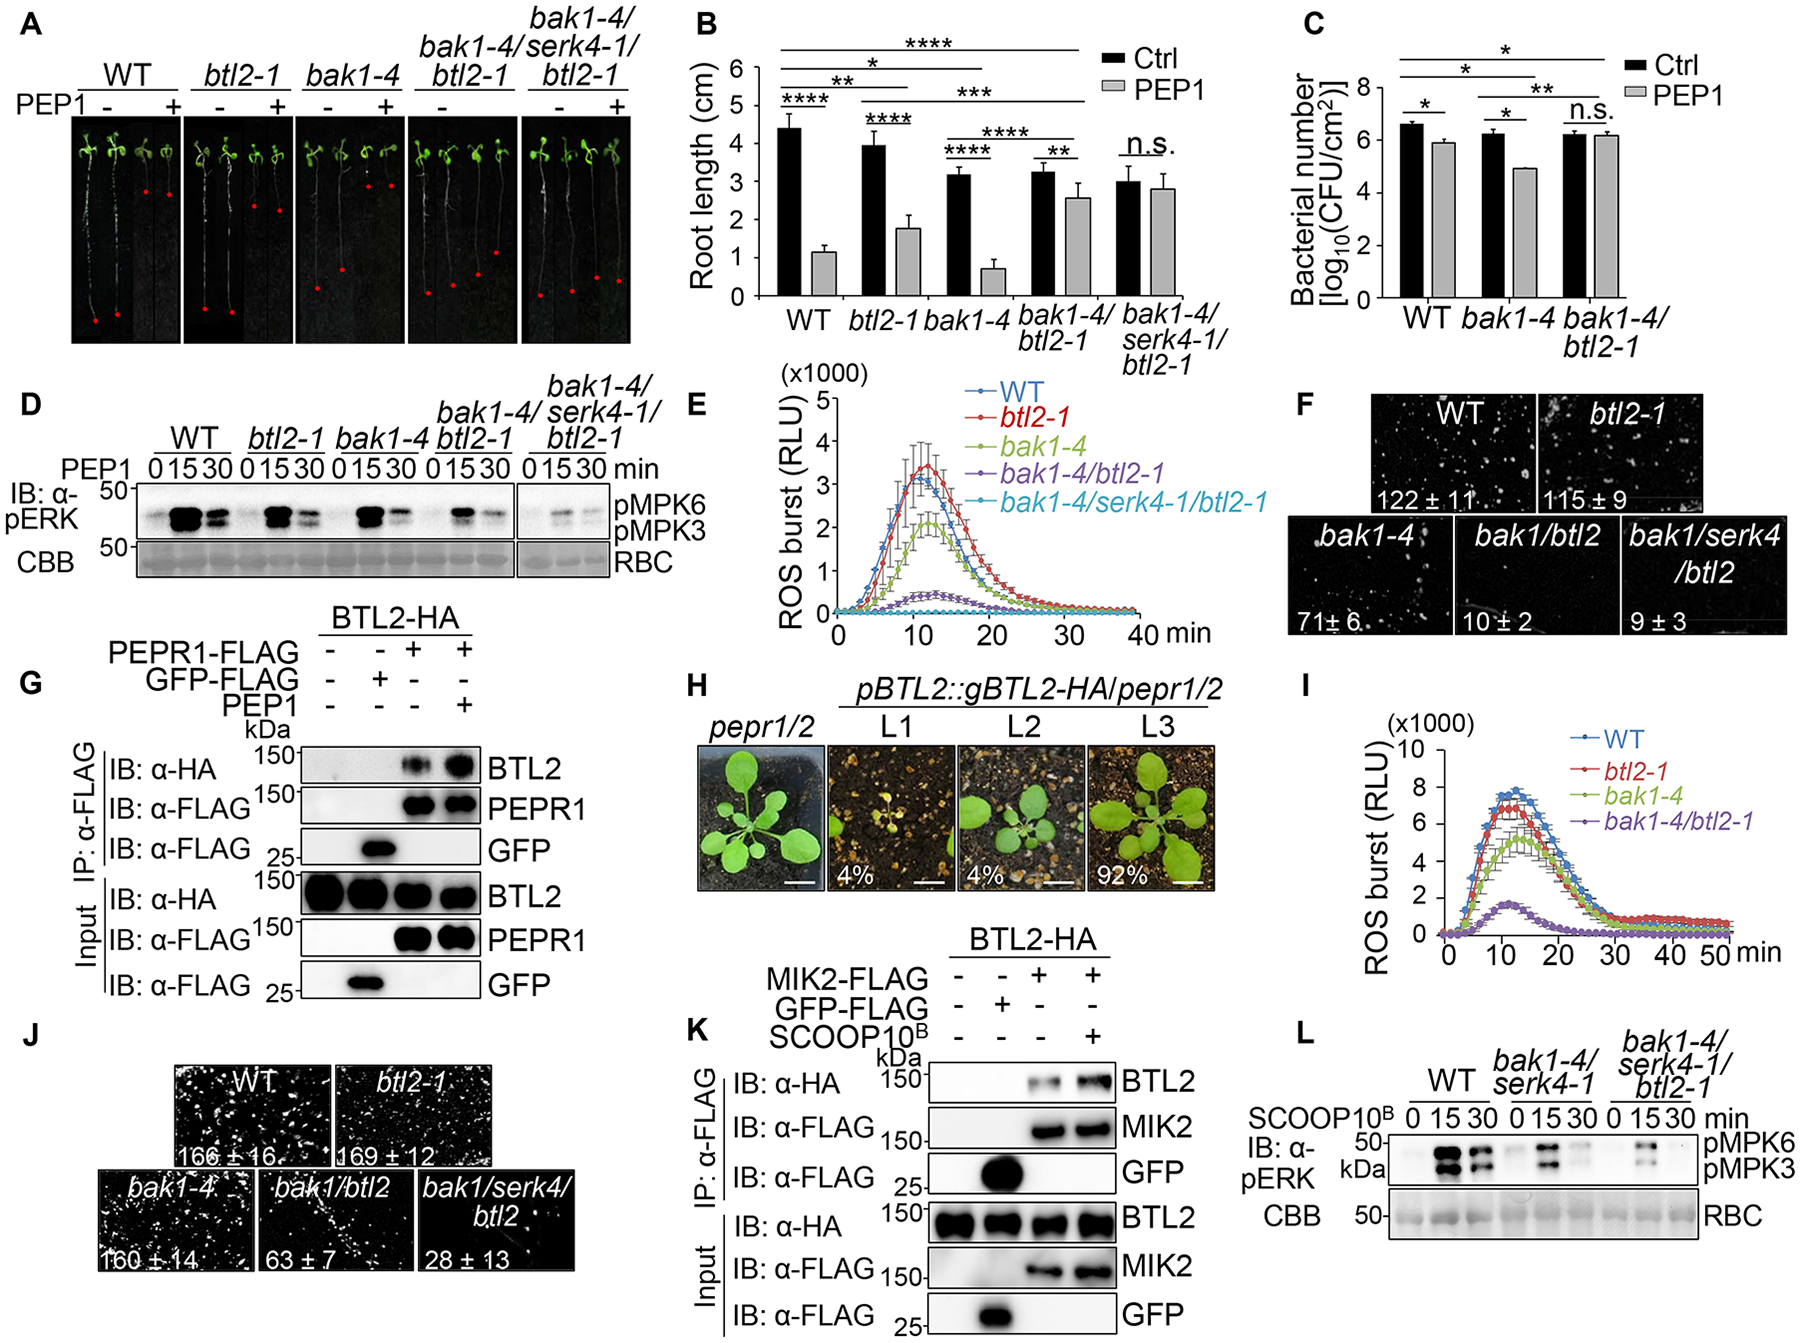
(A & B) BTL2 mediates sensitization of PEP1-induced seedling growth inhibition in bak1–4. Seedlings treated without (Ctrl) or with 1 μM PEP1 for seven days are shown (A) with quantification of root length as mean ± SD (n = 6) (B).
(C) BTL2 mediates PEP1-induced disease resistance in bak1–4. Four-week-old plant leaves were infiltrated with water (Ctrl) or 100 nM PEP1 followed by hand-inoculation with Pst DC3000 at OD600 = 5×10⁻⁴. Bacterial counting at three dpi is shown as means ± SD (n = 3).
(D) BTL2 mediates PEP1-induced MAPK activation in bak1–4. Seedlings were treated with 100 nM PEP1 for immunoblotting by α-pERK with protein loading shown by CBB staining.
(E) BTL2 mediates PEP1-induced ROS production in bak1–4. Four-week-old plant leaf discs were treated with 100 nM PEP1 for 40 min with data shown as means ± SE (n = 8).
(F) BTL2 mediates PEP1-induced callose deposition in bak1–4. Two-week-old seedlings were stained with aniline blue solution 24 hr after 100 nM PEP1 treatment and visualized under UV light with quantification by ImageJ shown as mean ± SD (n = 4).
(G) PEP1 induces BTL2 and PEPR1 association. Protoplasts expressing BTL2-HA and PEPR1-FLAG, empty vector (−), or GFP-FLAG were treated with or without 100 nM PEP1 for 15 min for IP with α-FLAG and IB with α-HA or α-FLAG (top three panels) with input proteins shown (bottom three panels).
(H) The pepr1/2 mutant partially suppresses growth defects triggered by the increased BTL2 expression. pBTL2::gBTL2-HA transgenic plants in pepr1/2 were phenotypically grouped into three categories with indicated ratios. Scale bar, 1 cm.
(I) BTL2 mediates SCOOP10B-induced ROS production in bak1–4. Leave discs were treated with 1 μM SCOOP10B for 50 min with data shown as means ± SE (n = 6).
(J) BTL2 mediates SCOOP10B-induced callose deposition in bak1–4.
(K) SCOOP10B induces BTL2 and MIK2 association. Protoplasts were treated with or without 20 μM SCOOP10B for 15 min.
(L) BTL2 mediates SCOOP10B-induced MAPK activation in bak1–4/serk4–1. Seedlings were treated with 1 μM SCOOP10B.
Asterisks in B and C indicate a significant difference by Student’s two-tailed t-test. (*, P < 0.05; **, P < 0.01; ***, P < 0.001; ****, P < 0.0001; n.s., no significance). The experiments were repeated three times with similar results.
See also Figures S4, S5, S6, and Data S1.4.
The PEP1-induced MAPK activation, ROS production, and callose deposition were not significantly altered in btl2–1, supporting that BTL2 might not contribute to immunity in WT plants (Figures 6D–F). However, the PEP1-induced responses were compromised in bak1–4/btl2–1 compared to bak1–4 (Figures 6D–F). Notably, bak1–4 and bak1–4/btl2–1 exhibited similar responses to flg22-induced ROS production, MAPK activation, and growth inhibition (Figures S5D–F), suggesting that BTL2 might not significantly contribute to flg22 signaling in the absence of BAK1. Thus, BTL2 might regulate phytocytokine signaling in the immunocompromised bak1 mutants.
A Co-IP assay indicated that BTL2 associated with PEPR1 and PEPR2, which was enhanced upon PEP1 treatment (Figures 6G and S5G). BTL2 and PEPR1 localized on the plasma membrane in Arabidopsis leaves (Figure S5H). Additionally, pBTL2::gBTL2-HA-induced cell death in WT was reduced in pepr1/pepr2 (Figure 6H). Only 8% of pBTL2::gBTL2-HA transgenic plants showed growth defects in pepr1/pepr2 compared to 40% in WT (Figures 2E and 6H). Thus, BTL2 might function as an alternative co-receptor or signaling partner of PEPR1/PEPR2 in activating PEP signaling when BAK1 and SERK4 are absent. Consistent with this hypothesis, PEP1-induced MAPK activation was further reduced in bak1–4/serk4–1/btl2–1 compared to bak1–4/serk4–1 (Figure S5I). Furthermore, PROPEPs were induced in bak1–4/serk4–1 (Figure S5J).
BTL2 mediates the SCOOP-triggered immunity in the absence of BAK1.
In addition to PROPEPs, seven SCOOP genes were upregulated in bak1–4/serk4–1 (Figure 7A). Like PEP1, SCOOP10B, a synthetic peptide corresponding to the conserved C-terminal motif of SCOOP1020,21, triggered compromised ROS production, MAPK activation, and callose deposition in bak1–4/btl2–1 compared to bak1–4 (Figures 6I, 6J and S6A). These responses showed no detectable changes in btl2–1 compared to WT (Figures 6I, 6J, and S6A). Moreover, the SCOOP10B-induced resistance to Pst DC3000 was compromised in bak1–4/btl2–1 compared to bak1–4 and btl2–1 (Figure S6B). BTL2 associated with SCOOP receptor MIK2, which was enhanced upon SCOOP10B treatment (Figure 6K). SCOOP10B-induced MAPK activation was further reduced in bak1–4/serk4–1/btl2-1 compared to bak1–4/serk4–1 (Figure 6L). The data support that BTL2 mediates the SCOOP-triggered immune signaling in the absence of BAK1.
Figure 7. BTL2 activates ADR1-mediated SCOOP signaling and immunity in the absence of BAK1.

(A) Upregulation of peptide genes in bak1–4/serk4–1. The gene expression from RNA-seq data27 was subjected to log2 transformation using GraphPad for the heat map.
(B) Overexpression of p35S::SCOOPL1-HA triggers MIK2-, BTL2-, and ADR1-dependent growth defects. Scale bars, 1 cm.
(C) Alignment of SCOOP and SCOOPL1 consensus sequence with the conserved SxS motif.
(D) BTL2 mediates SCOOP10B- and SCOOPL1-triggered root growth inhibition in bak1–4. Quantification of seedling root length is shown with data as mean ± SD (n = 24). The different letters denote statistically significant differences according to one-way ANOVA followed by the Tukey test (P < 0.05).
(E) BTL2 mediates SCOOPL1-induced callose deposition in bak1–4.
(F) The mik2–1 and adr1 triple mutants suppress BTL2-triggered growth defects. Scale bars, 1 cm.
(G) ADR1s mediate PEP/SCOOP-induced disease resistance. Four-week-old plant leaves were infiltrated with water (Ctrl), 1 μM PEP1, 1 μM SCOOP10B, or 10 μM SCOOPL1 followed by hand-inoculation with Pst DC3000 at OD600 = 1×10⁻³. Bacterial counting at three dpi is shown as means ± SD (n = 6). Asterisks indicate a significant difference by Student’s two-tailed t-test. (**, P < 0.01; ***, P < 0.001).
(H) A model of BTL2 function in phytocytokine signaling and ADR1-mediated autoimmunity. Upon pathogen infection, BAK1/SERK4 associate with PRRs perceiving MAMPs and trigger PTI responses and the expression/production of DAMPs/phytocytokines. Phytocytokines, such as PEPs/SCOOPs, are perceived by BAK1/SERK4-associated PRRs to induce ADR1-dependent DTI for a robust and balanced PTI. Meanwhile, BAK1/SERK4 phosphorylates BTL2 at S676 and suppresses BTL2-mediated signaling. Pathogen effectors perturb BAK1/SERK4, leading to the compromised PTI and derepression of BTL2. BTL2 autophosphorylates at T669 and activates CNGC19/CNGC20 Ca2+ channels and the production of phytocytokines. BTL2 associates with multiple phytocytokine receptors to potentiate phytocytokine signaling. Amplification of phytocytokine signaling and massive Ca2+ influx triggers ADR1-mediated autoimmunity. ADR1s could also facilitate Ca2+ influx to promote autoimmunity.
The experiments were repeated three times with similar results.
BTL2 mediates signaling triggered by a SCOOP-like peptide in the absence of BAK1.
Among the upregulated peptide transcripts in bak1–4/serk4–1, an uncharacterized peptide gene (AT1G24145, named SCOOPL1, see below) was profoundly induced (66-fold) (Figure 7A). When SCOOPL1 was overexpressed in WT (p35S::SCOOPL1-HA), 54 of 73 (74%) T1 transgenic plants showed growth defects, including 22 plants (30%) with severe dwarfism and 32 plants (44%) with retarded growth (Figure 7B). These plants also showed elevated expression of PR1, FLG22-INDUCED RECEPTOR-LIKE KINASE1 (FRK1), and WRKY53 (Figure S6C). When p35S::SCOOPL1-HA was expressed in btl2–1, among 82 T1 transgenic plants, no plants showed severe dwarfism, and 17 plants (21%) displayed stunted growth, implying the requirement of BTL2 in SCOOPL1-triggered responses (Figure 7B).
SCOOPL1 encodes a 128-amino acid (aa) polypeptide with an N-terminal signal peptide (Figure S6D). The first 72-aa truncation induced growth defects when overexpressed in WT plants (p35S::SCOOPL11−72-HA) (Figure S6D). A synthetic peptide corresponding to 25–72 aa (SCOOPL125–72) induced seedling growth inhibition in WT plants, which was slightly attenuated in btl2–1 (Figure S6E). Interestingly, SCOOPL125–72-induced seedling growth inhibition depended on MIK2, the receptor of SCOOPs (Figure S6E). The p35S::SCOOPL1-HA-induced growth defects in transgenic plants were also reduced in mik2–1 (Figure 7B). The data indicate that SCOOPL1 might share common features with SCOOPs. The Arabidopsis genome encodes at least 23 SCOOP isoforms with a conserved C-terminal SxS motif20. We identified a SCOOP-like sequence with a conserved SxS motif between 58–72 aa in SCOOPL1 and thus named it SCOOP-like peptide 1 (Figures 7C and S6D). The peptide corresponding to the SCOOP motif (SCOOPL158–72), but not the N-terminus (SCOOPL125–57), induced MIK2-dependent seedling growth inhibition, further supporting that SCOOPL1 is a member of the SCOOP family (Figure S6E).
Similar to SCOOP10B, SCOOPL1-triggered seedling growth inhibition was reduced in bak1–4/btl2–1 compared to bak1–4 (Figures 7D and S6F). Similarly, SCOOPL1-induced callose deposition and ROS production were compromised in bak1–4/btl2–1 compared to bak1–4, but did not change in btl2–1 compared to WT (Figures 7E and S6G). In addition, the pBTL2::gBTL2-HA-induced cell death was partially reduced in mik2 (Figure 7F). BTL2 and MIK2 localized on the plasma membrane (Figure S6H), and were in close proximity with a FRET-FLIM assay in WT (Figure S6I) and bak1–4 (Data S1.4). Single-molecule total internal reflection fluorescence (TIRF) microscopy showed that BTL2 and MIK2 exhibited similar foci organization patterns on the plasma membrane surface of pBTL2::gBTL2-GFP/btl2–1 and pMIK2::MIK2-GFP/mik2–1 transgenic plants, respectively (Figure S6J). The data indicate that BTL2 associates with multiple phytocytokine receptors and mediates their immune signaling in the bak1 mutant.
BTL2-mediated autoimmune signaling depends on the EDS1-PAD4-ADR1 module.
Helper NLRs ADR1 and its paralogs ADR1-L1 and ADR1-L2 are involved in bak1–3/serk4–1 autoimmunity30. We tested whether BTL2-induced cell death depends on ADR1s by transforming pBTL2::gBTL2-HA into the adr1/adr1-L1/adr1-L2 triple mutant. The expression of pBTL2::gBTL2-HA-induced cell death and growth defects were partially alleviated in adr1/adr1-L1/adr1-L2 (Figure 7F), suggesting that BTL2 might activate ADR1 family NLRs. Similarly, p35S::SCOOPL1-HA-induced growth defects were also reduced in adr1/adr1-L1/adr1-L2 (Figure 7B). Thus, SCOOPL1-BTL2-MIK2-mediated signaling depends on the ADR1 module. In addition, PEP1-, SCOOP10B-, and SCOOPL1-induced resistance to Pst DC3000 was partially compromised in adr1/adr1-L1/adr1-L2 (Figure 7G).
The lipase-like proteins ENHANCED DISEASE SUSCEPTIBILITY 1 (EDS1) and PHYTOALEXIN DEFICIENT 4 (PAD4) function with ADR1s to promote ETI and basal immunity50. BTL2/CNGC20-induced cell death was impaired upon silencing EDS1, PAD4, or ADR1 in N. benthamiana (Figure S7A). Similarly, cell death and PR1 expression triggered by coexpressing BTL2 and CNGC20 were compromised in eds1–2, pad4–1, and adr1/adr1-L1/adr1-L2 compared to WT (Figure S7B–D). Notably, the TIR domain-containing NLR (TNL) CSA1 had little effect on BTL2/CNGC20-induced cell death and PR1 expression (Figures S7B–D). In addition, PEP1-induced resistance to Pst DC3000 was partially compromised in eds1–2 and pad4–1 compared to WT (Figures S7E). SCOOPL1-overexpression-induced plant growth defects were partially suppressed in eds1–2 (Figure S7F). These results indicate that the BTL2-mediated autoimmunity is dependent on the EDS1-PAD4-ADR1 module. Furthermore, the expression of SCOOP10, SCOOPL1, ADR1, ADR1-L1, and ADR1-L2 was increased in BTL2-overexpression plants compared to WT plants (Figure S7G), implying BTL2 is likely involved in a feed-forward loop leading to the transcriptional up-regulation of phytocytokines and the ADR1 family of signaling NLRs. TNL SUPPRESSOR-OF-NPR1, CONSTITUTIVE 1 (SNC1) gain-of-function mutant snc1–1 activates autoimmunity in an EDS1/PAD4/ADR1-dependent manner51. The snc1–1-induced growth retardation still occurred in btl2 and mik2 mutants (Figure S7H), corroborating that BTL2/MIK2 act upstream of NLRs to activate the EDS1-PAD4-ADR1 module.
BAK1 could be perturbed by pathogen effectors upon infections43–46. For example, Pst effector HopB1 cleaves MAMP-activated BAK1 to dampen PTI45. HopB1 in transgenic plants or P. fluorescens triggers ADR1-dependent cell death, especially with flg22 treatment30. Cell death triggered by P. fluorescens carrying HopB1 was reduced in btl2–1 (Figure S7I). Additionally, HopB1-induced cell death upon flg22 treatment in protoplasts was reduced in btl2–1 compared to WT (Data S1.5). The data substantiate the essential function of BTL2 when BAK1 is hijacked upon pathogen infection.
DISCUSSION
As the coreceptors of multiple PRRs, the integrity of BAK1 and SERK4 is central to maintaining immune homeostasis. Depletion of BAK1/SERK4 triggers autoimmunity while abolishing BAK1/SERK4-mediated PTI25,26. We reveal here that BTL2 activates defense and cell death in the absence of BAK1 and SERK4, and btl2 mutants suppress the seedling lethality of the bak1–4/serk4–1 null mutant. Upon pathogen attacks, PRR/BAK1/SERK4 complexes perceive MAMPs and activate PTI. BAK1 and SERK4 suppress the BTL2 activation through phosphorylation at S676 (Figure 7H). BTL2 does not contribute to PTI under normal physiological conditions. PTI induces the production of DAMPs and phytocytokines, which are perceived by cognate PRRs to induce ADR1-dependent DTI for a robust and balanced PTI (Figure 7H). Some pathogen effectors target BAK1/SERK4 for degradation or perturbation, which leads to the derepression of BTL2. BTL2 autophosphorylates at T669 and activates the CNGC20 Ca2+ channels, producing phytocytokines (Figure 7H). BTL2 associates with phytocytokine receptors to potentiate DTI signaling (Figure 7H). Amplification of multiple phytocytokine signaling and massive Ca2+ influx triggers the EDS1-PAD4-ADR1-mediated autoimmunity. BTL2 might be involved in the mutual transcriptional amplification loop to boost immune signaling in the absence of BAK1/SERK4 as many SCOOP genes were induced upon PEP1 treatment, and vice versa20,52 (Data S1.6). In addition, as Ca2+ permeable nonselective cation channels53, ADR1s likely facilitate Ca2+ influx to potentiate autoimmunity. Thus, BTL2 is evolved to sense the perturbation of BAK1/SERK4 and activate NLR-mediated phytocytokine-induced resistance to compensate for the abolished PTI. However, this surveillance system risks causing autoimmunity due to the defense overactivation if BTL2 is not constrained by BAK1/SERK4-mediated phosphorylation.
Transphosphorylation between BAK1 and RKs occurs upon ligand-induced heterodimerization and is critical for receptor complex activation22,54,55. In the current model, BAK1 phosphorylates RKs to activate the receptor complexes and initiate signaling22,54. For example, BAK1 phosphorylates BRI1 to potentiate the BRI1 kinase activity and boost the BR signaling55. In another example, flg22-activated BAK1 phosphorylates fungal chitin receptor CERK1 in activating CERK1 from an off-state to a primed state for cross-protecting plants against fungal infections56. However, BAK1 phosphorylates BTL2, leading to suppressing BTL2 and turning off autoimmune signaling. Thus, BAK1-mediated phosphorylation of interacting RKs serves as a switch to either activate or inactivate signaling. On the other hand, BTL2 association with PEPRs/MIK2 is enhanced upon PEP and SCOOP perception, and the BTL2 kinase activity is required for its cell death inducibility. Therefore, transphosphorylation likely occurs between PEPRs/MIK2 and BTL2, subsequentially activating phytocytokine signaling and autoimmunity.
Plant CNGCs are versatile Ca2+ channels regulating plant immunity57,58. The protein abundance and activity of CNGCs are under tight control to maintain cellular Ca2+ homeostasis28,59. Both Arabidopsis and rice receptor-like cytoplasmic kinases phosphorylate and activate CNGCs that mediate MAMP-induced Ca2+ influx in plant PTI60,61. A gain-of-function CNGC20 mutant leads to enhanced PTI and ETI responses, presumably due to the misregulation of Ca2+ channel activities59. BAK1 phosphorylates CNGC20/CNGC19, leading to the degradation of CNGC proteins to keep cytoplasmic Ca2+ at a low level28. In bak1/serk4, both CNGC20/CNGC19 proteins and transcripts are overproduced, leading to the misregulation of Ca2+ influx and signaling, ultimately, cell death28. However, overexpression of CNGC20 or CNGC19 is insufficient to induce cell death, implying additional components regulating the CNGC20/CNGC19 activity. We show that BTL2 and CNGC20 synergistically activate cell death, and BTL2 phosphorylates and promotes the CNGC20 channel activity. Thus, CNGC20 protein abundance and activity are distinctly regulated by two RKs, BAK1-mediated phosphorylation for stability and BTL2-mediated phosphorylation for activity.
As a coreceptor of multiple PRRs, BAK1 is targeted by multiple pathogen effectors. P. syringae effectors AvrPto, AvrPtoB, and HopF1 interact with BAK1 and block the PRR complex formation while HopB1 cleaves immune-activated BAK1, and fungal pathogen Colletotrichum higginsianum induces BAK1 degradation43–46. The loss of BAK1 leads to the sensitized PEPR signaling, contributing to bak1/serk4 cell death46. Our study reveals that BTL2 compensates for the dampened immunity upon the BAK1 depletion by over-activating multiple phytocytokine signaling. BTL2 has no detectable contributions to PTI in WT plants. This is likely due to BAK1-mediated phosphorylation and inactivation to avoid the overactivation of phytocytokine signaling and NLR-mediated autoimmunity. However, PEP/SCOOP-induced immune responses were compromised in bak1–4/btl2–1. In addition, PEPs/SCOOPs induce the association of BTL2 and PEPRs/MIK2, respectively. Thus, upon pathogen perturbation of BAK1/SERK4, BTL2 might serve as an alternative coreceptor for multiple DAMP/phytocytokine receptors to activate DTI. Consistently, PEP/SCOOP-induced immune responses were almost blocked entirely in bak1–4/serk4–1/btl2–1.
ETI pathways contribute to autoimmunity in the weak bak1–3/serk4–1 mutant62. Helper NLR ADR1s and TNL CHS3-CSA1 pair regulate bak1–3/serk4–1 autoimmunity30,32. CSA1 is also involved in bak1/bir3- and HopB1-mediated cell death31. We show that BTL2-induced autoimmunity partially depends on the EDS1-PAD4-ADR1 module. TIR-catalyzed signaling molecules promote the EDS1-PAD4 interaction with ADR1-L163, and TNLs are induced upon PTI activation9. Notably, 15 TNLs were upregulated in bak1–4/serk4–1 compared to WT27 (Figure S7J). Two TNLs, AT4G11170 and AT3G04220, markedly upregulated in bak1–4/serk4–1, were also upregulated upon MAMP treatments9. Nevertheless, our results indicate that PEP/PEPR/BTL2- and SCOOP/MIK2/BTL2-activated immunity depends on EDS1-PAD4-ADR1 and the involvement of the EDS1-PAD4-ADR1 module in BTL2-induced cell death highlights the intertwined nature of PTI, DTI, and ETI in regulating plant immunity and autoimmunity.
Limitations of the study
In our current model, BTL2-mediated immunity can be switched on or off through BAK1-mediated phosphorylation. BTL2 with extracellular 20 LRRs belongs to the LRR-RK subfamily XI, most of which perceive peptide ligands. Therefore, BTL2 might also perceive yet-identified ligand(s) to activate autoimmunity. BTL2 may perceive a unique phytocytokine to initiate signaling upon BAK1 depletion. Alternatively, in the presence of BAK1, a ligand may be perceived by BTL2, possibly with BAK1 as the co-receptor, leading to the transphosphorylation and inactivation of BTL2 by BAK1. Although LRR-RKs often activate the signaling upon ligand perception, a ligand-deprivation-dependent activation mechanism has recently been proposed in switching plant growth and stress response mediated by PSY-family peptides and PSYR receptors64. BTL2 and its potential ligand may deploy a similar mechanism in regulating immunity.
STAR METHODS
RESOURCE AVAILABILITY
Lead contact
Further information and requests for resources and reagents should be directed to and will be fulfilled by the Lead Contact, Libo Shan (lshan@tamu.edu).
Materials availability
Plasmids and transgenic plants generated in this study will be made available on request to the scientific community, but we may require a payment and/or a completed Materials Transfer Agreement.
Data and code availability
The published article includes all datasets generated or analyzed during this study.
EXPERIMENTAL MODEL AND SUBJECT DETAILS
Arabidopsis thaliana and growth conditions
Arabidopsis accession Col-0 (WT), mutants, and transgenic plants used in this study were grown in soil (Metro Mix 366) in a growth room at 23°C, 45% relative humidity, 85 μE m−2s−1 light with a 12-hr light/12-hr dark photoperiod for two weeks before VIGS assays or four weeks for protoplast isolation, ROS production, and pathogen assays. The bak1–4, pepr1/pepr2, stt3a-2, cngc20–1, bak1–4/serk4–1, bak1–5/serk4–1, bak1–4/serk4–1/cngc20–1, bak1–4/serk4–1/cngc20–1/cngc19, esd1–2, pad4–1, and adr1/adr1-L1/adr1-L2 mutants were reported previously18,27,28,65–69. The Arabidopsis T-DNA insertion lines were obtained from the Arabidopsis Biological Resource Center (ABRC), and the btl2 mutants (salk_033924c, cs800007, and salk_109214c) and csa1–2 (SALK_023219) mutant were confirmed by PCR and RT-PCR using primers listed in Table S2. The bak1–4/btl2–1 and bak1–4/serk4–1/btl2–1 mutants were generated by genetic confirmed by genotyping PCR using primers listed in Table S2. Seedlings were grown on plates containing half-strength Murashige and Skoog medium (½MS) with 0.5% sucrose, 0.8% agar, and 2.5 mM MES at pH 5.7 in a growth room with the same condition as the above.
Nicotiana benthamiana and growth conditions
Nicotiana benthamiana was grown in a growth room in soil under a 12-hr light/12-hr dark photoperiod at 23°C.
Bacterial strains
The various bacteria strains used in this study were described in the Key Resources Table. Pseudomonas syringae pv. tomato (Pst) DC3000 was grown on the King’s B (KB) medium plates with 50 μg/ml rifampicin. Pst DC3000 carrying avrRpt2, avrRps4 or avrRpm1 was grown with 50 μg/ml kanamycin and 50 μg/ml rifampicin. P. syringae pv. maculicola ES4326 (Psm) was grown with 50 μg/ml Streptomycin. P. fluorescens was grown on KB medium with 50 μg/ml rifampicin, and P. fluorescens 55 carrying HopB1 was grown on KB medium with 50 μg/ml rifampicin, 20 μg/ml tetracycline, and 10 μg/ml gentamycin70. All the Pseudomonas strains were grown on plates at 28°C for 2 days for further inoculum preparation.
Key resources table
| REAGENT or RESOURCE | SOURCE | IDENTIFIER |
|---|---|---|
| Antibodies | ||
| Anti-HA-Peroxidase | Roche | Cat # 12013819001; RRID:AB_439705 |
| Anti-FLAG-Peroxidase | Sigma-Aldrich | Cat # A8592; RRID:AB_259529 |
| Anti-BAK1 | Genescript | This paper |
| Anti-Mouse IgG HRP-linked antibody | Cell Signaling | Cat # 7076; RRID:AB_330924 |
| Phospho-p44/42 MAPK (Erk1/2) Antibody | Cell Signaling | Cat #9101; RRID:AB_331646 |
| Anti-rabbit IgG HRP-linked antibody | Cell Signaling | Cat #7074; RRID:AB_2099233 |
| Anti-FLAG M2 Affinity gel | Sigma-Aldrich | Cat # 2220; RRID:AB_10063035 |
| Protein G Agarose | Roche | Cat #05015952001 |
| Anti-cMyc HRP-linked antibody | Biolegend | Cat # 626803; RRID:AB_2572009 |
| Bacterial and virus strains | ||
| Agrobacterium tumefaciens GV3101 | de Oliveira et al., 2016 | N/A |
| E. coli BL21 | Shan et al., 2008 | N/A |
| Pseudomonas syringae pv. tomato DC3000 (Pst) | Yu et al., 2019 | N/A |
| P. syringae pv. maculicola ES4326 (Psm) | Yu et al., 2019 | N/A |
| Pst avrRpt2 | Shan et al., 2008 | N/A |
| Pst avrRpm1 | Yu et al., 2019 | N/A |
| Pst avrRps4 | Yu et al., 2019 | N/A |
| Pseudomonas fluorescens | Guo et al., 2009 | N/A |
| Pseudomonas fluorescens 55 HopB1 | Guo et al., 2009 | N/A |
| Chemicals, peptides, and recombinant proteins | ||
| flg22 | Mang et al., 2017 | N/A |
| PEP1 | Mang et al., 2017 | N/A |
| PEP2 | This paper | N/A |
| SCOOPL125–72 | This paper | N/A |
| SCOOPL125–57 | This paper | N/A |
| SCOOPL158–72 | This paper | N/A |
| SCOOP10B | Hou et al., 2021a | N/A |
| Tunicamycin | AG Scientific | Cat #11089–65-9 |
| Endo H | New England BioLabs | Cat # P0702L |
| INA | Sigma | Cat #456543 |
| TRIzol Reagent | Invitrogen | Cat#15596026 |
| RNase-free DNase I | New England BioLabs | Cat #M0303L |
| FM4–64 | ThermoFisher | Cat #T13320 |
| IPTG | Sigma-Aldrich | Cat# I6758 |
| Pierce glutathione agarose | Thermo Scientific | Cat# 16101 |
| amylose resin | New England BioLabs | Cat# E8021L |
| Luminol | Sigma-Aldrich | Cat#A8511 |
| Peroxidase from horseradish | Sigma-Aldrich | Cat#P6782 |
| 3,3’-Diaminobenzidine | Sigma-Aldrich | Cat#D12384 |
| Aniline blue | Sigma-Aldrich | Cat#415049 |
| Trypan blue | MP Biomedicals | Cat#195532 |
| Critical commercial assays | ||
| M-MuLV Reverse Transcriptase | New England BioLabs | Cat # M0253L |
| iTaq SYBR green Supermix | Bio-Rad | Cat # 1725124 |
| mMESSAGE mMACHINE T7 high yield RNA Transcription Kit | Ambion | Cat # AM1344 |
| Phusion U Hot Start DNA polymerase | Thermo Fisher | Cat # F555 |
| USER enzyme mix | New England Biolabs | M550 |
| Experimental models: Organisms/strains | ||
| Arabidopsis thaliana Col-0 wild-type | de Oliveira et al., 2016 | N/A |
| bak1–4 | de Oliveira et al., 2016 | N/A |
| btl2–1 | ABRC | SALK_033924C |
| btl2–2 | ABRC | CS800007 |
| btl2–3 | ABRC | SALK_109214C |
| stt3a-2 | de Oliveira et al., 2016 | CS800052 |
| cngc20–1 | Yu et al., 2019 | SALK_129133C |
| mik2–1 | Hou et al., 2021a | SALK_061769 |
| at2g41820 | ABRC | SALK_082484C |
| csa1–2 | ABRC | SALK_023219C |
| pad4–1 | Yang and Hua, 2004 | N/A |
| eds1–2 | Chang et al., 2019 | N/A |
| adr1/adr1 -L 1/adr1 -L2 | Bonardi et al.,2011 | N/A |
| bak1–4/serk4–1 | de Oliveira et al., 2016 | N/A |
| bak1–5/serk4–1 | Hou et al., 2021a | N/A |
| pepr1/pepr2 | Yamada et al., 2016 | N/A |
| bak1–4/btl2–1 | This paper | N/A |
| bak1–4/serk4– 1/btl2–1 | Yu et al., 2019 | N/A |
| bak1 −4/serk4– 1/cngc20–1 | Yu et al., 2019 | N/A |
| bak1–4/serk4– 1/cngc20– 1/cngc 19 | Yu et al., 2019 | N/A |
| pBTL2::gBTL2-HA/btl2–1 | This paper | N/A |
| pBTL2::gBTL2-HA/bak1–4/serk4– 1/btl2–1 | This paper | N/A |
| pBTL2::gBTL2-HA/WT | This paper | N/A |
| pBTL2::gBTL2 KM -HA/btl2–1 | This paper | N/A |
| pBTL2::gBTL2 T669A -HA/ bak1–4/serk4– 1/btl2–1 | This paper | N/A |
| pBTL2::gBTL2 S676D -HA/ bak1–4/serk4– 1/btl2–1 | This paper | N/A |
| pBTL2::gBTL2-HA/cngc20–1 | This paper | N/A |
| pBTL2::gBTL2-HA/pepr1/2 | This paper | N/A |
| pBTL2::gBTL2-FLA G/WT | This paper | N/A |
| pBTL2::gBTL2-HA/mik2–1 | This paper | N/A |
| pBTL2::gBTL2-HA/adr1 triple | This paper | N/A |
| pBTL2::gBTL2-HA/stt3a-2 | This paper | N/A |
| p35S::SCOOPL1/WT | This paper | N/A |
| p35S::SCOOPL1/btl2–1 | This paper | N/A |
| p35S::SCOOPL1/mik2–1 | This paper | N/A |
| p35S::SCOOPL1/ adr1 triple | This paper | N/A |
| p35S::SCOOPL1/eds1–2 | This paper | N/A |
| p35S::SCOOPL1 1−72 /WT | This paper | N/A |
| p35S::SCOOP10/WT | This paper | N/A |
| p35S::SCOOPW/eds1–2 | This paper | N/A |
| pSNC1::snc1–1-GFP/WT | This paper | N/A |
| pSNC1::snc1–1-GFP/btl2–1 | This paper | N/A |
| pSNC1::snc1–1-GFP/mik2–1 | This paper | N/A |
| Xenopus laevis | Yu et al., 2019 | N/A |
| Saccharomyces cerevisiae strain AH109 | Yu et al., 2019 | N/A |
| Botrytis cinerea strain B05.10 | van Kan et al., 1997 | N/A |
| Sclerotinia sclerotiorum strain 1980 | Godoy et al., 1990 | N/A |
| Nicotiana benthamiana | Yu et al., 2019 | N/A |
| Oligonucleotides | ||
| Primers for VIGS, cloning and point mutation, see Table S2 | This paper | N/A |
| Primers for genotyping, see Table S2 | This paper | N/A |
| Primers for RT-qPCR and RT-PCR, see Table S2 | This paper | N/A |
| Recombinant DNA | ||
| pYL156 (pTRV-RNA2) | de Oliveira et al., 2016 | N/A |
| pTRV-RNA1 | de Oliveira et al., 2016 | N/A |
| pYL156-GFP | de Oliveira et al., 2016 | N/A |
| pYL156-BAK1/SERK4 | de Oliveira et al., 2016 | N/A |
| pYL156-MEKK1 | de Oliveira et al., 2016 | N/A |
| pYL156-BIR1 | de Oliveira et al., 2016 | N/A |
| pYL156-NbEDS1 | This paper | N/A |
| pYL156-NbPAD4 | This paper | N/A |
| pYL156-NbADR1 | This paper | N/A |
| pYL156-CNGC19/20 | This paper | N/A |
| pYL156-BAK1/SERK4/BTL2 | This paper | N/A |
| pHBT | Yu et al., 2019 | N/A |
| pGST | Yu et al., 2019 | N/A |
| pMAL-c2 | Yu et al., 2019 | N/A |
| pCB302 | Yu et al., 2019 | N/A |
| pGADT7 | Yu et al., 2019 | N/A |
| pGBKT7 | Yu et al., 2019 | N/A |
| pNB1 | Yu et al., 2019 | N/A |
| pHBT-p35S::GCaMP3 | Yu et al., 2019 | N/A |
| pHBT-BAK1-HA | Yu et al., 2019 | N/A |
| pHBT-BIK1-HA | Yu et al., 2019 | N/A |
| pHBT-BAK1-FLAG | Yu et al., 2019 | N/A |
| pHBT-CNGC20-HA | Yu et al., 2019 | N/A |
| pHBT-CNGC20-FLAG | Yu et al., 2019 | N/A |
| pHBT-CNGC20-GFP | Yu et al., 2019 | N/A |
| pHBT-CNGC20 N430/453/455Q -HA | This paper | N/A |
| pHBT-CNGC20 N430/453/455Q -GFP | This paper | N/A |
| pHBT-PEPR1-HA | This paper | N/A |
| pHBT-PEPR1-FLAG | This paper | N/A |
| pHBT-PEPR2-FLAG | This paper | N/A |
| pHBT-MIK2-FLAG | Hou et al., 2021a | N/A |
| pHBT-FLAG-GFP | Kong et al., 2021 | N/A |
| pUBQ::GUS | Gao et al., 2013 | N/A |
| pPR1::LUC | This paper | N/A |
| pHBT-BAK1-cYFP | Yu et al., 2019 | N/A |
| pGBKT7-BAK1 JK | This paper | N/A |
| pGBKT7-BAK1 K | Yu et al., 2019 | N/A |
| pMAL-BAK1 JK -HA | Yu et al., 2019 | N/A |
| pMAL-BAK1 JK-KM -HA | Yu et al., 2019 | N/A |
| pHBT-AvrRpm1-HA | Gao et al., 2013 | N/A |
| pHBT-HopB1-GFP | He et al., 2006 | N/A |
| pGST-CNGC20C | Yu et al., 2019 | N/A |
| pGST-CNGC20N | Yu et al., 2019 | N/A |
| pCB302–35S::BAK1-FLAG | This paper | N/A |
| pCB302–35S::CNGC20-HA | Yu et al., 2019 | N/A |
| pSNC1:snc1–1-GFP | Mang et al., 2012 | N/A |
| pHBT-gBTL2-HA | This paper | N/A |
| pHBT-gBTL2-GFP | This paper | N/A |
| pHBT- gBTL2-nYFP | This paper | N/A |
| pHBT-gBTL2 T669A -HA | This paper | N/A |
| pHBT-gBTL2 T657A -HA | This paper | N/A |
| pHBT-gBTL2 T657D -HA | This paper | N/A |
| pHBT-gBTL2 S676A -HA | This paper | N/A |
| pHBT-gBTL2 S676D -HA | This paper | N/A |
| pHBT-gBTL2 N240/477/545Q -HA | This paper | N/A |
| pHBT-gBTL2 KM -HA | This paper | N/A |
| pGST-BTL2 JK | This paper | N/A |
| pGST-BTL2 K | This paper | N/A |
| pGST-BTL2 JK-KM | This paper | N/A |
| pGST-BTL2 JK-T669A | This paper | N/A |
| pGST-BTL2 JK-S676A | This paper | N/A |
| pGST-BTL2 JK-S676D | This paper | N/A |
| pGST-BTL2 JK-KM-S676A | This paper | N/A |
| pMAL-BTL2 JK -HA | This paper | N/A |
| pAD-BTL2 JK | This paper | N/A |
| pAD-BTL2 K | This paper | N/A |
| pCAMBIA 1300-pBTL2::gBTL2-HA | This paper | N/A |
| pCAMBIA 1300-pBTL2::gBTL2-FLAG | This paper | N/A |
| pCAMBIA 1300-pBTL2::gBTL2 KM -HA | This paper | N/A |
| pCAMBIA 1300-pBTL2::gBTL2 T669A -HA | This paper | N/A |
| pCAMBIA 1300-pBTL2::gBTL2 S676D -HA | This paper | N/A |
| pCAMBIA 1300-pBTL2::gBTL2 S676A -HA | This paper | N/A |
| pCAMBIA 1300-pBTL2::gBTL2 N240/477/545Q -HA | This paper | N/A |
| pCAMBIA 1300-pBTL2::gBTL2-GFP | This paper | N/A |
| pCAMBIA1300-pMIK2::gMIK2-mCherry-2HA | This paper | N/A |
| pCAMBIA 1300-pPEPR1::gPEPR1-mCherry-2HA | This paper | N/A |
| pCAMBIA1300-pCNGC20::gCNGC20-mCherry-2HA | This paper | N/A |
| pMDC-2×35S::BTL2-HA | This paper | N/A |
| pMDC-2×35S::CNGC20-HA | This paper | N/A |
| pMDC-2×35S::SCOOPL1-HA | This paper | N/A |
| pMDC-2×35S::SCOOPL1 1−72 -HA | This paper | N/A |
| pNB1-CNGC20-YFP | This paper | N/A |
| pNB1-BTL2-CFP | This paper | N/A |
| pNB1-BTL2 KM -CFP | This paper | N/A |
| pNB1-BTL2 S676D -CFP | This paper | N/A |
| pNB1-BAK1-mCherry | This paper | N/A |
| pNB1-BAK1 KM -mCherry | This paper | N/A |
| Software and algorithms | ||
| ImageJ | NIH | RRID:SCR_003070 https://imagej.nih.gov/ij/ |
| LTQ Orbitrap XL LC-MS/MS system | Thermo Scientific | N/A |
| Mascot | Matrix Science | Version 2.2.2 RRID:SCR 014322 |
| Leica Application Suite X (LAS X) software | Leica | Version 3.5.5.19976 RRID:SCR_013673 |
| GraphPad Prism 8 | GraphPad | RRID: SCR_002798 |
Fungal strains
Botrytis cinerea strain B05.1071 and Sclerotinia sclerotiorum strain 198072 were cultured on potato dextrose agar (PDA, 200 g potato, 20 g glucose, 20 g agar, and 1 L water) at 20 °C.
METHOD DETAILS
Plasmid construction, generation of transgenic plants, and elicitor/inhibitor usage
The VIGS of BAK1/SERK4, MEKK1, and BIR1 constructs and the pHBT-BIK1-HA, pHBT-BAK1-GFP, pHBT-BAK1-FLAG, pHBT-CNGC20-HA, pHBT-CNGC20-FLAG, pUBQ::GUS, pHBT-BAK1-cYFP, pBK-BAK1JK, pBK-BAK1K, pMAL-BAK1JK-HA, pMAL-BAK1JK-KM-HA, pGST-CNGC20C, pGST-CNGC20N, pCB302–35S::BAK1-FLAG, pCB302–35S::CNGC20-HA, and pSNC1:snc1–1-GFP constructs were reported previously28,42,65,73,74. The BTL2 gene was amplified from Col-0 genomic DNA (gBTL2) with primers containing NheI at the N-terminus and StuI at the C-terminus. The PEPR1 gene was amplified from Col-0 cDNA with primers containing BamHI at the N-terminus and StuI at the C-terminus. Fragments encoding the BTL2 cytosolic domain (BTL2JK) and kinase domain (BTL2K) were amplified from Col-0 cDNA with primers containing XbaI at the N-terminus and StuI at the C-terminus (Table S2). The above fragments were ligated into a plant protoplast expression vector pHBT under the control of a CaMV 35S promoter with an HA, FLAG, GFP, or nYFP tag at the C-terminus. The point mutations of gBTL2KM, gBTL2T669A, gBTL2T657A, gBTL2T657D, gBTL2S676A, gBTL2S676D, gBTL2N240Q/477Q/N545Q, BTL2JK-KM, BTL2JK-T669A, BTL2JK-S676D, BTL2JK-KM-S676A, and CNGC20N430Q/N452Q/N455Q were generated by site-directed mutagenesis with primers listed in Table S2.
To construct the E.coli expression vectors, the BTL2JK was subcloned into a modified pMAL-c2 vector with XbaI and StuI digestion. The BTL2JK, BTL2K, BTL2JK-KM, BTL2JK-T669A, BTL2JK-S676A, BTL2JK-S676D, and BTL2JK-KM-S676A were subcloned into a modified GST fusion protein expression vector pGEX4T-1 (Pharmacia) using XbaI and StuI digestion. The BTL2JK and BTL2K were subcloned into a modified pGADT7 vector (Clontech) for yeast two-hybrid assays using partial digestion with BamHI and StuI.
To introduce BTL2 into the binary vectors, the fragment containing the 35S promoter-driven gBTL2, together with the epitope tag and the NOS terminator, was released from the pHBT vector by partial digestion with XhoI and EcoRI, and ligated into the pCAMBIA1300 linearized by SalI and EcoRI. To construct the pCAMBIA1300 binary vector containing the native promoter-driven gBTL2, the BTL2 promoter (2 kb upstream of the start codon) was amplified from Col-0 genomic DNA using primers containing XhoI/SacI at N-terminus and NheI at C-terminus (Table S2), and ligated into pHBT-p35S::gBTL2-HA to obtain the pHBT-pBTL2::gBTL2-HA vector. The pBTL2:: gBTL2-HA, together with the NOS terminator, was released from pHBT-pBTL2::gBTL2-HA using partial digestion with XhoI and EcoRI, and ligated into pCAMBIA1300 to obtain the pCAMBIA1300-pBTL2::gBTL2-HA binary vector. The point mutations of gBTL2KM, gBTL2T669A, and gBTL2S676D were generated by site-directed mutagenesis in the corresponding vector. The binary vectors with the FLAG-epitope-tag were generated similarly. SCOOPL1 or SCOOPL11−72 was amplified from Col-0 genomic DNA with primers containing BamH1 at the N-terminus and StuI at the C-terminus, and ligated into the pMDC32 vector under the control of 2 x CaMV 35S promoter with an HA tag at the C-terminus.
To construct the pCAMBIA1300 binary vector containing the endogenous promoter-driven gMIK2, gPEPR1, and gCNGC20 with a mCherry tag at the C-terminus, the promoter (2-kb upstream of the start codon) and genomic sequence of each gene was amplified from Col-0 genomic DNA using primers containing HindIII at N-terminus and SmaI at C-terminus (Table S2), and ligated into pCAMBIA1300-mCherry-HA to obtain pCAMBIA1300-pMIK2::gMIK2-mCherry-2HA, pCAMBIA1300-pPEPR1::gPEPR1-mCherry-2HA, or pCAMBIA1300-pCNGC20::gCNGC20-mCherry-2HA constructs.
To construct the oocyte expression vectors for electrophysiology studies, cDNAs of CNGC20, BTL2, BTL2KM, BTL2S676D, BAK1, and BAK1KM were cloned into the pNB1 serial vectors using the USER method to obtain pNB1-CNGC20-YFP, pNB1-BTL2-CFP, pNB1-BTL2KM-CFP, pNB1-BTL2S676D-CFP, pNB1-BAK1-mCherry, and pNB1-BAK1KM-mCherry expression vectors75. Uracil-containing forward primer was designed as 5′-GGCTTAAU + sequence complementary to the target gene-3′, and reverse primer as 5′-GGTTTAAU + sequence complementary to the target gene-3′. PCR was performed with Phusion U Hot Start DNA polymerase (Thermo Fisher, F555) according to the manufacturer’s instructions. The reaction mixture containing PCR product, USER enzyme mix (New England Biolabs, M550), and PacI/Nt.BbvCI digested pNB1 vector was incubated for 20 min at 37°C followed by 20 min at 25°C, and then transformed into chemically competent E. coli.
The sequences of all genes or promoters were verified by Sanger sequencing. The binary plasmids were transformed into Agrobacterium tumefaciens strain GV3010 and then introduced into Arabidopsis using the floral dipping method.
The elicitors flg22 and PEP1 were reported previously65. PEP2 (DNKAKSKKRDKEKPSSGRPGQTNSVPNAAIQVYKED) , SCOOPL125–72 (NGFAAQMEHR KLGGPKKTMTMRRNLEENGRQGSKIATPGSTSRHSGQK), SCOOPL125–57 (NGFAAQMEH RKLGGPKKTMTMRRNLEENGRQGS), SCOOPL1/SCOOPL158–72 (KIATPGSTSRHSGQK), and SCOOP10B (PNGDIFTGPSGSGHGGGR) were synthesized from BIOMATIK. Tunicamycin (AG Scientific #11089–65-9) was diluted in DMSO (10 mg/ml). Endo H was from New England BioLabs (P0702L).
Transient expression and cell death assay in Nicotiana benthamiana and Arabidopsis
For transient assays in N. benthamiana, the indicated constructs were transferred into A. tumefaciens strain GV3010 by electroporation. A single transformant was transferred into 2 ml Luria-Bertani (LB) liquid medium containing 50 μg/ml kanamycin and 25 μg/ml gentamicin for overnight incubation at 28 °C. Bacteria were harvested by centrifugation at 1,200 g and resuspended at OD600=0.8 for 3 hr at room temperature in the buffer containing 10 mM MgCl2, 10 mM MES, and 200 μM acetosyringone. The Agrobacterial cultures were infiltrated into the leaves of four-week-old N. benthamiana for Co-IP or cell death assays in WT plants, or into the upper leaves of the VIGS infiltrated plants at two-weeks after VIGS infiltration for cell death assay. Proteins were isolated 2–3 days after inoculation from the infiltrated area and subjected to immunoblot analysis. Cell death was observed three days after infiltration, and pictures were taken under UV light with the ChemiDoc Imaging System.
The Arabidopsis transient assays were done as previously reported with modifications (Kim et al., 2009; Park et al., 2011). Briefly, A. tumefaciens strain GV3010 carrying the indicated constructs was cultured in LB liquid medium containing corresponding antibiotics and subcultured in Agrobacterium (AB) minimal medium containing 50 mM MES, pH 5.5, 2% glucose, and 200 μM acetosyringone for 12–16 hr at 28°C with gentle shaking (200 rpm). The Agrobacteria were harvested and resuspended in infiltration buffer (½AB medium, ¼MS, 25 mM MES, pH 5.5, 2% glucose, 200 μM acetosyringone, and freshly added 0.01% Triton X-100) at OD600 = 1.0, and the suspension was hand-inoculated into the three largest leaves of four-week-old Arabidopsis plants. Total proteins were extracted from the infiltrated leaves and detected by immunoblotting at three days post-infiltration (dpi). RT-qPCR and Trypan blue staining for quantifying cell death were performed at five dpi.
The Arabidopsis protoplast isolation and transient assay followed the reported protocol76. The GUS activity-based cell death assay in protoplasts was reported previously77. Briefly, pUBQ::GUS was cotransfected with the indicated effectors, and the cell viability was presented as the percentage of GUS activity in effector-transfected cells compared to FLAG-GFP transfection controls.
Agrobacterium-mediated virus-induced gene silencing (VIGS) assay
Plasmids containing binary TRV vectors pTRV-RNA1 and pTRV-RNA2 derivatives, pYL156-BAK1/SERK4, pYL156-MEKK1, pYL156-BIR1, pYL156-BAK1/SERK4/BTL2, pYL156-CNGC19/CNGC20, pYL156-NbEDS1, pYL156-NbPAD4, pYL156-NbADR1, and pYL156-GFP (the vector control) were introduced into Agrobacterium tumefaciens strain GV3101 by electroporation. Bacterial cultures were first grown in LB medium containing 50 μg/ml kanamycin and 25 μg/ml gentamicin overnight and then sub-cultured in fresh LB medium containing 50 μg/ml kanamycin and 25 μg/ml gentamicin supplemented with 10 mM MES and 20 μM acetosyringone for overnight at 28°C in a roller drum. Cells were pelleted by 4,200 rpm centrifugation, re-suspended in a solution containing 10 mM MgCl2, 10 mM MES, and 200 μM acetosyringone, adjusted to OD600 of 1.5, and incubated at 25°C for at least 3 hr. Bacterial cultures containing pTRV-RNA1 and pTRV-RNA2 derivatives were mixed at a 1:1 ratio and inoculated into the first pair of true leaves of two-week-old soil-grown Arabidopsis or three-week-old soil-grown N. benthamiana plants using a needleless syringe.
Trypan blue and DAB staining
Trypan blue staining and 3, 3’-diaminobenzidine (DAB) staining were performed according to procedures described previously with modifications. Briefly, the excised plant leaves were immersed in trypan blue staining solution (2.5 mg/mL trypan blue in lactophenol [lactic acid: glycerol: liquid phenol: H2O = 1:1:1:1]) or DAB solution (1 mg/mL DAB in 10 mM Na2HPO4 and 0.05% Tween 20). Samples were vacuum-infiltrated for 30 min and then incubated for 8 hr at 25°C with gentle shaking at 75 rpm. Subsequently, samples were transferred to trypan blue destaining solution (ethanol: lactophenol = 2:1) or DAB destaining solution (ethanol: acetic acid: glycerol = 3:1:1) and incubated at 65°C for 30 min. The samples were then incubated in fresh destaining solution at room temperature until complete destaining. Pictures were taken under a dissecting microscope with samples in 10% glycerol.
RT-PCR and RT-qPCR analyses
Total RNA was isolated from ten-day-old seedlings grown on ½ MS plates or leaves of soil-grown plants two weeks after agrobacterial inoculation for VIGS assay with TRIzol reagent (Invitrogen). RNA was reverse transcribed to synthesize first-strand cDNA with M-MuLV reverse transcriptase and oligo (dT) primer following RNase-free DNase I (New England Biolabs) treatment. RT-PCR analysis was carried out using Taq DNA polymerase. Fragments of target genes were amplified using the primers listed in Table S2. UBQ1 was used as an internal control. Fragments were separated in 1.5% agarose gel and revealed by ethidium bromide staining and UV light exposure. Quantitative RT-PCR (RT-qPCR) analysis was carried out using iTaq SYBR green Supermix (Bio-Rad) supplemented with ROX in CFX384 Touch Real-Time PCR Detection System (Bio-Rad). The expression of genes was normalized to the expression of UBQ10.
MAPK assay
Ten-day-old seedlings grown on ½ MS plates were transferred to the water for overnight recovery and then treated with 100 nM flg22 or PEP1 for 15 min. Each sample containing three seedlings was grounded in 40 ul of extraction buffer (150 mM NaCl, 50 mM Tris-HCl pH 7.5, 5 mM EDTA, 1% Triton X-100, 1 mM Na3VO4, 1 mM NaF, 1 mM DTT, 1:200 complete protease inhibitor cocktail from Sigma). The supernatant was collected after 13,400 g centrifugation for 5 min at 4°C, and protein samples with 1 x SDS buffer were loaded on 10% SDS-PAGE gel to detect pMPK3, pMPK4, and pMPK6 by immunoblot with α-pERK1/2 antibody (Cell Signaling, #9101).
Growth inhibition assay
Four days after germination on ½MS plates, Arabidopsis seedlings with uniform root lengths were transferred to 24-well culture plates containing 500 μl liquid ½MS supplemented without or with 1 μM flg22, 1 μM PEP1, or 0.1 μM PEP2. Two seedlings were placed in one well, and four repeats were performed for each treatment/genotype. Seedlings were photographed seven days after transfer, and the root length of individual seedlings was measured.
To measure SCOOP10B and SCOOPL1-induced growth inhibition, the seeds were placed on ½MS plates supplemented with or without 10 nM SCOOP10B or 10 μM SCOOPL125–72 , SCOOPL125–57, or SCOOPL1/SCOOPL158–72. The root length of individual seedlings was photographed and measured 10 days after germination.
ROS assay
Around 25 leaves of four-week-old soil-grown Arabidopsis plants for each genotype were excised into leaf discs (5-mm diameter) and then cut into leaf strips, followed by overnight incubation with water in 96-well plates to eliminate the wounding effect. ROS burst was determined by a luminol-based assay. Leaf strips were soaked with a solution containing 50 μM luminol and 10 μg/mL horseradish peroxidase (Sigma-Aldrich) supplemented with 100 nM flg22, 100 nM PEP1, 1 μM SCOOP10B, or 10 μM SCOOPL1. The measurement was performed immediately after adding the solution with a Multilabel Plate Reader (Perkin-Elmer; Victor X3) or GloMax Navigator Microplate Luminometer (Promega) for a period of ~35 min. The values of ROS production from each line were indicated as means of relative light units.
Callose deposition
The 14-day-old seedlings grown on ½ MS plates were inoculated with 0.1 μM flg22, 0.1 μM PEP1, 1 μM SCOOP10B, or 10 μM SCOOPL1 by using a vacuum pump for 10 min. After 24 hr, the seedlings were collected and transferred into FAA solution (10% formaldehyde, 5% acetic acid, and 50% ethanol) for 12 hr. Then the seedlings were de-stained for 6 hr in 95% ethanol, washed twice with ddH2O, and stained in 0.01% aniline blue solution (150 mM KH2PO4, pH 9.5) for 1 hr. The callose deposits were observed with a fluorescence microscope and were quantified using ImageJ software (https://rsb.info.nih.gov/ij/).
Pathogen infection assays
Pseudomonas syringae pv. tomato (Pst) DC3000, P. syringae pv. maculicola ES4326 (Psm), Pst DC3000 (avrRpt2), Pst DC3000 (avrRpm1), and Pst DC3000 (avrRps4) were cultured overnight at 28°C in the King’s B medium with appropriate antibiotics (50 μg/ml streptomycin, rifampicin or kanamycin). Bacteria were harvested by centrifugation at 4,000 g, washed with ddH2O, and adjusted to the desired density with 10 mM MgCl2. Leaves of four-week-old plants were hand-infiltrated with bacterial suspension using a 1-ml needleless syringe and collected at the indicated time for HR or bacterial growth assays. To measure bacterial growth, two leaf discs were ground in 100 μl H2O, and serial dilutions were plated on TSA medium (1% Bacto tryptone, 1% sucrose, 0.1% glutamic acid, 1.5% agar) with appropriate antibiotics. Bacterial colony forming units (cfu) were counted two days and four days after inoculation. Each data point is shown as triplicates.
B. cinerea conidia were harvested by washing the plates with ddH2O and then filtered through 4-layered sterile Kimwipes. The conidia suspensions were diluted to 2 × 10⁵ conidia/mL for inoculation. Leaves of four-week-old plants were detached and inoculated with 5 μl of B. cinerea conidia or S. sclerotiorum mycelial agar plugs (~1.5 mm in diameter) taken from the margins of colonies actively growing on PDA for two days. The inoculated leaves were placed in a container underlaid with tissue paper moistened with sterile water. The container was sealed with plastic wrap to maintain high humidity and then incubated at 20 °C. Lesion diameters were measured, and the photographs were taken at 48 hpi.
For HopB1-induced cell death, P. fluorescens and P. fluorescens 55 carrying HopB1 were cultured in King’s B (KB) medium. Bacteria were harvested and adjusted to OD600=0.02 with 10 mM MgCl2. Leaves of four-week-old soil-grown plants were hand-infiltrated with water (Mock) or 500 nM flg22 first. The bacterial suspension was then hand-infiltrated into the same leaves 24 hr later. The inoculated leaves were stained with trypan blue to observe the cell death 24 hr after bacterial inoculation.
In vivo co-immunoprecipitation (Co-IP) assay
Arabidopsis protoplasts were transfected with a pair of constructs tested (the empty vector as the negative control) and incubated for 12 hr. Samples were collected by centrifugation and lysed with Co-IP buffer (20 mM Tris-HCl, pH7.5, 100 mM NaCl, 1 mM EDTA, 10% Glycerol, 0.5% Triton X-100 and protease inhibitor cocktail from Roche) by vortexing. For Co-IP in Nicotiana benthamiana, leaves of three-week-old soil-grown plants were hand-infiltrated with different Agrobacterium tumefaciens carrying the indicated vectors. After overnight culture, bacteria were harvested by centrifugation and re-suspended in buffer (10 mM MES, pH 5.7, 10 mM MgCl2, 200 μM acetosyringone) at OD600=1.5. Leaf samples were harvested two days post-inoculation and subjected to homogenization with Co-IP buffer. Protein extract was pre-incubated with protein-G-agarose beads for 1 hr at 4°C with gentle shaking on a rocker. Immunoprecipitation was carried out with α-FLAG agarose (Sigma-Aldrich) for 3 hr at 4°C. The beads were collected and washed three times with washing buffer (20 mM Tris-HCl, pH 7.5, 100 mM NaCl, 1 mM EDTA, 0.1% Triton X-100). The immunoprecipitated proteins and input proteins were analyzed by immunoblotting with indicated antibodies. For Co-IP in transgenic plants, two-week-old transgenic seedlings carrying pBTL2::gBTL2-FLAG grown on the ½ MS plates were harvested. Seedlings of 500 mg were ground into powders with liquid nitrogen and lysed in 2 ml Co-IP buffer by vortexing. Immunoprecipitated proteins and input proteins were analyzed by immunoblotting with α-FLAG-HRP (1:2,000, Roche) or α-BAK1 antibodies (1:2,000, Genescript) followed by α-rabbit-HRP (1:10,000, Cell Signaling).
In vitro pull-down and kinase assays
Fusion proteins were expressed in E. coli BL21 strain using LB medium supplemented with 0.25 mM Isopropyl β-D-1-thiogalactopyranoside (IPTG). Proteins of GST, GST-BTL2JK, GST-BTL2K, GST-BTL2JK-KM, GST-BTL2JK-T669A, GST-BTL2JK-S676D, and GST-BTL2JK-KM-S676A were purified with Pierce glutathione agarose (Thermo Scientific), and proteins of MBP, MBP-BAK1JK, and MBP-BAK1JK-KM were purified using amylose resin (New England Biolabs) according to standard protocols. MBP fusion proteins (tagged with HA) were pre-incubated with prewashed glutathione agarose in 300 μL incubation buffer (20 mM Tris-HCl, pH 7.5, 100 mM NaCl, 0.1 mM EDTA, and 0.5% Triton X-100) for 0.5 hr at 4°C. After centrifugation, the supernatant was collected and incubated with prewashed GST, GST-BTL2JK, or GST-BTL2K beads for another 1 hr. The beads were collected and washed three times with washing buffer (20 mM Tris-HCl, pH 7.5, 300 mM NaCl, 0.1 mM EDTA, and 0.1% Triton X-100). Proteins were detected with an α-HA antibody by immunoblotting. For in vitro kinase assay, the 5 μg of GST-BTL2JK, GST-BTL2JK-KM, GST-BTL2K, GST-BTL2JK-T669A, or GST-BTL2JK-S676D proteins were incubated in the kinase reaction buffer (20 mM Tris-HCl, pH7.5, 20 mM MgCl2, 5 mM EDTA, 1 mM DTT and 100 μM ATP) in the presence of 5 μCi [32P]-γ-ATP for 2 hr at room temperature. The 0.5 μg of MBP, MBP-BAK1JK, or MBP-BAK1JK-KM proteins were incubated with 5 μg of GST, GST-BTL2JK-KM, GST-BTL2K, GST-BTL2JK, GST-BTL2JK-T669A, or GST-BTL2JK-KM-S676A in the kinase reaction buffer in the presence of 5 μCi [32P]-γ-ATP for 2 hr at room temperature. The reactions were stopped by adding SDS sample buffer, and protein phosphorylation was visualized by autoradiography in 10% SDS-PAGE.
Mass spectrometry analysis
The in vitro phosphorylation for MS analysis was performed in a 20 μl reaction for 2 hr at room temperature. The reaction buffer contains 20 mM Tris-HCl, pH 7.5, 20 mM MgCl2, 5 mM EDTA, 1 mM DTT, 5 mM ATP, 10 μg of GST-BTL2JK with or without 1 μg of MBP-BAK1JK. The phosphorylated GST-BTL2JK proteins were resolved by 10% SDS-PAGE gel. The gel was stained with Thermo GelCode Blue Safe Protein Stain and destained with ddH2O. The corresponding bands were sliced and subjected to in-gel digestion with trypsin. The phospho-peptides were enriched and analyzed using an LTQ Orbitrap XL LC-MS/MS system (Thermo Scientific) as previously described78. The MS/MS spectra were analyzed with Mascot (Matrix Science; version 2.2.2), and the identified phosphorylated peptides were manually inspected to ensure confidence in phosphorylation site assignment.
Yeast two-hybrid assay
The plasmids of pGADT7 (empty vector), pGADT7-BTL2JK, or pGADT7-BTL2K were introduced into the yeast strain AH109. The plasmids of pGBKT7, pGBKT7-BAK1JK, or pGBKT7-BAK1K were introduced into AH109 containing pGADT7, pGADT7-BTL2JK, or pGADT7-BTL2K. Polyethylene glycol/LiAc-mediated yeast transformation was performed according to the protocol of Yeastmaker Yeast Transformation System 2 (Clontech). The yeast colonies containing both pGADT7 and pGBKT7 were selected on the synthetic defined (SD) medium without leucine and tryptophan (SD-L-T), and the interaction was tested on the SD medium without histidine, leucine, and tryptophan (SD-H-L-T), and supplemented with 1 mM 3-amino-1, 2, 4-triazole (3-AT).
Microscopic analyses: bimolecular fluorescence complementation, subcellular localization, FRET-FLIM, and TIRF
Protoplasts from four-week-old WT and stt3a were transfected with different pairs of BiFC or GFP-tagged constructs as indicated. Fluorescence signals in the protoplasts were examined 12 hr after transfection using the Zeiss LSM 780 NLO multiphoton confocal system. YFP, GFP, and chlorophyll fluorescence signals were excited at 514, 488, and 633 nm, respectively. Images were captured in multichannel mode with a bright field and processed with Zeiss ZEN microscope software.
For the subcellular localization analysis in N. benthamiana, BTL2-GFP driven by its native promoter was transiently expressed in N. benthamiana by Agrobacterium infiltration. Two days after infiltration, leaves were detached and vacuumed in 50 μM FM4–64 (ThermoFisher) for 30 min, followed by incubation for another 20 min before taking confocal microscopy images. The BTL2-GFP and FM4–64 were detected using a Leica TCS SP8 confocal laser scanning microscope (Germany). The GFP and FM4–64 fluorescence were excited at 488 nm and 559 nm, and emissions were detected between 490 and 530 nm for GFP, and between 620 and 650 nm for FM4–64, respectively. The pinhole was set at 1 Airy unit. The gating technology was applied to remove autofluorescence.
For the localization assay in Arabidopsis, images were acquired using a Leica SP8 confocal laser microscope. For root imaging, ten-day-old seedlings were grown vertically on ½MS agar plates with 1% sucrose. For leaf imaging, four-week-old soil-grown plants were used. Localization experiments were done in pBTL2::gBTL2-GFP transgenic plants transiently expressing pCNGC20::gCNGC20-mCherry, pMIK2::gMIK2-mCherry, or pPEPR1::gPEPR1-mCherry three days after Agrobacterial infiltration. The excitation wavelength was 488 nm for GFP and 587 nm for mCherry. Emission was detected at 493–530 nm for GFP and 600–630 nm for mCherry. For co-localization experiments, linear sequential imaging was employed.
Total Internal Reflection Fluorescence (TIRF) Microscopy was conducted using a Leica DMi8 Infinity TIRF microscope with HX PL APO 100x/1.47 numerical aperture oil-immersion TIRF objective. The optimal critical angle was determined as giving the best signal-to-noise ratio. Images were processed by computational clearing using the THUNDER technology of the LAS X software (Leica).
The FLIM-FRET analyses were performed using Leica Application Suite X (LAS X) software as previously described79. Briefly, the FRET measurements were performed using GFP/mCherry fusion proteins. The image of GFP donor fluorescence was analyzed and scanned at 488 nm and detected between 490 and 530 nm. The GFP fluorescence lifetime (τ) was calculated as the average of 10–20 τ values randomly measured in protoplasts. The average τ value of each pair of proteins was analyzed. The Leica LAS X software was used to measure the relative fluorescence intensity (I) in a certain region of interest (ROI), lifetime (τ), and FRET efficiency (E). FRET efficiency was calculated by using the formula E = 1 – (τDA/τD), where τDA is the lifetimes of the donor in the presence of the acceptor and τD is the fluorescence lifetime of the donor alone. The statistical analysis was performed by using a two-sided two-tailed Student’s t-test.
Electrophysiological studies in Xenopus laevis oocytes
Capped RNAs (cRNAs) were in vitro transcribed from the linearized pNB1 vectors using the mMESSAGE mMACHINE T7 high yield RNA Transcription Kit following the manufacturer’s protocol (Ambion). The quality of cRNAs was checked by Nanodrop, and concentration was adjusted to the same level and stored at −80°C until injection. The expression and Two-Electrode Voltage-Clamp Recordings Xenopus oocytes were performed as described previously28. Xenopus oocytes were harvested at the stages V to VI and kept in an ND96 perfusion solution (96 mM NaCl, 2 mM KCl, 1 mM CaCl2, 1 mM MgCl2, 5 mM HEPES, 10 mM sorbitol, pH was adjusted to 7.4 with NaOH) for overnight prior to injections. Each oocyte was injected with 25 ng cRNAs or the same amount of water. Injected oocytes were incubated in perfusion solution at 18°C for two days. The currents were recorded with hyperpolarized pulses of a 0.1 s pre-pulse at −40 mV, followed by voltage steps of 40 to −180 mV (step at −20 mV, 1.5 s duration) and a 0.5 s deactivation at −40 mV using Axon Axoclamp 900A Microelectrode Amplifier. The bath solution for the current recording contained 30 mM CaCl2, 10 mM MES-Tris pH7.4, and osmolality was adjusted to 220 mOsm/L with mannitol. The pipette solution contained 3 M KCl.
Ca2+ flux measurement in N. benthamiana
Three-week-old N. benthamiana leaves were infiltrated with Agrobacterium carrying pMDC32–2×35S::BTL2-HA, pMDC32–2×35S::CNGC20-HA, or a GFP vector control (Ctrl) as the indicated combinations. After 24 hr, leaf samples were immobilized in the measurement buffer (0.1 mM CaCl2, pH 6.0) for 30 min. The Ca2+ flux in leaves was measured using a Non-invasive Micro-test Technology (NMT) system (NMT100 Series, Xuyue Sci. & Tech. Co., Ltd., China). The steady-state fluxes were continuously recorded every 6 sec for 5 min. Data were obtained from at least three leaves for each treatment.
QUANTIFICATION AND STATISTICAL ANALYSIS
Data for quantification analyses are presented as mean ± standard error (SE) or standard deviation (SD). The statistical analyses were performed by Student’s t-test or one-way analysis of variance (ANOVA) test (* P < 0.05, ** P < 0.01, *** P < 0.001, **** P < 0.0001, n.s., no significance).
The number of replicates is shown in the figure legends.
Supplementary Material
Table S1. T-DNA insertion mutants of 264 RKs screened by RNAi-BAK1/SERK4. Related to Figure 1.
Figure S1. An RNAi screen identified btl2 as a suppressor of BAK1/SERK4-mediated autoimmunity. Related to Figure 1.
(A) Scheme of AT1G34420 (BTL2) with annotated T-DNA insertion sites in different SALK line mutants. Solid bars indicate exons, the blue bar indicates 5’-UTR, and the line indicates introns.
(B) PCR confirmation of three T-DNA insertion mutants of btl2. Genomic DNAs from WT, btl2–1, btl2–2, and btl2–3 were PCR-amplified to test the annotated T-DNA insertions. The primer pair of LP and RP amplified the genomic DNA fragment of BTL2, and the primer pair of LB and RP amplified the T-DNA insertions.
(C) RT-PCR confirmation of btl2 mutants. The cDNA fragments from WT, btl2–1, btl2–2, and btl2–3 were PCR-amplified. UBQ1 was used as an internal control.
(D) The btl2 mutants suppress SAG12 and SAG13 expression triggered by RNAi-BAK1/SERK4. The expression of SAG12 and SAG13 was normalized to UBQ10. The data are shown as mean ± SD (n = 4). The different letters denote statistically significant differences according to one-way ANOVA followed by the Tukey test (P < 0.05).
(E) Complementation of btl2–1 with BTL2 genomic fragment (gBTL2) under its native promoter restores SAG12 and SAG13 expression triggered by RNAi-BAK1/SERK4. The expression of SAG12 and SAG13 was normalized to UBQ10. The data are shown as mean ± SD (n = 4). The different letters denote statistically significant differences according to one-way ANOVA followed by the Tukey test (P < 0.05).
(F) Genotyping PCR analysis of bak1–4/serk4–1/btl2–1. Genomic DNAs from WT, bak1–4/serk4–1, btl2–1, and bak1–4/serk4–1/btl2–1 were PCR-amplified with indicated primers to confirm that bak1/serk4/btl2 is a homozygous triple mutant.
(G)Alleviation of PR1 and PR2 expression in bak1–4/serk4–1/btl2–1 compared to bak1–4/serk4–1. The expression of PR1 and PR2 was normalized to UBQ10. The data are shown as mean ± SD (n = 4). The different letters denote statistically significant differences according to one-way ANOVA followed by the Tukey test (P < 0.05).
(H) Alleviation of SAG13 and SAG14 expression in bak1–4/serk4–1/btl2–1 compared to bak1–4/serk4–1. The expression of SAG12 and SAG13 was normalized to UBQ10. The data are shown as mean ± SD (n = 4). The different letters denote statistically significant differences according to one-way ANOVA followed by the Tukey test (P < 0.05).
The experiments were repeated three times with similar results.
Figure S2. The BTL2 kinase activity and its phosphorylation by BAK1 regulate BAK1/SERK4-mediated autoimmunity. Related to Figures 3 and 4.
(A) BTL2 localizes to the plasma membrane. Protoplasts expressing BTL2-GFP were imaged under a confocal microscope. The autofluorescence of chloroplasts is shown in the middle panel. Scale bar, 10 μm.
(B) The at2g41820 mutant did not suppress growth defects triggered by RNAi-BAK1/SERK4. Plant phenotypes are shown two weeks after VIGS-BAK1/SERK4. Scale bars, 1 cm.
(C) The cytosolic JK domain of BTL2 (BTL2JK) undergoes autophosphorylation. The in vitro kinase assay was performed using GST-BTL2JK for autophosphorylation under pH 6.8 or pH 7.5 in the kinase buffer. Phosphorylation was analyzed by autoradiography (top panel) with protein loading shown by Coomassie blue staining (CBB) on the bottom.
(D) Complementation of btl2–1 by the kinase mutant of the BTL2 genomic fragment (gBTL2KM) under its native promoter cannot restore cell death and H2O2 production triggered by RNAi-BAK1/SERK4. Leaves after VIGS of BAK1/SERK4 were stained with trypan blue for cell death (top panel) and DAB for H2O2 accumulation (bottom panel). Scale bars, 5 mm.
(E) Complementation of btl2–1 by gBTL2KM under its native promoter cannot restore PR1 and PR2 expression triggered by RNAi-BAK1/SERK4. The expression of PR1 and PR2 was normalized to UBQ10. The data are shown as mean ± SD (n = 4). The different letters denote statistically significant differences according to one-way ANOVA followed by the Tukey test (P < 0.05).
(F) Phosphorylation sites identified from LC-MS/MS analysis of BTL2JK. “Expect” indicates the number of times the peptide is matched by chance (the smaller this value is, the more significant the peptide identification is). “Score” measures how well the experimental MS/MS spectrum matches the stated peptide based on the calculated probability (P) that the observed match is random. The score is −10Log(P) (the higher the value is, the more confident the peptide identification is). “Dupes” is the number of additional matches to the same peptide with the same modifications and charge.
(G) Complementation of bak1–4/serk4–1/btl2–1 by gBTL2T669A under its native promoter cannot restore the PR1 and PR2 expression. The expression of PR1 and PR2 was normalized to UBQ10. The data are shown as mean ± SD (n = 4). The different letters denote statistically significant differences according to one-way ANOVA followed by the Tukey test (P < 0.05).
(H) Complementation of btl2–1 by BTL2T669A under its native promoter cannot restore growth defects triggered by RNAi-BAK1/SERK4. L5 and L9 are two representative lines. WT BTL2 complementation line (L1) was used as a control. Protein expression was shown on the bottom. Scale bars, 1 cm.
(I) BTL2 associates with BAK1. BTL2-HA was co-expressed with BAK1-FLAG or the empty vector control (Ctrl) in N. benthamiana leaves. Co-IP was performed with α-FLAG (IP: α-FLAG), and proteins were analyzed by immunoblotting with α-HA (top panel). The input control is shown on the bottom two panels.
(J)BAK1 and BTL2 interact in yeast. Combinations of yeast with the kinase domain of BAK1 or BTL2 (BAK1K or BTL2K), juxtamembrane and kinase domains of BAK1 and BTL2 (BAK1JK or BTL2JK) were tested on synthetic defined (SD) medium without leucine, tryptophan, and histidine (SD-L-T-H) supplemented with 1 mM 3-amino-1, 2, 4-triazole (3AT). pGADT7 and pGBKT7 are empty vectors. Serial dilutions of the yeast colonies were plated.
(K) Phosphorylation sites and the corresponding phosphopeptides identified from LC-MS/MS analysis of BTL2JK phosphorylated by BAK1JK.
(L) BTL2JK-S676D exhibits a similar autophosphorylation activity as WT BTL2JK. The in vitro kinase assay was performed using GST-BTL2JK or GST-BTL2JK-S676D proteins for autophosphorylation.
The experiments in A and B were repeated twice, C-E, G-J, and L were repeated three times with similar results.
Figure S3. BTL2 interacts with CNGC20 and regulates its channel activities. Related to Figure 5.
(A) The bak1–4/serk4–1/btl2–1 and bak1–4/serk4–1/cngc19/cngc20–1 mutants largely restored the growth defect of bak1–4/serk4–1. Plants were grown in soil and photographed at six weeks post-germination. The bak1–4/serk4–1 mutant was photographed at 21 dpg before completely dying.
(B) The BTL2-induced PR1 promoter activity is suppressed in cngc20–1. pPR1::LUC was co-transfected with BTL2-HA or an empty vector control (Ctrl) in WT or cngc20–1 protoplasts. pUBQ::GUS was included as an internal transfection control. The relative luciferase activity was normalized with the GUS activity.
(C) Localization of BTL2-GFP and CNGC20-mCherry. pCNGC20::gCNGC20-mCherry was transiently expressed in four-week-old Arabidopsis pBTL2::gBTL2-GFP/btl2–1 transgenic plants, and the localization of BTL2-GFP and CNGC20-mCherry was observed three days later with a confocal microscope. Scale bars, 20 μm.
(D) BTL2 and CNGC20 associate in N. benthamiana. CNGC20-HA was co-expressed with BTL2-FLAG or the empty vector control (Ctrl) in N. benthamiana leaves. Co-IP was performed with α-FLAG (IP: α-FLAG), and the proteins were analyzed by immunoblotting with α-HA (top panel). The input control is shown on the bottom two panels.
(E) BTL2 and CNGC20 localize on the plasma membrane in close proximity with the FRET-FLIM assay. Localization of BTL2-GFP and CNGC20-mCherry in protoplasts is shown on the left in the first and second rows, respectively. BIR2-mCherry was included as a control. Lifetime (τ) distribution (third row) and apparent FRET efficiency (fourth row) are presented as pseudocolor images according to the scale. Scale bar, 5 μm. GFP mean fluorescence lifetime (τ) values (nanoseconds) are shown as mean ± SD (n = 20) on the right. Asterisks indicate a significant difference by Student’s two-tailed t-test (***, P < 0.001).
(F) BTL2JK directly interacts with CNGC20N. CNGC20N-HA proteins were expressed in protoplasts for 12 hr, extracted by IP buffer, and incubated with glutathione beads coupled with GST or GST-BTL2JK purified from E. coli. The pull-down (PD) proteins were detected with an α-HA antibody or stained with CBB. The protein input is shown on the bottom two panels.
(G) BTL2JK phosphorylates CNGC20N. CNGC20N-HA proteins were expressed in N. benthamiana for 12 hr, extracted by IP buffer, and incubated with GST, GST-BTL2JK, or GST-BAK1JK purified from E. coli in a kinase buffer. The phosphorylated CNGC20N was detected as mobility shifts in the Phos-tag SDS-PAGE. Input is shown as CBB staining.
(H) BTL2 promotes CNGC20-mediated Ca2+ influx in N. benthamiana. Combinations of BTL2-HA, CNGC20-HA, or a GFP vector control (Ctrl) were expressed in N. benthamiana for 24 hr. The Ca2+ influx was measured by the scanning ion-selective electrode method for a period of 350 sec. Data are shown as mean ± SD (n = 3).
(I) BAK1, but not BAK1KM, suppresses the BTL2-promoted channel activity of CNGC20 in Xenopus oocytes. The current-voltage relationship was recorded in oocytes injected with water control (Ctrl, n = 7), CNGC20-YFP (n = 6), CNGC20-YFP+BTL2-CFP (n = 7), CNGC20-YFP+BAK1-mCherry (n = 9), CNGC20-YFP+BTL2-CFP+BAK1-mCherry (n = 17), or CNGC20-YFP+BTL2-CFP+BAK1KM-mCherry (n = 9) in the presence of 30 mM CaCl2.
(J) BTL2S676D could not promote the CNGC20 channel activity in Xenopus oocytes. The current-voltage relationship was recorded in oocytes injected with water control (Ctrl, n = 6), CNGC20-YFP (n = 5), CNGC20-YFP+BTL2-CFP (n = 8), or CNGC20-YFP+BTL2S676D-CFP (n = 7) in the presence of 30 mM CaCl2.
The experiments were repeated three times with similar results.
Figure S4. Glycosylation of BTL2 and CNGC20, and BTL2 does not contribute to immunity in WT. Related to Figures 5 and 6.
(A) Endo H treatment of BTL2 proteins. Total proteins from protoplasts expressing BTL2-HA were extracted, boiled in glycoprotein denaturing buffer, and then digested with Endo H at 37°C for 3 hr for immunoblotting using an α-HA antibody.
(B) The pBTL2::gBTL2-HA transgenic plants in stt3a-2 do not show growth defects and cell death. Representative plants from the T1 generation are shown with BTL2 protein expression by immunoblotting using an α-HA antibody. Scale bars, 5 mm.
(C) STT3a and putative glycosylation sites affect BTL2 protein migration. Protoplasts from WT and stt3α−2 were transfected with BTL2-HA or BTL2N240/477/545Q-HA. Total proteins were subjected to immunoblot with an α-HA antibody.
(D) BTL2/CNGC20-activated PR1 promoter is suppressed in stt3a-2. pPR1::LUC was co-transfected with BTL2-HA, CNGC20-FLAG, BTL2-HA/CNGC20-FLAG, or a vector control (Ctrl) in WT or stt3a-2 protoplasts.
(E) Tunicamycin (Tu) treatment alters CNGC20 protein migration. Protoplasts expressing CNGC20-HA treated without or with 1 μM tunicamycin were subjected to immunoblotting with an α-HA antibody (top panel). The protein loading is shown by Ponceau S staining for RBC (bottom panel).
(F) CNGC20 proteins migrate faster in stt3a-2 than in WT. Protoplasts from WT and stt3α−2 were transfected with CNGC20-HA for immunoblotting using an α-HA antibody.
(G) CNGC20N430/452/455Q proteins migrate faster than WT CNGC20 proteins. Protoplasts expressing CNGC20-HA or CNGC20N430/452/455Q-HA were subjected to immunoblotting using an α-HA antibody.
(H) The btl2–1 mutant exhibits a similar flg22-induced ROS production as WT plants. Leave discs from four-week-old WT and btl2–1 plants were treated with 100 nM flg22 for 40 min. The data are shown as means ± SE (n = 12).
(I) The btl2–1 mutant exhibits similar flg22-induced seedling growth inhibition as WT. Four-day-old seedlings were transferred from ½MS plate to liquid ½MS medium supplemented without (Ctrl) or with 1 μM flg22 and grew for another seven days. Averages of root length are shown as mean ± SD (n = 6).
(J) The btl2–1 mutant exhibits similar resistance against Pst DC3000 and Psm ES4326 as WT plants. Four-week-old WT and btl2–1 plants were hand-inoculated with bacteria at OD600 = 5×10⁻⁴, and the bacterial counting was performed 0, 2, and 4 days post-inoculation (dpi). The data are shown as mean ± SD (n =3).
(K) The btl2–1 mutant exhibits similar resistance against Botrytis cinerea as WT plants. The lesion sizes on individual leaves were measured (left), and pictures of inoculated leaves were taken at two dpi (right). Values are means ± SD (n = 8).
(L) The btl2–1 mutant exhibits similar resistance against Sclerotinia sclerotium as WT plants. The lesion sizes on individual leaves were measured, and pictures of inoculated leaves were taken at two dpi. Values are means ± SD (n = 7).
(M) The btl2–1 mutant exhibits similar resistance to Pst DC3000 carrying avrRpt2 and Pst DC3000 carrying avrRps4 as WT plants. Similar assays were performed as (J) with Pst avrRpt2 and Pst avrRps4. The data are shown as mean ± SD (n = 3).
(N) Comparable HR in btl2–1 and WT plants triggered by Pst DC3000 avrRpm1 or Pst DC3000 avrRpt2. Four-week-old plants were hand-inoculated with bacteria at OD600 = 0.1. HR was examined by counting the percentage of wilting leaves of total inoculated leaves (n = 14) at different time points after inoculation.
The experiments were repeated three times with similar results.
Figure S5. BTL2 contributes to PEP-induced immune responses in bak1–4. Related to Figure 6.
(A) Elevated BTL2 expression in bak1–4 compared to WT upon PEP2 treatment. Two-week-old seedlings were treated without (Ctrl) or with 100 nM PEP2 for 12 hr. The expression of BTL2 was normalized by that of UBQ10. Data are shown as mean ± SD (n = 3).
(B) BTL2 mediates sensitization of PEP2-induced seedling growth inhibition in bak1–4. Four-day-old seedlings were transferred from ½MS plate to liquid ½MS medium supplemented without (Ctrl) or with 0.1 μM PEP2 and grew for another seven days. The Ctrl data are the same as those in Figure 6B. Averages of root length are shown as mean ± SD (n = 6).
(C) BTL2 mediates the increased resistance to Pst DC3000 in bak1–4. Four-week-old plants were inoculated with bacterial suspension at OD600 = 5 × 10⁵ cfu/mL. Bacterial growth was measured at three days post-inoculation (dpi) (right), and leaves were photoed at three dpi (left). Data are shown as mean ± SD (n = 6).
(D) BTL2 does not contribute to flg22-induced ROS production in bak1–4. Leave discs from four-week-old WT, btl2–1, bak1–4, btl2–1/bak1–4, and bak1–4/serk4/btl2–1 plants were treated with 100 nM flg22 for 50 min. The data are shown as mean ± SE (n = 9).
(E) BTL2 does not contribute to flg22-induced MAPK activation in bak1–4. Ten-day-old seedlings were treated with 100 nM flg22. The MAPK activation was detected by α-pERK with the protein loading shown by CBB staining for RBC.
(F) BTL2 does not contribute to flg22-induced growth inhibition in bak1–4. Four-day-old seedlings were transferred from ½MS plate to liquid ½MS medium supplemented without (Ctrl) or with 1 μM flg22 and grew for another seven days. Averages of root length are shown as mean ± SD (n = 6).
(G) PEP1 induces the association between BTL2 and PEPR2. Protoplasts expressing BTL2-HA and PEPR2-FLAG were treated with or without 10 μM PEP1 for 15 min for IP with α-FLAG (IP: α-FLAG) and immunoblotting with α-HA or α-FLAG (top two panels). The input control is shown on the bottom two panels.
(H) Localization of BTL2-GFP and PEPR1-mCherry. pPEPR1::gPEPR1-mCherry was transiently expressed in four-week-old Arabidopsis pBTL2::gBTL2-GFP/btl2–1 transgenic plants, and the localization of BTL2-GFP and PEPR1-mCherry was observed three days later with a confocal microscope. Scale bars, 20 μm.
(I) BTL2 mediates PEP1-induced MAPK activation in bak1–4/serk4–1. Ten-day-old seedlings were treated with 100 nM PEP1 peptide. The MAPK activation was detected by α-pERK with the protein loading shown by CBB staining for RBC.
(J) Transcripts of PROPEP1, PROPEP2, and PROPEP3 are up-regulated in bak1–4/serk4–1. Mean gene expression levels of PROPEP1, PROPEP2, and PROPEP3 in WT and bak1–4/serk4–1 were obtained from RNA-seq data27. The data are shown as mean ± SD from two independent repeats. The numbers indicate fold changes in gene expression (bak1–4/serk4–1 vs. WT).
Asterisks in A, B, C, and F indicate a significant difference by Student’s two-tailed t-test. (*, P < 0.05; **, P < 0.01; ***, P < 0.001; ****, P < 0.0001; n.s., no significance). The experiments were repeated three times with similar results.
Figure S6. BTL2 contributes to SCOOP-induced immune responses in bak1–4. Related to Figures 6 and 7.
(A) BTL2 mediates SCOOP10B-induced MAPK activation in bak1–4. Ten-day-old seedlings were treated with 1 μM SCOOP10B. The MAPK activation was detected by α-pERK with the protein loading shown by CBB staining for RBC.
(B) BTL2 mediates SCOOP10B-induced disease resistance in bak1–4. Leaves from four-week-old plants were hand-inoculated with water (Ctrl) or 1 μM SCOOP10B, and 24 hr later, hand-inoculated with Pst DC3000 at OD600 = 1×10⁻³. Bacterial counting was performed at three dpi. Data are shown as means ± SD (n = 6).
(C)Elevated PR1, FRK1, and WRKY53 expressions in p35S::SCOOPL1-HA plants. Shoots of 18-day-old plants were subjected to RNA exaction and RT-qPCR. The data are shown as mean ± SD (n = 3).
(D) Overexpression of SCOOPL1 and SCOOPL11−72 induces plant growth defects. The left panel shows the diagram of the SCOOPL1 peptide. The right panels show the p35S::SCOOPL1 or p35S::SCOOPL11−72 transgenic plants in WT grouped into three categories with representative plants shown. Scale bars, 1 cm.
(E) The conserved SCOOP motif in SCOOPL1 is sufficient for its root growth inhibition activity. Seeds were grown on ½MS media without (Ctrl) or with 10 μM peptides. Data were collected five days after germination. Asterisks indicate a significant difference between WT and mutants by Student’s two-tailed t-test. (***, P < 0.001; n.s., no significance). L1 is SCOOPL1 in the quantification data.
(F) BTL2 mediates SCOOP10B- and SCOOPL1-triggered root growth inhibition in bak1–4. Images of root length of ten-day-old seedlings with or without 10 nM SCOOP10B or 10 μM SCOOPL1 are shown. The quantification result is shown in Figure 7D.
(G) BTL2 mediates SCOOPL1-induced ROS production in bak1–4. Leave discs from four-week-old plants were treated with 10 μM SCOOPL1 for 50 min. The ROS production was calculated as total RLU. The data are shown as means ± SE (n = 7).
(H) Localization of BTL2-GFP and MIK2-mCherry. pMIK2::gMIK2-mCherry was transiently expressed in four-week-old Arabidopsis pBTL2::gBTL2-GFP/btl2–1 transgenic plants, and the localization of BTL2-GFP and MIK2-mCherry was observed three days later with a confocal microscope. Scale bars, 20 μm.
(I) BTL2 and MIK2 or PEPR1 localize on the plasma membrane in close proximity with the FRET-FLIM assay. Localization of BTL2-GFP and MIK2-mCherry/PEPR1-mCherry in protoplasts is shown on the right in the first and second rows, respectively. Lifetime (τ) distribution (third row) and apparent FRET efficiency (fourth row) are presented as pseudocolor images according to the scale. Scale bar, 5 μm. GFP mean fluorescence lifetime (τ) values (nanoseconds) are shown as mean ± SD (n = 20) on the left.
(J) BTL2-GFP and MIK2-GFP exhibit similar foci organization patterns on the surface of the plasma membrane. Images were taken using Total Internal Reflection Fluorescence (TIRF) microscopy in cells of the root maturation zone of pBTL2::gBTL2-GFP/btl2–1 or pMIK2::MIK2-GFP/mik2–1 transgenic seedlings. Scale bars, 5 μm.
Asterisks in B, C, E, G, and I indicate a significant difference by Student’s two-tailed t-test. (**, P < 0.01; ***, P < 0.001; n.s., no significance).
The experiments were repeated three times with similar results.
Figure S7. BTL2 triggers the EDS1-PAD4-ADR1s-dependent autoimmunity. Related to Figure 7.
(A) BTL2/CNGC20-induced cell death depends on EDS1, PAD4, and ADR1 in N. benthamiana. VIGS was performed in three-week-old N. benthamiana to silence EDS1, PAD4, ADR1, or GFP control (Ctrl). Two weeks later, BTL2 and CNGC20 were co-expressed in the upper leaves of silenced plants. Cell death was visualized as autofluorescence under UV light at three dpi (top panel). The cell death severity was quantified into 0–3 categories. The stacked bars show the percentage of each category (middle panel). Six leaves were scored for each treatment. The silencing efficiency is shown by RT-PCR analysis using ACTIN as a control (bottom panel).
(B-D) BTL2/CNGC20-induced cell death and PR1 expression are reduced in eds1, pad4, and adr1 triple mutants. Leaves from four-week-old Arabidopsis plants were hand-inoculated with Agrobacteria (Mock) or Agrobacteria containing pBTL2::gBTL2-HA and pCNGC20::gCNGC20-HA at OD600 = 1.0. Leaves were photoed at five dpi (B, top panel), and stained with trypan blue for cell death (B, bottom panel). Scale bars, 1 cm. The PR1 transcript levels were normalized by UBQ10, and the data are shown as mean ± SD (n = 4) (C). BTL2-HA and CNGC20-HA proteins harvested from leaves at three dpi were detected by immunoblotting with an α-HA antibody (D). (E) PEP1-induced resistance is compromised in eds1 and pad4. Leaves from four-week-old plants were hand-inoculated with water (Ctrl) or 1 μM PEP1 followed by hand-inoculation of Pst DC3000 at OD600 = 5×10⁻⁴ 24 hr later. Bacterial counting was performed at three dpi. Data are shown as means ± SD (n = 6).
(F) SCOOPL1-triggered growth defects depend on EDS1. The p35S::SCOOPL1-HA transgenic plants in the WT and eds1–2 backgrounds were grouped into three categories, with representative plants shown. Scale bars, 1 cm.
(G) Overexpression of BTL2 induces SCOOPL1, SCOOP10, and ADR1s expression. WT and pBTL2::gBTL2-FLAG/WT transgenic plants (1, 2, 3) with cell death phenotypes were harvested for RT-qPCR analysis. The expression of SCOOPL1, SCOOP10, ADR1, ADR1-L1, and ADR1-L2 was normalized to that of ACTIN2. The data are shown as mean ± SD (n = 3).
(H) pSNC1::snc1–1 induces similar cell death in WT, btl2–1, and mik2–1. The pSNC1:snc1–1-GFP transgenic plants were grouped into three categories, with representative plants shown. Scale bars, 1 cm.
(I) HopB1-induced cell death is compromised in btl2. Leaves of three-week-old soil-grown WT and btl2–1 plants were infiltrated with P. fluorescens or P. fluorescens-HopB1 at OD600 = 0.02 and treated with water (Mock) or 500 nM flg22. Cell death (left panel) was stained by trypan blue at 24 hpi. The relative cell death index (right panel) was calculated based on the ratio of cell death area to the total leaf area using Image J, and is shown as mean ± SD (n = 5). The cell death index is set to 1 for Ctrl (water) for both Mock and flg22 treatments.
(J) TNLs are upregulated in the bak1–4/serk4–1 mutant. The gene expression patterns were extracted from RNA-seq data27 and subjected to data adjustment by log2 transformation using GraphPad for the heat map.
Asterisks in C, E, G, and I indicate a significant difference by Student’s two-tailed t-test. (*, < 0.05; **, P < 0.01; ***, P < 0.001; ****, P < 0.0001; n.s., no significance). The experiments were repeated three times with similar results.
HIGHLIGHTS.
An RNAi screen identified BTL2 regulating bak1/serk4 autoimmunity in Arabidopsis.
BAK1 phosphorylates BTL2, suppressing BTL2-mediated immune signaling.
BTL2 activates the CNGC20 Ca2+ channel activity in triggering autoimmunity.
BTL2 mediates phytocytokine signaling to compensate for the perturbation of BAK1.
ACKNOWLEDGMENTS
We thank the Arabidopsis Biological Resource Center (ABRC) for Arabidopsis T-DNA insertion lines, Drs Jonathan Jones (The Sainsbury Laboratory) and Jeffery Dangl (University of North Carolina, Chapel Hill) for adr1/adr1-L1/adr1-L2 seeds, Zhengqing Fu (University of South Carolina) for eds1–2 seeds, Ming Guo (University of Nebraska, Lincoln) for Pseudomonas fluorescens HopB1, and Jian Hua (Cornell University) for pSNC1:snc1–1-GFP and pad4–1 mutant. We thank Dr. Cyril Zipfel for discussions and members of L.S. and P.H. laboratories for discussions and comments on the experiments. The study was supported by the National Science Foundation (NSF) (IOS-1951094) and the National Institutes of Health (NIH) (R01GM092893) to P.H., NIH (R35GM144275), NSF (IOS-2049642), and the Robert A. Welch Foundation (A-2122–20220331) to L.S, and Fundamental Research Funds for the Central Universities, Huazhong Agricultural University Scientific & Technological Selfinnovation Foundation (Grant no. 2662020ZKPY004) to X.Y.
Footnotes
Publisher's Disclaimer: This is a PDF file of an unedited manuscript that has been accepted for publication. As a service to our customers we are providing this early version of the manuscript. The manuscript will undergo copyediting, typesetting, and review of the resulting proof before it is published in its final form. Please note that during the production process errors may be discovered which could affect the content, and all legal disclaimers that apply to the journal pertain.
INCLUSION AND DIVERSITY
One or more of the authors of this paper self-identifies as an underrepresented ethnic minority in their field of research or within their geographical location. One or more of the authors of this paper self-identifies as a gender minority in their field of research. One or more of the authors of this paper received support from a program designed to increase minority representation in their field of research.
DECLARATION OF INTERESTS
The authors declare no competing interests.
SUPPLEMENTAL INFORMATION
Supplemental information can be found online at https://doi.org/10.1016/j.cell. 2023.04.027.
REFERENCE
- 1.Tang D, Wang G, and Zhou JM (2017). Receptor Kinases in Plant-Pathogen Interactions: More Than Pattern Recognition. Plant Cell 29, 618–637. [DOI] [PMC free article] [PubMed] [Google Scholar]
- 2.Dievart A, Gottin C, Perin C, Ranwez V, and Chantret N (2020). Origin and Diversity of Plant Receptor-Like Kinases. Annu Rev Plant Biol 71, 131–156. [DOI] [PubMed] [Google Scholar]
- 3.Escocard de Azevedo Manhaes AM, Ortiz-Morea FA, He P, and Shan L (2021). Plant plasma membrane-resident receptors: Surveillance for infections and coordination for growth and development. J Integr Plant Biol 63, 79–101. [DOI] [PMC free article] [PubMed] [Google Scholar]
- 4.Hohmann U, Lau K, and Hothorn M (2017). The Structural Basis of Ligand Perception and Signal Activation by Receptor Kinases. Annual Review of Plant Biology, Vol 68 68, 109–137. [DOI] [PubMed] [Google Scholar]
- 5.Gomez-Gomez L, and Boller T (2000). FLS2: an LRR receptor-like kinase involved in the perception of the bacterial elicitor flagellin in Arabidopsis. Mol Cell 5, 1003–1011. [DOI] [PubMed] [Google Scholar]
- 6.Zipfel C, Kunze G, Chinchilla D, Caniard A, Jones JDG, Boller T, and Felix G (2006). Perception of the bacterial PAMP EF-Tu by the receptor EFR restricts Agrobacterium-mediated transformation. Cell 125, 749–760. [DOI] [PubMed] [Google Scholar]
- 7.Ngou BPM, Ahn HK, Ding P, and Jones JDG (2021). Mutual potentiation of plant immunity by cell-surface and intracellular receptors. Nature 592, 110–115. [DOI] [PubMed] [Google Scholar]
- 8.Yuan M, Jiang Z, Bi G, Nomura K, Liu M, Wang Y, Cai B, Zhou JM, He SY, and Xin XF (2021). Pattern-recognition receptors are required for NLR-mediated plant immunity. Nature 592, 105–109. [DOI] [PMC free article] [PubMed] [Google Scholar]
- 9.Tian H, Wu Z, Chen S, Ao K, Huang W, Yaghmaiean H, Sun T, Xu F, Zhang Y, Wang S, et al. (2021). Activation of TIR signalling boosts pattern-triggered immunity. Nature 598, 500–503. [DOI] [PubMed] [Google Scholar]
- 10.Pruitt RN, Locci F, Wanke F, Zhang L, Saile SC, Joe A, Karelina D, Hua C, Frohlich K, Wan WL, et al. (2021). The EDS1-PAD4-ADR1 node mediates Arabidopsis pattern-triggered immunity. Nature 598, 495–499. [DOI] [PubMed] [Google Scholar]
- 11.Zhou JM, and Zhang Y (2020). Plant Immunity: Danger Perception and Signaling. Cell 181, 978–989. [DOI] [PubMed] [Google Scholar]
- 12.Tanaka K, and Heil M (2021). Damage-Associated Molecular Patterns (DAMPs) in Plant Innate Immunity: Applying the Danger Model and Evolutionary Perspectives. Annu Rev Phytopathol 59, 53–75. [DOI] [PubMed] [Google Scholar]
- 13.DeFalco TA, and Zipfel C (2021). Molecular mechanisms of early plant pattern-triggered immune signaling. Mol Cell 81, 4346. [DOI] [PubMed] [Google Scholar]
- 14.Saijo Y, Loo EP, and Yasuda S (2018). Pattern recognition receptors and signaling in plant-microbe interactions. Plant J 93, 592–613. [DOI] [PubMed] [Google Scholar]
- 15.Ge D, Yeo IC, and Shan L (2022). Knowing me, knowing you: Self and non-self recognition in plant immunity. Essays Biochem 66, 447–458. [DOI] [PMC free article] [PubMed] [Google Scholar]
- 16.Yamaguchi Y, Pearce G, and Ryan CA (2006). The cell surface leucine-rich repeat receptor for AtPep1, an endogenous peptide elicitor in Arabidopsis, is functional in transgenic tobacco cells. Proc Natl Acad Sci U S A 103, 10104–10109. [DOI] [PMC free article] [PubMed] [Google Scholar]
- 17.Huffaker A, Pearce G, and Ryan CA (2006). An endogenous peptide signal in Arabidopsis activates components of the innate immune response. Proc Natl Acad Sci U S A 103, 10098–10103. [DOI] [PMC free article] [PubMed] [Google Scholar]
- 18.Liu Z, Hou S, Rodrigues O, Wang P, Luo D, Munemasa S, Lei J, Liu J, Ortiz-Morea FA, Wang X, et al. (2022). Phytocytokine signalling reopens stomata in plant immunity and water loss. Nature 605, 332–339. [DOI] [PMC free article] [PubMed] [Google Scholar]
- 19.Rhodes J, Roman AO, Bjornson M, Brandt B, Derbyshire P, Wyler M, Schmid MW, Menke FLH, Santiago J, and Zipfel C (2022). Perception of a conserved family of plant signalling peptides by the receptor kinase HSL3. eLife 11, [DOI] [PMC free article] [PubMed] [Google Scholar]
- 20.Hou S, Liu D, Huang S, Luo D, Liu Z, Xiang Q, Wang P, Mu R, Han Z, Chen S, et al. (2021). The Arabidopsis MIK2 receptor elicits immunity by sensing a conserved signature from phytocytokines and microbes. Nat Commun 12, 5494. [DOI] [PMC free article] [PubMed] [Google Scholar]
- 21.Rhodes J, Yang H, Moussu S, Boutrot F, Santiago J, and Zipfel C (2021). Perception of a divergent family of phytocytokines by the Arabidopsis receptor kinase MIK2. Nat Commun 12, 705. [DOI] [PMC free article] [PubMed] [Google Scholar]
- 22.Ma X, Xu G, He P, and Shan L (2016). SERKing Coreceptors for Receptors. Trends Plant Sci 21, 1017–1033. [DOI] [PubMed] [Google Scholar]
- 23.Liebrand TWH, van den Burg HA, and Joosten MHAJ (2014). Two for all: receptor-associated kinases SOBIR1 and BAK1. Trends in Plant Science 19, 123–132. [DOI] [PubMed] [Google Scholar]
- 24.Chinchilla D, Shan L, He P, de Vries S, and Kemmerling B (2009). One for all: the receptor-associated kinase BAK1. Trends Plant Sci 14, 535–541. [DOI] [PMC free article] [PubMed] [Google Scholar]
- 25.He K, Gou X, Yuan T, Lin H, Asami T, Yoshida S, Russell SD, and Li J (2007). BAK1 and BKK1 regulate brassinosteroid-dependent growth and brassinosteroid-independent cell-death pathways. Curr Biol 17, 1109–1115. [DOI] [PubMed] [Google Scholar]
- 26.Kemmerling B, Schwedt A, Rodriguez P, Mazzotta S, Frank M, Qamar SA, Mengiste T, Betsuyaku S, Parker JE, Mussig C, et al. (2007). The BRI1-associated kinase 1, BAK1, has a brassinolide-independent role in plant cell-death control. Curr Biol 17, 1116–1122. [DOI] [PubMed] [Google Scholar]
- 27.de Oliveira MVV, Xu G, Li B, de Souza Vespoli L, Meng X, Chen X, Yu X, de Souza SA, Intorne AC, de A. Manhães AME, et al. (2016). Specific control of Arabidopsis BAK1/SERK4-regulated cell death by protein glycosylation. Nature Plants 2, 15218. [DOI] [PMC free article] [PubMed] [Google Scholar]
- 28.Yu X, Xu G, Li B, de Souza Vespoli L, Liu H, Moeder W, Chen S, de Oliveira MVV, Ariadina de Souza S, Shao W, et al. (2019). The Receptor Kinases BAK1/SERK4 Regulate Ca(2+) Channel-Mediated Cellular Homeostasis for Cell Death Containment. Curr Biol 29, 3778–3790 e3778. [DOI] [PMC free article] [PubMed] [Google Scholar]
- 29.Du JB, Gao Y, Zhan YY, Zhang SS, Wu YJ, Xiao Y, Zou B, He K, Gou XP, Li GJ, et al. (2016). Nucleocytoplasmic trafficking is essential for BAK1-and BKK1-mediated cell-death control. Plant J. 85, 520–531. [DOI] [PubMed] [Google Scholar]
- 30.Wu Y, Gao Y, Zhan Y, Kui H, Liu H, Yan L, Kemmerling B, Zhou JM, He K, and Li J (2020). Loss of the common immune coreceptor BAK1 leads to NLR-dependent cell death. Proc Natl Acad Sci U S A 117, 27044–27053. [DOI] [PMC free article] [PubMed] [Google Scholar]
- 31.Schulze S, Yu L, Hua C, Zhang L, Kolb D, Weber H, Ehinger A, Saile SC, Stahl M, Franz-Wachtel M, et al. (2022). The Arabidopsis TIR-NBS-LRR protein CSA1 guards BAK1-BIR3 homeostasis and mediates convergence of pattern- and effector-induced immune responses. Cell Host Microbe 30, 1717–1731 e1716. [DOI] [PubMed] [Google Scholar]
- 32.Yang Y, Kim NH, Cevik V, Jacob P, Wan L, Furzer OJ, and Dangl JL (2022). Allelic variation in the Arabidopsis TNL CHS3/CSA1 immune receptor pair reveals two functional cell-death regulatory modes. Cell Host Microbe 30, 1701–1716 e1705. [DOI] [PubMed] [Google Scholar]
- 33.Li J (2010). Multi-tasking of somatic embryogenesis receptor-like protein kinases. Curr Opin Plant Biol 13, 509–514. [DOI] [PubMed] [Google Scholar]
- 34.Liu J, Li J, and Shan L (2020). SERKs. Curr Biol 30, R293–R294. [DOI] [PubMed] [Google Scholar]
- 35.Li J, Wen J, Lease KA, Doke JT, Tax FE, and Walker JC (2002). BAK1, an Arabidopsis LRR receptor-like protein kinase, interacts with BRI1 and modulates brassinosteroid signaling. Cell 110, 213–222. [DOI] [PubMed] [Google Scholar]
- 36.Nam KH, and Li J (2002). BRI1/BAK1, a receptor kinase pair mediating brassinosteroid signaling. Cell 110, 203–212. [DOI] [PubMed] [Google Scholar]
- 37.Gou X, Yin H, He K, Du J, Yi J, Xu S, Lin H, Clouse SD, and Li J (2012). Genetic evidence for an indispensable role of somatic embryogenesis receptor kinases in brassinosteroid signaling. PLoS Genet 8, e1002452. [DOI] [PMC free article] [PubMed] [Google Scholar]
- 38.Gao M, Wang X, Wang D, Xu F, Ding X, Zhang Z, Bi D, Cheng YT, Chen S, Li X, and Zhang Y (2009). Regulation of cell death and innate immunity by two receptor-like kinases in Arabidopsis. Cell Host Microbe 6, 34–44. [DOI] [PubMed] [Google Scholar]
- 39.Suarez-Rodriguez MC, Adams-Phillips L, Liu Y, Wang H, Su SH, Jester PJ, Zhang S, Bent AF, and Krysan PJ (2007). MEKK1 is required for flg22-induced MPK4 activation in Arabidopsis plants. Plant Physiol 143, 661–669. [DOI] [PMC free article] [PubMed] [Google Scholar]
- 40.Ichimura K, Casais C, Peck SC, Shinozaki K, and Shirasu K (2006). MEKK1 is required for MPK4 activation and regulates tissue-specific and temperature-dependent cell death in Arabidopsis. J Biol Chem 281, 36969–36976. [DOI] [PubMed] [Google Scholar]
- 41.Liu J, Huang Y, Kong L, Yu X, Feng B, Liu D, Zhao B, Mendes GC, Yuan P, Ge D, et al. (2020). The malectin-like receptor-like kinase LETUM1 modulates NLR protein SUMM2 activation via MEKK2 scaffolding. Nat Plants 6, 1106–1115. [DOI] [PMC free article] [PubMed] [Google Scholar]
- 42.Lu D, Wu S, Gao X, Zhang Y, Shan L, and He P (2010). A receptor-like cytoplasmic kinase, BIK1, associates with a flagellin receptor complex to initiate plant innate immunity. Proc Natl Acad Sci U S A 107, 496–501. [DOI] [PMC free article] [PubMed] [Google Scholar]
- 43.Shan L, He P, Li J, Heese A, Peck SC, Nurnberger T, Martin GB, and Sheen J (2008). Bacterial effectors target the common signaling partner BAK1 to disrupt multiple MAMP receptor-signaling complexes and impede plant immunity. Cell Host Microbe 4, 17–27. [DOI] [PMC free article] [PubMed] [Google Scholar]
- 44.Zhou J, Wu S, Chen X, Liu C, Sheen J, Shan L, and He P (2014). The Pseudomonas syringae effector HopF2 suppresses Arabidopsis immunity by targeting BAK1. Plant J 77, 235–245. [DOI] [PMC free article] [PubMed] [Google Scholar]
- 45.Li L, Kim P, Yu L, Cai G, Chen S, Alfano JR, and Zhou JM (2016). Activation-Dependent Destruction of a Co-receptor by a Pseudomonas syringae Effector Dampens Plant Immunity. Cell Host Microbe 20, 504–514. [DOI] [PubMed] [Google Scholar]
- 46.Yamada K, Yamashita-Yamada M, Hirase T, Fujiwara T, Tsuda K, Hiruma K, and Saijo Y (2016). Danger peptide receptor signaling in plants ensures basal immunity upon pathogen-induced depletion of BAK1. EMBO J 35, 46–61. [DOI] [PMC free article] [PubMed] [Google Scholar]
- 47.Postel S, Kufner I, Beuter C, Mazzotta S, Schwedt A, Borlotti A, Halter T, Kemmerling B, and Nurnberger T (2010). The multifunctional leucine-rich repeat receptor kinase BAK1 is implicated in Arabidopsis development and immunity. Eur. J. Cell Biol 89, 169–174. [DOI] [PubMed] [Google Scholar]
- 48.Roux M, Schwessinger B, Albrecht C, Chinchilla D, Jones A, Holton N, Malinovsky FG, Tor M, de Vries S, and Zipfel C (2011). The Arabidopsis leucine-rich repeat receptor-like kinases BAK1/SERK3 and BKK1/SERK4 are required for innate immunity to hemibiotrophic and biotrophic pathogens. Plant Cell 23, 2440–2455. [DOI] [PMC free article] [PubMed] [Google Scholar]
- 49.Tang J, Han Z, Sun Y, Zhang H, Gong X, and Chai J (2015). Structural basis for recognition of an endogenous peptide by the plant receptor kinase PEPR1. Cell Res 25, 110–120. [DOI] [PMC free article] [PubMed] [Google Scholar]
- 50.Dongus JA, and Parker JE (2021). EDS1 signalling: At the nexus of intracellular and surface receptor immunity. Curr Opin Plant Biol 62, 102039. [DOI] [PubMed] [Google Scholar]
- 51.Dong OX, Tong M, Bonardi V, El Kasmi F, Woloshen V, Wunsch LK, Dangl JL, and Li X (2016). TNL-mediated immunity in Arabidopsis requires complex regulation of the redundant ADR1 gene family. New Phytol 210, 960–973. [DOI] [PubMed] [Google Scholar]
- 52.Bjornson M, Pimprikar P, Nurnberger T, and Zipfel C (2021). The transcriptional landscape of Arabidopsis thaliana pattern-triggered immunity. Nat Plants 7, 579–586. [DOI] [PMC free article] [PubMed] [Google Scholar]
- 53.Jacob P, Kim NH, Wu F, El-Kasmi F, Chi Y, Walton WG, Furzer OJ, Lietzan AD, Sunil S, Kempthorn K, et al. (2021). Plant “helper” immune receptors are Ca(2+)-permeable nonselective cation channels. Science 373, 420–425. [DOI] [PMC free article] [PubMed] [Google Scholar]
- 54.Gou X, and Li J (2020). Paired Receptor and Coreceptor Kinases Perceive Extracellular Signals to Control Plant Development. Plant Physiol 182, 1667–1681. [DOI] [PMC free article] [PubMed] [Google Scholar]
- 55.Wang X, Kota U, He K, Blackburn K, Li J, Goshe MB, Huber SC, and Clouse SD (2008). Sequential transphosphorylation of the BRI1/BAK1 receptor kinase complex impacts early events in brassinosteroid signaling. Dev Cell 15, 220–235. [DOI] [PubMed] [Google Scholar]
- 56.Gong BQ, Guo JH, Zhang NN, Yao XR, Wang HB, and Li JF (2019). Cross-Microbial Protection via Priming a Conserved Immune Co-Receptor through Juxtamembrane Phosphorylation in Plants. Cell Host & Microbe 26, 810-+. [DOI] [PubMed] [Google Scholar]
- 57.Koster P, DeFalco TA, and Zipfel C (2022). Ca(2+) signals in plant immunity. EMBO J 41, e110741. [DOI] [PMC free article] [PubMed] [Google Scholar]
- 58.Xu G, Moeder W, Yoshioka K, and Shan L (2022). A tale of many families: calcium channels in plant immunity. Plant Cell 34, 1551–1567. [DOI] [PMC free article] [PubMed] [Google Scholar]
- 59.Zhao C, Tang Y, Wang J, Zeng Y, Sun H, Zheng Z, Su R, Schneeberger K, Parker JE, and Cui H (2021). A mis-regulated cyclic nucleotide-gated channel mediates cytosolic calcium elevation and activates immunity in Arabidopsis. New Phytol 230, 1078–1094. [DOI] [PubMed] [Google Scholar]
- 60.Tian W, Hou C, Ren Z, Wang C, Zhao F, Dahlbeck D, Hu S, Zhang L, Niu Q, Li L, et al. (2019). A calmodulin-gated calcium channel links pathogen patterns to plant immunity. Nature 572, 131–135. [DOI] [PubMed] [Google Scholar]
- 61.Wang J, Liu X, Zhang A, Ren Y, Wu F, Wang G, Xu Y, Lei C, Zhu S, Pan T, et al. (2019). A cyclic nucleotide-gated channel mediates cytoplasmic calcium elevation and disease resistance in rice. Cell Res 29, 820–831. [DOI] [PMC free article] [PubMed] [Google Scholar]
- 62.Gao Y, Wu YJ, Du JB, Zhan YY, Sun DD, Zhao JX, Zhang SS, Li J, and He K (2017). Both Light-Induced SA Accumulation and ETI Mediators Contribute to the Cell Death Regulated by BAK1 and BKK1. Frontiers in Plant Science 8, [DOI] [PMC free article] [PubMed] [Google Scholar]
- 63.Huang S, Jia A, Song W, Hessler G, Meng Y, Sun Y, Xu L, Laessle H, Jirschitzka J, Ma S, et al. (2022). Identification and receptor mechanism of TIR-catalyzed small molecules in plant immunity. Science 377, eabq3297. [DOI] [PubMed] [Google Scholar]
- 64.Ogawa-Ohnishi M, Yamashita T, Kakita M, Nakayama T, Ohkubo Y, Hayashi Y, Yamashita Y, Nomura T, Noda S, Shinohara H, and Matsubayashi Y (2022). Peptide ligand-mediated trade-off between plant growth and stress response. Science 378, 175–180. [DOI] [PubMed] [Google Scholar]
- 65.Mang H, Feng B, Hu Z, Boisson-Dernier A, Franck CM, Meng X, Huang Y, Zhou J, Xu G, Wang T, et al. (2017). Differential Regulation of Two-Tiered Plant Immunity and Sexual Reproduction by ANXUR Receptor-Like Kinases. Plant Cell 29, 3140–3156. [DOI] [PMC free article] [PubMed] [Google Scholar]
- 66.Castel B, Ngou PM, Cevik V, Redkar A, Kim DS, Yang Y, Ding PT, and Jones JDG (2019). Diverse NLR immune receptors activate defence via the RPW8-NLR NRG1. New Phytologist 222, 966–980. [DOI] [PubMed] [Google Scholar]
- 67.Chang M, Zhao J, Chen H, Li G, Chen J, Li M, Palmer IA, Song J, Alfano JR, Liu F, and Fu ZQ (2019). PBS3 Protects EDS1 from Proteasome-Mediated Degradation in Plant Immunity. Mol Plant 12, 678–688. [DOI] [PubMed] [Google Scholar]
- 68.Yang S, and Hua J (2004). A haplotype-specific Resistance gene regulated by BONZAI1 mediates temperature-dependent growth control in Arabidopsis. Plant Cell 16, 1060–1071. [DOI] [PMC free article] [PubMed] [Google Scholar]
- 69.Bonardi V, Tang S, Stallmann A, Roberts M, Cherkis K, and Dangl JL (2011). Expanded functions for a family of plant intracellular immune receptors beyond specific recognition of pathogen effectors. Proc Natl Acad Sci U S A 108, 16463–16468. [DOI] [PMC free article] [PubMed] [Google Scholar]
- 70.Guo M, Tian F, Wamboldt Y, and Alfano JR (2009). The Majority of the Type III Effector Inventory of Pseudomonas syringae pv. tomato DC3000 Can Suppress Plant Immunity. Mol Plant Microbe In 22, 1069–1080. [DOI] [PMC free article] [PubMed] [Google Scholar]
- 71.vanKan JAL, vantKlooster JW, Wagemakers CAM, Dees DCT, and vanderVlugtBergmans CJB (1997). Cutinase A of Botrytis cinerea is expressed, but not essential, during penetration of gerbera and tomato. Mol Plant Microbe In 10, 30–38. [DOI] [PubMed] [Google Scholar]
- 72.Godoy G, Steadman JR, Dickman MB, and Dam R (1990). Use of Mutants to Demonstrate the Role of Oxalic-Acid in Pathogenicity of Sclerotinia-Sclerotiorum on Phaseolus-Vulgaris. Physiol Mol Plant P 37, 179–191. [Google Scholar]
- 73.Meng X, Chen X, Mang H, Liu C, Yu X, Gao X, Torii KU, He P, and Shan L (2015). Differential Function of Arabidopsis SERK Family Receptor-like Kinases in Stomatal Patterning. Curr Biol 25, 2361–2372. [DOI] [PMC free article] [PubMed] [Google Scholar]
- 74.Mang HG, Qian W, Zhu Y, Qian J, Kang HG, Klessig DF, and Hua J (2012). Abscisic acid deficiency antagonizes high-temperature inhibition of disease resistance through enhancing nuclear accumulation of resistance proteins SNC1 and RPS4 in Arabidopsis. Plant Cell 24, 1271–1284. [DOI] [PMC free article] [PubMed] [Google Scholar]
- 75.Nour-Eldin HH, Hansen BG, Norholm MH, Jensen JK, and Halkier BA (2006). Advancing uracil-excision based cloning towards an ideal technique for cloning PCR fragments. Nucleic acids research 34, e122. [DOI] [PMC free article] [PubMed] [Google Scholar]
- 76.He P, Shan L, and Sheen J (2007). The use of protoplasts to study innate immune responses. Methods Mol Biol 354, 1–9. [DOI] [PubMed] [Google Scholar]
- 77.Gao X, Chen X, Lin W, Chen S, Lu D, Niu Y, Li L, Cheng C, McCormack M, Sheen J, et al. (2013). Bifurcation of Arabidopsis NLR Immune Signaling via Ca(2+)-Dependent Protein Kinases. PLoS Pathog 9, e1003127. [DOI] [PMC free article] [PubMed] [Google Scholar]
- 78.Li B, Jiang S, Yu X, Cheng C, Chen S, Cheng Y, Yuan JS, Jiang D, He P, and Shan L (2015). Phosphorylation of Trihelix Transcriptional Repressor ASR3 by MAP KINASE4 Negatively Regulates Arabidopsis Immunity. Plant Cell 27, 839–856. [DOI] [PMC free article] [PubMed] [Google Scholar]
- 79.Kong L, Feng B, Yan Y, Zhang C, Kim JH, Xu L, Rack JGM, Wang Y, Jang JC, Ahel I, et al. (2021). Noncanonical mono(ADP-ribosyl)ation of zinc finger SZF proteins counteracts ubiquitination for protein homeostasis in plant immunity. Mol Cell 81, 4591–4604 e4598. [DOI] [PMC free article] [PubMed] [Google Scholar]
Associated Data
This section collects any data citations, data availability statements, or supplementary materials included in this article.
Supplementary Materials
Table S1. T-DNA insertion mutants of 264 RKs screened by RNAi-BAK1/SERK4. Related to Figure 1.
Figure S1. An RNAi screen identified btl2 as a suppressor of BAK1/SERK4-mediated autoimmunity. Related to Figure 1.
(A) Scheme of AT1G34420 (BTL2) with annotated T-DNA insertion sites in different SALK line mutants. Solid bars indicate exons, the blue bar indicates 5’-UTR, and the line indicates introns.
(B) PCR confirmation of three T-DNA insertion mutants of btl2. Genomic DNAs from WT, btl2–1, btl2–2, and btl2–3 were PCR-amplified to test the annotated T-DNA insertions. The primer pair of LP and RP amplified the genomic DNA fragment of BTL2, and the primer pair of LB and RP amplified the T-DNA insertions.
(C) RT-PCR confirmation of btl2 mutants. The cDNA fragments from WT, btl2–1, btl2–2, and btl2–3 were PCR-amplified. UBQ1 was used as an internal control.
(D) The btl2 mutants suppress SAG12 and SAG13 expression triggered by RNAi-BAK1/SERK4. The expression of SAG12 and SAG13 was normalized to UBQ10. The data are shown as mean ± SD (n = 4). The different letters denote statistically significant differences according to one-way ANOVA followed by the Tukey test (P < 0.05).
(E) Complementation of btl2–1 with BTL2 genomic fragment (gBTL2) under its native promoter restores SAG12 and SAG13 expression triggered by RNAi-BAK1/SERK4. The expression of SAG12 and SAG13 was normalized to UBQ10. The data are shown as mean ± SD (n = 4). The different letters denote statistically significant differences according to one-way ANOVA followed by the Tukey test (P < 0.05).
(F) Genotyping PCR analysis of bak1–4/serk4–1/btl2–1. Genomic DNAs from WT, bak1–4/serk4–1, btl2–1, and bak1–4/serk4–1/btl2–1 were PCR-amplified with indicated primers to confirm that bak1/serk4/btl2 is a homozygous triple mutant.
(G)Alleviation of PR1 and PR2 expression in bak1–4/serk4–1/btl2–1 compared to bak1–4/serk4–1. The expression of PR1 and PR2 was normalized to UBQ10. The data are shown as mean ± SD (n = 4). The different letters denote statistically significant differences according to one-way ANOVA followed by the Tukey test (P < 0.05).
(H) Alleviation of SAG13 and SAG14 expression in bak1–4/serk4–1/btl2–1 compared to bak1–4/serk4–1. The expression of SAG12 and SAG13 was normalized to UBQ10. The data are shown as mean ± SD (n = 4). The different letters denote statistically significant differences according to one-way ANOVA followed by the Tukey test (P < 0.05).
The experiments were repeated three times with similar results.
Figure S2. The BTL2 kinase activity and its phosphorylation by BAK1 regulate BAK1/SERK4-mediated autoimmunity. Related to Figures 3 and 4.
(A) BTL2 localizes to the plasma membrane. Protoplasts expressing BTL2-GFP were imaged under a confocal microscope. The autofluorescence of chloroplasts is shown in the middle panel. Scale bar, 10 μm.
(B) The at2g41820 mutant did not suppress growth defects triggered by RNAi-BAK1/SERK4. Plant phenotypes are shown two weeks after VIGS-BAK1/SERK4. Scale bars, 1 cm.
(C) The cytosolic JK domain of BTL2 (BTL2JK) undergoes autophosphorylation. The in vitro kinase assay was performed using GST-BTL2JK for autophosphorylation under pH 6.8 or pH 7.5 in the kinase buffer. Phosphorylation was analyzed by autoradiography (top panel) with protein loading shown by Coomassie blue staining (CBB) on the bottom.
(D) Complementation of btl2–1 by the kinase mutant of the BTL2 genomic fragment (gBTL2KM) under its native promoter cannot restore cell death and H2O2 production triggered by RNAi-BAK1/SERK4. Leaves after VIGS of BAK1/SERK4 were stained with trypan blue for cell death (top panel) and DAB for H2O2 accumulation (bottom panel). Scale bars, 5 mm.
(E) Complementation of btl2–1 by gBTL2KM under its native promoter cannot restore PR1 and PR2 expression triggered by RNAi-BAK1/SERK4. The expression of PR1 and PR2 was normalized to UBQ10. The data are shown as mean ± SD (n = 4). The different letters denote statistically significant differences according to one-way ANOVA followed by the Tukey test (P < 0.05).
(F) Phosphorylation sites identified from LC-MS/MS analysis of BTL2JK. “Expect” indicates the number of times the peptide is matched by chance (the smaller this value is, the more significant the peptide identification is). “Score” measures how well the experimental MS/MS spectrum matches the stated peptide based on the calculated probability (P) that the observed match is random. The score is −10Log(P) (the higher the value is, the more confident the peptide identification is). “Dupes” is the number of additional matches to the same peptide with the same modifications and charge.
(G) Complementation of bak1–4/serk4–1/btl2–1 by gBTL2T669A under its native promoter cannot restore the PR1 and PR2 expression. The expression of PR1 and PR2 was normalized to UBQ10. The data are shown as mean ± SD (n = 4). The different letters denote statistically significant differences according to one-way ANOVA followed by the Tukey test (P < 0.05).
(H) Complementation of btl2–1 by BTL2T669A under its native promoter cannot restore growth defects triggered by RNAi-BAK1/SERK4. L5 and L9 are two representative lines. WT BTL2 complementation line (L1) was used as a control. Protein expression was shown on the bottom. Scale bars, 1 cm.
(I) BTL2 associates with BAK1. BTL2-HA was co-expressed with BAK1-FLAG or the empty vector control (Ctrl) in N. benthamiana leaves. Co-IP was performed with α-FLAG (IP: α-FLAG), and proteins were analyzed by immunoblotting with α-HA (top panel). The input control is shown on the bottom two panels.
(J)BAK1 and BTL2 interact in yeast. Combinations of yeast with the kinase domain of BAK1 or BTL2 (BAK1K or BTL2K), juxtamembrane and kinase domains of BAK1 and BTL2 (BAK1JK or BTL2JK) were tested on synthetic defined (SD) medium without leucine, tryptophan, and histidine (SD-L-T-H) supplemented with 1 mM 3-amino-1, 2, 4-triazole (3AT). pGADT7 and pGBKT7 are empty vectors. Serial dilutions of the yeast colonies were plated.
(K) Phosphorylation sites and the corresponding phosphopeptides identified from LC-MS/MS analysis of BTL2JK phosphorylated by BAK1JK.
(L) BTL2JK-S676D exhibits a similar autophosphorylation activity as WT BTL2JK. The in vitro kinase assay was performed using GST-BTL2JK or GST-BTL2JK-S676D proteins for autophosphorylation.
The experiments in A and B were repeated twice, C-E, G-J, and L were repeated three times with similar results.
Figure S3. BTL2 interacts with CNGC20 and regulates its channel activities. Related to Figure 5.
(A) The bak1–4/serk4–1/btl2–1 and bak1–4/serk4–1/cngc19/cngc20–1 mutants largely restored the growth defect of bak1–4/serk4–1. Plants were grown in soil and photographed at six weeks post-germination. The bak1–4/serk4–1 mutant was photographed at 21 dpg before completely dying.
(B) The BTL2-induced PR1 promoter activity is suppressed in cngc20–1. pPR1::LUC was co-transfected with BTL2-HA or an empty vector control (Ctrl) in WT or cngc20–1 protoplasts. pUBQ::GUS was included as an internal transfection control. The relative luciferase activity was normalized with the GUS activity.
(C) Localization of BTL2-GFP and CNGC20-mCherry. pCNGC20::gCNGC20-mCherry was transiently expressed in four-week-old Arabidopsis pBTL2::gBTL2-GFP/btl2–1 transgenic plants, and the localization of BTL2-GFP and CNGC20-mCherry was observed three days later with a confocal microscope. Scale bars, 20 μm.
(D) BTL2 and CNGC20 associate in N. benthamiana. CNGC20-HA was co-expressed with BTL2-FLAG or the empty vector control (Ctrl) in N. benthamiana leaves. Co-IP was performed with α-FLAG (IP: α-FLAG), and the proteins were analyzed by immunoblotting with α-HA (top panel). The input control is shown on the bottom two panels.
(E) BTL2 and CNGC20 localize on the plasma membrane in close proximity with the FRET-FLIM assay. Localization of BTL2-GFP and CNGC20-mCherry in protoplasts is shown on the left in the first and second rows, respectively. BIR2-mCherry was included as a control. Lifetime (τ) distribution (third row) and apparent FRET efficiency (fourth row) are presented as pseudocolor images according to the scale. Scale bar, 5 μm. GFP mean fluorescence lifetime (τ) values (nanoseconds) are shown as mean ± SD (n = 20) on the right. Asterisks indicate a significant difference by Student’s two-tailed t-test (***, P < 0.001).
(F) BTL2JK directly interacts with CNGC20N. CNGC20N-HA proteins were expressed in protoplasts for 12 hr, extracted by IP buffer, and incubated with glutathione beads coupled with GST or GST-BTL2JK purified from E. coli. The pull-down (PD) proteins were detected with an α-HA antibody or stained with CBB. The protein input is shown on the bottom two panels.
(G) BTL2JK phosphorylates CNGC20N. CNGC20N-HA proteins were expressed in N. benthamiana for 12 hr, extracted by IP buffer, and incubated with GST, GST-BTL2JK, or GST-BAK1JK purified from E. coli in a kinase buffer. The phosphorylated CNGC20N was detected as mobility shifts in the Phos-tag SDS-PAGE. Input is shown as CBB staining.
(H) BTL2 promotes CNGC20-mediated Ca2+ influx in N. benthamiana. Combinations of BTL2-HA, CNGC20-HA, or a GFP vector control (Ctrl) were expressed in N. benthamiana for 24 hr. The Ca2+ influx was measured by the scanning ion-selective electrode method for a period of 350 sec. Data are shown as mean ± SD (n = 3).
(I) BAK1, but not BAK1KM, suppresses the BTL2-promoted channel activity of CNGC20 in Xenopus oocytes. The current-voltage relationship was recorded in oocytes injected with water control (Ctrl, n = 7), CNGC20-YFP (n = 6), CNGC20-YFP+BTL2-CFP (n = 7), CNGC20-YFP+BAK1-mCherry (n = 9), CNGC20-YFP+BTL2-CFP+BAK1-mCherry (n = 17), or CNGC20-YFP+BTL2-CFP+BAK1KM-mCherry (n = 9) in the presence of 30 mM CaCl2.
(J) BTL2S676D could not promote the CNGC20 channel activity in Xenopus oocytes. The current-voltage relationship was recorded in oocytes injected with water control (Ctrl, n = 6), CNGC20-YFP (n = 5), CNGC20-YFP+BTL2-CFP (n = 8), or CNGC20-YFP+BTL2S676D-CFP (n = 7) in the presence of 30 mM CaCl2.
The experiments were repeated three times with similar results.
Figure S4. Glycosylation of BTL2 and CNGC20, and BTL2 does not contribute to immunity in WT. Related to Figures 5 and 6.
(A) Endo H treatment of BTL2 proteins. Total proteins from protoplasts expressing BTL2-HA were extracted, boiled in glycoprotein denaturing buffer, and then digested with Endo H at 37°C for 3 hr for immunoblotting using an α-HA antibody.
(B) The pBTL2::gBTL2-HA transgenic plants in stt3a-2 do not show growth defects and cell death. Representative plants from the T1 generation are shown with BTL2 protein expression by immunoblotting using an α-HA antibody. Scale bars, 5 mm.
(C) STT3a and putative glycosylation sites affect BTL2 protein migration. Protoplasts from WT and stt3α−2 were transfected with BTL2-HA or BTL2N240/477/545Q-HA. Total proteins were subjected to immunoblot with an α-HA antibody.
(D) BTL2/CNGC20-activated PR1 promoter is suppressed in stt3a-2. pPR1::LUC was co-transfected with BTL2-HA, CNGC20-FLAG, BTL2-HA/CNGC20-FLAG, or a vector control (Ctrl) in WT or stt3a-2 protoplasts.
(E) Tunicamycin (Tu) treatment alters CNGC20 protein migration. Protoplasts expressing CNGC20-HA treated without or with 1 μM tunicamycin were subjected to immunoblotting with an α-HA antibody (top panel). The protein loading is shown by Ponceau S staining for RBC (bottom panel).
(F) CNGC20 proteins migrate faster in stt3a-2 than in WT. Protoplasts from WT and stt3α−2 were transfected with CNGC20-HA for immunoblotting using an α-HA antibody.
(G) CNGC20N430/452/455Q proteins migrate faster than WT CNGC20 proteins. Protoplasts expressing CNGC20-HA or CNGC20N430/452/455Q-HA were subjected to immunoblotting using an α-HA antibody.
(H) The btl2–1 mutant exhibits a similar flg22-induced ROS production as WT plants. Leave discs from four-week-old WT and btl2–1 plants were treated with 100 nM flg22 for 40 min. The data are shown as means ± SE (n = 12).
(I) The btl2–1 mutant exhibits similar flg22-induced seedling growth inhibition as WT. Four-day-old seedlings were transferred from ½MS plate to liquid ½MS medium supplemented without (Ctrl) or with 1 μM flg22 and grew for another seven days. Averages of root length are shown as mean ± SD (n = 6).
(J) The btl2–1 mutant exhibits similar resistance against Pst DC3000 and Psm ES4326 as WT plants. Four-week-old WT and btl2–1 plants were hand-inoculated with bacteria at OD600 = 5×10⁻⁴, and the bacterial counting was performed 0, 2, and 4 days post-inoculation (dpi). The data are shown as mean ± SD (n =3).
(K) The btl2–1 mutant exhibits similar resistance against Botrytis cinerea as WT plants. The lesion sizes on individual leaves were measured (left), and pictures of inoculated leaves were taken at two dpi (right). Values are means ± SD (n = 8).
(L) The btl2–1 mutant exhibits similar resistance against Sclerotinia sclerotium as WT plants. The lesion sizes on individual leaves were measured, and pictures of inoculated leaves were taken at two dpi. Values are means ± SD (n = 7).
(M) The btl2–1 mutant exhibits similar resistance to Pst DC3000 carrying avrRpt2 and Pst DC3000 carrying avrRps4 as WT plants. Similar assays were performed as (J) with Pst avrRpt2 and Pst avrRps4. The data are shown as mean ± SD (n = 3).
(N) Comparable HR in btl2–1 and WT plants triggered by Pst DC3000 avrRpm1 or Pst DC3000 avrRpt2. Four-week-old plants were hand-inoculated with bacteria at OD600 = 0.1. HR was examined by counting the percentage of wilting leaves of total inoculated leaves (n = 14) at different time points after inoculation.
The experiments were repeated three times with similar results.
Figure S5. BTL2 contributes to PEP-induced immune responses in bak1–4. Related to Figure 6.
(A) Elevated BTL2 expression in bak1–4 compared to WT upon PEP2 treatment. Two-week-old seedlings were treated without (Ctrl) or with 100 nM PEP2 for 12 hr. The expression of BTL2 was normalized by that of UBQ10. Data are shown as mean ± SD (n = 3).
(B) BTL2 mediates sensitization of PEP2-induced seedling growth inhibition in bak1–4. Four-day-old seedlings were transferred from ½MS plate to liquid ½MS medium supplemented without (Ctrl) or with 0.1 μM PEP2 and grew for another seven days. The Ctrl data are the same as those in Figure 6B. Averages of root length are shown as mean ± SD (n = 6).
(C) BTL2 mediates the increased resistance to Pst DC3000 in bak1–4. Four-week-old plants were inoculated with bacterial suspension at OD600 = 5 × 10⁵ cfu/mL. Bacterial growth was measured at three days post-inoculation (dpi) (right), and leaves were photoed at three dpi (left). Data are shown as mean ± SD (n = 6).
(D) BTL2 does not contribute to flg22-induced ROS production in bak1–4. Leave discs from four-week-old WT, btl2–1, bak1–4, btl2–1/bak1–4, and bak1–4/serk4/btl2–1 plants were treated with 100 nM flg22 for 50 min. The data are shown as mean ± SE (n = 9).
(E) BTL2 does not contribute to flg22-induced MAPK activation in bak1–4. Ten-day-old seedlings were treated with 100 nM flg22. The MAPK activation was detected by α-pERK with the protein loading shown by CBB staining for RBC.
(F) BTL2 does not contribute to flg22-induced growth inhibition in bak1–4. Four-day-old seedlings were transferred from ½MS plate to liquid ½MS medium supplemented without (Ctrl) or with 1 μM flg22 and grew for another seven days. Averages of root length are shown as mean ± SD (n = 6).
(G) PEP1 induces the association between BTL2 and PEPR2. Protoplasts expressing BTL2-HA and PEPR2-FLAG were treated with or without 10 μM PEP1 for 15 min for IP with α-FLAG (IP: α-FLAG) and immunoblotting with α-HA or α-FLAG (top two panels). The input control is shown on the bottom two panels.
(H) Localization of BTL2-GFP and PEPR1-mCherry. pPEPR1::gPEPR1-mCherry was transiently expressed in four-week-old Arabidopsis pBTL2::gBTL2-GFP/btl2–1 transgenic plants, and the localization of BTL2-GFP and PEPR1-mCherry was observed three days later with a confocal microscope. Scale bars, 20 μm.
(I) BTL2 mediates PEP1-induced MAPK activation in bak1–4/serk4–1. Ten-day-old seedlings were treated with 100 nM PEP1 peptide. The MAPK activation was detected by α-pERK with the protein loading shown by CBB staining for RBC.
(J) Transcripts of PROPEP1, PROPEP2, and PROPEP3 are up-regulated in bak1–4/serk4–1. Mean gene expression levels of PROPEP1, PROPEP2, and PROPEP3 in WT and bak1–4/serk4–1 were obtained from RNA-seq data27. The data are shown as mean ± SD from two independent repeats. The numbers indicate fold changes in gene expression (bak1–4/serk4–1 vs. WT).
Asterisks in A, B, C, and F indicate a significant difference by Student’s two-tailed t-test. (*, P < 0.05; **, P < 0.01; ***, P < 0.001; ****, P < 0.0001; n.s., no significance). The experiments were repeated three times with similar results.
Figure S6. BTL2 contributes to SCOOP-induced immune responses in bak1–4. Related to Figures 6 and 7.
(A) BTL2 mediates SCOOP10B-induced MAPK activation in bak1–4. Ten-day-old seedlings were treated with 1 μM SCOOP10B. The MAPK activation was detected by α-pERK with the protein loading shown by CBB staining for RBC.
(B) BTL2 mediates SCOOP10B-induced disease resistance in bak1–4. Leaves from four-week-old plants were hand-inoculated with water (Ctrl) or 1 μM SCOOP10B, and 24 hr later, hand-inoculated with Pst DC3000 at OD600 = 1×10⁻³. Bacterial counting was performed at three dpi. Data are shown as means ± SD (n = 6).
(C)Elevated PR1, FRK1, and WRKY53 expressions in p35S::SCOOPL1-HA plants. Shoots of 18-day-old plants were subjected to RNA exaction and RT-qPCR. The data are shown as mean ± SD (n = 3).
(D) Overexpression of SCOOPL1 and SCOOPL11−72 induces plant growth defects. The left panel shows the diagram of the SCOOPL1 peptide. The right panels show the p35S::SCOOPL1 or p35S::SCOOPL11−72 transgenic plants in WT grouped into three categories with representative plants shown. Scale bars, 1 cm.
(E) The conserved SCOOP motif in SCOOPL1 is sufficient for its root growth inhibition activity. Seeds were grown on ½MS media without (Ctrl) or with 10 μM peptides. Data were collected five days after germination. Asterisks indicate a significant difference between WT and mutants by Student’s two-tailed t-test. (***, P < 0.001; n.s., no significance). L1 is SCOOPL1 in the quantification data.
(F) BTL2 mediates SCOOP10B- and SCOOPL1-triggered root growth inhibition in bak1–4. Images of root length of ten-day-old seedlings with or without 10 nM SCOOP10B or 10 μM SCOOPL1 are shown. The quantification result is shown in Figure 7D.
(G) BTL2 mediates SCOOPL1-induced ROS production in bak1–4. Leave discs from four-week-old plants were treated with 10 μM SCOOPL1 for 50 min. The ROS production was calculated as total RLU. The data are shown as means ± SE (n = 7).
(H) Localization of BTL2-GFP and MIK2-mCherry. pMIK2::gMIK2-mCherry was transiently expressed in four-week-old Arabidopsis pBTL2::gBTL2-GFP/btl2–1 transgenic plants, and the localization of BTL2-GFP and MIK2-mCherry was observed three days later with a confocal microscope. Scale bars, 20 μm.
(I) BTL2 and MIK2 or PEPR1 localize on the plasma membrane in close proximity with the FRET-FLIM assay. Localization of BTL2-GFP and MIK2-mCherry/PEPR1-mCherry in protoplasts is shown on the right in the first and second rows, respectively. Lifetime (τ) distribution (third row) and apparent FRET efficiency (fourth row) are presented as pseudocolor images according to the scale. Scale bar, 5 μm. GFP mean fluorescence lifetime (τ) values (nanoseconds) are shown as mean ± SD (n = 20) on the left.
(J) BTL2-GFP and MIK2-GFP exhibit similar foci organization patterns on the surface of the plasma membrane. Images were taken using Total Internal Reflection Fluorescence (TIRF) microscopy in cells of the root maturation zone of pBTL2::gBTL2-GFP/btl2–1 or pMIK2::MIK2-GFP/mik2–1 transgenic seedlings. Scale bars, 5 μm.
Asterisks in B, C, E, G, and I indicate a significant difference by Student’s two-tailed t-test. (**, P < 0.01; ***, P < 0.001; n.s., no significance).
The experiments were repeated three times with similar results.
Figure S7. BTL2 triggers the EDS1-PAD4-ADR1s-dependent autoimmunity. Related to Figure 7.
(A) BTL2/CNGC20-induced cell death depends on EDS1, PAD4, and ADR1 in N. benthamiana. VIGS was performed in three-week-old N. benthamiana to silence EDS1, PAD4, ADR1, or GFP control (Ctrl). Two weeks later, BTL2 and CNGC20 were co-expressed in the upper leaves of silenced plants. Cell death was visualized as autofluorescence under UV light at three dpi (top panel). The cell death severity was quantified into 0–3 categories. The stacked bars show the percentage of each category (middle panel). Six leaves were scored for each treatment. The silencing efficiency is shown by RT-PCR analysis using ACTIN as a control (bottom panel).
(B-D) BTL2/CNGC20-induced cell death and PR1 expression are reduced in eds1, pad4, and adr1 triple mutants. Leaves from four-week-old Arabidopsis plants were hand-inoculated with Agrobacteria (Mock) or Agrobacteria containing pBTL2::gBTL2-HA and pCNGC20::gCNGC20-HA at OD600 = 1.0. Leaves were photoed at five dpi (B, top panel), and stained with trypan blue for cell death (B, bottom panel). Scale bars, 1 cm. The PR1 transcript levels were normalized by UBQ10, and the data are shown as mean ± SD (n = 4) (C). BTL2-HA and CNGC20-HA proteins harvested from leaves at three dpi were detected by immunoblotting with an α-HA antibody (D). (E) PEP1-induced resistance is compromised in eds1 and pad4. Leaves from four-week-old plants were hand-inoculated with water (Ctrl) or 1 μM PEP1 followed by hand-inoculation of Pst DC3000 at OD600 = 5×10⁻⁴ 24 hr later. Bacterial counting was performed at three dpi. Data are shown as means ± SD (n = 6).
(F) SCOOPL1-triggered growth defects depend on EDS1. The p35S::SCOOPL1-HA transgenic plants in the WT and eds1–2 backgrounds were grouped into three categories, with representative plants shown. Scale bars, 1 cm.
(G) Overexpression of BTL2 induces SCOOPL1, SCOOP10, and ADR1s expression. WT and pBTL2::gBTL2-FLAG/WT transgenic plants (1, 2, 3) with cell death phenotypes were harvested for RT-qPCR analysis. The expression of SCOOPL1, SCOOP10, ADR1, ADR1-L1, and ADR1-L2 was normalized to that of ACTIN2. The data are shown as mean ± SD (n = 3).
(H) pSNC1::snc1–1 induces similar cell death in WT, btl2–1, and mik2–1. The pSNC1:snc1–1-GFP transgenic plants were grouped into three categories, with representative plants shown. Scale bars, 1 cm.
(I) HopB1-induced cell death is compromised in btl2. Leaves of three-week-old soil-grown WT and btl2–1 plants were infiltrated with P. fluorescens or P. fluorescens-HopB1 at OD600 = 0.02 and treated with water (Mock) or 500 nM flg22. Cell death (left panel) was stained by trypan blue at 24 hpi. The relative cell death index (right panel) was calculated based on the ratio of cell death area to the total leaf area using Image J, and is shown as mean ± SD (n = 5). The cell death index is set to 1 for Ctrl (water) for both Mock and flg22 treatments.
(J) TNLs are upregulated in the bak1–4/serk4–1 mutant. The gene expression patterns were extracted from RNA-seq data27 and subjected to data adjustment by log2 transformation using GraphPad for the heat map.
Asterisks in C, E, G, and I indicate a significant difference by Student’s two-tailed t-test. (*, < 0.05; **, P < 0.01; ***, P < 0.001; ****, P < 0.0001; n.s., no significance). The experiments were repeated three times with similar results.
Data Availability Statement
The published article includes all datasets generated or analyzed during this study.