Abstract
Advancements in technology have enabled diverse tools and medical devices that are able to improve the efficiency of diagnosis and detection of various health diseases. Rheumatoid arthritis is an autoimmune disease that affects multiple joints including the wrist, hands and feet. We used YOLOv5l6 to detect these joints in radiograph images. In this paper, we show that training YOLOv5l6 on joint images of healthy patients is able to achieve a high performance when used to evaluate joint images of patients with rheumatoid arthritis, even when there is a limited number of training samples. In addition to training joint images from healthy individuals with YOLOv5l6, we added several data augmentation steps to further improve the generalization of the deep learning model.
Introduction
Technology has advanced exponentially as the years have passed. Artificial intelligence (AI) has been used to improve the advancement of a diverse range of fields including but not limited to speech recognition, recommender system (predicts the preference of users), computer vision, self-driving cars, natural language processing, and translation (1). Deep learning is a subset of AI that can surpass the performance in content creation or classification of rule-based AI or machine learning if there is enough data to train on. Deep learning helps to classify or predict complex solutions including object detection, speech translation, image generation, music generation, etc. In the medical field, deep learning has been used to detect radiographic evidence of pneumonia (2,3), obtained good representation of gut microbiome data for easier future analysis (4), and cancer diagnosis (5).
Rheumatoid arthritis (RA) is an autoimmune disease that affects multiple small and large joints leading to joint damage. The earliest findings are usually found in the proximal interphalangeal (PIP) joints and metacarpophalangeal (MCP) of the hands, the wrists, and the metatarsal pharyngeal (MTP) joints of the feet (6). Rheumatologists rely on a variety of clinical clues to diagnose RA and to determine optimal antirheumatic therapy with a goal of preventing joint damage(7). Standard radiographs are usually used to identify and monitor for the development of joint damage which is manifested as joint space narrowing and erosion. This often requires a highly-trained medical professional to review the radiographs and in resource limited regions, there can be limited timely access to these professionals. There are several scoring methods proposed for evaluating radiographs in rheumatoid arthritis (8–12). The current “gold standard” scoring tool is the Sharp/van der Heijde (SvH) score which assesses joint space narrowing (JSN) and joint erosions in multiple hand and feet joints. Although the SvH method is widely used for clinical research studies, it’s use in clinical practice is limited as SvH radiograph scoring requires a highly skilled assessor and is time consuming.
Some technological advancements have addressed these challenges by utilizing deep learning to assess the joint damage directly (7,13) Maziarz et al proposed using a deep multi-task method (14) that predicts joint space narrowing and erosion scores using a deep convolutional neural network (15). The network simultaneously performs joint detection, and predicts joint space narrowing and erosion scores. This group was able to achieve a root mean squared error of 0.4075 and 0.4607 for narrowing and erosion respectively in the RA2-DREAM Challenge (16) from 119 patients obtained from two NIH supported clinical studies. Additionally, Hirano et al (17) created a two step method to perform joint score evaluation using deep learning. The steps are 1) joint detection and 2) joint evaluation. The joint detection step uses a machine learning algorithm that uses Haar-like features (18) to detect the joints. The joint evaluation step uses a convolutional neural network to assign scores to the joints. They evaluated their model on 30 patients that with diagnosed with RA based on standard criteria (19). They were able to achieve detection of PIP, Interphalangeal (IP), and MCP joints with sensitivity of 95.3%. The accuracy for erosion detection was between 70.6% to 74.1% while the accuracy for JSN was 49.3% to 65.4%.
However, there are no known AI methods that show that we could train on normal or healthy joint images and evaluate them on rheumatoid arthritis joint images. We used one of the state-of-the-art object detection algorithms, YOLOv5l6 (20), to detect the finger joints (PIP, and MCP) and wrist joints (wrist, radius, and ulna). We used a pre-trained YOLOv5l6 on COCO and showed that it is transferable and can be used to detect x-ray joints. We showed that the YOLOv5l6 model trained on imaging from the RSNA Pediatric BoneAge challenge (21) with only left hand x-ray images was able to detect joints of rheumatoid arthritis patients with left hand, right hand, or both hands in the images in our Manitoba dataset.
Methods
Dataset
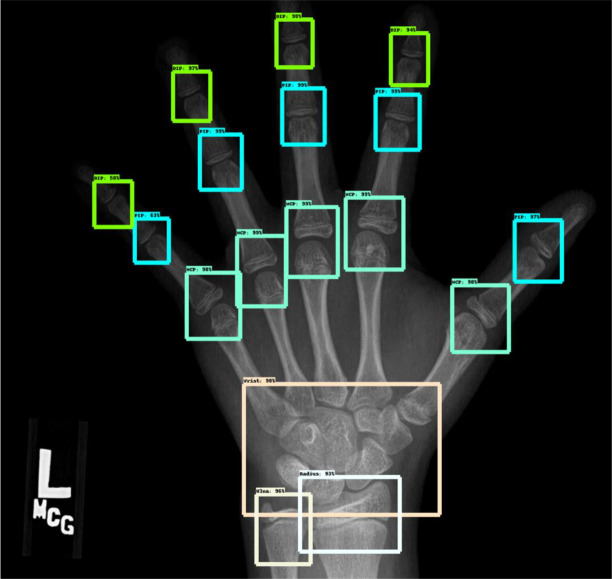
The dataset that we obtained is from RSNA 2017 Pediatric BoneAge Challenge (21). The dataset contains images of children’s hand skeleton with skeletal age between 0 to 216 months. It contains a total of 14,236 hand skeletal images of which 47% of them are female with mean age of 129 months. There was no description whether the children in the dataset are healthy or unhealthy as the challenge is to promote the showcase of machine learning on x-ray hand images. The annotations for the joints were annotated in https://github.com/razorx89/rsna-boneage-ossification-roi-detection from the RSNA Pediatric BoneAge Challenge dataset (Figure 1). There are 240 training images in total and 89 evaluation images annotated with region of interests of the joints. All of the images consist only x-ray images of the left hand. The region of interests were labeled with DIP, PIP, MCP, Wrist, Radius, and Ulna. We included only PIP, MCP, wrist, radius, and ulna in the training. There are 240 images and 89 evaluation images where each image contains 5 PIP joints, 5 MCP joints, 1 wrist, 1 radius, and 1 ulna joint.
Figure 1.
An example of an x-ray image from the RSNA Pediatric BoneAge Challenge with annotated joints
In addition, a test set with serial radiographs collected from participants enrolled in the prospective Manitoba Early Arthritis Cohort (EAC) were used to manually validate the algorithm/tool. The Manitoba EAC is an inception cohort that enrolls adults with recent onset RA defined as meeting classification criteria for RA (22) and having less than one year of arthritis symptoms at enrolment. Participants are treated following clinical guidelines (23), clinical data is collected at each visit, and radiographic images are collected annually as part of a study protocol. Serial radiographs (10-12 per participant total 43 images with both hands) from 4 EAC participants (2 female, 2 male; baseline age 46-70 years; all seropositive for rheumatoid factor and/or anti-cyclical citrullinated protein antibodies, followed for 9-13 years) were analyzed. The cohort and related studies have been approved by the Ethics review board at the University of Manitoba.
Model Architecture
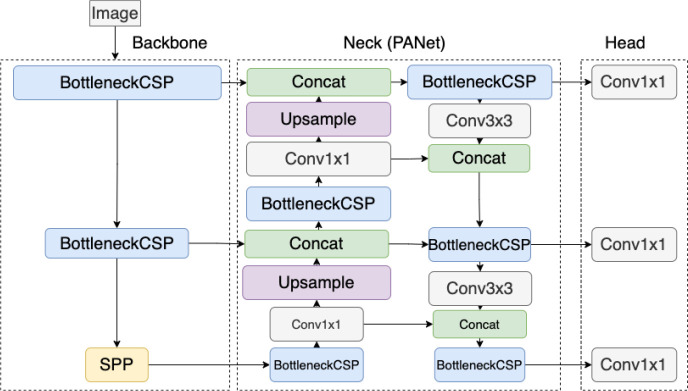
In order to detect each joint, we first used YOLOv5l6 to train on the dataset to predict the joint. The difference between YOLOv5 and YOLOv5l6 is that YOLOv5 has 3 output layers while YOLOv5l6 has 4 output layers. Having 4 different output layers increases the total number of scales the model looks at and can enhance performance. YOLOv5l6 is an object detection algorithm that uses convolutional neural network as one of its building blocks to detect objects. It only requires a single pass to the neural network to detect all the objects in the image. YOLOv5l6 consists of 3 sections – backbone, neck, and head. The backbone section uses a cross stage partial network (CSP) (24) to generate feature maps at multiple levels, similar to that of a feature pyramid network (25). The lowest level of the backbone is replaced with spatial pyramid pooling to remove the requirement of having a fixed-constraint image size. The output from the multiple level of CSP is passed into a path aggregation network (PANet) (26). PANet generates feature pyramids that are useful to generalize features in multiple scales. This helps with detecting objects of different sizes. PANet upscales and concatenates the features from the backbone, and then passes the features into a bottom-up augmentation before passing them to the head of the model to be used for prediction. (27) stated that bottom-up path augmentation can capture both global and local features as higher-level layers correspond to the entire object while lower-level layers correspond to local patterns and features. This enhances the ability of the network to classify objects. The architecture of YOLOv5 is shown in Figure 2 which was obtained from an online message group (28).
Figure 2.
The architecture of YOLOv5 model
The loss functions of YOLOv5l6 consists of 3 parts, object loss, classification loss, and bounding box regression loss. The object loss is:
S is the size of the grid of the images divided by yolo, B is the number of bounding boxes, is the prediction of the existence of an object in grid i, and Ci is the ground truth of the existence of an object in grid i. As there are many grid cells that does not contain an object, this will skew the model to predict all 0s (no object in grid cell). To solve this, and are used. emphasizes more weights on the grids that contain an object while will reduce the weights on the grids that does not contain an object. The classification loss is:
is the confidence of the class predicted and is the ground truth label.
The bounding box regression loss is:
p2 is the Euclidean distance and c is the diagonal length of the smallest box covering b and bgt.
Model Training
We used YOLOv5l6 to detect PIP, MCP, Radius, Wrist, and Ulna and removed the DIP labels as they are not important in determining damage for rheumatoid arthritis. We started the training from a pre-trained YOLOv5l6 model on the COCO dataset (Figure 3). We added several augmentations to the image before feeding them into YOLOv5l6 model including mixup (29) (mixing up features of different images together into one), mosaic (30) (combines 4 training images into 1 image), rotation, translation, scaling, and shearing augmentations.
Figure 3.
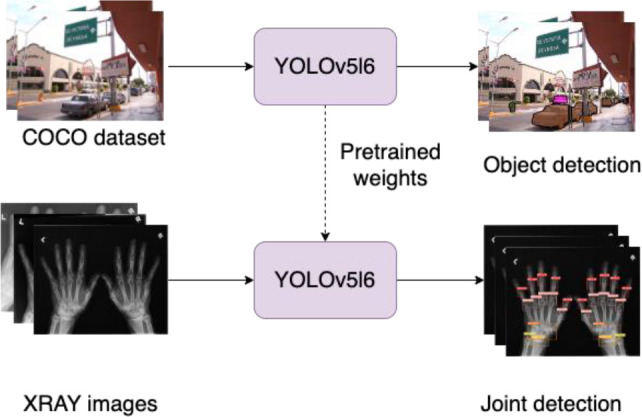
Pre-training YOLOv5l6 model on COCO dataset before training on joint detection on x-ray images of hands
Model Evaluation
We used the intersection over union (IOU) metric to evaluate the performance of the joint detection. IOU is a method that looks at the overlapping area of the predicted output and the ground truth mask. The equation for IOU is:
Instead of using accuracy to measure the performance of the object detection model, we used F1 score. While accuracy is one of the ways to measure performance, it is not the best metric to measure skewed distributions. We used 1 score because F1 score is a much better evaluation metric that treats both positive classes and negative classes equally. The equation for F1 score is as follows:
Where precision is:
And recall is:
TP is true positive, FP is false positive, FN is false negative. If there is a PIP joint and the model predicted it as PIP, then it is considered as true positive. PIP joints that are detected as MCP joints are false negatives. MCP joints which are detected as PIP joints are false positive.
We provided a set of IOU threshold and any predicted bounding boxes that have an IOU of greater than the IOU threshold when compared to the ground truth bounding boxes were considered as the prediction.
Results
We set the confidence threshold for our model to be 0.35 and the non-maximum suppression (NMS) IOU threshold as 0.1. The results when we have the confidence threshold set as 0.35 and the NMS IOU threshold set as 0.1 performs the best which can be seen in Table 1. Any joint prediction that did not have a confidence threshold of more than 0.35 was removed. Table 2 shows the average precision on different values of IOU threshold. IOU threshold was used to remove scoring boxes that are lower than other higher scoring boxes given that their IOU is higher than the IOU threshold.
Table 1.
Joint Detection Performance Based on Different Confidence Threshold
| Confidence Threshold | 0.7 | |||||
| PIP | MCP | Wrist | Radius | Ulna | ||
| F1 | 0.452 | 0.439 | 0.71 | 0.289 | 0.126 | |
| Precision | 1 | 1 | 1 | 1 | 1 | |
| Recall | 0.292 | 0.281 | 0.551 | 0.169 | 0.067 | |
| Confidence Threshold | 0.5 | |||||
| PIP | MCP | Wrist | Radius | Ulna | ||
| F1 | 0.992 | 0.988 | 0.989 | 0.982 | 0.978 | |
| Precision | 1 | 0.993 | 1 | 1 | 1 | |
| Recall | 0.984 | 0.982 | 0.978 | 0.966 | 0.955 | |
| Confidence Threshold | 0.45 | |||||
| F1 | 0.993 | 0.991 | 0.989 | 0.989 | 0.989 | |
| Precision | 1 | 0.993 | 1 | 1 | 0.997 | |
| Recall | 0.987 | 0.989 | 0.978 | 0.978 | 0.978 | |
| F1 | 0.993 | 0.991 | 0.989 | 0.989 | 0.989 | |
| Confidence Threshold | 0.35 | |||||
| PIP | MCP | Wrist | Radius | Ulna | ||
| F1 | 0.994 | 0.991 | 0.993 | 0.988 | 0.987 | |
| Precision | 1 | 0.993 | 1 | 1 | 0.997 | |
| Recall | 0.987 | 0.989 | 0.986 | 0.976 | 0.978 | |
Table 2.
Joint detection average precision on different thresholds
| Pre-trained on COCO | ||||||||||
| Threshold/Average precision | 0.1 | 0.15 | 0.20 | 0.25 | 0.30 | 0.35 | 0.40 | 0.45 | 0.5 | 0.55 |
| PIP | 0.99 | 0.99 | 0.99 | 0.99 | 0.97 | 0.87 | 0.73 | 0.55 | 0.38 | 0.26 |
| MCP | 0.99 | 0.99 | 0.97 | 0.89 | 0.75 | 0.58 | 0.42 | 0.27 | 0.2 | 0.16 |
| Wrist | 0.99 | 0.99 | 0.99 | 0.99 | 0.97 | 0.97 | 0.94 | 0.93 | 0.92 | 0.88 |
| Radius | 0.99 | 0.99 | 0.99 | 0.99 | 0.99 | 0.99 | 0.99 | 0.99 | 0.97 | 0.93 |
| Ulna | 0.99 | 0.99 | 0.99 | 0.99 | 0.97 | 0.97 | 0.96 | 0.96 | 0.82 | 0.7 |
| No Pre-trained | ||||||||||
| PIP | 0.98 | 0.98 | 0.98 | 0.98 | 0.97 | 0.93 | 0.85 | 0.69 | 0.46 | 0.3 |
| MCP | 0.98 | 0.98 | 0.95 | 0.89 | 0.82 | 0.71 | 0.60 | 0.46 | 0.35 | 0.26 |
| Wrist | 0.99 | 0.99 | 0.98 | 0.96 | 0.94 | 0.94 | 0.91 | 0.89 | 0.89 | 0.84 |
| Radius | 0.98 | 0.98 | 0.98 | 0.98 | 0.98 | 0.98 | 0.97 | 0.94 | 0.93 | 0.86 |
| Ulna | 0.67 | 0.67 | 0.67 | 0.67 | 0.67 | 0.67 | 0.67 | 0.67 | 0.65 | 0.48 |
There is still a high performance achieved with YOLOv5l6 when the IOU threshold is at 0.3. The joints detected are still located at the fundamental joints area and is still able to capture the joints location. We looked at the detection and saw that the joints detected were accurate. YOLOv5l6 that is pre-trained on COCO is able to achieve a better performance than no pre-training.
Table 3 shows the F1 score, precision, and recall metrics for the joints. All joint types were able to achieve at least 0.98 F1 score performance when evaluated on the evaluation set. The mean metrics are shown in Table 4. Map0.1 is the mean average precision with IOU threshold set as 0.1, map is the mean average precision from 0.1 IOU threshold to 0.55 IOU threshold. The PIP and MCP joints have the most number of targets as there exist 5 joints for each of them while only 1 joint each for wrist, radius, and ulna.
Table 3.
Joint detection metrics
| pre-trained on COCO | |||||
| PIP | MCP | Wrist | Radius | Ulna | |
| F1 | 0.994 | 0.991 | 0.993 | 0.988 | 0.987 |
| Precision | 1 | 0.993 | 1 | 1 | 0.997 |
| Recall | 0.987 | 0.989 | 0.986 | 0.976 | 0.978 |
| No pre-trained | |||||
| F1 | 0.928 | 0.971 | 0.921 | 0.977 | 0.504 |
| Precision | 0.883 | 0.986 | 0.87 | 1 | 1 |
| Recall | 0.978 | 0.957 | 0.978 | 0.955 | 0.337 |
Table 4.
Joint detection mean metrics
| Pre-trained on COCO | ||||||
| Seen | Number targets | Mean precision | Mean recall | map0.1 | map | |
| All | 89 | 1157 | 0.998 | 0.983 | 0.993 | 0.854 |
| PIP | 89 | 445 | 1 | 0.987 | 0.994 | 0.772 |
| MCP | 89 | 445 | 0.993 | 0.989 | 0.994 | 0.624 |
| Wrist | 89 | 89 | 1 | 0.986 | 0.994 | 0.958 |
| Radius | 89 | 89 | 1 | 0.976 | 0.994 | 0.983 |
| Ulna | 89 | 89 | 0.997 | 0.978 | 0.988 | 0.933 |
| No pre-trained | ||||||
| All | 89 | 1157 | 0.948 | 0.841 | 0.919 | 0.81 |
| PIP | 89 | 445 | 0.883 | 0.978 | 0.984 | 0.814 |
| MCP | 89 | 445 | 0.986 | 0.957 | 0.977 | 0.7 |
| Wrist | 89 | 89 | 0.87 | 0.978 | 0.987 | 0.932 |
| Radius | 89 | 89 | 1 | 0.955 | 0.977 | 0.957 |
| Ulna | 89 | 89 | 1 | 0.337 | 0.669 | 0.647 |
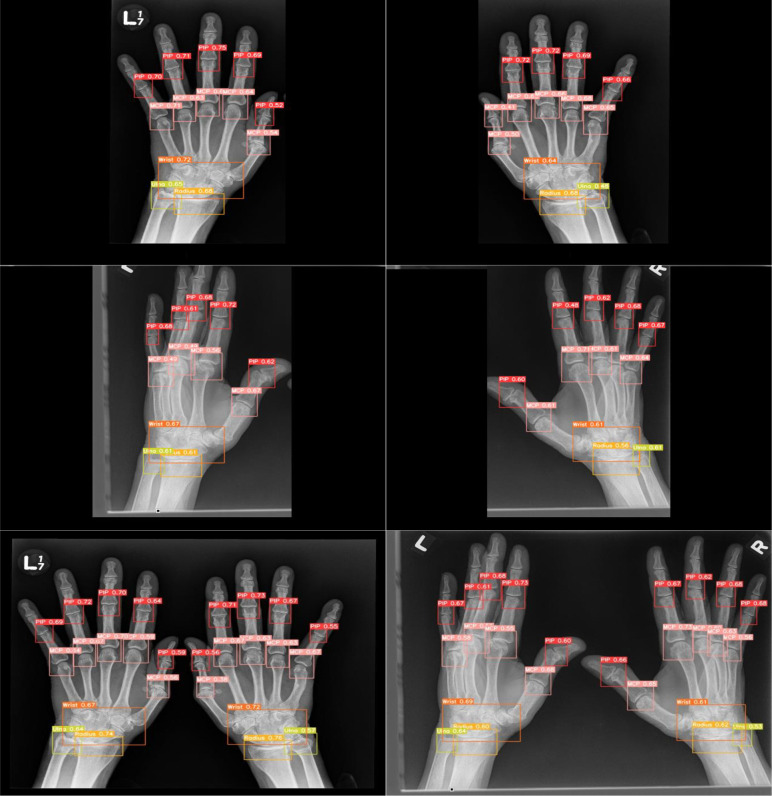
Figure 4 shows the visualization of the joint prediction by YOLOv5l6 on the Manitoba dataset of RA patients. The x-ray images shown all correctly predicted by YOLOv5l6. As the training dataset only consists of left hands, we can see the detection by YOLOv5l6 on the Manitoba dataset of RA patients is still accurate even when the x-ray images consist of right hands or both hands. The joints were still able to be predicted when the hands orientations were not exactly “flat” on the x-ray images although there is a missed MCP joints due to how the fingers were arranged in the third row and bottom right x-ray image in Figure 4. As deep learning network tends to require a fixed image size that was trained based on the image size to be able to do a prediction, YOLOv5l6 was able to predict the joints regardless of needing fixed image sizes. Images that is fed into YOLOv5l6 does not need to be resized to a specific format, YOLOv5l6 can take variable image sizes. It was also able to predict joints correctly on images that contain either left/right hand or both hands even though the training data consists only of left hands. As there is a different distribution in having images with one hand or both hands due to the hand placement and the difference in the size of the images (images with one hand are generally smaller than images with both hands by half the size), the variability did not affect the performance for YOLOv5l6 in detecting the joints.
Figure 4.
Visualization of predicted joints (PIP, MCP, wrist, radius, ulna) of rheumatoid arthritis patients in the Manitoba Dataset of 4 different x-ray images (right hand or both hands) by YOLOv5l6. The first two rows consist of x-ray images with only one hand. The last row consists of x-ray images with both hands.
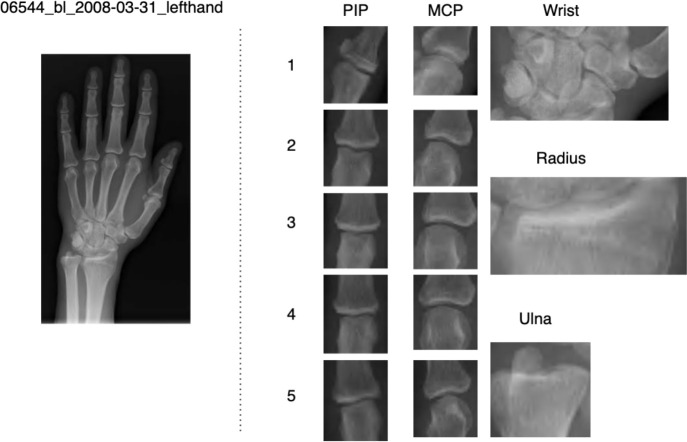
We showed an example of the extracted joints for a patient’s left hand in Figure 5. This image shows a close-up picture of the extracted joints of PIPs, MCPs, wrist, radius and ulna joints.
Figure 5.
Extraction and numbering of joints of hand.
Discussion
A large open access normal pediatric hand radiograph dataset was used to train the joint detection model as there are few similar adult datasets that are accessible. The ability of our model which was developed to identify "wide" joint spaces characteristic of non-ossified immature pediatric joints-excluding wrists joints) to also identify narrower (adult) joints could be considered even more robust.
Conclusion
In this work, we showed YOLOv5l6 is capable of detecting joints (PIP, MCP, wrist, ulna, radius) of rheumatoid arthritis patients even if YOLOv5l6 was trained on left hand joints of healthy patients. It was able to achieve high performance on the test set with F1 score of more than 0.9 for all the joint types (PIP, MCP, wrist, ulna, radius). YOLOv5l6 was able to achieve a high performance even when the pre-trained weights were started on weights that were trained on the COCO dataset.
This study opens up the possibility of a variety of applications including rheumatoid arthritis. Future work will use this tool to identify/extract the joints detected on radiographic images from rheumatoid arthritis patients, classify the severity joint damage (joint space narrowing and erosions), and correlate our deep learning algorithm /tool with clinician assessed radiographic damage. Additionally, we will use deep learning to extract joints in combination with serially collected radiographs and longitudinal clinical data to predict changes in rheumatoid joint damage over time. This application may assist clinicians caring for individuals with rheumatoid arthritis by informing RA treatment.
Funding
PH is the holder of Manitoba Medical Services Foundation (MMSF) Allen Rouse Basic Science Career Development Research Award. This study is partially supported by an operating grant from Winnipeg Health Sciences Centre Foundation and an operating grant from the Canada Research Chairs Tier II Program [CRC-2021-00482 to PH].
Figures & Table
References
- 1.LeCun Y, Bengio Y, Hinton G. Deep learning. Nature. 2015 May 28;(7553):521. doi: 10.1038/nature14539. [DOI] [PubMed] [Google Scholar]
- 2.Tilve A, Nayak S, Vernekar S, Turi D, Shetgaonkar PR, Aswale S. Pneumonia Detection Using Deep Learning Approaches. International Conference on Emerging Trends in Information Technology and Engineering, ic-ETITE 2020. 2020 [Google Scholar]
- 3.Qin C, Yao D, Shi Y, Song Z. Computer-aided detection in chest radiography based on artificial intelligence: A survey. BioMedical Engineering Online. 2018;Vol. 17 doi: 10.1186/s12938-018-0544-y. [DOI] [PMC free article] [PubMed] [Google Scholar]
- 4.Oh M, Zhang L. DeepMicro: deep representation learning for disease prediction based on microbiome data. Sci Rep. 2020;10(1) doi: 10.1038/s41598-020-63159-5. [DOI] [PMC free article] [PubMed] [Google Scholar]
- 5.Tran KA, Kondrashova O, Bradley A, Williams ED, Pearson J v., Waddell N. Deep learning in cancer diagnosis, prognosis and treatment selection. Vol. 13, Genome Medicine. 2021 doi: 10.1186/s13073-021-00968-x. [DOI] [PMC free article] [PubMed] [Google Scholar]
- 6.CDC. Arthritis | CDC. Centers for Disease Control and Prevention. 2020.
- 7.Fukae J, Isobe M, Hattori T, Fujieda Y, Kono M, Abe N, et al. Convolutional neural network for classification of two-dimensional array images generated from clinical information may support diagnosis of rheumatoid arthritis. Sci Rep. 2020;10(1) doi: 10.1038/s41598-020-62634-3. [DOI] [PMC free article] [PubMed] [Google Scholar]
- 8.KELLGREN JH. Radiological signs of rheumatoid arthritis; a study of observer differences in the reading of hand films. Ann Rheum Dis. 1956;15(1) doi: 10.1136/ard.15.1.55. [DOI] [PMC free article] [PubMed] [Google Scholar]
- 9.Sharp JT, Lidsky MD, Collins LC, Moreland J. Methods of scoring the progression of radiologic changes in rheumatoid arthritis. Correlation of radiologic, clinical and laboratory abnormalities. Arthritis Rheum. 1971;14(6) doi: 10.1002/art.1780140605. [DOI] [PubMed] [Google Scholar]
- 10.Sharp JT, Bluhm GB, Brook A, Brower AC, Corbett M, Decker JL, et al. Reproducibility of multiple‐ observer scoring of radiologic abnormalities in the hands and wrists of patients with rheumatoid arthritis. Arthritis Rheum. 1985;28(1) doi: 10.1002/art.1780280104. [DOI] [PubMed] [Google Scholar]
- 11.Larsen A, Dale K, Eek M. Radiographic evaluation of rheumatoid arthritis and related conditions by standard reference films. Acta Radiologica - Series Diagnosis. 1977;18(4) doi: 10.1177/028418517701800415. [DOI] [PubMed] [Google Scholar]
- 12.Genant HK. Methods of assessing radiographic change in rheumatoid arthritis. Am J Med. 1983;75(6 PART 1) doi: 10.1016/0002-9343(83)90473-4. [DOI] [PubMed] [Google Scholar]
- 13.Üreten K, Erbay H, Maraş HH. Detection of rheumatoid arthritis from hand radiographs using a convolutional neural network. Clin Rheumatol. 2020;39(4) doi: 10.1007/s10067-019-04487-4. [DOI] [PubMed] [Google Scholar]
- 14.Caruana R. Multitask Learning. Mach Learn. 1997;28(1) [Google Scholar]
- 15.Krizhevsky A, Sutskever I, Hinton GE. ImageNet classification with deep convolutional neural networks. Advances in Neural Information Processing Systems. 2012 [Google Scholar]
- 16.Sun D, Nguyen TM, Allaway RJ, Wang J, Chung V, Yu T v., et al. A Crowdsourcing Approach to Develop Machine Learning Models to Quantify Radiographic Joint Damage in Rheumatoid Arthritis. SSRN Electronic Journal. 2022 doi: 10.1001/jamanetworkopen.2022.27423. [DOI] [PMC free article] [PubMed] [Google Scholar]
- 17.Hirano T, Nishide M, Nonaka N, Seita J, Ebina K, Sakurada K, et al. Development and validation of a deep-learning model for scoring of radiographic finger joint destruction in rheumatoid arthritis. Rheumatol Adv Pract. 2019;3(2) doi: 10.1093/rap/rkz047. [DOI] [PMC free article] [PubMed] [Google Scholar]
- 18.Viola P, Jones M. Rapid object detection using a boosted cascade of simple features. Proceedings of the IEEE Computer Society Conference on Computer Vision and Pattern Recognition. 2001 [Google Scholar]
- 19.Aletaha D, Neogi T, Silman AJ, Funovits J, Felson DT, Bingham CO, et al. 2010 Rheumatoid arthritis classification criteria: An American College of Rheumatology/European League Against Rheumatism collaborative initiative. Vol. 62, Arthritis and Rheumatism. 2010 doi: 10.1002/art.27584. [DOI] [PubMed] [Google Scholar]
- 20.Redmon J, Divvala S, Girshick R, Farhadi A. You only look once: Unified, real-time object detection. Proceedings of the IEEE Computer Society Conference on Computer Vision and Pattern Recognition. 2016 [Google Scholar]
- 21.Halabi SS, Prevedello LM, Kalpathy-Cramer J, Mamonov AB, Bilbily A, Cicero M, et al. The rSNA pediatric bone age machine learning challenge. Radiology. 2019;290(3) doi: 10.1148/radiol.2018180736. [DOI] [PMC free article] [PubMed] [Google Scholar]
- 22.Kay J, Upchurch KS. ACR/EULAR 2010 rheumatoid arthritis classification criteria. Rheumatology (United Kingdom) 2012;51(SUPPL. 6) doi: 10.1093/rheumatology/kes279. [DOI] [PubMed] [Google Scholar]
- 23.Fraenkel L, Bathon JM, England BR, St.Clair EW, Arayssi T, Carandang K, et al. 2021 American College of Rheumatology Guideline for the Treatment of Rheumatoid Arthritis. Arthritis Care Res (Hoboken) 2021;73(7) doi: 10.1002/acr.24596. [DOI] [PMC free article] [PubMed] [Google Scholar]
- 24.Wang CY, Mark Liao HY, Wu YH, Chen PY, Hsieh JW, Yeh IH. CSPNet: A new backbone that can enhance learning capability of CNN. IEEE Computer Society Conference on Computer Vision and Pattern Recognition Workshops. 2020 [Google Scholar]
- 25.Lin TY, Dollár P, Girshick R, He K, Hariharan B, Belongie S. Feature pyramid networks for object detection. Proceedings - 30th IEEE Conference on Computer Vision and Pattern Recognition, CVPR 2017. 2017 [Google Scholar]
- 26.Liu S, Qi L, Qin H, Shi J, Jia J. Path Aggregation Network for Instance Segmentation. Proceedings of the IEEE Computer Society Conference on Computer Vision and Pattern Recognition. 2018 [Google Scholar]
- 27.Zeiler MD, Fergus R. Visualizing and understanding convolutional networks. Lecture Notes in Computer Science (including subseries Lecture Notes in Artificial Intelligence and Lecture Notes in Bioinformatics) 2014 [Google Scholar]
- 28.Overview of Model Structure about YOLOv5 [Internet] [cited 2022 Sep 12]. Available from: https://github.com/ultralytics/yolov5/issues/280.
- 29.Zhang H, Cisse M, Dauphin YN, Lopez-Paz D. MixUp: Beyond empirical risk minimization. 6th International Conference on Learning Representations, ICLR 2018 - Conference Track Proceedings. 2018 [Google Scholar]
- 30.Bochkovskiy A, Wang CY, Liao HYM. YOLOv4: Optimal Speed and Accuracy of Object Detection. 2020 Apr 22 [Google Scholar]


