Abstract
Genome instability and aberrant alterations of transcriptional programs both play important roles in cancer. Single-cell RNA sequencing (scRNA-seq) has the potential to investigate both genetic and non-genetic sources of tumor heterogeneity in a single assay. Here we present a computational method, Numbat, that integrates haplotype information obtained from population-based phasing with allele and expression signals to enhance detection of copy number variations from scRNA-seq. Numbat exploits the evolutionary relationships between subclones to iteratively infer the single-cell copy number profiles and tumor clonal phylogeny. Analyzing 22 tumor samples composed of multiple myeloma, gastric, breast, and thyroid cancers, we show that Numbat can reconstruct the tumor copy number profile and precisely identify malignant cells in the tumor microenvironment. We identify genetic subpopulations with transcriptional signatures relevant to tumor progression and therapy resistance. Numbat does not require sample-matched DNA data or a priori genotyping, and is applicable to a wide range of experimental settings and cancer types.
Keywords: tumor heterogeneity, genome instability, somatic evolution, single-cell transcriptomics, population-based haplotype phasing
Introduction
Copy number variations (CNVs) and loss of heterozygosity (LoH) events are major genome aberrations found in nearly all cancer cells. Characterization of CNVs in healthy and malignant tissues has informed the early detection, modes of progression, and resistance mechanisms of cancer. However, the functional impacts of CNVs on the overall cellular activity, and how they drive malignant transformation remain largely unclear. Genome instability is also a key contributor to intratumoral heterogeneity. Therapy-resistant subclones frequently arising in the course of treatment pose a major challenge to cancer therapies. In addition to genetic heterogeneity, resistance may also stem from changes in the epigenetic or regulatory state, though the relative importance of different mechanisms has been difficult to establish1. All such changes, however, including genomic alterations, are likely reflected in the transcriptional state of the cell.
Single-cell RNA sequencing (scRNA-seq) methods provide an excellent opportunity to bridge genetic heterogeneity with the overall cellular state. It has been demonstrated that CNVs can be inferred from transcript abundance as well as allelic imbalance in heterozygous SNPs2-5. Reliable inference of copy number states, however, remains challenging using either approach due to the sparse and noisy nature of single-cell measurements. Expression-based methods infer the presence of CNVs based on a general expectation that amplifications or deletions will on average result in up- or down-regulation of genes within the affected region of the genome, respectively. Such approach can produce false-positive results due to local variations in expression unrelated to genomic copy numbers6. Allele-based approaches examine deviations of the heterozygous allele frequency (“B-allele frequency” or BAF) caused by CNVs, and are less affected by sample or cell type variations2,5. They are hindered, however, by data sparsity and allele-specific transcriptional stochasticity in single cells7.
Existing approaches for CNV detection from scRNA-seq do not use the prior knowledge of haplotypes, or the individual-specific configuration of variant alleles on the two homologous chromosomes, which can enable more sensitive detection of allelic imbalance. Although current sequencing technologies are generally not haplotype-resolved, population-based phasing provides means to computationally phase variants of an individual using population haplotype frequencies8,9. The estimated haplotypes are highly accurate within adjacent genomic regions, with a typical span of 50kb - 1Mb, but are subject to phase switch errors that accumulate with longer genomic distance10. Nonetheless, population-based phasing has been successfully applied to characterize chromosomal aberrations in the context of germline polymorphisms as well as cancer evolution, mainly using DNA sequencing/array genotyping data11-14. The utility of phasing in detecting CNV signals from scRNA-based assays, however, has not been explored. We hypothesized that prior phasing information would be particularly impactful in the context of sparse coverage provided by scRNA-seq.
Finally, single-cell sequencing provides a unique opportunity to dissect genetically heterogeneous subpopulations, which are masked in bulk measurements. Since scRNA-seq yields limited coverage per cell, methods that use allele information typically rely on aggregating information across cells (forming in silico “pseudobulk” profiles) to confidently define aberrations2,5. This approach, however, will only increase statistical power if the aberrations are shared between the cells included in the pseudobulk, and could lead to a dilution of signal with the inclusion of genetically distinct cells. Therefore, reliable identification of subclonal CNV events depends on the accurate inference of clonal cell populations.
We therefore developed a computational method, Numbat, which integrates expression, allele, and haplotype information derived from population-based phasing to comprehensively characterize the CNV landscape in single-cell transcriptomes. Numbat employs an iterative approach to jointly reconstruct the subclonal phylogeny and single-cell copy number profile of the tumor sample. Applying our method to 22 tumor samples (59878 single cells) representing a variety of cancer types and genomic complexity, we show that Numbat reconstructs high-fidelity copy number profiles from scRNA-data alone, and accurately distinguishes cancer cells from normal cells in the tumor microenvironment. Within heterogeneous tumors, Numbat readily identifies distinct subclonal lineages that harbor allele-specific alterations. Numbat does not require sample-matched DNA data or a priori genotyping, and is applicable to a wide range of experimental settings and cancer types.
Results
Sensitive CNV detection using haplotype information
Prior phasing information can effectively amplify weak allelic imbalance signals of individual SNPs induced by the CNV, by exposing joint behavior of entire haplotype sequences and thereby increasing the statistical power11,14. To examine the extent to which expressed heterozygous SNPs can be detected from scRNA-seq data, we genotyped common germline SNPs (>5% population frequency) in 22 tumor samples sequenced by high-throughput droplet-based protocols (Supplementary Table 1). The density of the detected heterozygous SNPs along the genome and the per-cell SNP coverage vary by sample and datasets (16-68 SNPs/Mb and 159-1045 counts/cell; Supplementary Fig. 1a,b). A large proportion of the SNPs is detected within intronic regions, although with lower coverage than SNPs within UTR and exonic regions (Supplementary Fig. 1c,d). To demonstrate the feasibility of population-based phasing in such coverage setting, we first analyzed a triple-negative breast cancer sample (TNBC4) that contains wide-spread loss of heterozygosity. The observed allele counts in chromosome arms with complete LoH allowed us to confidently phase alleles (P < 0.05, two-sided binomial test) into their respective haplotypes. We performed population-based haplotype phasing using a reference-based phasing algorithm, Eagle28, with respect to two different population genome reference panels: TOPMed and 1000 genomes (1000G)15,16.
We found that population-based phasing was effective at inferring the haplotype of long stretches of expressed SNPs (mean: 11.6 SNPs, IQR 2-15, TOPMed). SNPs within the same gene were phased with especially high accuracy (96.8%) as compared to co-expression based phasing (83.7%)17. Furthermore, population-based phasing was also able to infer the haplotype across genes, producing perfectly phased blocks containing on average 3.8 genes (IQR 1-5) and achieving a between-gene phasing accuracy of 79.8%. In contrast, co-expression based phasing relies on haplotype-specific expression of alleles within the same gene and cannot phase across genes. The ability to infer phasing between genes is particularly useful for CNV inference, as it provides a potential means to overcome stochastic allele-specific expression (ASE) effects which give rise to bursts of gene-specific allelic imbalances in individual cells. ASE is prevalent in normal diploid cells, due to a combination of amplification bias, transcriptional bursting18 or cis-regulatory effects19. However, in diploid regions the direction of ASE is independent between genes; that is, given a transcriptional burst of a gene from a maternal chromosome, the neighboring genes would be on average equally likely to show bursts from either maternal or paternal chromosomes. In contrast, the presence of a CNV would result in a consistent allelic bias among a stretch of neighboring genes towards a particular chromosome. The knowledge of haplotypes provided by population-based phasing enables allelic bias signals to be aggregated across SNPs in consecutive genes, thus overcoming noise resulting from ASE (Supplementary Fig. 2).
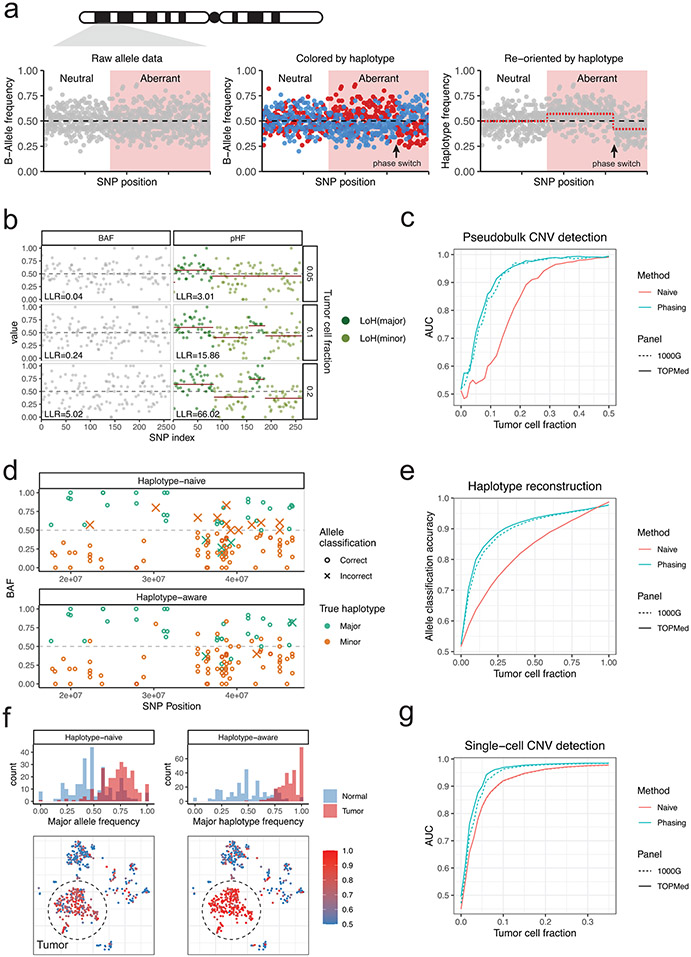
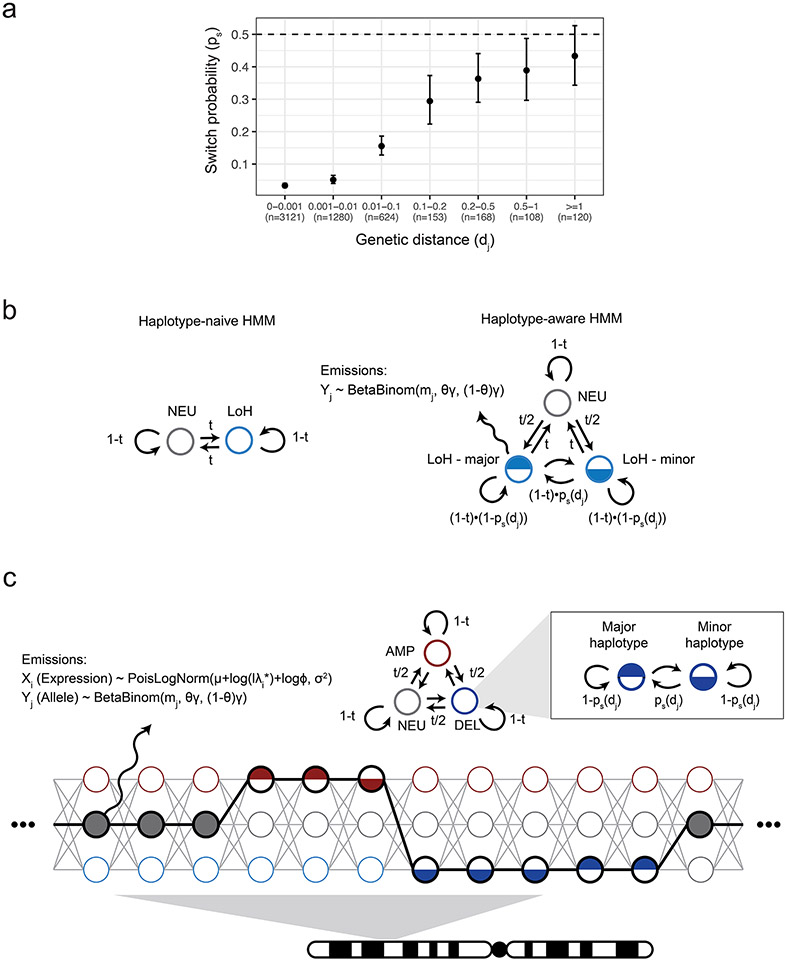
Hidden Markov models have been effectively used to detect allelic imbalances from noisy signals2,5,11,14,20,21. The conventional allele-focused approach (haplotype-naïve HMM, such as that used by HoneyBADGER) infers the presence of events by the increased variance of allele frequencies in the affected regions (Fig. 1a, first panel)2,5,20,21. On the other hand, a haplotype-aware HMM exploits signed deviations of phased haplotype frequencies to gain additional statistical power (Fig. 1a, last panel)11,14. The aberrant genome state is represented by a pair of mirrored states with reciprocal transitions to account for phase switch errors in the population-derived haplotypes, which can shift between the more abundant haplotype (major haplotype) and the less abundant haplotype (minor haplotype, Extended Data Fig. 1b). To reflect the decay in phasing strength over longer genetic distances, we introduced site-specific phase switch probabilities between haplotype states (Methods). This gives rise to an inhomogeneous Markov chain where the haplotype transition probabilities are an exponential function of inter-SNP distance (Extended Data Fig. 1a,b).
Figure 1: Population-based haplotype phasing enables sensitive detection of subclonal allelic imbalances in single-cell transcriptomes.
a, Schematic of using haplotype information to detect allelic imbalance. BAF, B-allele frequency. Simulated BAF signals are shown for a neutral and aberrant region harboring subclonal CNV. After BAF is transformed into haplotype frequency based on phase information, CNV signals become apparent and can be segmented. b, Example of statistical phasing signal uncovering subclonal LoH in TNBC4 tumor-normal cell mixtures that are undetectable using BAF deviation. LLR, log-likelihood ratio. LoH, loss of heterozygosity. c, Performance of LoH detection in tumor-normal mixtures with and without haplotype phasing (“phasing” and “naive”). AUC, area under the ROC curve. d, Example of population-based phasing informing allele classification into major/minor haplotypes. e, Performance of allele classification accuracy in tumor-normal mixtures. f, Example of population-based phasing improving detection of LoH in single cells. g, Performance of LoH detection in single cells.
To benchmark the extent to which phasing helps with inferring CNVs and single-cell genotypes from scRNA-seq based on allele data, we used the existing cell annotation of TNBC4 and five multiple myeloma (MM) samples with matched WGS to create tumor-normal mixture pseudobulk profiles for a range of tumor cell fractions (clonality: 0-100%, Supplementary Figs. 3,4). Compared to the naïve model, the haplotype-aware allele HMM readily identified subtle allelic imbalances that would otherwise be invisible (Fig. 1b) and achieved a higher AUC at low tumor fractions (Fig. 1c). Phasing also improved CNV detection sensitivity at low coverage settings and for amplification events (Supplementary Fig. 5). We then asked whether we can confidently test for the presence of individual CNVs in single cells using the event characteristics obtained from the pseudobulk profile. Accurately phased haplotype is crucial for identifying genotypes of individual cells, as it helps overcome the sparse SNP coverage by aggregating allele counts over affected regions2. In a naïve HMM, the assignment of alleles to either haplotype is solely based on the observed allele frequencies (an allele is classified as major if its BAF is higher than 0.5), whereas a haplotype-aware HMM combines evidence from prior phasing information and observed allele data to reconstruct haplotypes a posteriori. Using the BAF-based allele classification in the all-tumor pseudobulk as ground truth, we found that our haplotype-aware HMM achieved higher allele classification accuracy in aberrant regions especially at low tumor cell fractions (Fig. 1d,e). As a result, allelic imbalances were more readily discernable in individual tumor cells using posterior allele assignments from the haplotype-aware HMM (Fig. 1f,g, Supplementary Fig. 5). Therefore, incorporating population phasing signal enables more sensitive characterization of allelic imbalances, and hence CNVs and LoH events, from scRNA-seq data.
Allele-specific copy number inference from transcriptomes
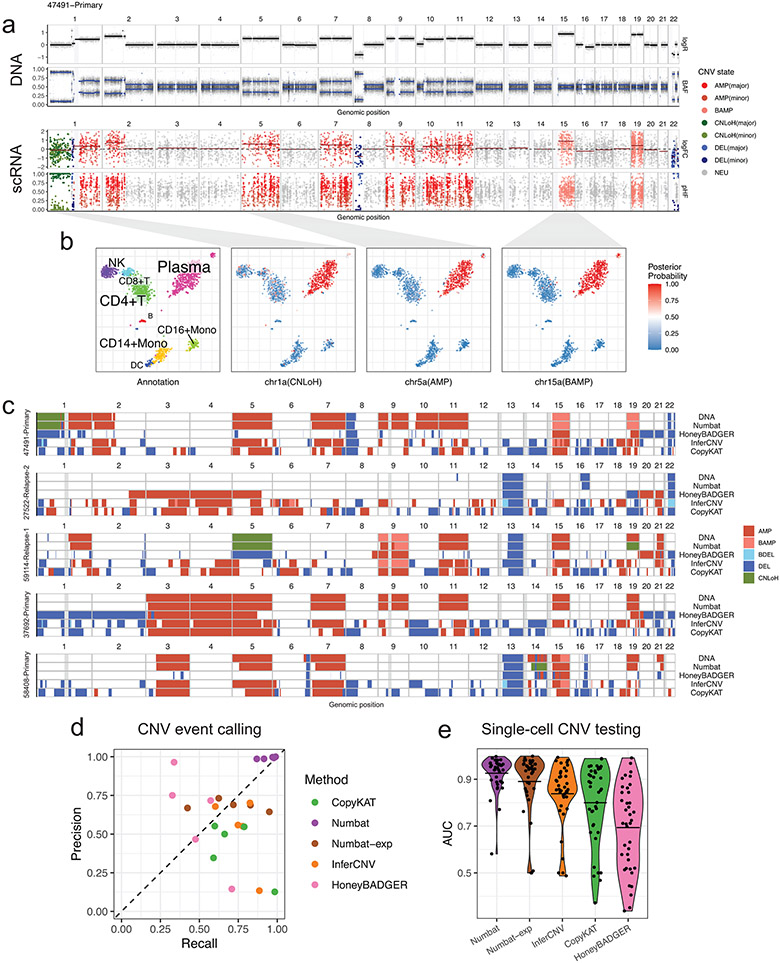
Both the allelic imbalance, which reflects relative copy number of the two homologous chromosomes, as well as the changes in expression magnitudes, which reflect the total chromosomal dosage, provide signals for characterizing genome aberrations2,5. To integrate these two types of signals, we designed a joint HMM based on a generative statistical framework (Methods, Extended Data Fig. 2). We expanded the state space of the haplotype-aware allele HMM by combining the expected expression shifts and allele frequencies corresponding to each copy number configuration (Methods, Extended Data Fig. 1c, Supplementary Fig. 6). To increase robustness, Numbat models gene expression as integer read counts using a Poisson Lognormal mixture distribution, and accounts for overdispersion in the allele counts (e.g., due to allele-specific detection or transcriptional bursts) using a Beta-Binomial distribution. The resulting HMM simultaneously calls significantly altered regions and determines their allele-specific copy number states (Fig. 2a). The expression and allele signal in single cells can similarly be integrated to produce probabilistic estimates of event presence in single cells (Fig. 2b).
Figure 2: Numbat achieves accurate copy number inference via joint evaluation of gene expression, allele fraction, and prior haplotype phasing information.
a, DNA copy number profile of a multiple myeloma sample juxtaposed with that inferred by the Numbat joint HMM. logFC, log expression fold-change. pHF, paternal haplotype frequency. logR, log coverage ratio. BAF, B-allele frequency. Gray vertical bars represent centromeres and gap regions. b, Cell type annotation and posterior probability of CNV events in single cells visualized on a t-SNE embedding of gene expression profiles. c, Copy number events detected by WGS, Numbat, and other methods. Gray vertical bars represent gap regions. BAMP, balanced amplification. BDEL, balanced deletion. d, Performance of CNV event detection by different methods. Each dot represents a distinct sample. e, Performance of single-cell CNV testing by different methods. Each dot represents a distinct CNV event (n=39). Center line, mean.
Existing methods infer copy number variations relative to the median ploidy, which can dilute signals of aberrant regions or mistake neutral regions for aberrant due to baseline shifts caused by hyperdiploidy or hypodiploidy22. To identify the diploid baseline, Numbat adopts a two-step approach: first, allelically balanced regions are identified through an allele-only HMM. The balanced regions are then clustered based on the expression shifts, and the cluster with the lowest average fold-change is designated as diploid regions (Supplementary Methods).
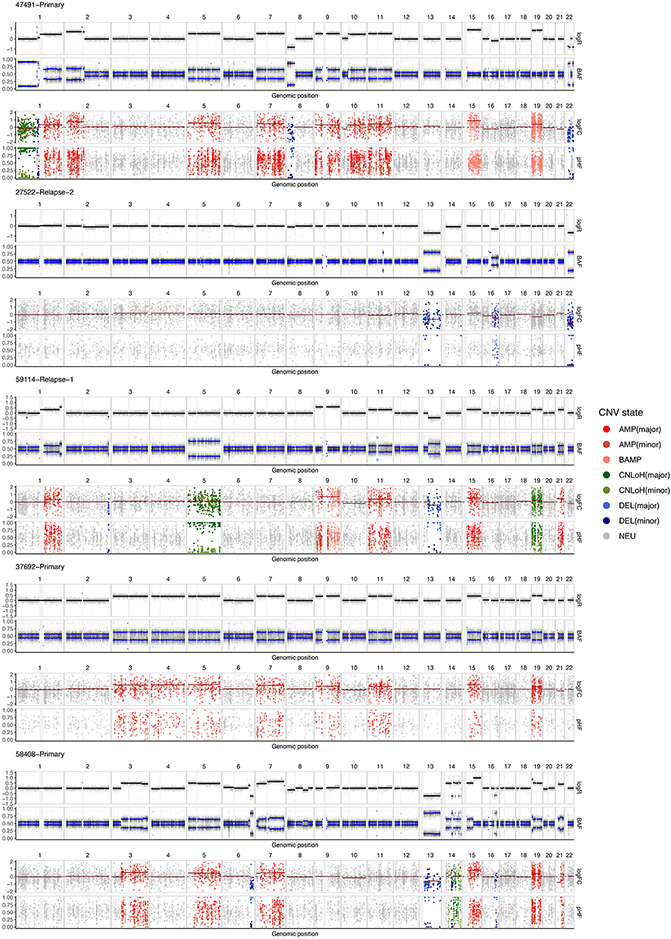
To validate the performance of copy number inference using the Numbat joint HMM, we turn to scRNA-seq data of the 5 multiple myeloma samples with sample-matched, flow-sorted WGS. We detected CNV events from the malignant plasma cells using the Numbat joint HMM, Numbat expression-only HMM, and three other methods (HoneyBADGER, InferCNV and CopyKat). We found that the copy number events identified by Numbat are highly concordant with the corresponding DNA profiles (Fig. 2c, Extended Data Fig. 3), achieving higher overall accuracy (precision: 99.2%, recall: 95.4%) than other methods (Fig. 2d). Although the number of expressed SNPs varies by event size, incorporating allele information significantly improved the overall event calling performance (Fig. 2d and Supplementary Fig. 7a). The results are generally not sensitive to specific choices of hyperparameters used to configure the HMM (Supplementary Fig. 7b). In addition, Numbat correctly identified copy-neutral loss of heterozygosity (CNLoH) events in two samples (chr1p of 47491-Primary, chr5 of 59114-Relapse-1), which are invisible to approaches that consider only expression magnitude, including InferCNV and CopyKAT (Fig. 2c). When tested on non-malignant cell populations, Numbat made the fewest number of false-positive calls, demonstrating its specificity (Supplementary Fig. 8). Numbat also out-performed other methods on CNV testing on a single-cell level (Fig. 2e).
Numbat correctly identified the diploid baseline in all 5 cases, whereas the copy number estimates produced by the other three methods are often confounded by baseline shifts caused by hyperdiploidy (e.g., 37692-Primary and 47491-Primary; Fig. 2c). This issue is particularly pronounced in a pre-malignant breast cancer sample (DCIS1), where CopyKAT denoted chromosomes 3, 9, 10, 15 as deleted, and chromosomes 1, 7q, 14 as copy-neutral (Supplementary Fig. 9a). In contrast, Numbat analysis using both allele and expression data revealed that chromosomes 3, 9, 10, 15 are largely allelically balanced and therefore likely remain in diploid state, whereas chromosomes 1, 7q, 14 carry wide-spread allelic imbalance around ⅔ fraction and are likely in triploid state (Supplementary Fig. 9b).
Inferring tumor clonal architecture and evolutionary history
scRNA-seq is commonly used to examine a full spectrum of cell states within the tumor microenvironment, including different malignant, immune and stromal subpopulations, whose classification is often unknown in advance. Therefore, reconstructing the single-cell copy number aberrations in heterogenous cell populations requires the inference of clonal populations and genomic aberrations at the same time. In heterogenous tumors, cells with distinct genotypes can generally be assumed to have originated from a common cell of origin, and are thus related to each other via a phylogeny. Their evolutionary relationships, if known, can be exploited to improve CNV detection by sharing information across cells in the same lineage23. On the other hand, given an estimated single-cell copy number profile, a CNV-based tumor phylogeny can be inferred24,25.
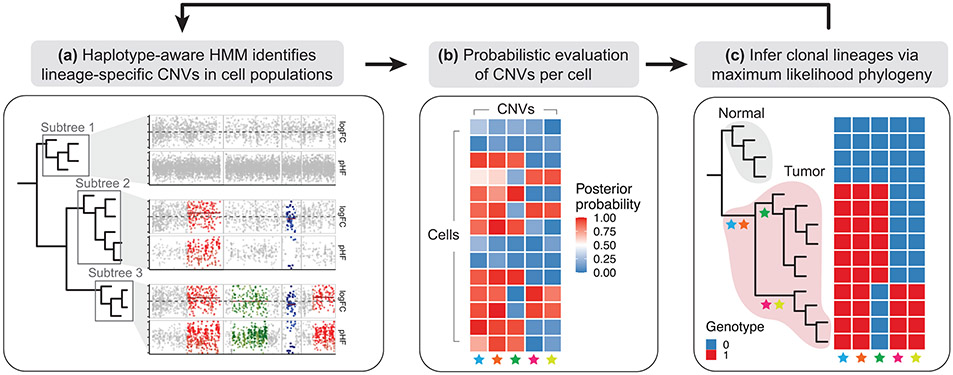
To perform joint inference of single-cell CNV profiles and the associated subclonal phylogeny, Numbat adopts an alternating optimization procedure. In each iteration, Numbat first identifies CNVs in each branch of the clonal phylogeny using the joint HMM on pseudobulk expression and allele profiles (Fig. 3a). Cells are aggregated into pseudobulks by subtrees defined by the lineage hierarchy, enabling detection of shared CNV events. The CNV calls are then resolved into consensus segments based on the overlap and likelihood evidence (Supplementary Fig. 10). Numbat then evaluates the likelihood evidence for each unique event in individual cells using a Bayesian hierarchical model, producing a matrix of posterior probabilities of CNVs by cell (Fig. 3b). Next, to recover the tumor clonal architecture, Numbat infers a single-cell lineage tree using a maximum-likelihood perfect phylogeny approach26 (ScisTree), fully propagating the uncertainty in single-cell CNV calls (Fig. 3c). The genotype probabilities are used to search for an optimal tree topology using nearest neighbor interchange (NNI), and mutations are placed on the tree based on maximum likelihood. Clonal populations with distinct genotypes can then be determined from the simplified mutational history (Supplementary Methods). Finally, Numbat uses the inferred single-cell phylogeny to form more precise lineage-specific pseudobulks, iteratively optimizing single-cell copy number profiles and tumor phylogeny. By default, Numbat initializes the phylogeny by hierarchical clustering of window-smoothed expression signals.
Figure 3: Iterative strategy to identify tumor subclones.
a, Numbat aggregates data from single cells into pseudobulk profiles by major clades in the single-cell phylogeny, and runs a haplotype-aware HMM on each pseudobulk profile to identify lineage-specific CNVs. b, Numbat evaluates the presence of each CNV in each cell probabilistically using a Bayesian hierarchical model. c, Numbat then infers a maximum-likelihood phylogeny that captures the evolutionary relationships between single cells.
Reliable classification of tumor and normal cells
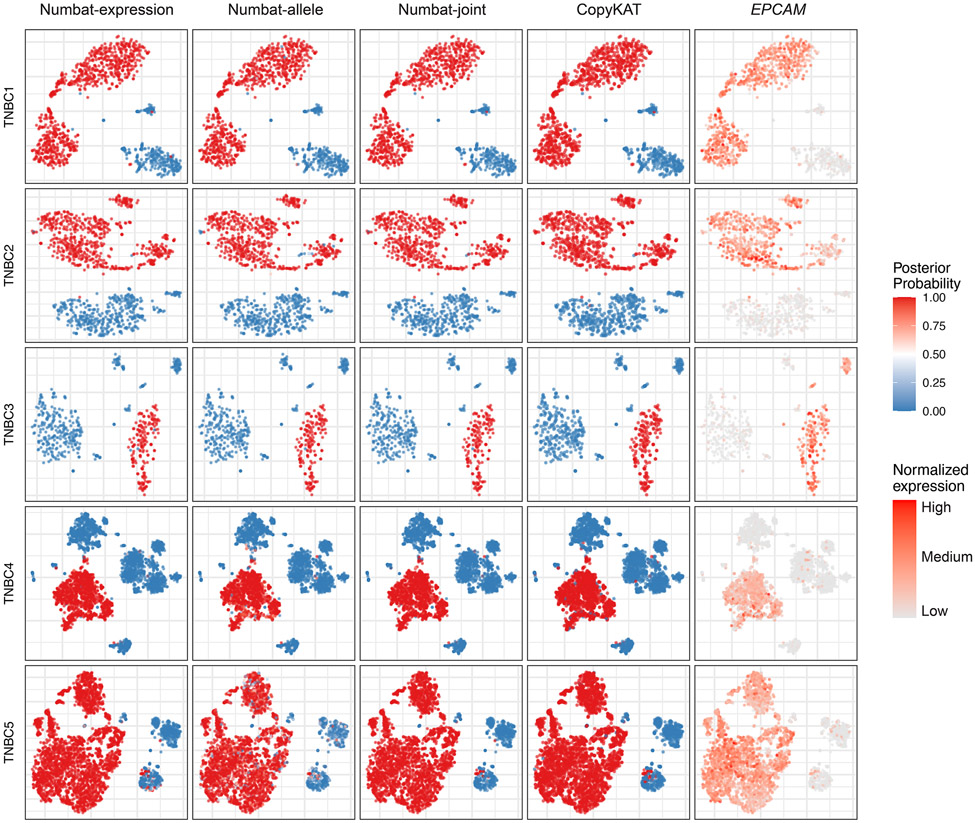
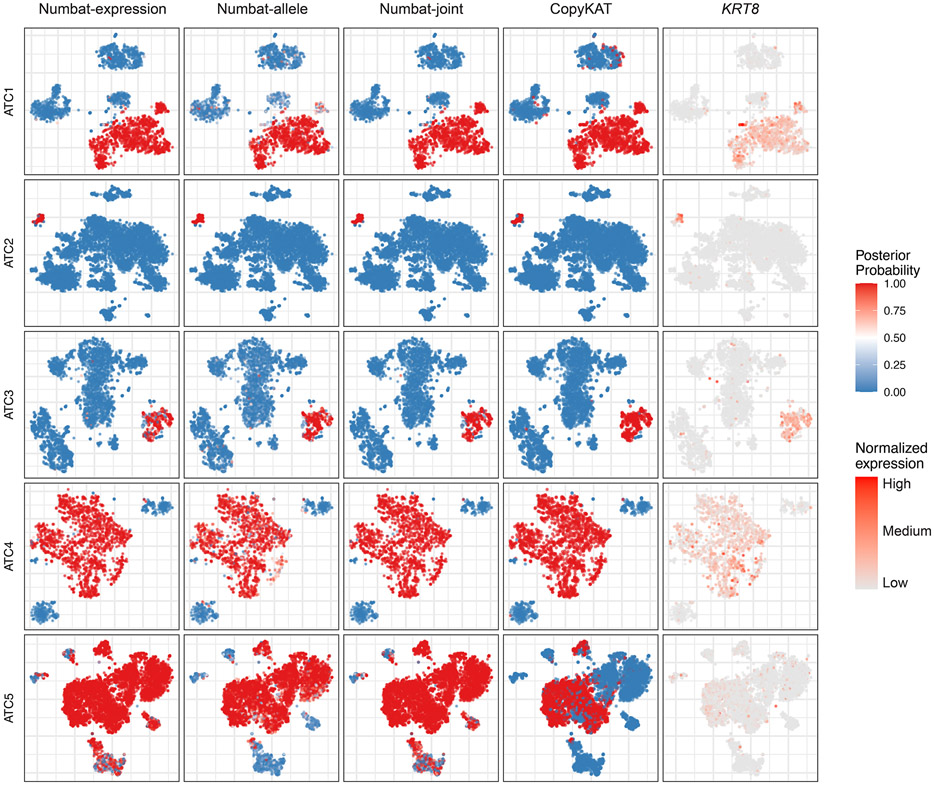
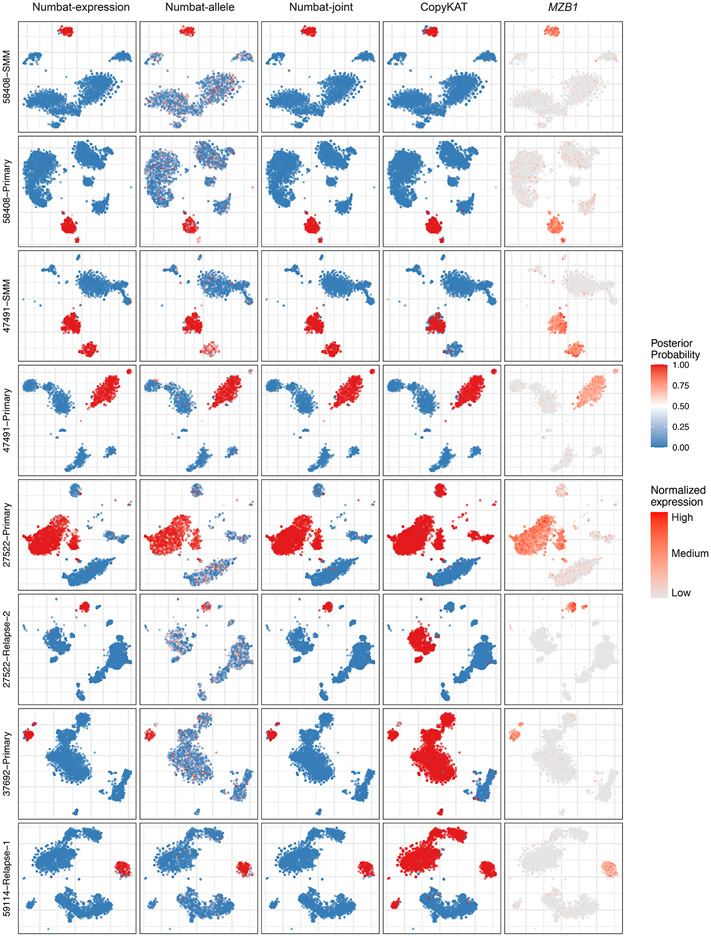
Precisely distinguishing the malignant cells within heterogeneous cell mixtures is a well-established problem3,6. Since the non-malignant cells do not share aberrations with the tumor, the tumor population should be isolated as a distinct clade in the reconstructed phylogeny (Fig. 3c). To systematically benchmark Numbat’s ability to recover this simplest clonal architecture and hence distinguish tumor cells from non-malignant cells in the tumor microenvironment, we analyzed 5 triple-negative breast cancer (TNBC) samples and 5 anaplastic thyroid cancer (ATC) samples in addition to 8 MM samples (Supplementary Table 1). We defined true tumor cell clusters based on the expression of well-established cell type or tumor-specific markers (EPCAM for TNBC27, KRT8 for ATC28, MZB1 for MM) as well as aneuploidy status (Methods). The tumor versus normal cell classification performance of Numbat was similar to that of CopyKAT in the two solid tumor panels and significantly higher in the MM panel (Extended Data Fig. 4). The average classification accuracy for Numbat was 98.4% on TNBC and 98.5% on ATC series, whereas CopyKAT produced an average accuracy of 98.1% on TNBC and 98.5% on ATC series (Extended Data Figs. 5,6). In the MM panel, we found that Numbat maintained a stable performance (98.7%) whereas CopyKAT misclassified clusters of cells in five out of eight samples (Extended Data Fig. 7), resulting in lower accuracy (74.7%). The reduced performance of CopyKAT in the MM series is likely due to the lower sequencing coverage per cell and the less pronounced chromosomal aberrations in those samples. Numbat integrates two orthogonal lines of evidence (expression and allele) for aneuploidy status in each cell, thereby enhancing signal and reducing the possibility of deriving erroneous conclusions from either source of information alone (Extended Data Figs. 5-7).
Haplotype-aware CNV analysis reveals subclonal complexity
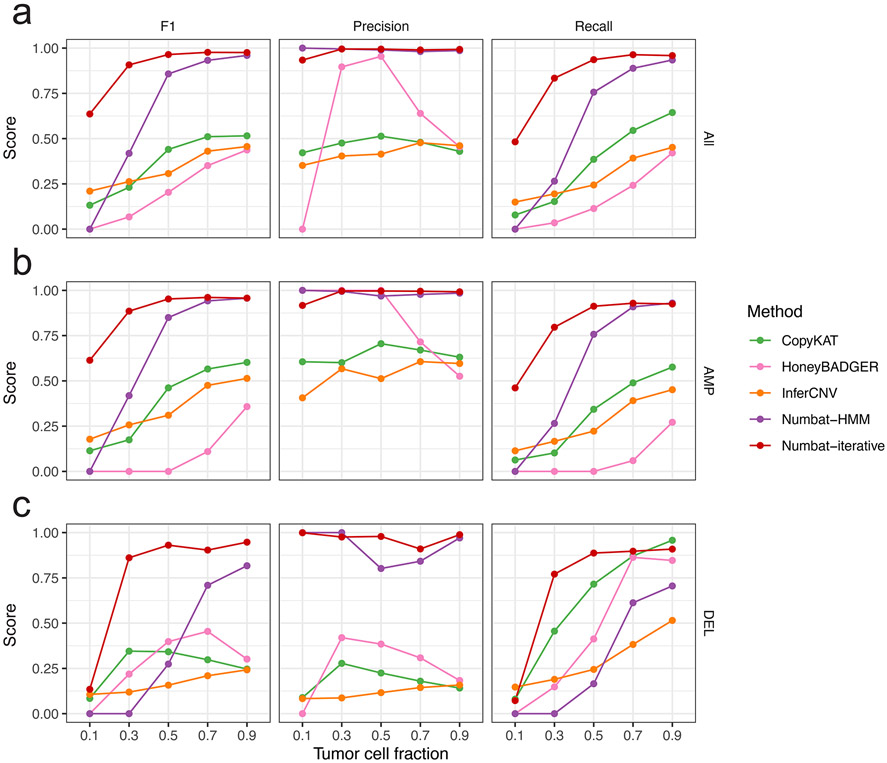
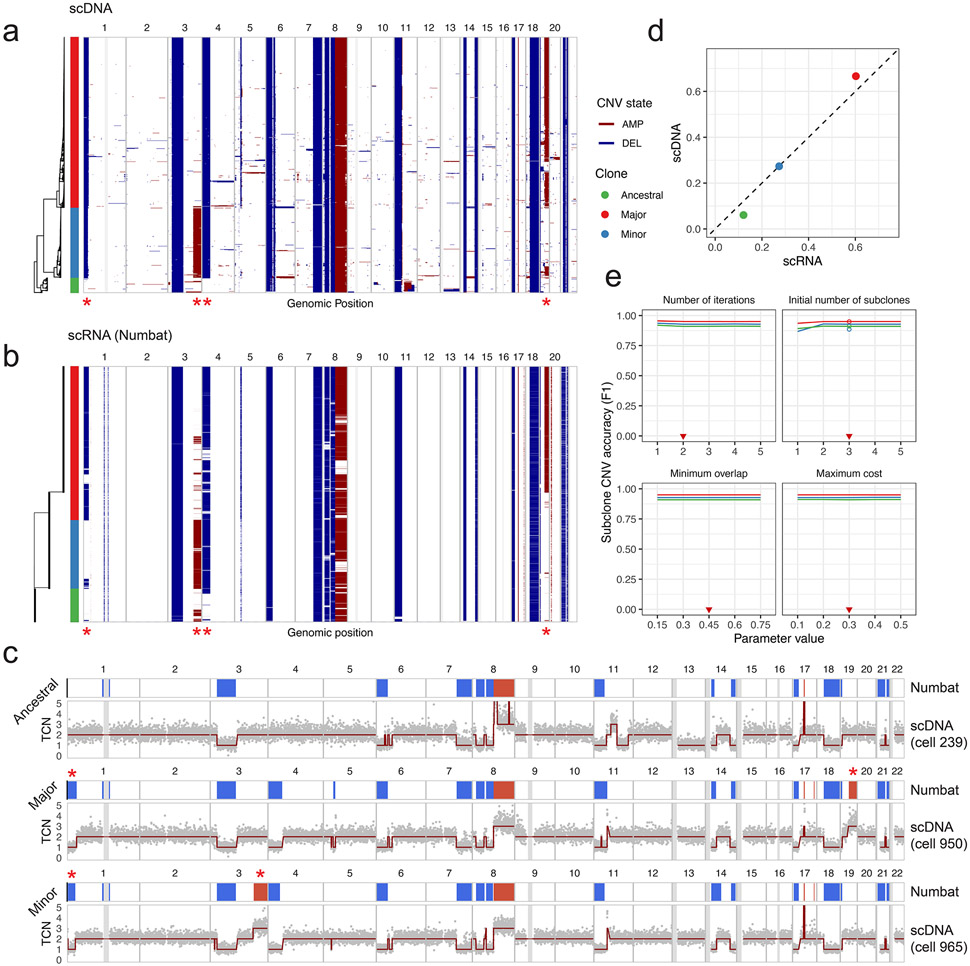
Accurate detection of subclonal CNVs is a key challenge in characterizing tumor heterogeneity, as both allelic and expression signals diminish with decreasing cellular fraction. Numbat’s iterative inference of clonal populations and genomic aberrations should improve subclonal CNV estimation in genetically heterogenous cell populations. To systematically evaluate the extent to which the Numbat iterative strategy provides an advantage for the detection of subclonal CNVs, we applied Numbat to tumor-normal mixtures at various proportions (10-90%) from the five MM samples with matched WGS. We found that the Numbat iterative approach outperformed pseudobulk HMM as well as other methods across different tumor cell fractions, for both amplifications and deletions (Extended Data Fig. 8). To test Numbat’s ability to resolve tumor subclonal structures, we analyzed a gastric cell line sample (NCI-N87) profiled by paired scRNA-seq and scDNA-seq29. From the scRNA-seq data, Numbat closely recapitulated the single-cell CNV landscape and subclonal architecture reconstructed by scDNA-seq (Extended Data Fig. 9). The accuracy of the consensus and subclone-specific CNV calls are robust to parameter variations (Supplementary Fig. 7c and Extended Data Fig. 9e). Similarly, the clonality predictions for most samples show high stability after the second iteration (Supplementary Figs. 11-13). The effect of the iterative update is most pronounced when the starting point is suboptimal (e.g., initializing with one cluster or with random trees; Supplementary Figs. 12b,c and 13b,c).
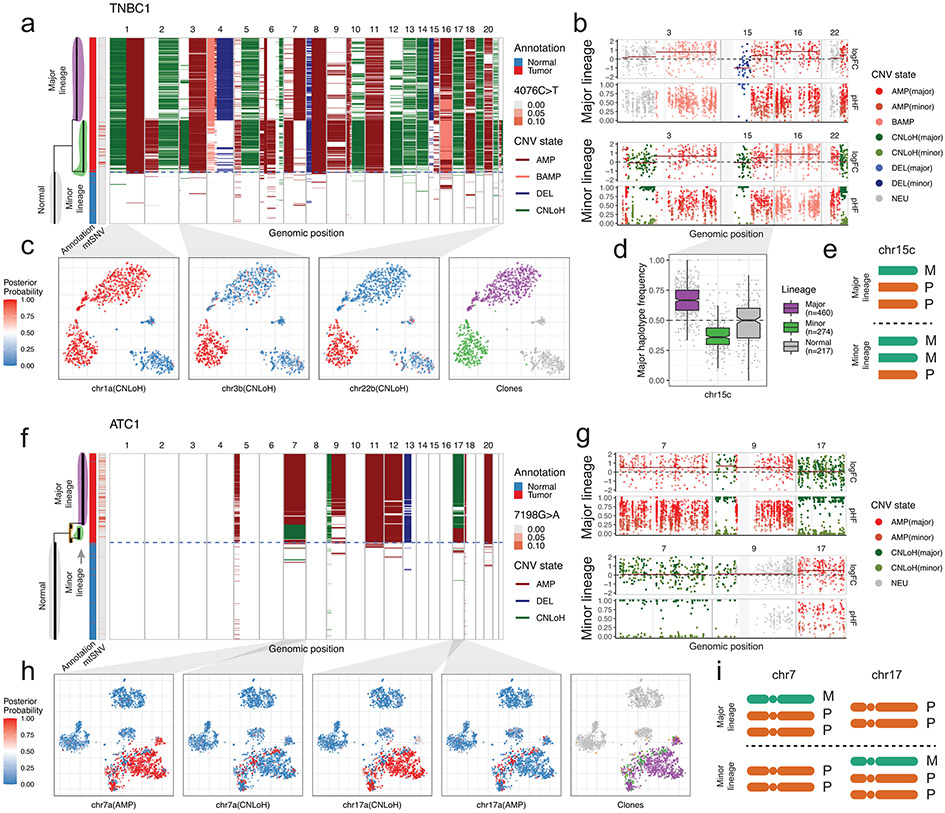
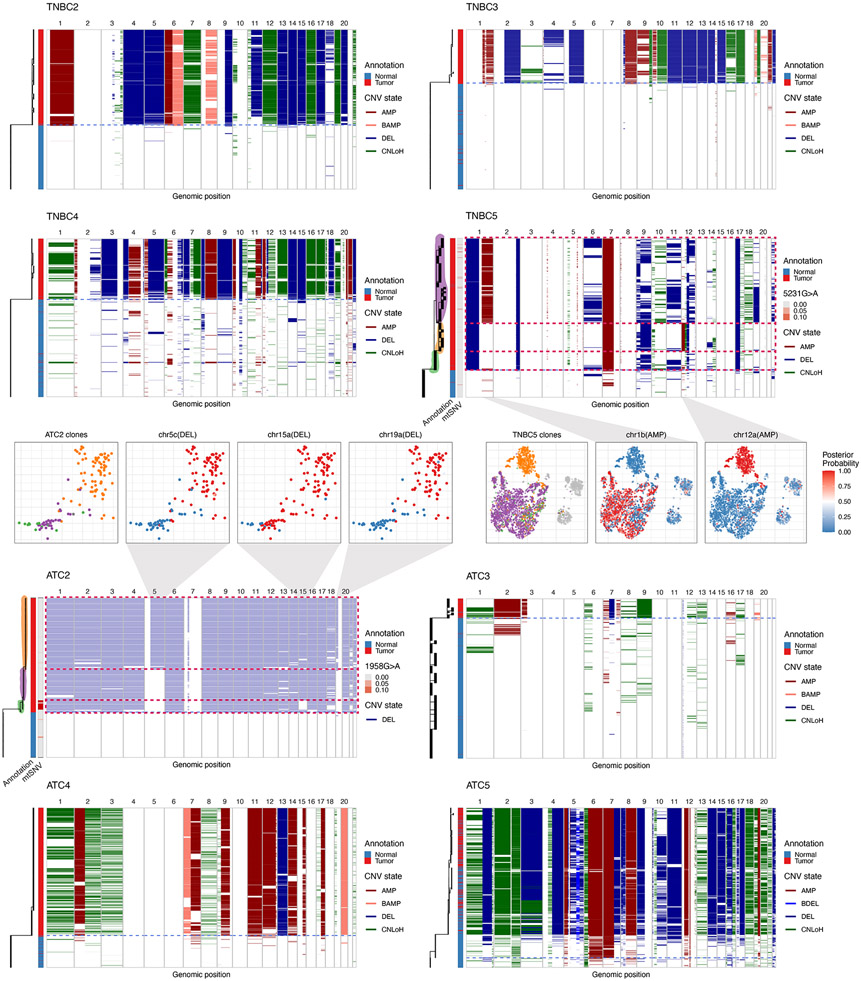
Application of Numbat to TNBC and ATC datasets identified pronounced subclonal structures in four samples (TNBC1, TNBC5, ATC1, ATC2; Fig. 4, Extended Data Fig. 10). In particular, we found that allelic imbalances frequently contributed to the clonal complexity of tumors. For example, in TNBC1, Numbat inferred a branching phylogeny composed of two major subclonal lineages undergoing concurrent evolution (Fig. 4a). The two lineages share early CNLoH events on multiple chromosomes (e.g., chromosomes 1p, 13, 14, 17, and 19; Fig. 4a). Numbat also identified subclonal CNLoH events on chromosomes 3p and 22q that are exclusive to the minor lineage (Fig. 4b,c). Such copy-neutral events do not exhibit deviations in expression magnitude and can only be identified through allele analysis (Supplementary Fig. 14a). In addition, Numbat revealed that the major lineage carries an imbalanced amplification on chr16 whereas the minor lineage carries an allelically-balanced amplification on the same chromosome. Although both lineages carry an amplification on chr15 with similar increase in expression magnitudes (Fig. 4b), their haplotype frequencies appear to be mirrored (Fig. 4d), indicating that different homologous copies of the chromosome were duplicated in the evolutionary history of the two clones (Fig. 4e). Another example of an unusual clonal divergence pattern can be seen in ATC1. While the overall expression profile suggested that ATC1 harbors a relatively simple genome (Supplementary Fig. 14b), Numbat’s analysis revealed two diverging tumor lineages with reciprocal aberrations. While one subclone harbors an amplification on chr7 and a CNLoH on chr17, the other harbors a CNLoH on chr7 and an amplification on chr17 (Fig. 4f-i). Recent studies using scDNA-seq data revealed that such multi-allelic and mirrored CNVs are prevalent sources of tumor heterogeneity30,31. These events, however, have not been previously inferred from scRNA-seq due to limited resolution in allele analysis and the lack of signal in the overall expression profile. These examples illustrate that the integration of phased allele data with expression signals can aid in the detection of subclonal alterations and lineage relationships reflecting dynamic clonal complexity of evolving tumors.
Figure 4: Numbat reveals additional complexity in tumor subclones through allele-specific copy number analysis.
a, Single-cell CNV landscape and reconstructed phylogeny of TNBC1. Branch lengths correspond to the number of CNVs. Blue dashed line separates predicated tumor and normal cells. The first vertical bar on the left shows cell type ground truth. The second vertical bar on the left shows variant allele frequency of a clone-associated mtRNA mutation (4076C>T). b, Pseudobulk CNV profile of the major and minor lineage. Gray vertical bars represent centromeres and gap regions. logFC, log expression fold-change. pHF, paternal haplotype frequency. c, Posterior CNV probability of shared and lineage-sepcific CNVs in a t-SNE embedding of gene expression profiles. d, Major haplotype frequency in single cells. Only cells with at least 5 total allele counts in the region are shown. Center line, median; box limits, upper and lower quartiles; whiskers, 1.5x interquartile range. e, Schematic of copy number state of chr15c in the major and minor lineage. M, maternal. P, paternal. The designation of maternal and paternal chromosomes is arbitrary. f, Single-cell CNV landscape and reconstructed phylogeny of ATC1. g, Pseudobulk CNV profile of the major and minor lineage. h, Posterior CNV probability of subclonal multi-allelic CNVs in a t-SNE embedding of gene expression profiles. i, Schematic of copy number states of chr7 and chr17 in the major (top) and minor (bottom) lineages.
Earlier studies have shown that mitochondrial variants can also be used to detect subclonal populations in single-cell data32,33. We find that the distribution of the detected mitochondrial variants is consistent with the subclonal structure predicted by Numbat in the four samples examined above (Fig. 4a,f; Extended Data Fig. 10; Supplementary Fig. 15). However, due to the sparse coverage of mitochondrial RNA from 3’ scRNA-seq protocols, we detected a low number of mutations (1-9) per sample, which were only able to capture a limited number of subclones.
Interplay between genetic and transcriptional heterogeneity
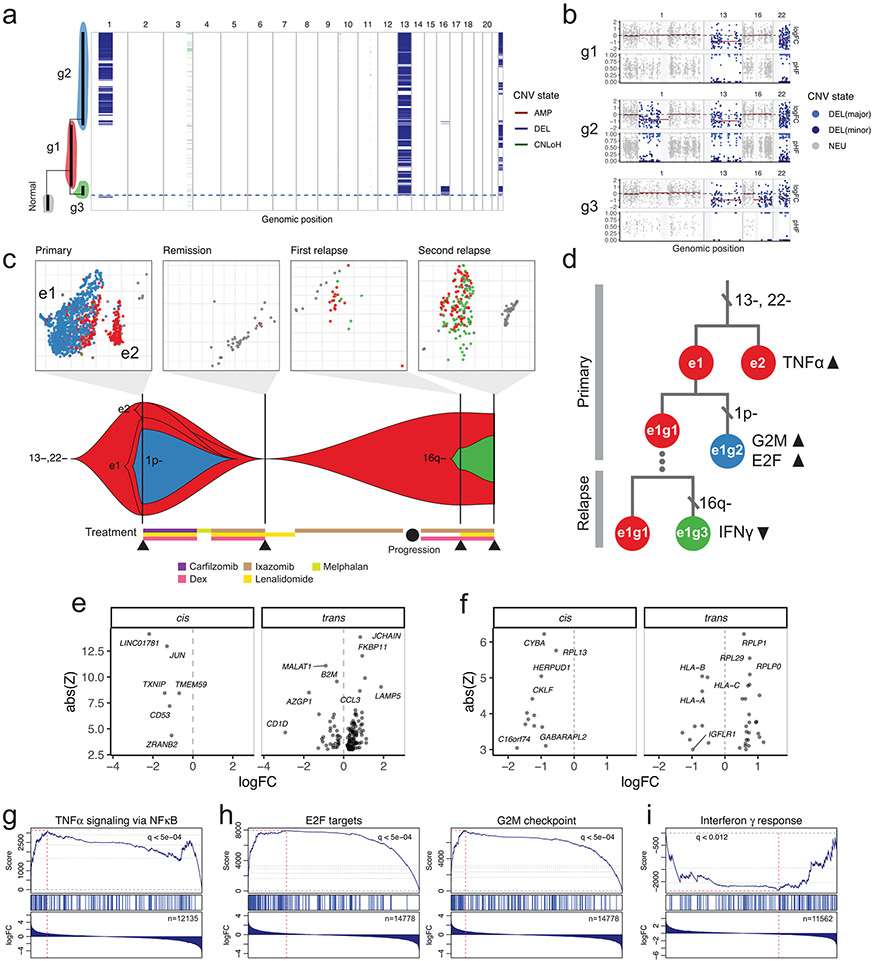
The decomposition of genetic subclones from scRNA-seq provides an opportunity to jointly characterize genetic and transcriptional heterogeneity during the course of tumor evolution. In particular, acquired copy number alterations can be used as natural genetic barcodes in conjunction with characteristic expression signatures to track the behaviors of clonal populations across time. We therefore applied Numbat to investigate the clonal evolutionary history of a therapy-resistant multiple myeloma (Patient 27522) with four sequential samples (primary, remission, first relapse, second relapse). Numbat identified three tumor subclones (g1-g3): one that harbors only ancestral deletions on chromosomes 13 and 22 (g1), one that harbors an additional chr1p deletion (g2), and one that has acquired a chr16q deletion (g3; Fig. 5a-c). Both subclonal alterations are supported by DNA sequencing at the respective timepoints (Supplementary Fig. 16). At primary diagnosis, the tumor was only composed of clones g1 and g2, both of which appeared to be undetectable at the time of remission. However, clone g1 survived the therapy and reappeared at the first relapse. Furthermore, clone g1 also gave rise to clone g3, which continued to expand during subsequent therapy, and became the dominant tumor subclone at the second relapse (Fig. 5c).
Figure 5: Tracking clonal evolution of a therapy-resistant multiple myeloma using Numbat.
a, Integrated single-cell CNV landscape and phylogeny of plasma cells from all four samples. b, Pseudobulk CNV profile of three main tumor subclones. Gray vertical bars represent centromeres and gap regions. c, Clonal evolutionary history integrating genetic and transcriptional alterations. Top, t-SNE embedding of gene expression profiles colored by genetic clones. The embeddings are created separately for each sample. Only cells with >90% posterior classification confidence are shown. Bottom, change in tumor clonal composition over time. At each time point, only clones with more than 5% cellular fraction are shown. d, Genetic and transcriptional alterations in the proposed evolutionary history. e, Differentially expressed genes between e1g2 (observation) and e1g1 (reference) cells. f, Differentially expressed genes between e1g3 (observation) and e1g1 (reference) cells. g, GSEA plot of the TNFα signaling pathway in e2g1 relative to e1g1 cells. h, GSEA plots of the E2F target and G2M checkpoint pathways in e1g2 relative to e1g1 cells. i, GSEA plot of the IFNγ pathway in e1g3 relative to e1g1 cells.
The tumor cells in the primary sample separate into two distinct expression-based clusters (e1 and e2; Fig. 5c). While the ancestral clone g1 is found in both e1 and e2, the derived subclone g2 appears to be restricted to cluster e1. This suggests that a large-scale shift in the transcriptional landscape gave rise to the two distinct tumor subpopulations (e1 and e2), which predated the chr1p deletion event within e1 (Fig. 5d). An alternative explanation is that with the acquisition of chr1p deletion, g2 tumor cells lost the ability to enter transcriptional state e1. Integrating both aspects of heterogeneity, we resolved three main subpopulations in the primary sample: cells in expression cluster 1 with wildtype chr1 (e1g1), cells in expression cluster 1 with chr1p deletion (e1g2), and cells in expression cluster 2 (e2g1). Since g1 was the major cell population that re-emerged after remission, we asked whether it was derived from e1g1 or e2g1 cells in the primary sample. The g1 cells in the relapse sample carried the expression signatures of e1, as evidenced by the shared differentially expressed genes (Supplementary Fig. 17), indicating that the relapsed tumor likely originated from e1g1 cells in the primary sample (Fig. 5d).
We next investigated the transcriptional differences between tumor subpopulations using differential expression and pathway enrichment analysis, separating likely cis (i.e., genes residing within the CNV region) and trans (i.e., genes residing outside of the CNV region) effects. Comparing e1 and e2 cells with the same copy number background (e2g1 vs e1g1) in the primary tumor, we found that e2 cells have higher activation of the tumor necrosis factor α (TNFα) signaling pathway (Fig. 5g, Supplementary Table 2). It has been shown that TNFα triggers the release of IL-6, a myeloma growth factor, by activating nuclear factor kappa B (NFκB)34. Comparing e1 cells with and without the chr1p deletion (e1g1 vs e1g2), we found that cells with chr1p deletion have higher activation of pathways associated with cell cycle (G2M checkpoint and E2F targets), indicating a hyper-proliferative phenotype (Fig. 5h, Supplementary Table 2). Differential gene expression analysis between e1g1 and e1g2 cells revealed 6 significantly differentially expressed genes in cis of the chr1p deletion event and 141 genes in trans (Fig. 5e). All 5 DE genes in cis of the deletion are significantly down-regulated. The genes involved in the enriched pathways do not overlap significantly with the deleted region (P=0.23, E2F targets; P=0.54, G2M checkpoint; two-sided binomial test), indicating that those transcriptional changes may be driven by processes other than the CNVs we have detected. The two genetic subclones in the second relapse sample (g1 and g3) do not separate into distinct expression clusters (Fig. 5c). Direct comparison of their expression patterns, however, revealed 12 significantly differentially expressed genes in cis and 34 in trans of the deletion (Fig. 5f), and showed that the cells carrying chr16q deletion have significantly downregulated interferon gamma (IFNγ) response pathway (Fig. 5i, Supplementary Table 2). Similar to the previous case, the genes involved in the enriched pathways do not overlap significantly with the deleted region (P=0.83, two-sided binomial test). IFNγ signaling plays an important role in tumor cell clearance by immune surveillance, and its dysregulation is associated with immune evasion and poor response to immunotherapy35. This is consistent with the more aggressive phenotype of clone g3, which achieved clonal dominance after several rounds of therapy (Fig. 5c).
Discussion
Tumor plasticity and the resulting therapy resistance can be driven by both genetic and non-genetic mechanisms, such as large-scale chromatin remodeling or aberrant activation of transcriptional programs1,36. The interplay between genetic and non-genetic mechanisms and their relative importance remains poorly understood. Methods that can reliably infer genetic alterations from a cell’s transcriptome have the potential to illuminate these effects by characterizing both aspects of intratumoral heterogeneity at single-cell resolution.
Compared to DNA-based approaches, scRNA-seq provides limited coverage of alleles and suffers from transcriptional noise. Numbat attempts to address these challenges by incorporating prior haplotype information obtained from population-based phasing. We show that prior phasing information can be integrated with allele and expression signals in a Hidden Markov model to enhance detection of subclonal copy number alterations from scRNA-seq data. The increasing availability of population-scale genetic data encompassing diverse ancestries should improve the power of this approach to patient samples from different genetic backgrounds8,15,16. The sensitivity of the Numbat haplotype-aware HMM can be further improved by more accurate haplotype information from other techniques, such as long-range haplotype phasing that takes advantage of individual relatedness37 or experimental approaches that resolve haplotypes38.
Reconstructing the single-cell copy number profile from heterogenous cell populations requires the inference of clonal populations and genomic aberrations at the same time. Numbat solves this problem by iteratively inferring the tumor phylogeny using detected aberrations and refining single-cell copy number estimates by exploiting the structure of the tumor phylogeny. Application to three tumor series (ATC, TNBC, MM) showed that Numbat precisely distinguished normal and malignant cells (marked by aneuploidy) in the tumor microenvironment and revealed additional subclonality within the tumor population. However, Numbat shares a common limitation with the existing methods in that determining the number of confident subclones still relies on manual inspection of the tumor phylogeny and copy number profile2-5.
Tumor baseline ploidy estimation is a challenging problem in copy number analysis22,39. Existing methods infer copy number variations relative to the median ploidy, which can be confounded by hyperdiploidy or hypodiploidy22. Numbat attempts to address this problem by adopting a strategy previously developed for DNA analysis22,40. This approach was effective, correctly identifying diploid regions in 5 tumor samples with WGS validation. However, challenges remain in tumors with genome-wide abberations (e.g., TNBC1) or tumors that have undergone whole-genome duplication, in which cases manual curation is still necessary. Further improvements will be needed to robustly determine copy number baseline in tumors with complex copy number profiles.
Allele-specific CNV analysis has shown major advantages over total copy number analysis in studies of cancer genomes30,31,41. Although variations in chromosomal dosage are often discernable from large-scale gene expression changes, CNLoH events and haplotype-specific alterations can only be detected using allele information. Numbat analysis of previously published tumor samples revealed additional subclonal complexity resulting from haplotype-specific alterations, highlighting the importance of allele-specific copy number analysis. Finally, to demonstrate the type of integrative analysis enabled by Numbat, we used it to characterize the genetic and transcriptional subpopulations in a serial multiple myeloma sample. Comparing the gene expression patterns of tumor subclones revealed that many of the transcriptional changes relevant to cancer progression and therapy resistance ocurr in trans and are not direct consequences of the aberrations. A variety of mechanisms, including other genetic mutations, epigenetic or regulatory changes may mediate these effects. Dissecting their contribution to the expression state and the overall phenotype of the cells remains a challenge. Among other advances, improved methods integrating genetic and epigenetic information will be needed to fully resolve the impact of genome instability on tumor cell states30.
Methods
Pre-processing of scRNA-seq data.
We used the Cell Ranger (v6.0.2, 10x Genomics) software suite to process the raw FASTQ or BAM files obtained from the previously published studies. We only included cell barcodes present in the gene expression count matrices or cell type annotation provided with the original publication. We used conos42 (v1.4.1) to perform multi-sample integration, clustering, and generation of graph embeddings.
Genotyping and phasing from scRNA-seq data.
To identify heterozygous and homozygous germline SNPs, we used cellsnp-lite43 (v1.2.2) to generate allele counts for a panel of known common SNPs (population allele frequency > 5%). SNPs with variant allele frequency (aggregating all cells) between 0.1 and 0.9 were identified as heterozygous. SNPs with ≥ 10 reads covering the alternate allele with VAF = 1 were identified as homozygous. We then use Eagle2 (v2.4.1) to phase the identified heterozygous SNPs using the 1000 Genomes and TOPMed reference panels.
Co-expression based phasing.
To perform phasing using single-cell expression data, we used the previously published scphaser package, which phases heterozygous alleles based on their co-expression patterns17. We ran scphaser with minimum number of reads of 1 (min_acount = 1) and a fold-change cutoff of 3 (fc = 3) for genotyping and then phased the alleles using the exhaustive search mode (method = “exhaust”), with allele counts as input (input = “ac”) and no weighting based on allele counts (weigh = FALSE).
Statistical modeling of expression and allele data.
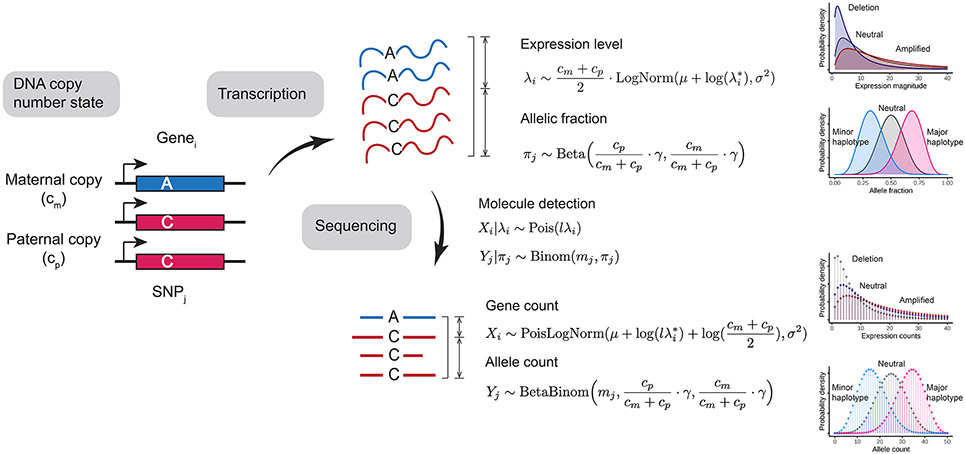
We formulate a generative model for the observed UMI counts per gene and the observed allele counts per SNP site (Extended Data Fig. 2). This model generalizes to both pseudobulk and single-cell setting. We aim to infer the DNA state for each marker, denoted as where is the number of maternal copies and is the number of paternal copies. Note that in single cells, and can take any non-negative integer value. For example, in diploid regions, whereas in a heterozygous loss of the maternal chromosome, . Since a pseudobulk can contain a mixture of cells in diploid state and cells in altered state, and can take any continuous value in the non-negative domain. For convenience, we reparameterize as the change in total chromosome dosage relative to the diploid state and haplotype fraction () as follows:
which are the targets of inference. Note that in single cells, and take on discrete values. In pseudobulks, and , which depend both on the mixture proportion and the underlying genotype (Supplementary Fig. 6).
We observe two types of markers: expression counts per gene and allele counts per SNP. Gene expression counts are only emitted once per gene whereas allele counts are emitted at each SNP. Let be the total number of genes measured in the transcriptome. For gene , we denote the gene expression count as , which we model using a Poisson-Lognormal (PLN) distribution:
| (1) |
Here is the total library size and is the baseline expression magnitude for gene in the reference profile. Shared between all genes, and are hyperparameters representing the bias and variance in the log expression fold-change between the observation and reference profile. The hyperparameters and are unknown a priori and need to empirically estimated for each cell or pseudobulk with respect to a specific reference profile. Restricting to genes in diploid regions, the maximum likelihood estimates of and are:
| (2) |
These baseline parameters are then used to configure the emission probabilities for CNV detection.
For allele data, we use to denote the observed variant allele count of the SNP, and to denote the total allele count (sum of reference allele count and variant allele count). Once the variant alleles are phased, is the paternal allele count. We model paternal allele count for SNP using a Beta-Binomial distribution:
| (3) |
where is a hyperparameter that represents the inverse overdispersion in allele counts.
Phase switch probabilities.
We model the occurrence of phase switch errors from population-based haplotype phasing along the genome using a Poisson process with a uniform rate . Between two adjacent SNPs with genetic distance (in centimorgan) , the number of phase switches can be modeled by a Poisson distribution:
The probability of two SNPs being discordant in phase is therefore a function of genetic distance:
| (4) |
In practice, we fix to predict phase switch probabilities based on genetic distance.
Haplotype-aware Hidden Markov model.
We designed an HMM that integrates expression deviation and haplotype imbalance signals to detect CNVs in cell population pseudobulk profiles. Depending on the copy number configuration, cellular fraction, and haplotype state (major or minor), each aberrant copy number state can exhibit a continuum of expression fold-changes and haplotype fractions (dashed lines in Supplementary Fig. 6). We therefore define a set of discrete hidden states to capture the joint behavior of across the continuous space of CNV signals (black dots in Supplementary Fig. 6). Each of the 15 states emits a gene read count and a paternal allele count according to the probability mass functions specified by Equations (1) and (3) with the associated state parameters . That is,
The transition probabilities are specified by and , where is the transition probability between copy number states, and is the transition probability between haplotype states (i.e., phase switch probability between major and minor haplotypes; Extended Data Fig. 1). is homogeneous in the Markov chain whereas is site-specific. To reflect LD decay, we model as a monotonically increasing function of genetic distance from the previous SNP according to equation (4). The full transition matrix of the joint HMM can be found in Supplementary Table 3.
To infer the hidden copy number states, we use the Viterbi algorithm to identify the most probable copy number states for each marker position. Since contiguous genomic segments can occupy distinct copy number states, which cannot be captured by a single set of and , we use one set of minimum-threshold parameters ( and ) to initially identify all detectable CNVs with various deviation magnitudes. Intuitively, lower threshold choices favor detection of more subclonal events. By default, we fix and . To avoid over-segmentation caused by large local deviations, we re-join any segments containing fewer than 10 genes with adjacent segments to obtain the final segmentation. The true underlying dosage ratio and haplotype frequency are event-specific and are estimated separately for each CNV segment by maximizing the total model likelihood. Finally, we obtain the haplotype classification of major/minor alleles based on the posterior marginal probability at each SNP, computed from the forward-backward algorithm using the maximum likelihood estimates of (, ).
Testing for multi-allelic CNVs.
A CNV is determined as multi-allelic if it is confidently (alpha level of 10−4) assigned to distinct CNV types in different subclone pseudobulk profiles.
Single-cell CNV evaluation.
We make inferences on the underlying genotype of individual cells jointly using the observed expression and allele counts. First, using the diploid regions identified in pseudobulk analysis, we estimate the cell-specific expression fold-change bias and variance ( and ) by maximum likelihood according to equation (2). In cases where diploid regions contain less than 5% of the genes, we include genes in CNLoH regions to estimate and . In a given genomic region of a given cell, the posterior probability of each genotype is obtained by
where the likelihood functions are defined according to the generative model described before. The posterior alteration type probabilities from the pseudobulk analysis are propagated as single-cell genotype priors. We note that represents phased allele counts using posterior haplotypes obtained from the HMM, which takes into account both prior phasing information and observed allele frequencies of each SNP. The posterior haplotype should span the entire CNV event and allow allele counts to be aggregated across the whole region. Since the effect of allele-specific expression is minimal when aggregating across large number of genes, we simply use a Binomial likelihood for the allele counts (i.e., in the Beta-Binomial model). Although the maternal and paternal copy number can take any non-negative integer value in single cells, in practice we only consider seven possible genotypes: .
CNV filtering.
To reduce the number of false positive CNV calls, we filter the events called from the Numbat joint HMM based on statistical evidence. We define the log likelihood ratio (LLR) of a CNV event in a pseudobulk profile as
We define the entropy of the posterior distribution of a CNV event in single cells as
which captures the degree of uncertainty in the inference.
Maximum-likelihood phylogeny inference using uncertain genotypes.
We implement a modified version of a recently described approach (ScisTree26) to infer a maximum-likelihood perfect phylogeny based on uncertain genotypes. Using the cell by CNV genotype probabilities obtained before, we compute a distance matrix between cells using the Euclidean distance measure. We then construct two candidate trees using the Neighbour-joining and UPGMA algorithms. The candidate tree with the highest genotype likelihood (as defined in 26) is used as the initial tree. We then search for an optimal tree topology that maximizes the genotype likelihood using the nearest neighbor interchange (NNI) algorithm.
Posterior assignment of cells to copy number profiles and clades.
Given genomic segments, we denote copy number profile by . We can obtain the posterior probability that a given cell harbors copy number profile by
For example, the posterior probability that a cell is diploid in every region is , where . The posterior probability that a cell belongs to a specific clade (in particular, the tumor lineage) in the phylogeny is then equal to the sum of the probabilities that the cell harbors each of the possible genotypes included in the clade.
WGS copy number analysis.
We used hmftools44 to perform unmatched CNV analysis of the WGS data from the MM dataset. The COLBALT (v1.11) and AMBER (v3.5) modules were used to obtain the log read depth ratios (logR) and the BAF profiles, respectively. The PURPLE (v3.2) module was used to determine total copy number, tumor ploidy and purity. We performed re-segmentation of the logR data using the pcf function of copynumber R package45 (v1.32.0), with a gamma parameter of 12000. Significantly altered segments were determined by a threshold of logR > 0.25, logR < −0.25, and BAF > 0.75 for amplifications, deletions, and CNLoH, respectively.
Single-cell DNA-seq copy number analysis.
We used CopyKit (v0.1.1; https://github.com/navinlabcode/copykit) to perform preprocessing, quality control, and analysis of scDNA-seq data. For each cell, read coverage is collected for variable-length genomic bins with a resolution of 220kb46. The segmentation was performed using the CBS algorithm (alpha = 1e-9), and integer copy number calls were derived using a ploidy of 1.94 as reported by the original publication29. Using the integer copy number calls, we performed hierarchical clustering using Manhattan distance and Ward2 linkage. A normal cell with diploid genome was added as an outgroup to root the tree.
Benchmarking the effect of population-based phasing on the detection of allelic imbalance.
Using the cell annotations of TNBC4 from the original paper, we created subsampled datasets (total of 500 cells) composed of different tumor cell fractions. We defined chromosome arms with complete LoH using allele frequencies in the all-tumor pseudobulk (MAF > 0.95; Supplementary Fig. 3). Using this setup, we performed three sets of benchmarking experiments. First, to benchmark the effect of prior phasing on the detection of subclonal allelic imbalance from heterogenous cell populations, we randomly sampled genomic segments with a fixed length (10Mb) from known aberrant regions for each mixture proportion. We additionally sampled segments from the all-normal pseudobulks to serve as true negative examples. We then scored the allele profile of each sampled segment using the haplotype-naïve HMM and the haplotype-aware HMM. Using these scores, we calculated an AUC for each tumor-normal mixture proportion. Second, to benchmark the effect of prior phasing on allele classification (major vs minor haplotype) from mixture pseudobulks, we defined ground truth haplotypes in known LoH regions using the observed BAFs in the all-tumor pseudobulk (BAF < 0.5, minor; BAF ≥ 0.5, major). We classified the alleles using the haplotype-naïve HMM and the haplotype-aware HMM for each cell mixture. We then calculated the proportions of alleles correctly classified as a measure of model performance. Third, to benchmark the effect of prior phasing on single-cell event detection, we split the cells into training (70%) and testing sets (30%). We classified the alleles using the two models in known aberrant regions with pseudobulk profiles created using cells from the training set, and then used the obtained haplotypes to calculate CNV probabilities in single cells from the test set. The existing tumor versus normal annotations were used as ground truth labels for each cell and each event. We calculated an overall AUC (aggregating across events) for each tumor-normal mixture fraction. The pseudobulk and single-cell CNV detection benchmarks were also performed on the multiple myeloma dataset, where LoH and amplification events were defined using the matched WGS for each sample.
Benchmarking CNV detection accuracy.
We evaluated the overall copy number profile reconstruction quality by Numbat and three other methods (CopyKAT v1.0.8, InferCNV v1.8.1, HoneyBADGER v0.1) using 5 MM samples (from distinct patients) with sample-matched flow-sorted WGS. Since Numbat, HoneyBADGER, and InferCNV identify CNVs from pseudobulks, we supplied the pseudobulk profile made from all tumor cells. For CopyKAT, we summarized the consensus tumor copy number profile by averaging the copy number intensities for each genomic bin across all tumor cells. Since CopyKAT does not explicitly call copy number events, we applied a threshold of +0.03 and −0.03 to identify amplified and deleted segments. For HoneyBADGER, we used a minimum deviance threshold of 0.1 for expression HMM and included all heterozygous SNPs as input to the allele HMM. We took the union of events identified by the allele and expression approach. For InferCNV, we used the recommended parameters for 10x (denoise = TRUE, cutoff = 0.1) and performed CNV calling using the “consensus” i6 HMM mode. All other parameters are kept as the default setting otherwise and the HCA lung collection was used as diploid reference47. When cell-type-specific references could not be provided as input, we supplied the averaged expression profile. To evaluate CNV detection performance, we computed precision and recall based on the extent of overlap between the predicted aberrant regions and the true aberrant regions defined by WGS. All types of events were considered (amplifications, deletions, CNLoH). To benchmark single-cell CNV testing accuracy, we first defined the boundaries and alteration types of individual CNV events from the DNA profile for each sample. We did not include regions that appear to be affected by complex events (e.g., chr14 of 58408-Primary; Extended Data Fig. 3) or subclonal events (e.g., chr16q deletion in 27522-Relapse-2; Extended Data Fig. 3) as judged from the DNA profiles. We then computed a score of each event for each individual cell using the four different methods. For Numbat and HoneyBADGER, the event posterior probability was used as the score. For InferCNV and CopyKAT, we defined the score as the average smoothed expression intensity in the region affected by the event. Scores of CNLoH events is set to 0 for all allele-agnostic approaches. As an approximation of the single-cell genotype ground truth, we assumed that the CNV events are present in all tumor cells and absent in all normal cells. For each event, we calculated an AUC based on the single-cell event scores from each method.
Benchmarking tumor versus normal cell classification accuracy.
We identified true tumor cells in the three datasets based on combined evidence of expression-based clustering, cell type or tumor-specific marker expression, and aneuploidy evidence. For the ATC and TNBC series, the tumor versus normal cell labels from the original publication were used, and expression of tumor-specific markers (EPCAM for TNBC, KRT8 for ATC) were used as visual reference in Extended Data Figs. 5,6. We excluded ATC5 from the benchmark due to the lack of clear expression of KRT8. For the MM series, we used the cell type annotation from the original study to identify malignant plasma cells and the expression of MZB1 as visual reference in Extended Data Fig. 7. In one of the samples (27522-Relapse-2), both normal and malignant plasma cells are present, and the malignant plasma cell cluster was identified by upregulated FGFR3 expression (due to t(4;14) translocation) as described in the original publication48. To evaluate performance, we calculated classification accuracy based on the ground truth labels and the predictions made by the two methods. For Numbat, cells with aneuploidy probability > 0.5 are designated as tumor and normal otherwise. For CopyKAT, the tumor/normal predictions from the original paper were used for the TNBC and MDA series, and for the MM dataset, predictions were generated by running CopyKAT using the default parameters and the same expression reference supplied to Numbat.
Numbat run parameters.
Numbat was run using the default parameters unless otherwise specified (, ,, transition probability t = 10−5, maximum cost , initial number of clusters , CNV overlap tolerance = 0.45, minimum pseudobulk size of 50 cells, LLR threshold of 5, entropy threshold of 0.5, maximum of 2 iterations). For TNBC1, since shared diploid regions could not be identified, we manually supplied chromosomes 13,14,19 (containing CNLoH) as baseline to Numbat. Since NCI-N87 is a cell line sample and does not contain normal diploid cells, we used the SNP density HMM to detect clonal LOH regions with a transition probability of t = 10−4. For the longitudinal analysis of patient 27522 presented in Fig. 5, we used the normal B cells from the same patient as expression reference. The HCA lung collection was used as the expression reference for all other analyses47.
Gene set enrichment analysis.
We used the LIGER R package (v2.0.1) to perform the gene set enrichment analysis between cell populations. Hallmark gene sets (n=50) were obtained from MSigDB49. Only genes with at least one read count in at least 5 cells were used as input. 10,000 random permutations were used to compute empirical P values. We used the Holm-Bonferroni method to adjust for multiple comparisons within each analysis. Significantly enriched gene sets were filtered by Q value < 0.05 and that the sign of the edge value is consistent with the enrichment direction (i.e., a positive enrichment is consistent with a positive edge value, and a negative enrichment is consistent with a negative edge value).
Differential gene expression analysis.
We used the Mann Whitney U test implemented in pagoda250 (v1.0.9) to identify confident differentially expressed genes between subclones. We used the default parameter settings, with a Z score threshold of 3.
Identification of transcribed mitochondrial mutations.
We applied the MQuad method32 (v0.1.6) to identify mtRNA mutations from scRNA-seq samples. We used the default parameters recommended for 10x data (minDP=5). We filtered the variants by variant allele frequency > 5% in more than 5 tumor cells.
Statistical analyses and visualization.
Custom statistical analyses and visualizations were performed in R (v4.1.2). The fishplot package51 (v0.5.1) was used to visualize tumor clonal structures.
Extended Data
Extended Data Fig. 1. Haplotype-aware Hidden Markov models.
a, Phase switch probability as a function of genetic distance, estimated from alleles phased from LoH regions in TNBC4. Genetic distance is measured in centimorgan (cM). Error bar represents 95% CI derived from a binomial test. The center of the error bar represents the observed fraction of phase switches. b, Schematic of conventional and haplotype-aware allele HMM. , copy number state transition probability. , phase transition probability. c, Schematic of the Numbat joint HMM. Only three copy number states (neutral, deletion, amplification) are included for illustrative purposes.
Extended Data Fig. 2. Probabilistic model of gene expression and allele counts from transcriptome sequencing experiments.
, number of maternal chromosome copies. , number of paternal chromosome copies. , observed gene expression magnitude of gene . , reference gene expression magnitude of gene . and , global bias and variance in gene expression. , fraction of paternal alleles of SNP . , global inverse overdispersion of allele-specific detection. , library size. , total allele count of SNP . , observed molecule counts for gene . , observed paternal allele count for SNP .
Extended Data Fig. 3. WGS validation of Numbat CNV calls from scRNA-seq data.
For each sample, the DNA profile (top) is juxtaposed with the copy number profile inferred by the Numbat joint HMM (bottom). Gray vertical bars represent centromeres and gap regions. logR, log coverage ratio. BAF, B-allele frequency. logFC, log expression fold-change. pHF, paternal haplotype frequency. BAMP, balanced amplification.
Extended Data Fig. 4. Tumor versus normal cell classification accuracy of Numbat joint model, Numbat expression-only model, and CopyKAT.
Each dot represents a distinct sample (TNBC, n = 5; ATC, n = 4; MM, n = 8). Center line, mean. ATC5 was excluded from the benchmark due to lack of clear expression of tumor marker KRT8.
Extended Data Fig. 5. Numbat reliably distinguishes tumor and normal cells (TNBC series).
The aneuploidy probability is shown as a color gradient (red: high, blue: low). For each sample (row), the series of figures (columns) respectively show the aneuploidy probabilities by expression evidence, those by allele evidence, those by combined evidence, CopyKAT prediction (binary 0 or 1), and marker gene expression in a t-SNE embedding of gene expression profiles.
Extended Data Fig. 6. Numbat reliably distinguishes tumor and normal cells (ATC series).
The aneuploidy probability is shown as a color gradient (red: high, blue: low). For each sample (row), the series of figures (columns) respectively show the aneuploidy probabilities by expression evidence, those by allele evidence, those by combined evidence, CopyKAT prediction (binary 0 or 1), and marker gene expression in a t-SNE embedding of gene expression profiles.
Extended Data Fig. 7. Numbat reliably distinguishes tumor and normal cells (MM series).
The aneuploidy probability is shown as a color gradient (red: high, blue: low). For each sample (row), the series of figures (columns) respectively show the aneuploidy probabilities by expression evidence, those by allele evidence, those by combined evidence, CopyKAT prediction (binary 0 or 1), and marker gene expression in a t-SNE embedding of gene expression profiles.
Extended Data Fig. 8. CNV detection performance as a function of tumor cell fraction.
At each tumor cell fraction, tumor cells were subsampled and mixed with randomly sampled normal cells at the corresponding proportion. Precision, recall and F1 scores were calculated based on the detected segments from scRNA-seq data and the ground truth copy number profiles (from WGS) in 5 multiple myeloma samples. For Numbat, two methods are compared: pseudobulk joint HMM (Numbat-HMM) and iterative optimization (Numbat-iterative) with no minimum pseudobulk size limit. a, Performance for all event types (amplification, deletion, and CNLoH). b, Performance for amplifications. c, Performance for deletions.
Extended Data Fig. 9. Numbat analysis of gastric cell line (NCI-N87) scRNA-seq data and validation by scDNA-seq.
a, Single-cell copy number landscape and subclonal structure reconstructed by scDNA-seq data. Gray vertical bars represent gap regions. A rooted hierarchical clustering tree is shown on the left. Three subclones were defined by cutting the tree with k=3. Red asterisks denote salient subclonal events. b, Single-cell CNV landscape and subclonal structure inferred from the paired scRNA-seq data by Numbat. The original prediction was composed of four subclones. The uppermost two clones were merged and denoted as the “major” clone. Red asterisks denote validated subclonal events. c, Subclone-specific copy number profiles. For each subclone, the top track shows CNV calls made by clone-specific Numbat HMM; the bottom track shows DNA copy number profile of a representative cell from that subclone. Gray vertical bars represent gap regions. d, Numbat recapitulates clonal fractions measured by scDNA-seq. e, Stability and accuracy of Numbat CNV calls for each subclone with respect to parameter variations. F1 scores were computed by comparing DNA profiles for each subclone with the best-matching subclone CNV profiles predicted by Numbat. Circles denote F1 score from initialization with a random tree. Red triangles mark default parameter values.
Extended Data Fig. 10. Single-cell copy number profile and phylogeny reconstructed by Numbat (TNBC and ATC).
Branch lengths correspond to the number of CNV events. Blue dashed line separates predicted tumor and normal cells. Confident subclones are highlighted and marked by red dashed rectangles. The vertical bar on the left of each panel shows cell type ground truth. In TNBC5 and ATC2, the second vertical bar on the left of the panel shows variant allele frequency of a clone-associated mtRNA mutation. For ATC2, results from the subsampled dataset (including aneuploid cells and 50 randomly sampled normal cells) are shown. In ATC5, some tumor cells were likely mis-annotated as normal in the original annotation.
Supplementary Material
Acknowledgements
P.V.K., R.S. and T.G. were supported by Synergy grant 85629 (KILL-OR-DIFFERENTIATE) from the European Research Council. P.-R.L. was supported by NIH grant DP2 ES030554, a Burroughs Wellcome Fund Career Award at the Scientific Interfaces, and the Next Generation Fund at the Broad Institute of MIT and Harvard.
Footnotes
Competing interests
P.V.K. is an employee of Altos Labs, and serves on the Scientific Advisory Board to Celsius Therapeutics Inc. and Biomage Inc. The remaining authors declare no competing interests.
Data availability
The scRNA-seq and WGS validation data from the WASHU multiple myeloma study can be accessed through SRA (PRJNA694128). The scRNA-seq data from the MDA CopyKAT study can be accessed through GEO (GSE148673) and SRA (PRJNA625321). The NCI-N87 scDNA-seq and scRNA-seq datasets are available on GEO (GSE142750) and SRA (PRJNA498809). The HCA collection of reference expression profiles can be obtained from Synapse under the ID syn21041850. The 1000 Genomes Project phasing panel can be downloaded from the IGSR FTP site (http://ftp.1000genomes.ebi.ac.uk/vol1/ftp/release). The TOPMed phasing panel can be accessed through the TOPMed Imputation Server (https://imputation.biodatacatalyst.nhlbi.nih.gov/).
Code availability
The Numbat algorithm is available at https://github.com/kharchenkolab/numbat. The analysis scripts and notebooks to reproduce results included in the paper are available at https://github.com/kharchenkolab/NumbatAnalysis.
References
- 1.Mansoori B, Mohammadi A, Davudian S, Shirjang S & Baradaran B The different mechanisms of cancer drug resistance: A brief review. Adv. Pharm. Bull 7, 339–348 (2017). [DOI] [PMC free article] [PubMed] [Google Scholar]
- 2.Fan J. et al. Linking transcriptional and genetic tumor heterogeneity through allele analysis of single-cell RNA-seq data. Genome Res. 28, 1217–1227 (2018). [DOI] [PMC free article] [PubMed] [Google Scholar]
- 3.Gao R. et al. Delineating copy number and clonal substructure in human tumors from single-cell transcriptomes. Nat. Biotechnol 39, 599–608 (2021). [DOI] [PMC free article] [PubMed] [Google Scholar]
- 4.Patel AP et al. Single-cell RNA-seq highlights intratumoral heterogeneity in primary glioblastoma. Science 344, 1396–1401 (2014). [DOI] [PMC free article] [PubMed] [Google Scholar]
- 5.Serin Harmanci A, Harmanci AO & Zhou X CaSpER identifies and visualizes CNV events by integrative analysis of single-cell or bulk RNA-sequencing data. Nat. Commun 11, 89 (2020). [DOI] [PMC free article] [PubMed] [Google Scholar]
- 6.Trinh MK et al. Precise identification of cancer cells from allelic imbalances in single cell transcriptomes. bioRxiv 2021.11.25.469995 (2021) doi: 10.1101/2021.11.25.469995. [DOI] [PMC free article] [PubMed] [Google Scholar]
- 7.Reinius B & Sandberg R Random monoallelic expression of autosomal genes: stochastic transcription and allele-level regulation. Nat. Rev. Genet 16, 653–664 (2015). [DOI] [PubMed] [Google Scholar]
- 8.Loh P-R et al. Reference-based phasing using the Haplotype Reference Consortium panel. Nat. Genet 48, 1443–1448 (2016). [DOI] [PMC free article] [PubMed] [Google Scholar]
- 9.Delaneau O, Zagury J-F, Robinson MR, Marchini JL & Dermitzakis ET Accurate, scalable and integrative haplotype estimation. Nat. Commun 10, 5436 (2019). [DOI] [PMC free article] [PubMed] [Google Scholar]
- 10.Choi Y, Chan AP, Kirkness E, Telenti A & Schork NJ Comparison of phasing strategies for whole human genomes. PLoS Genet. 14, e1007308 (2018). [DOI] [PMC free article] [PubMed] [Google Scholar]
- 11.Loh P-R et al. Insights into clonal haematopoiesis from 8,342 mosaic chromosomal alterations. Nature vol. 559 350–355 (2018). [DOI] [PMC free article] [PubMed] [Google Scholar]
- 12.Hujoel MLA et al. Influences of rare copy number variation on human complex traits. bioRxiv 2021.10.21.465308 (2021) doi: 10.1101/2021.10.21.465308. [DOI] [PMC free article] [PubMed] [Google Scholar]
- 13.Nik-Zainal S. et al. The life history of 21 breast cancers. Cell 149, 994–1007 (2012). [DOI] [PMC free article] [PubMed] [Google Scholar]
- 14.Vattathil S & Scheet P Haplotype-based profiling of subtle allelic imbalance with SNP arrays. Genome Res. 23, 152–158 (2013). [DOI] [PMC free article] [PubMed] [Google Scholar]
- 15.Taliun D. et al. Sequencing of 53,831 diverse genomes from the NHLBI TOPMed Program. Nature 590, 290–299 (2021). [DOI] [PMC free article] [PubMed] [Google Scholar]
- 16.The 1000 Genomes Project Consortium et al. A global reference for human genetic variation. Nature 526, 68–74 (2015). [DOI] [PMC free article] [PubMed] [Google Scholar]
- 17.Edsgärd D, Reinius B & Sandberg R scphaser: haplotype inference using single-cell RNA-seq data. Bioinformatics 32, 3038–3040 (2016). [DOI] [PMC free article] [PubMed] [Google Scholar]
- 18.Larsson AJM et al. Transcriptional bursts explain autosomal random monoallelic expression and affect allelic imbalance. PLoS Comput. Biol 17, e1008772 (2021). [DOI] [PMC free article] [PubMed] [Google Scholar]
- 19.Castel SE et al. A vast resource of allelic expression data spanning human tissues. Genome Biol. 21, 234 (2020). [DOI] [PMC free article] [PubMed] [Google Scholar]
- 20.Ha G. et al. TITAN: inference of copy number architectures in clonal cell populations from tumor whole-genome sequence data. Genome Res. 24, 1881–1893 (2014). [DOI] [PMC free article] [PubMed] [Google Scholar]
- 21.Yau C. OncoSNP-SEQ: a statistical approach for the identification of somatic copy number alterations from next-generation sequencing of cancer genomes. Bioinformatics 29, 2482–2484 (2013). [DOI] [PubMed] [Google Scholar]
- 22.Shen R & Seshan VE FACETS: allele-specific copy number and clonal heterogeneity analysis tool for high-throughput DNA sequencing. Nucleic Acids Res. 44, e131 (2016). [DOI] [PMC free article] [PubMed] [Google Scholar]
- 23.Singer J, Kuipers J, Jahn K & Beerenwinkel N Single-cell mutation identification via phylogenetic inference. Nat. Commun 9, 5144 (2018). [DOI] [PMC free article] [PubMed] [Google Scholar]
- 24.Salehi S. et al. Clonal fitness inferred from time-series modelling of single-cell cancer genomes. Nature (2021) doi: 10.1038/s41586-021-03648-3. [DOI] [PMC free article] [PubMed] [Google Scholar]
- 25.Dorri F. et al. Efficient Bayesian inference of phylogenetic trees from large scale, low-depth genome-wide single-cell data. bioRxiv 2020.05.06.058180 (2020) doi: 10.1101/2020.05.06.058180. [DOI] [Google Scholar]
- 26.Wu Y. Accurate and efficient cell lineage tree inference from noisy single cell data: the maximum likelihood perfect phylogeny approach. Bioinformatics 36, 742–750 (2020). [DOI] [PubMed] [Google Scholar]
- 27.Osta WA et al. EpCAM is overexpressed in breast cancer and is a potential target for breast cancer gene therapy. Cancer Res. 64, 5818–5824 (2004). [DOI] [PubMed] [Google Scholar]
- 28.Guo D. et al. Cytokeratin-8 in anaplastic thyroid carcinoma: More than a simple structural cytoskeletal protein. Int. J. Mol. Sci 19, 577 (2018). [DOI] [PMC free article] [PubMed] [Google Scholar]
- 29.Andor N. et al. Joint single cell DNA-seq and RNA-seq of gastric cancer cell lines reveals rules of in vitro evolution. NAR Genom Bioinform 2, lqaa016 (2020). [DOI] [PMC free article] [PubMed] [Google Scholar]
- 30.Wu C-Y et al. Integrative single-cell analysis of allele-specific copy number alterations and chromatin accessibility in cancer. Nat. Biotechnol 39, 1259–1269 (2021). [DOI] [PMC free article] [PubMed] [Google Scholar]
- 31.Zaccaria S & Raphael BJ Characterizing allele- and haplotype-specific copy numbers in single cells with CHISEL. Nat. Biotechnol 39, 207–214 (2021). [DOI] [PMC free article] [PubMed] [Google Scholar]
- 32.Kwok AWC et al. MQuad enables clonal substructure discovery using single cell mitochondrial variants. Nat. Commun 13, 1205 (2022). [DOI] [PMC free article] [PubMed] [Google Scholar]
- 33.Ludwig LS et al. Lineage tracing in humans enabled by mitochondrial mutations and single-cell genomics. Cell 176, 1325–1339.e22 (2019). [DOI] [PMC free article] [PubMed] [Google Scholar]
- 34.Hideshima T, Chauhan D, Schlossman R, Richardson P & Anderson KC The role of tumor necrosis factor alpha in the pathophysiology of human multiple myeloma: therapeutic applications. Oncogene 20, 4519–4527 (2001). [DOI] [PubMed] [Google Scholar]
- 35.Castro F, Cardoso AP, Gonçalves RM, Serre K & Oliveira MJ Interferon-Gamma at the Crossroads of Tumor Immune Surveillance or Evasion. Front. Immunol 9, 847 (2018). [DOI] [PMC free article] [PubMed] [Google Scholar]
- 36.Alekseyenko AA et al. The oncogenic BRD4-NUT chromatin regulator drives aberrant transcription within large topological domains. Genes Dev. 29, 1507–1523 (2015). [DOI] [PMC free article] [PubMed] [Google Scholar]
- 37.O’Connell J. et al. A general approach for haplotype phasing across the full spectrum of relatedness. PLoS Genet. 10, e1004234 (2014). [DOI] [PMC free article] [PubMed] [Google Scholar]
- 38.Tourdot RW, Brunette GJ, Pinto RA & Zhang C-Z Determination of complete chromosomal haplotypes by bulk DNA sequencing. Genome Biol. 22, 139 (2021). [DOI] [PMC free article] [PubMed] [Google Scholar]
- 39.Oesper L, Mahmoody A & Raphael BJ THetA: inferring intra-tumor heterogeneity from high-throughput DNA sequencing data. Genome Biol. 14, R80 (2013). [DOI] [PMC free article] [PubMed] [Google Scholar]
- 40.Zaccaria S & Raphael BJ Accurate quantification of copy-number aberrations and whole-genome duplications in multi-sample tumor sequencing data. Nat. Commun 11, 4301 (2020). [DOI] [PMC free article] [PubMed] [Google Scholar]
- 41.Van Loo P. et al. Allele-specific copy number analysis of tumors. Proc. Natl. Acad. Sci. U. S. A 107, 16910–16915 (2010). [DOI] [PMC free article] [PubMed] [Google Scholar]
Methods-only References
- 42.Barkas N. et al. Joint analysis of heterogeneous single-cell RNA-seq dataset collections. Nat. Methods 16, 695–698 (2019). [DOI] [PMC free article] [PubMed] [Google Scholar]
- 43.Huang X & Huang Y Cellsnp-lite: an efficient tool for genotyping single cells. Bioinformatics 37, 4569–4571 (2021). [DOI] [PubMed] [Google Scholar]
- 44.Priestley P. et al. Pan-cancer whole-genome analyses of metastatic solid tumours. Nature 575, 210–216 (2019). [DOI] [PMC free article] [PubMed] [Google Scholar]
- 45.Nilsen G. et al. Copynumber: Efficient algorithms for single- and multi-track copy number segmentation. BMC Genomics 13, 591 (2012). [DOI] [PMC free article] [PubMed] [Google Scholar]
- 46.Navin N et al. Tumour evolution inferred by single-cell sequencing. Nature 472, 90–94 (2011). [DOI] [PMC free article] [PubMed] [Google Scholar]
- 47.Travaglini KJ et al. A molecular cell atlas of the human lung from single-cell RNA sequencing. Nature 587, 619–625 (2020). [DOI] [PMC free article] [PubMed] [Google Scholar]
- 48.Liu R. et al. Co-evolution of tumor and immune cells during progression of multiple myeloma. Nat. Commun 12, 2559 (2021). [DOI] [PMC free article] [PubMed] [Google Scholar]
- 49.Subramanian A. et al. Gene set enrichment analysis: a knowledge-based approach for interpreting genome-wide expression profiles. Proc. Natl. Acad. Sci. U. S. A 102, 15545–15550 (2005). [DOI] [PMC free article] [PubMed] [Google Scholar]
- 50.Fan J. et al. Characterizing transcriptional heterogeneity through pathway and gene set overdispersion analysis. Nat. Methods 13, 241–244 (2016). [DOI] [PMC free article] [PubMed] [Google Scholar]
- 51.Miller CA et al. Visualizing tumor evolution with the fishplot package for R. BMC Genomics 17, 880 (2016). [DOI] [PMC free article] [PubMed] [Google Scholar]
Associated Data
This section collects any data citations, data availability statements, or supplementary materials included in this article.
Supplementary Materials
Data Availability Statement
The scRNA-seq and WGS validation data from the WASHU multiple myeloma study can be accessed through SRA (PRJNA694128). The scRNA-seq data from the MDA CopyKAT study can be accessed through GEO (GSE148673) and SRA (PRJNA625321). The NCI-N87 scDNA-seq and scRNA-seq datasets are available on GEO (GSE142750) and SRA (PRJNA498809). The HCA collection of reference expression profiles can be obtained from Synapse under the ID syn21041850. The 1000 Genomes Project phasing panel can be downloaded from the IGSR FTP site (http://ftp.1000genomes.ebi.ac.uk/vol1/ftp/release). The TOPMed phasing panel can be accessed through the TOPMed Imputation Server (https://imputation.biodatacatalyst.nhlbi.nih.gov/).
The Numbat algorithm is available at https://github.com/kharchenkolab/numbat. The analysis scripts and notebooks to reproduce results included in the paper are available at https://github.com/kharchenkolab/NumbatAnalysis.


