

Abstract
Many vertebrate organs form through the sequential and reciprocal exchange of signaling molecules between juxtaposed epithelial and mesenchymal tissues. We undertook a systems biology approach that combined the generation and analysis of large-scale spatiotemporal gene expression data with mouse genetic experiments to gain insight into the mechanisms that control epithelial-mesenchymal signaling interactions in the developing mouse molar tooth. We showed that the shift in instructive signaling potential from dental epithelium to dental mesenchyme was accompanied by temporally coordinated genome-wide changes in gene expression in both compartments. To identify the mechanism responsible, we developed a probabilistic technique that integrates regulatory evidence from gene expression data and from the literature to reconstruct a gene regulatory network for the epithelial and mesenchymal compartments in early tooth development. By integrating these epithelial and mesenchymal gene regulatory networks through the action of diffusible extracellular signaling molecules, we identified a key epithelial-mesenchymal intertissue Wnt-Bmp (bone morphogenetic protein) feedback circuit. We then validated this circuit in vivo with compound genetic mutations in mice that disrupted this circuit. Moreover, mathematical modeling demonstrated that the structure of the circuit accounted for the observed reciprocal signaling dynamics. Thus, we have identified a critical signaling circuit that controls the coordinated genome-wide expression changes and reciprocal signaling molecule dynamics that occur in interacting epithelial and mesenchymal compartments during organogenesis.
INTRODUCTION
Mammalian ectodermal, mesodermal, and endodermal organogenesis results in the formation of diverse structures such as teeth, kidney, and lung, but in each case, it depends on self-regulatory epithelial-mesenchymal interactions (1–8). Classical embryological experiments have demonstrated two key features in the epithelial-mesenchymal interactions that occur during organogenesis. First, diffusible factors help mediate these interactions, as evident from experiments in which organ morphogenesis occurs despite the presence of a membrane filter that separates the epithelial and mesenchymal compartments (1). Second, the so-called inductive signaling interactions that change both the epithelial and the mesenchymal tissue components frequently act reciprocally, such that signals are transmitted back and forth between the two tissues (2, 3). For example, in mammalian tooth development (odontogenesis), the instructive signaling potential resides in the dental epithelium at the initiation stage, but 1 day later, at the early bud stage, it shifts to the dental mesenchyme (9). Furthermore, concomitant with the shift in instructive signaling potential from dental epithelium to mesenchyme, expression of the signaling molecule gene Bmp4 also shifts from dental epithelium to mesenchyme (10). What remains unknown, however, is how the expression and activity of various signaling pathways are integrated between epithelial and mesenchymal compartments to produce the observed pattern of sequential and reciprocal tissue interactions.
To gain more insight into how the epithelial-mesenchymal interactions that underlie organogenesis are regulated, we undertook to study them in a tractable model system, the mouse molar tooth germ. Although later stages of odontogenesis culminate in epithelial differentiation into enamel-secreting ameloblasts and of neural crest–derived mesenchyme into dentin-secreting odontoblasts (7), the epithelial-mesenchymal interactions in early odontogenesis closely resemble those in other organs (11). Mouse odontogenesis commences morphologically at embryonic day 11.5 (E11.5), with a thickening of the single-layered epithelium of the first branchial arch to form the dental lamina. Concomitant with epithelial invagination into the underlying mesenchyme at E12.5, the dental lamina resolves into molar and incisor placodes. At E13.5, the epithelial placodes progress to the bud stage and elicit a condensation of the surrounding mesenchyme. Subsequently, at the E14.5 cap stage, an epithelial signaling center termed the enamel knot forms at the tip of the tooth bud; this specialized nonproliferative structure expresses multiple signaling molecules, including Wnt, Bmp (bone morphogenetic protein), Fgf (fibroblast growth factor), and Hh (hedgehog) family members (12). Once the enamel knot forms, enamel knot–derived molecular signals act upon the surrounding dental epithelial and mesenchymal tissues to direct the subsequent differentiation and shape of tooth formation (12). Thus, in this study, we restricted our focus on the odontogenic signaling dynamics between the E10.0 initiation stage and the E14.5 cap stage, when enamel knot formation occurs.
The early morphological stages of tooth development and their reliance on epithelial-mesenchymal signaling interactions resemble features used by many other organs (11). For example, the canonical Wnt, Bmp, Fgf, and Hh signaling pathways are used reiteratively throughout both odontogenesis and organogenesis (7, 11). Here, we used a systems biology approach to derive a mechanistic understanding of how these signaling pathways are integrated during odontogenesis and to gain a holistic understanding of the gene regulatory network (13) that controls epithelial-mesenchymal interactions. These studies reveal the existence of a uniquely configured Wnt-Bmp feedback circuit that couples the epithelial-mesenchymal interactions in the developing molar tooth.
RESULTS
Genome-wide expression changes in dental epithelium and mesenchyme are concordant during early tooth development
To dissect early tooth development, we first generated a compendium of gene expression profiles from developing molar dental tissues in mouse embryos between E10.0 and E14.5. Three types of microarray profiling experiments were performed with mouse first lower molar tooth epithelium and mesenchyme. We performed microarray profiling of a dynamic time series, spanning 5 days of embryonic odontogenesis (E10.0 to E14.5) at 12- or 24-hour intervals, using epithelial and mesenchymal tissues that were separated by either laser capture microdissection (LCM) (fig. S1) or manual dissection. We also performed microarray profiling of E13.5 LCM-separated epithelial and mesenchymal tissues from wild-type and Pax9- and Msx1-null mutants, in which tooth development arrests at the bud stage. Finally, we performed microarray profiling in perturbation experiments in which E10.0 dental mesenchyme and E13.0 dental epithelium were separately isolated and treated with Wnt, Bmp, Fgf, or Hh agonists. Including replicates, this resulted in 105 gene expression profiles that were then processed to remove batch effect bias (text S1). The normalized profiles (http://compbio.med.harvard.edu/ToothCODE/) exhibited good agreement with the Helsinki BITE-IT database of gene expression patterns for tooth development (http://bite-it.helsinki.fi/; text S2 and table S1).
Principal components analysis revealed that the first two principal components (PC1 and PC2), which together account for more than 50% of the variance, reflected epithelial-mesenchymal tissue type and tooth developmental stage, respectively (Fig. 1A and fig. S2). This analysis also indicated that between E10.0 and E13.5, the dental epithelium and mesenchyme exhibit nearparallel developmental progression along the PC2 axis. To test the importance of this parallel developmental progression, we used the LCM time course data to identify and compare differentially regulated genes in the epithelium and mesenchyme between the E10.0 to E11.5 initiation and the E12.5 to E13.5 bud stages. The joint distribution of differentially regulated genes and nondifferentially regulated genes in the two tissue compartments was significantly nonrandom (P < 10−15, χ2 test), and this effect was due to a high proportion of genes with concordant expression changes between the two tissues (Fig. 1B). We next used a comprehensive gene set compendium (tables S2 and S3) in the same concordance analysis of differentially regulated genes to test whether this degree of concordance was a genome-wide property or due to a selected number of gene sets. Nearly all gene sets with a significant nonrandom joint distribution [false discovery rate (FDR) < 0.05, χ2 test] exhibited concordant changes across epithelial-mesenchymal compartments (fig. S3). Moreover, the concordance was replicated independently in both the LCM and the manual dissection time course data (fig. S3). These results reveal that the global gene expression dynamics in interacting epithelial and mesenchymal tissues are coupled. We hypothesized that the ability of instructive extracellular signaling molecules, independent of their tissue source, to act on both tissue compartments simultaneously could explain the coupling of gene expression changes between dental epithelium and mesenchyme.
Fig. 1.
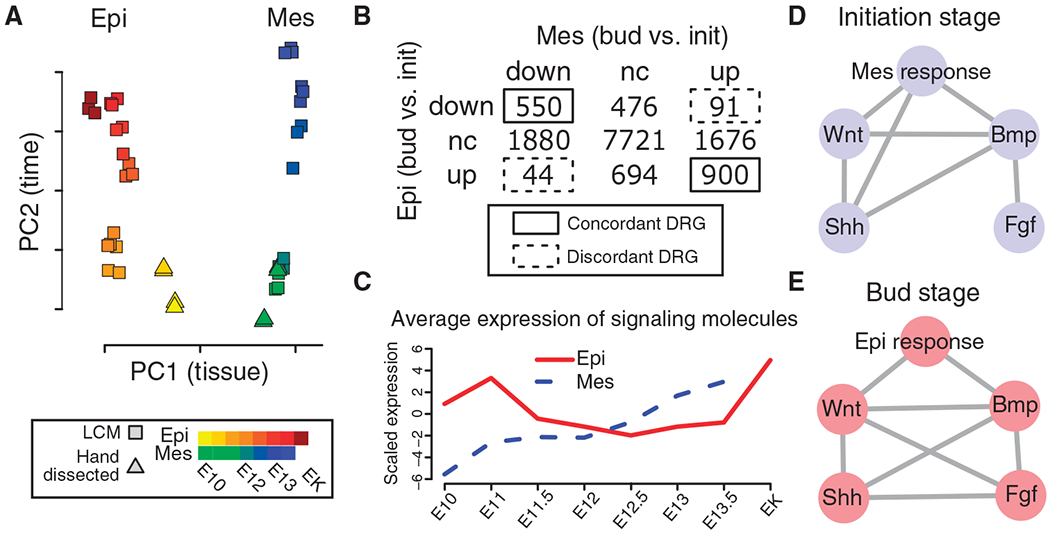
Bioinformatic analyses reveal concordant genome-wide transcriptional dynamics in dental epithelium and mesenchyme and the primacy of Wnt and Bmp signaling. (A) Principal components (PC) analysis of microarray gene expression profiles from LCM and manually dissected first lower molar epithelial (Epi) and mesenchymal (Mes) tissues from the E10.0 (initiation) to E14.5 (enamel knot, EK) stages. n = 2 to 3 biological microarray replicates. (B) Contingency table reveals significant concordance in differentially regulated genes (DRG) between epithelium and mesenchyme. Five hundred fifty and 900 genes were concordantly regulated, compared to 91 and 44 that were discordantly regulated (P < 10−15, χ2 test; concordance score = 0.83). Bud, bud stage; init, initiation stage. (C) Average scaled expression of extracellular signaling molecules, with decreasing epithelial expression and increasing mesenchymal expression between E11.0 and E12.5, which recapitulates the dynamic shift in tooth instructive potential from epithelium to mesenchyme at E12.5 (9). (D and E) Molecular concept maps showing significant overlap (FDR <0.05 and odds ratio >2) between differentially regulated genes caused by endogenous signaling or by addition of Wnt, Bmp, Shh, and Fgf agonists to mesenchyme (initiation stage) or epithelium (bud stage). n = 3 biological microarray replicates.
Wnts and Bmp4 are the key mediators of odontogenic epithelial-mesenchymal interactions
To investigate how sequential reciprocal signaling events could lead to highly concordant gene expression changes in two interacting but fundamentally different tissue types, we first asked three simpler questions: (i) How is signaling pathway activity dynamically regulated, (ii) which primary signaling pathways control dental epithelial-mesenchymal interactions, and (iii) how do these pathways communicate across epithelial and mesenchymal compartments? To understand the signaling pathway dynamics, we compared the expression of signal transduction components in four pathways that are required to reach the E14.5 cap stage of tooth germ development: Bmp, Wnt, Fgf, and Hh (7). Among genes encoding signal transduction components, only those genes encoding extracellular signaling molecules were expressed in a temporal pattern, marked by decreasing epithelial expression and increasing mesenchymal expression between E11.5 and E12.5, which approximates the shift in instructive potential from initiation-stage epithelium to bud-stage mesenchyme (9) (Fig. 1C and figs. S4 to S6). These findings support the view that exposure to diffusible signaling molecules constitutes the primary mediator of sequential and reciprocal epithelial-mesenchymal communication and provides an attractive mechanism for how epithelial-mesenchymal compartments can be simultaneously coupled to yield differentially regulated genes that are concordantly regulated.
To assess the gene expression changes attributable to specific signaling pathway activation, we generated gene expression profiles of isolated dental tissues after 8-hour treatments with Bmp4, glycogen synthase kinase 3β (Gsk3β) inhibitor (14) (to mimic canonical Wnt signaling), Fgf8, or Shh. Concurrently, we generated expression profiles of the corresponding intact tissue to mimic the endogenous signaling response. The isolated and treated E10.0 initiation-stage mesenchyme, E13.5 bud-stage epithelium, and intact tissues were compared to untreated isolated epithelial-mesenchymal tissues to identify differentially regulated genes. Overlapping differentially regulated genes were visualized with molecular concept maps (15). Each node in a molecular concept map represents a differentially regulated gene set, and each edge represents a statistically significant overlap between two gene sets (fig. S7). In both tissue compartments, only Wnt and Bmp signaling, in contrast to Shh or Fgf signaling, had edges that connected to the endogenous mesenchymal and epithelial responses as determined from the intact tissues (Fig. 1, D and E). We independently confirmed these results with mouse mutants that lack the mesenchymal transcription factors Pax9 (16) or Msx1 (17) and exhibit bud-stage arrest. LCM-generated microarray profiles showed that Pax9 and Msx1 downstream targets overlapped significantly not only with each other but also with temporally regulated genes, with endogenous signaling responses, and with Wnt and Bmp4 targets (fig. S8). Although Wnt signaling and Bmp signaling have been previously implicated in odontogenesis (10, 18–31), our comprehensive genome-wide analyses indicate that these two pathways are the primary determinants of odontogenic epithelial-mesenchymal interactions in both tissue compartments.
The intertissue gene regulatory network for early odontogenesis encodes a Wnt-Bmp feedback circuit
We next performed an integrative gene regulatory network reconstruction to identify the mechanistic link between Wnt signaling and Bmp signaling in odontogenic epithelial-mesenchymal interactions. First, we surveyed 18 years of peer-reviewed literature on odontogenesis and manually curated more than 1000 gene expression results from genetic and molecular perturbation experiments, typically involving mouse tooth mutants and dental tissue signaling molecule treatments, respectively. We then integrated these results with the gene expression microarray results from our perturbation experiments involving signaling molecule treatments and Pax9 and Msx1 loss-of-function mouse mutants. In addition, we also incorporated quantitative reverse transcription–polymerase chain reaction (qRT-PCR) and in situ hybridization results from analyses of an epithelial Bmpr1a loss-of-function mouse mutant. We then classified each gene in the perturbation evidence table as either a signaling molecule (for example, Wnt6 for Wnt ligand) or a component of a signaling pathway (for example, Ctnnb1 and Lrp6 for Wnt pathway). Genes not belonging to these categories were excluded. Finally, all mapped perturbation data between signaling molecules and pathways were integrated by means of a novel probabilistic model to infer the most likely mode of causal regulation—activation, inhibition, or no effect—for each edge at each time point (text S3). The independently inferred edges were then connected to form two signaling-based gene regulatory networks, one for E13.5 dental epithelium and one for E13.5 dental mesenchyme (Fig. 2, A and B, and figs. S9 and S10).
Fig. 2.
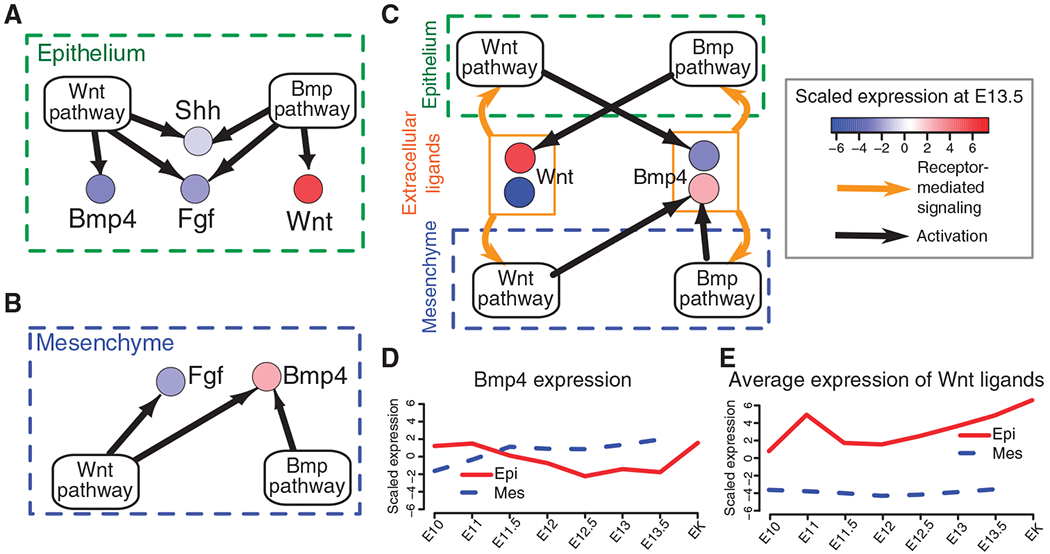
The epithelial-mesenchymal intertissue gene regulatory network for early odontogenesis encodes a Wnt-Bmp feedback circuit. (A and B) Epithelial-mesenchymal gene regulatory networks describing ligand regulation by Wnt and Bmp pathways. Each signaling pathway node (that is, Wnt pathway, Bmp pathway) represents a gene set encoding components of the respective signal transduction pathway; each extracellular signal node (for example, Shh, Bmp4, and so on) represents gene expression for the respective signaling molecule at E13.5. Color represents scaled expression. Evidence for each edge (black arrows) was inferred from a combination of gene expression data (this study) and from genetic evidence from the literature and is available at http://compbio.med.harvard.edu/ToothCODE. (C) Epithelial and mesenchymal gene regulatory networks in (A) and (B) are coupled through the action of Wnt and Bmp4 extracellular signaling molecules to generate a single integrated intertissue gene regulatory network. Other signaling molecules shown in (A) and (B) are omitted for clarity. Nodes for epithelial- and mesenchymal-derived Wnt and Bmp4 are considered functionally equivalent and are indicated by the orange rectangle. Orange arrows represent signal transduction through ligand-receptor interaction. (D and E) Gene expression of Bmp4 and average expression of canonical Wnt genes based on time course microarray data.
The resulting gene regulatory networks reveal that, collectively, the Wnt and Bmp pathways control the production of signaling molecules in other major pathways in early odontogenesis. The Wnt and Bmp pathways can activate the expression of Bmp4, Shh, Fgfs, and Wnts in the epithelium and of Fgfs and Bmp4 in the mesenchyme (Fig. 2, A and B). In addition, signaling molecule expression is tissue-specific. For example, canonical Wnt genes are predominantly expressed in the dental epithelium (32), whereas Bmp4 expression shifts between epithelium and mesenchyme (10). To model the ability of signaling molecules to act on both tissues, we combined the E13.5 bud-stage epithelial gene regulatory network and the mesenchymal gene regulatory network to form one epithelial-mesenchymal intertissue gene regulatory network that is coupled through the activity of canonical Wnts and Bmp4 (Fig. 2C and figs. S9 and S10). This assembly revealed the existence of a Wnt-Bmp intertissue epithelial-mesenchymal feedback circuit within the gene regulatory network (Fig. 2C).
The Wnt-Bmp circuit contains several noteworthy features. First, it is asymmetrically configured, with cross-regulation of canonical Wnt and Bmp4 expression by the complementary signaling pathways in the dental epithelium, and joint regulation by both the Wnt and the Bmp pathways of Bmp4 expression in the dental mesenchyme. Second, there is an absence of regulation by either pathway of mesenchymal Wnt expression. Finally, we posited that signaling molecules positively regulate their respective pathway activity in both epithelium and mesenchyme. We hypothesized that the structure of this circuit could provide insight into the dynamics of epithelial-mesenchymal interactions in early odontogenesis.
The structure of the Wnt-Bmp feedback circuit can account for reciprocal epithelial-mesenchymal signaling interactions
To explore the behavior that can be generated by this integrated feedback circuit, we modeled the signaling and gene expression dynamics with a simple set of ordinary differential equations (text S4). To mimic the observed concordant changes in pathway activity between tissue compartments, our model explicitly assumes that extracellular signaling molecules can act on both the epithelial and the mesenchymal compartments simultaneously, regardless of the tissue source of the signal. The goal of this simulation study was to assess whether our circuit accounts for the following observations concerning odontogenic sequential and reciprocal signaling dynamics (Fig. 2, D and E). First, Bmp4 expression is high in epithelium but low in mesenchyme at the initiation stage (E10.0 to E11.5), whereas the expression pattern reverses at the bud stage (E12.5 to E13.5). Second, Bmp4 expression becomes high again in the enamel knot as well as in the mesenchyme at E14.5. Third, Wnt expression is higher in the epithelium at the bud and cap stages compared to the initiation and placode stages. Fourth, canonical Wnts have not been detected in the mesenchyme at any of these stages.
Without specifying tissue- or pathway-specific rate constants, simulation of this simple ordinary differential equation model that contains activation and degradation terms for each signaling molecule (text S4) shows that the structure of the Wnt-Bmp circuit itself is sufficient to recapitulate key features of the observed sequential and reciprocal epithelial-mesenchymal signaling (Fig. 2, D and E, and text S4). The ordinary differential equation simulation reveals that, although Wnt and Bmp4 signaling molecules can lead to the activation of their respective pathways in both compartments simultaneously, the rate at which the epithelial gene regulatory network (through cross-regulation of Bmp4 and Wnts) and the mesenchymal gene regulatory network (through joint regulation of Bmp4) respond in expressing Bmp4 or Wnts is different, thus accounting for the observed reciprocal pattern of signaling molecule gene expression. Therefore, the reciprocal shift in expression of signaling molecules, typical of most epithelial-mesenchymal interactions, is an inherent property of the Wnt-Bmp feedback circuit itself.
Constitutive activation of epithelial Wnt bypasses mesenchymal Bmp4 expression
To validate predictions made by the proposed feedback circuit, we conducted two independent sets of mouse genetic experiments that manipulate the Wnt and Bmp signaling pathways. First, we aimed to “short-circuit” the gene regulatory network by testing whether ectopically produced epithelial Bmp4 could substitute for mesenchymal Bmp4 (Fig. 3A). Pax9 and Msx1 are both required for bud-stage mesenchymal Bmp4 expression, and loss of either factor leads to tooth arrest at the bud stage (16, 17). Epithelial Apc loss of function leads to constitutive Wnt pathway activation in the epithelium and, in contrast to the bud-stage arrest phenotypes in Pax9- and Msx1-null mutants, results in supernumerary tooth formation (25, 26, 28). On the basis of the assumption that signaling molecules produced by either the epithelial or the mesenchymal compartment are diffusible and can affect both compartments, we predicted that ectopic epithelial Bmp4 expression induced by Wnt pathway activation in epithelial Apc loss-of-function mutants would rescue the tooth agenesis that results from decreased mesenchymal Bmp4 expression in Pax9 or Msx1 mutants (text S4). As predicted by the feedback circuit model, compound epithelial Apc loss-of-function and Pax9-null mutants exhibit supernumerary tooth induction, as shown by expression of the ameloblast and odontoblast differentiation markers, Amelogenin (Amel) and Dentin sialophosphoprotein (Dspp), respectively (Fig. 3B and fig. S11). At E14.0, we observed no discernible difference in the epithelial expression of Wnt6 and Bmp4 between Apc loss-of-function and compound Apc loss-of-function; Pax9-null embryos (Fig. 3C and fig. S12), and similar results were obtained in compound Apc loss-of-function; Msx1-null embryos (figs. S13 and S14). Furthermore, mesenchymal expression of Bmp4 was reduced in epithelial Apc loss-of-function; Pax9-null or Apc loss-of-function; Msx1-null mutants (Fig. 3C and fig. S14). These results therefore indicate that epithelial Bmp4 can substitute for mesenchymal Bmp4 and confirm the functional equality of ligand source that originates from either the epithelial or the mesenchymal compartment in the Wnt-Bmp feedback circuit.
Fig. 3.
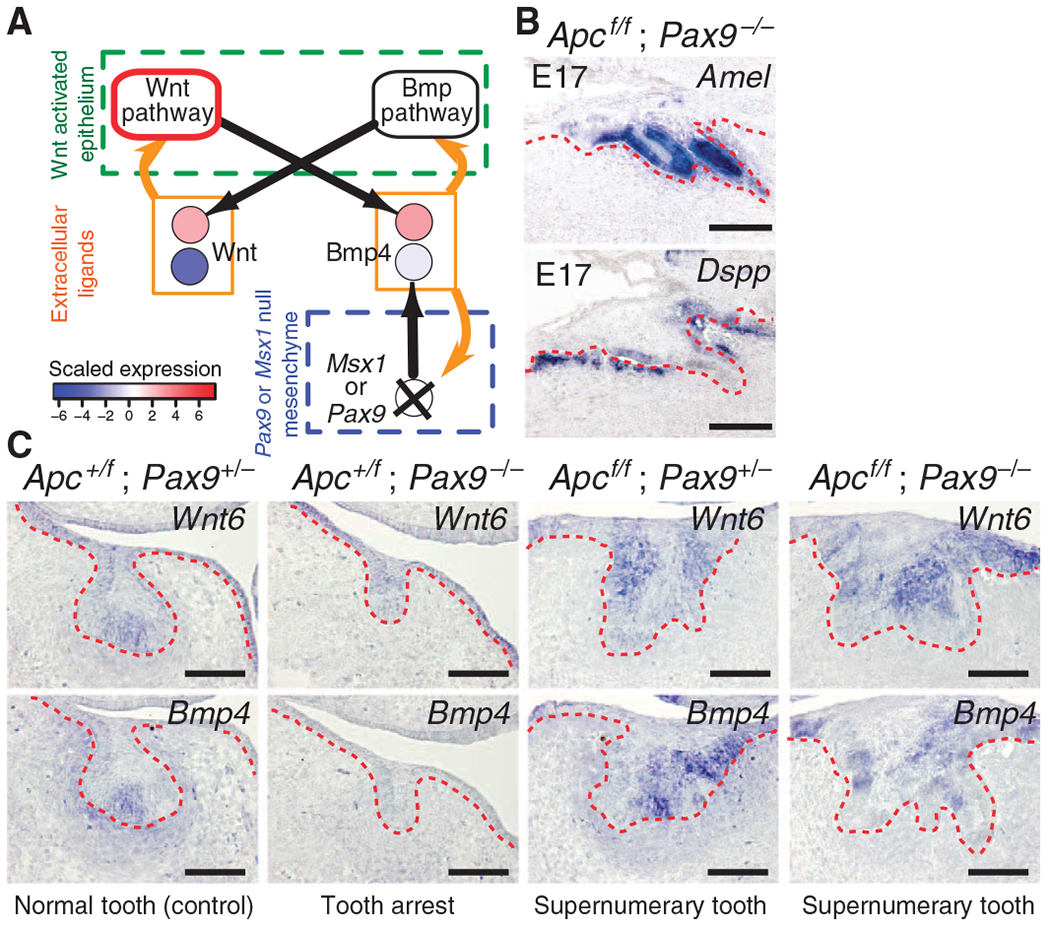
Constitutive epithelial Wnt signaling produces a short circuit and bypasses the requirement for mesenchymal Bmp4 expression. (A) Epithelial Apc loss of function (constitutive canonical Wnt pathway activity, outlined in red) is predicted to short-circuit the intraepithelial Wnt-Bmp feedback circuit by uncoupling dependence on mesenchymal Bmp4 expression, which is decreased in Pax9- and in Msx1-null mutants (X); this enables supernumerary tooth formation. (B) Amelogenin (Amel) and Dentin sialophosphoprotein (Dspp) expression confirms ameloblast and odontoblast differentiation, respectively, in E17.5 sagittal sections of compound epithelial Apc loss-of-function; Pax9-null mutants (Apcf/f; Pax9−/−). The epithelium is denoted by the dashed red lines. n = 3 nonadjacent sections. (C) Coronal sections at E14.0 showing increased epithelial Wnt6 expression in Apcf/f; Pax9−/− mutants compared to control (Apc+/f; Pax9+/−). Expression of epithelial Bmp4 is increased and that of mesenchymal Bmp4 expression is decreased in Apcf/f; Pax9−/− mutants compared to control. n = 3 nonadjacent sections. Scale bars, 200 μm (B) and 100 μm (C). See also figs. S11 to S14.
Epithelial Bmpr1a loss of function reduces Wnt expression and prevents tooth formation
The second set of experiments was designed to “break” the feedback circuit with an epithelial Bmpr1a loss-of-function mutant to interrupt Bmp signal transduction in the epithelium (Fig. 4A). Epithelial Bmpr1a loss of function produces an arrest in tooth development at the bud stage (22) that phenocopies the bud-stage arrest in Pax9 and Msx1 mutants. On the basis of simulations of the intertissue gene regulatory network (text S4), we hypothesized that unlike the case in compound epithelial Apc loss-of-function; Pax9-null or Apc loss-of-function; Msx1-null mutants, compound loss of function of epithelial Bmpr1a and Apc would suppress the induction of supernumerary teeth by interrupting the intraepithelial Bmp4 signal in the feedback circuit. Indeed, in compound epithelial Apc loss-of-function; Bmpr1a loss-of-function mutants, Amel and Dspp expression at E17.5 was undetectable, indicating a failure of tooth differentiation (Fig. 4B and fig. S15).
Fig. 4.
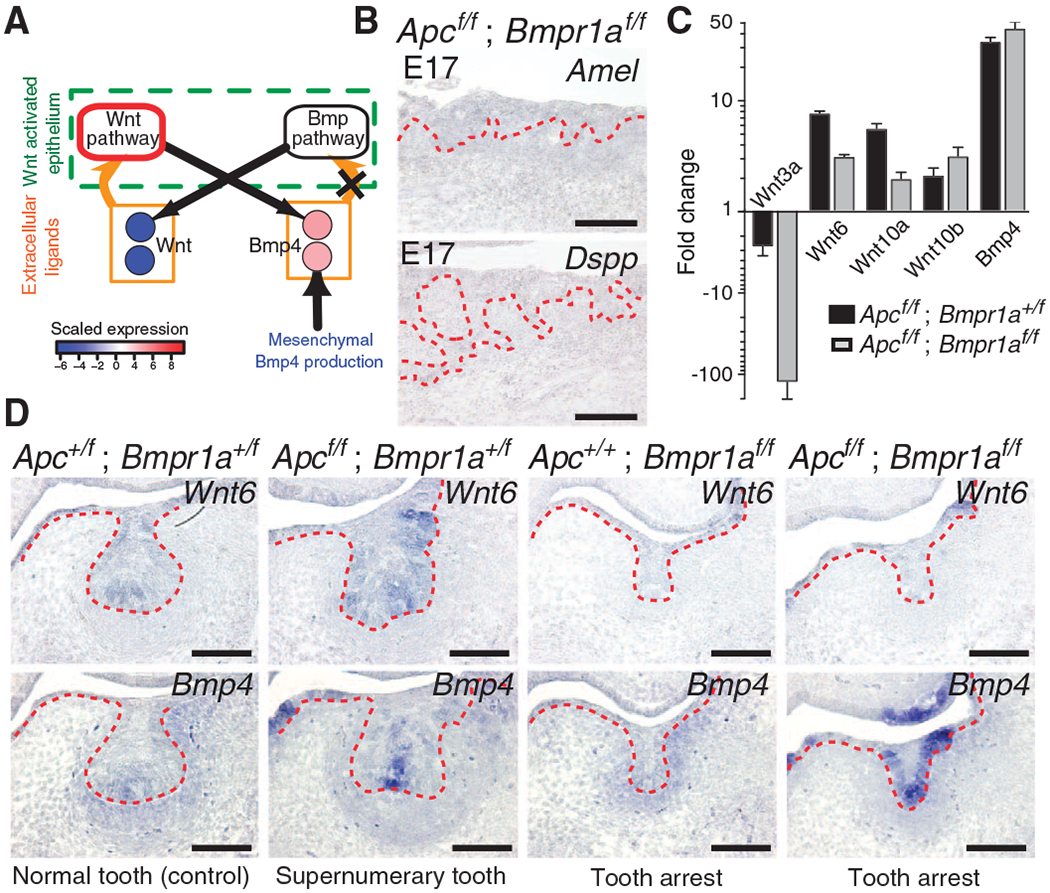
Loss of Bmpr1a signaling breaks the Wnt-Bmp circuit and prevents tooth formation induced by constitutive epithelial Wnt signaling. (A) Epithelial Bmpr1a loss of function (X) breaks the odontogenic circuit and results in decreased expression of genes encoding canonical Wnt ligands. The Wnt pathway node outlined in red represents constitutive Wnt pathway activity. (B) Sagittal sections at E17.5 in compound epithelial Apc loss-of-function; Bmpr1a loss-of-function (Apcf/f; Bmpr1af/f) mutants reveal undetectable Amel and Dspp expression and failure of tooth differentiation. The epithelium is denoted by the dashed red lines. n = 3 nonadjacent sections. (C) At E14.5, qRT-PCR reveals decreased Wnt3a, Wnt6, and Wnt10a expression in Apcf/f; Bmpr1af/f compared to epithelial Apc loss-of-function (Apcf/f; Bmpr1a+/f) mutants. Expression of Wnt10b was similar in Apcf/f; Bmpr1af/f and Apcf/f; Bmpr1a+/f. Data are means ± SD (n = 6; two biological replicates run in technical triplicate) normalized to Hprt. (D) Decreased epithelial Wnt6 expression in Apcf/f; Bmpr1af/f compared to Apcf/f; Bmpr1a+/f mutants in E14.0 coronal sections. Similar epithelial expression of Bmp4 in Apcf/f; Bmpr1af/f compared to Apcf/f; Bmpr1a+/f mutants. n = 3 nonadjacent sections. Scale bars, 200 μm (B) and 100 μm (D). See also figs. S15 to S17.
We performed qRT-PCR expression analysis on isolated E14.5 oral and dental epithelium for canonical Wnts, Bmp4, Fgfs, and Shh in epithelial Apc loss-of-function mutants and compound epithelial Apc loss-of-function; Bmpr1a loss-of-function mutants (Fig. 4C). Relative fold changes were determined by comparison with the dental epithelium of control samples. This is a heterogeneous tissue in which the expression of Wnts, Bmp4, Fgfs, and Shh is enriched in the enamel knot region of the developing tooth germ. In this analysis, the expression of Bmp and Shh was similar in both epithelial Apc loss-of-function mutants and compound epithelial Apc loss-of-function; Bmpr1a loss-of-function mutants (Fig. 4C and fig. S16). The expression of Wnt3a was reduced in compound epithelial Apc loss-of-function; Bmpr1a loss-of-function mutants (Fig. 4C). The expression of Wnt6, Wnt10a, Wnt4, Wnt7b, Fgf4, and Fgf8 was also reduced in compound epithelial Apc loss-of-function; Bmpr1a loss-of-function mutants compared to epithelial Apc loss-of-function mutants (Fig. 4C and fig. S16). The expression of Wnt10b and Wnt3 was not reduced, indicating that there is heterogeneous regulation of Wnt ligand genes. RNA in situ expression analysis revealed that enamel knot markers were undetectable in epithelial Bmpr1a loss-of-function mutants and that there was decreased Wnt6 expression in epithelial Bmpr1a loss-of-function mutants compared to control (Fig. 4D and fig. S17). The expression of Wnt6 was lower in compound epithelial Apc loss-of-function; Bmpr1a loss-of-function mutants than in epithelial Apc loss-of-function mutants (Fig. 4D). In contrast, expression of epithelial Bmp4 and Shh was similar in these two genotypes by in situ analysis (Fig. 4D and fig. S17). Therefore, despite variable decreases in the expression of individual Wnt genes, the results identify Bmpr1a as a regulator of epithelial Wnt expression. Moreover, these results confirm that the overall behavior of the Wnt and Bmp pathways is as predicted by the feedback circuit and establish that simultaneous Wnt and Bmp signal transduction is required in the dental epithelium to direct early odontogenesis.
DISCUSSION
Here, we generated more than 100 microarray gene expression profiles and curated more than 1000 pieces of experimentally validated regulatory evidence from the literature. Our genome-wide expression profiling reveals several new insights. First, although signaling molecule expression in general proceeds according to a sequential and reciprocal pattern between dental epithelium and mesenchyme, the overall temporal expression changes for a large number of genes are concordant in both epithelium and mesenchyme. Second, among all pathway components, the expression of extracellular signaling molecules most closely matches the sequential and reciprocal pattern of odontogenic potential, suggesting their role in controlling epithelial-mesenchymal interactions. Finally, among the four key signaling pathways investigated in this study, canonical Wnt and Bmp emerge as the key, primary drivers of epithelial-mesenchymal interactions; other signaling pathways, although operative, appear to function at subsidiary steps in the odontogenic gene regulatory network.
To elucidate a mechanism that can account for these findings, we reconstructed an integrated epithelial-mesenchymal gene regulatory network, using a novel probabilistic data integration technique that integrates multiple sources of molecular regulatory evidence. Within the epithelial-mesenchymal gene regulatory network, a subnetwork encoding a Wnt-Bmp feedback circuit was discovered. The Wnt-Bmp circuit allowed us to correctly predict the spatial expression of Wnts and Bmp4 in single and compound genetic mutant mice (Figs. 3 and 4 and text S4) and provides a framework to explain the morphological phenotype (tooth arrest or supernumerary tooth formation) in terms of alteration to the underlying circuit structure (Figs. 3 and 4).
As with any modeling effort, a model is only meaningful within the context of the question it sets out to address. In our case, the Wnt-Bmp feedback circuit appears to represent a simplified model to explain the epithelial-mesenchymal signaling dynamics that exist from the initiation stage (E10 to E11.5) to the bud stage (E13 to E13.5) of molar tooth development, up to the cap stage (E14.5), when enamel knot formation occurs. Nonetheless, there are some specific features that our model does not fully recapitulate. For example, the peak of epithelial Wnt expression at E11.0 cannot be captured by our ordinary differential equation simulation if we compare simulated and observed Wnt expression precisely at that time point (Fig. 2E and text S4). The initiation stage of odontogenesis is broadly defined from E10.0 to E11.5 because these are the stages in which the epithelium is capable of instructing nondental tissue to form teeth (9). Because Wnt expression dynamics within this stage are not the major focus of this study, we concentrated on qualitatively capturing sequential and reciprocal expression dynamics.
Note that the structure of our gene regulatory network is inferred on the basis of regulatory evidence pertaining to signaling molecule expression that is enriched in the enamel knot region. Therefore, the structure of the gene regulatory network and the epithelial-mesenchymal signaling dynamics analyzed in this work at the E14.5 cap stage likely apply to the enamel knot region but do not directly explain the intraepithelial patterning mechanism that enriches Wnt and Bmp expression in the enamel knot. Nonetheless, the Wnt-Bmp circuit may prove applicable even to non–enamel knot–forming oral epithelium, because constitutive epithelial Wnt activation can induce supernumerary tooth formation in nondental epithelium (25, 26, 28). Further investigation is required to elucidate the mechanism that restricts the activity of the Wnt-Bmp feedback circuit to the enamel knot region at the cap stage.
The combined action of Wnt and Bmp signaling transduction controls the expression not only of Wnts and Bmp4 but also of Shh and Fgfs in both epithelial and mesenchymal compartments (Fig. 2, A and B, and fig. S9). Our expression data confirm that the relative expression of signaling molecule genes, within the distinct epithelial-mesenchymal compartments, correlates with the sequential and reciprocal instructive phases of inductive signaling that control odontogenesis. Therefore, although the simple circuit reconstructed here explicitly includes only the canonical Wnt and Bmp4 signaling pathways, our work indicates that these two pathways are the two major mediators of epithelial-mesenchymal signaling in early odontogenesis. Moreover, if an expanded gene regulatory network is considered, the Wnt-Bmp circuit implicitly also accounts for the expression of Fgfs and Shh, because the expression of these genes is regulated by the Wnt and Bmp pathways.
Through gene regulatory network reconstruction, ordinary differential equation simulation, and in vivo validation, we show that the Wnt-Bmp circuit structure can account for the sequential and reciprocal signaling dynamics that occur during the epithelial-mesenchymal interactions of odontogenesis. The exact molecular mechanisms that control some features of the circuit, such as the restriction of canonical Wnt gene expression to the dental epithelium and the cross-regulation of Wnts and Bmp4, remain unknown. Nonetheless, the gene regulatory network generated here, which integrates a large amount of experimental evidence, can provide useful insight for understanding these features. For example, although the exact molecular mechanisms that restrict Wnt expression to the dental epithelium and account for its absence from the dental mesenchyme are unknown, the gene regulatory network structure indicates positive regulation by Bmp4 in the epithelium and the absence of a regulatory relationship between Bmp, Wnt, Shh, and Fgf signaling and Wnt expression in the dental mesenchyme.
A goal of systems biology is to understand cellular and intercellular behaviors, such as epithelial-mesenchymal signaling dynamics, in terms of the interactions of their molecular constituents (33–36). Our work illustrates the potential synergy that can be realized by interdisciplinary collaborations between developmental and computational biologists to tackle long-standing biological problems. Indeed, this study demonstrates that a systems biology approach that combines genome-wide expression profiling, relevant data from the literature, integrative bioinformatic analyses, and in vivo genetic models can generate a functionally useful mechanistic circuit for the development of a multitissue organ. Although epithelial-mesenchymal interactions are classically represented as a stepwise process, our findings indicate that secreted signals can simultaneously affect both tissue compartments, thereby coupling the developmental progression of epithelial and mesenchymal compartments. Because the early stages of epithelial-mesenchymal interactions in many organs are functionally alike, similar intertissue self-sustaining feedback circuits may emerge as a general feature of organogenesis.
MATERIALS AND METHODS
Animal models
Pax9−/− (16), Msx1−/− (17), Bmpr1af/f (22, 37), Apcf/f (28), and K14-Cre1Amc (38) mice were described previously. K14-Cre1Amc, Apcf/f mice were maintained in a C57BL/6 background. BALB/c Msx1+/−, FVB/N Pax9+/−, and 129-E Bmpr1af/f mice were backcrossed for three to five generations to C57BL/6NCrl mice (Charles River Laboratories) before intercrosses. Females carrying the K14-Cre1Amc transgene were not used in mouse crosses. The day of vaginal plug detection was defined as E0.5. All animal work was carried out under an animal protocol approved by the Harvard Medical School Institutional Animal Care and Use Committee.
Histology, RNA in situ hybridization, and microscopy
Embryonic tissues for RNA in situ hybridization with digoxigenin-labeled RNA probes (Roche) were fixed in 4% paraformaldehyde and then embedded in paraffin for sectioning. The following RNA probes were used: mouse Wnt6 (39), Msx1 (17), Amel, Dspp, Bmp4, Fgf4, and rat Shh (28). After hybridization, RNA probes were developed in BM Purple (Roche). Bright-field images of section RNA in situ hybridizations were acquired on an Olympus DP70 digital microscope camera with minimal processing in Adobe Photoshop CS3. Whole-mount embryos were photographed with a Leica DC500 camera on a stereomicroscope.
Organ culture and signaling molecule treatment assay
CD-1 mouse (Charles River Laboratories) E10.0 first branchial arch and E13.0 mandibles were dissected and left intact or treated with dispase (5 mg/ml; Invitrogen) and deoxyribonuclease I (DNase I) (27 U/ml; Qiagen) in phosphate-buffered saline (PBS) at 37°C for 25 min to isolate epithelial and mesenchymal tissues. Intact E10.0 first branchial arch, isolated E10.0 first branchial arch mesenchyme, intact E13.0 mandible, and isolated E13.0 epithelium were cultured overnight on 0.1-μm Nuclepore filters at 37°C by means of a Trowell-type culture system (40) in defined culture medium (41) that consisted of 68% Dulbecco’s modified Eagle’s medium (DMEM)–F12, 1% penicillin/streptomycin, 15% knockout serum replacement (KOSR), 1% nonessential amino acids (NEAAs), 1 mM l-glutamine (Life Technologies), 15% fetal bovine serum (Hyclone), and 0.1 mM β-mercaptoethanol (Sigma). Tissue isolations were cultured overnight to allow the decay of endogenous tissue interactions and epithelial-mesenchymal–dependent gene expression. After overnight culture, selected signaling molecules or a small-molecule inhibitor was added to both the culture medium and in the form of soaked beads, as described previously (10), to ensure adequate signaling molecule exposure. Dried agarose beads (Bio-Rad) were soaked for 30 min at 37°C in Bmp4 (100 μg/ml; R&D Systems), Shh (100 μg/ml; R&D Systems), and 0.9 mM Gsk3 inhibitor XV (14) (EMD Chemicals). Heparin acrylic beads (Sigma) were soaked in Fgf8 (25 μg/ml; R&D Systems). Medium supplemented with Bmp4 (1 μg/ml), Shh (2.5 μg/ml), 1 μM Gsk3 inhibitor XV or Fgf8 (0.6 μg/ml) was prepared at the same time. Untreated controls consisted of intact tissue and isolated mesenchyme and epithelium that received agarose beads soaked in bovine serum albumin and fresh medium. After 8 hours of exposure to signaling molecule, about eight tissues of distinct embryonic origin were pooled to create each of three biological replicates. The RNA was purified with PicoPure Isolation Kit (Molecular Devices). The untreated, intact tissue was treated with dispase and DNase I to isolate E10.0 first branchial arch–derived mesenchyme after culture overnight with the epithelium, and E13.0-derived mandibular epithelium after culture overnight with the mesenchyme. Purified total RNA was processed by the Molecular Genetics Core Facility at Children’s Hospital Boston and hybridized to Illumina MouseWG-6 v2 Expression BeadChip whole-genome expression arrays according to the manufacturer’s instructions.
LCM and gene expression analysis
Embryonic tissue was dissected on ice-cold ribonuclease (RNase)–free PBS, and the heads were frozen immediately in Tissue-Tek OCT (optimum cutting temperature) compound (Andwin Scientific). Fresh-frozen tissue was cryosectioned (Leica) and collected on PEN (polyethylene naphthalate) membrane slides (Molecular Devices). The slides were immediately refrozen and maintained on dry ice before staining and dehydration with Histogene Staining Kit (Molecular Devices). Discrete epithelial and mesenchymal tissues were isolated with a Leica LCM LMD 6000 microscope. The tissue was isolated directly into the extraction buffer provided with the PicoPure Isolation Kit (Molecular Devices). RNA purification was performed according to the PicoPure Isolation Kit and included an on-column treatment with RNase-free DNase I (Qiagen). Eluted RNA quality was determined with an Agilent Bioanalyzer 2100. Total RNA (10 to 25 ng) was then amplified to yield 7 to 10 μg of single-stranded DNA by means of a poly(dT) [poly(deoxythymidine)]–based Ovation RNA Amplification System V2 (NuGEN). The quality and size distribution of amplified DNA were confirmed with an Agilent Bioanalyzer 2100. Biotinylation was achieved through abasic site creation in the single-stranded DNA with uracil N-glycosylase (Epicentre Biotechnologies) and reaction with aldehyde-reactive probe (ARP) N-(aminooxyacetyl)-N′-(d-biotinoyl) hydrazine, trifluoroacetic acid salt (Invitrogen). Biotinylated DNA (1.5 μg) was hybridized according to NuGEN’s manufacturer’s note to Illumina Mouse Ref-6 whole-genome expression arrays. See fig. S1 for an overview of the LCM workflow.
Quantitative real-time PCR
E14.5 embryonic mandibles were dissected and treated with dispase (5 mg/ml; Invitrogen) and DNase I (27 U/ml; Qiagen) to isolate the epithelium. RNA was purified according to the manufacturer’s instructions with a PicoPure Isolation Kit (Molecular Devices) and quantified on a NanoDrop spectrophotometer. Total RNA (100 ng) was reverse-transcribed into complementary DNA (cDNA) using qScript cDNA SuperMix (Quanta) and quantified with NanoDrop. cDNA (100 ng) was then used in TaqMan Gene Expression Assays (Applied Biosystems) to quantify Wnt10a (Mm00437325_m1*), Wnt6 (Mm00437353_m1*), and Wnt3a (Mm00437337_m1*), Wnt10b (Mm00442104_m1*), Wnt3 (Mm00437336_m1), Wnt4 (Mm01194003_m1), Wnt7b (Mm01301717_m1), Wnt5a (Mm00437347_m1), Lef1 (Mm00550265_m1), Bmp4 (Mm00432087_m1), Ff4 (Mm00438917_m1*), Fgf8 (Mm00438922_m1*), Shh (Mm00436528_m1) transcripts, as normalized to Hprt (Mm01545399_m1*). Fold change was calculated with 2−[ΔCt(Experimental) – ΔCt(Control)], in which ΔCt is the difference in threshold cycle between our gene of interest and the housekeeping gene Hprt.
Microarray data preprocessing and assessment
The R statistical environment was used to perform data analysis (http://www.r-project.org/). The individual data sets (time course, Pax9 and Msx1 LCM null mutants, and signaling molecule treatments; see text S1 for details) were independently processed with the lumi package (42) for log2 transformation and robust spline normalization. To filter out unresponsive probes, we removed probes that had detection P values less than 10−8 (as determined by Illumina’s BeadStudio software) in fewer than 6 samples across all samples across all three data sets (105 samples in total). More than 50% of the probes were removed in this step. The remaining 20,379 probes were used for analysis. We combined the three data sets and applied quantile normalization to adjust for differences in probe intensity distribution. We observed a batch effect between the LCM and the manually dissected microarray analyses (text S1). We attributed this batch effect to the identity of the hybridization molecule [cDNA or complementary RNA (cRNA)] (43) and applied ComBat (44) to correct this bias. Batch effect–adjusted data recovered the expected biological clustering of our samples according to tissue type and developmental stage (text S1). If multiple probes represented a single gene, the probe with the highest median expression across all samples was chosen for analysis. The final data set contains 14,032 genes. We further validated our time series expression data with the qualitative gene expression records from the BITE-IT database (http://bite-it.helsinki.fi/) and confirmed that our microarray data are in strong agreement with these published gene expression patterns (text S2 and table S1).
Analysis of microarray developmental time course data
Principal components analysis was performed on the combined (LCM and manually dissected) time course gene expression data set using R’s prcomp function with default parameters. We used moderated t statistics, as implemented in limma (45), to identify differentially regulated genes temporally within each tissue compartment (bud stage compared to initiation stage). We calculated FDRs for each differentially regulated gene with the Benjamini and Hochberg (46) method. A gene is determined to be differentially regulated if it has an FDR less than 0.05 and log2 fold change of 0.5 or more (about 1.4-fold increase or decrease). We used a χ2 test to determine whether the differentially regulated genes showing concordant or discordant temporal expression patterns between epithelium and mesenchyme were independent. Because we observed a significant enrichment of concordant gene expression changes between the two tissue compartments (P < 10−15), we tested whether this amount of concordance in temporal expression changes could be consistently found across different functional biological categories. We used a large compendium of mouse-specific gene sets comprising gene ontology terms, Kyoto Encyclopedia of Genes and Genomes (KEGG) pathways, MouseCyc pathways, Mouse Genome Informatics (MGI) mouse phenotype–associated genes, Functional Annotation of the Mammalian Genome 4 (FANTOM4) mouse tissue-specific transcription factor gene sets, and other custom gene sets related to tooth development, signaling pathways, and stem cell regulation (tables S2 and S3). The final collection contained 1904 gene sets after we restricted our analysis to gene sets that contained between 10 and 1000 genes. We performed a χ2 test to each gene set independently. The procedure of Benjamini and Hochberg (46) was used to calculate an FDR for each gene set from the P values. To determine whether a significant FDR can be attributed to a concordant or a discordant temporal gene expression change, we calculated a concordance score for each gene set as follows:
where c and d are the number of genes with concordant (increased or decreased expression in both tissues) and discordant (increased expression in one tissue and decreased expression in the other) expression changes between the two tissue compartments, respectively. A positive concordance score represents a concordant change, and a negative concordance score represents a discordant change.
Curation of mouse development specific signaling pathways
We manually curated detailed murine-specific gene sets for agonists, antagonists, receptors, signal transduction components, and nuclear components, encompassing the five known signaling pathways that are required for tooth development to reach the E14.5 cap stage: Wnt, Bmp, Fgf, Hh, and Activin. Each gene is assigned as having either an activating or an inhibiting effect on overall pathway activity. Each entry in our pathway annotations is supported by at least one primary research reference.
Signaling pathway activity analysis
To infer the signaling activity of these pathways from our microarray data, we calculated the average normalized scaled expression of the secreted signaling molecules of each pathway. To do this, we first normalized the expression of each gene to have mean 0 and SD 1 across the time course gene expression profiles. The normalized expression is denoted as zij for gene i and sample j. We then calculated a scaled expression score (SE) for each gene set to represent the average expression abundance of each pathway gene set at each developmental stage using a method described previously (35, 47):
where G is the set of index of the genes in the target gene set, and S is the set of index of replicate samples. The resulting scaled expression for each pathway gene set is an approximate inferred measure of the activity of that pathway.
Molecular concept map analysis
We conducted molecular concept map analyses (15) to identify and visualize significant overlaps between various gene sets (referred to as a “molecular concept”). Each molecular concept is a set of significant differentially regulated genes as determined by limma (45) (FDR <0.05 and log2 fold change >0.5). In the molecular concept map of the signaling molecule treatment experiments, each molecular concept contains differentially regulated genes from the comparison of expression profiles of dissected tissues (mesenchyme at initiation stage and epithelium at bud stage) treated with various signaling molecules, or intact tissue (to approximate endogenous signals from the juxtaposed compartment), against untreated tissues. In the molecular concept map for the Pax9 and Msx1 mutant analysis, differentially regulated genes were determined by comparing the gene expression profiles of mutant mice to that of wild-type mice. Two molecular concepts (nodes) were connected by a link if the Bonferroni-corrected P value was less than 0.05 (Fisher’s exact test) and the odds ratio was greater than 2. All networks were visualized by Cytoscape (48).
A compendium of gene perturbation experimental evidence
Peer-reviewed literature from 1993 to 2011 was searched for genetic or molecular perturbation data in mouse tissues that were associated with tooth or relevant craniofacial phenotypes. Each data point consisted of a regulator gene (the gene in which expression was perturbed), a target gene (the gene in which mRNA expression was measured), the tissue studied, and the developmental stage of the tissues used. The regulator gene was determined to have a positive, negative, or no influence on the target gene on the basis of the authors’ original conclusion after confirmation with their primary data. All data were derived from two general classes of experiments: organ culture data and transgenic mouse data. Organ culture data consisted of embryonic tissues treated with signaling molecules, small molecules, blocking antibodies, expression plasmid DNA, or antisense morpholinos, followed by gene expression analysis. Transgenic mouse data were derived from embryos with promoter-driven regulator expression, reporter target gene expression, and global, conditional, or temporal gain or loss of regulator gene function. In these reports, qualitative antisense RNA in situ hybridization or quantitative real-time PCR was used to assess gene expression. In this manner, more than 1000 entries of gene regulatory evidence were recorded. We also derived 20 pieces of evidence from qRT-PCR and in situ hybridization results from this study and 497 pieces of regulatory evidence from the two sets of perturbation microarray profiling experiments in this study: (i) analysis of the Pax9 and Msx1 mutant effect in epithelium and mesenchyme at E13.5 and (ii) signaling molecule treatment of epithelium and mesenchyme. Using our gene expression profiles, we deemed a gene to be differentially regulated if it had an FDR of <0.05 and a log2(fold change) >0.5 according to limma’s t test. In addition, we included only differentially regulated genes that had a log2 expression value of 7 or above in at least one sample to ensure that only signals from high-quality probes contributed to our perturbation evidence table. A brief summary of the perturbation data table can be found in text S3.
Construction of an intertissue signaling–based gene regulatory network for early tooth development
We integrated our compendium of gene perturbation experimental evidence and our manually curated signaling pathway annotation to construct a spatiotemporal gene regulatory network for early tooth development. To discover a signaling-based gene regulatory network, we mapped each gene in the perturbation evidence table to either a signaling molecule (for example, Wnt6 for Wnt ligand) or a component of a signaling pathway (for example, Ctnnb1 for Wnt pathway). Genes not belonging to these categories were excluded. We noted that each regulator-target relationship was supported by multiple independent pieces of experimental data within stages E10 to E14. To deal with this sparse and heterogeneous data set, we developed a probabilistic model to integrate evidence for inferring each edge. Our algorithm made the following four biologically motivated assumptions. First, a signaling molecule could exert its effect only through receptor-mediated activation or inhibition of its target signaling pathway. Second, a pathway or a molecule in one tissue compartment exerted its effect on another tissue compartment only through secreted signaling molecules. Third, each piece of evidence contributed (according to some weight) to the inference of the mode of interaction at every time point. Fourth, the mode of interaction of one edge is independent of other edges given the observed perturbation evidence. Briefly, we inferred the mode of interaction, M = {act, no, inhib}, of each edge from a collection of k perturbation experimental data, , where each piece of evidence was presented as a 4-tuple, (reg, target, support, time), which specified whether there was experimental support for the regulator to have had a positive, negative, or no regulation (abbreviated as pos, neg, and noReg, respectively) effect on the target gene at a particular development stage. For each edge, we used Bayes’ rule to calculate the probability of an edge’s mode of interaction:
The term P(M) is a uniform prior, which specifies that all modes of interaction were equally probable before observing any information. The term P(D|M) specifies the likelihood of observing the set of experimental evidence, D, given a particular mode of interaction, M. This likelihood term can be decomposed as the product of the probability of observing each piece of evidence:
We then specified the likelihood model of observing each piece of evidence, P(d|M), as a conditional probability matrix that describes the likelihood of observed experimental evidence for i = {pos, noReg, neg} (rows of the matrix) given the true mode of interaction j = {act, no, inhib} (columns of the matrix):
where αt represents the probability of a correct experimental observation at a time point that was t away from the actual time point, and β represents the probability of incorrect experimental evidence due to insensitivity of the detection technology. The term αt can be calculated as follows:
where α0 is the probability of correct observation at the exact time point, t is the absolute difference in time (for example, using E10 data to infer E13 edge, t = 3; using E13 data to infer E12 edges, t = 1), and Δα was the decrease in likelihood per unit time. The third root was used to produce a smooth and gradual change in likelihood such that evidence from a time point that is further away from the target time point receives less weight by having a lower αt. Here, we used α0 = 0.9, Δα = 0.15, and β = 0.9, but our results are not sensitive to reasonable changes to these parameters (text S3).
Simulation of the Wnt-Bmp feedback circuit
The ordinary differential equation model we reconstructed is based on the Wnt-Bmp feedback circuit structure (Fig. 2C). Signal transduction and transcriptional activation (orange and black edges in the figure, respectively) are modeled with the Hill equation, , to model the nonlinear influence a regulator has on its target. This approach for modeling gene regulatory network behavior has been used previously as a simple approximation of gene expression dynamics (8, 49). We therefore created eight simple equations to model the activity of the Wnt and Bmp pathways in the two tissue compartments and the expression of Wnts and Bmp4 produced by the two compartments. The model was implemented and simulated using GNU Octave (http://www.gnu.org/software/octave/). The ordinary differential equation model was solved with the lsode function. The initial values of signaling molecule expression and pathway activity are assigned on the basis of the microarray data at the initiation stage (Fig. 2). We conducted a systematic parameter search to identify the set of parameters that can qualitatively capture the essential features of the expression dynamics of the Wnt and Bmp4 signaling molecules. For a detailed description of the model and the analysis simulation results, refer to text S4.
SUPPLEMENTARY MATERIALS
Supplementary Material
Text S1. Quality assessment of microarray data.
Text S2. Comparison with qualitative gene expression data from the BITE-IT database.
Text S3. Construction of a gene regulatory network from perturbation data.
Text S4. Simulation of the Wnt-Bmp feedback circuit.
Fig. S1. LCM workflow.
Fig. S2. Principal components analysis of time series gene expression profiles.
Fig. S3. Analysis of gene expression concordance between epithelium and mesenchyme with the LCM and manually dissected time course data sets.
Fig. S4. Average scaled gene expression patterns of different signaling pathway components.
Fig. S5. Expression dynamics of representative extracellular signaling molecules and receptors (Bmp, Wnt, Fgf, and Shh pathways).
Fig. S6. Heat maps of average expression of cellular components in different signaling pathways.
Fig. S7. A schematic illustration of the construction of a molecular concept map.
Fig. S8. Molecular concept maps showing significant overlap between various sets of differentially regulated genes.
Fig. S9. Epithelial and mesenchymal gene regulatory networks reconstructed using our probabilistic method.
Fig. S10. An expanded view of the Wnt-Bmp feedback circuit.
Fig. S11. Constitutive canonical Wnt signaling induces supernumerary tooth development in the absence of Pax9.
Fig. S12. Coronal sections of molar regions from control, Pax9-null, epithelial Apc loss-of-function, and compound epithelial Apc loss-of-function; Pax9-null mutants at E14.0.
Fig. S13. Constitutive canonical Wnt signaling induces supernumerary tooth formation in the absence of Msx1.
Fig. S14. Coronal sections of molar regions from control, Msx1-null, epithelial Apc loss-of-function, and compound epithelial Apc loss-of-function; Msx1-null mutants at E14.0.
Fig. S15. Constitutive canonical Wnt signaling fails to induce tooth formation in the absence of epithelial Bmpr1a.
Fig. S16. qRT-PCR expression analysis at E14.5 in the isolated epithelium of epithelial Apc loss-of-function and of compound epithelial Apc loss-of-function; Bmpr1a loss-of-function mutants.
Fig. S17. Coronal sections of molar regions from control, epithelial Apc loss-of-function, epithelial Bmpr1a loss-of-function, and compound epithelial Apc loss-of-function; Bmpr1a loss-of-function mutants at E14.0.
Table S1. Comparison of BITE-IT and microarray data from this study.
Table S2. Gene sets used in this study.
Table S3. Custom gene sets used in this study.
References
Acknowledgments:
We thank N. Gehlenborg for help in designing the ToothCODE Web site and S. Rowan, S. Lachke, B. Gerami-Naini, and members of SysCODE for critical comments. We thank Y. Mishina and R. Behringer for creating and sharing the Bmpr1a mice and X.-P. Wang for RNA probes. Microarrays were hybridized at the Molecular Genetics Core Facility at Children’s Hospital Boston (NIH-P50-NS40828 and NIH-P30-HD18655).
Funding:
Supported by the NIH Common Fund through National Institute of Dental and Craniofacial Research RL1DE019021 and UL1DE019581 (R.L.M.) and National Institute of Biomedical Imaging and Bioengineering RL9EB008539 (J.W.K.H.) and R37DE011697 (R.L.M.).
Footnotes
Competing interests: The authors declare that they have no competing interests.
REFERENCES AND NOTES
- 1.Grobstein C, Morphogenetic interaction between embryonic mouse tissues separated by a membrane filter. Nature 172, 869–870 (1953). [DOI] [PubMed] [Google Scholar]
- 2.Grobstein C, Mechanisms of organogenetic tissue interaction. Natl. Cancer Inst. Monogr 26, 279–299 (1967). [PubMed] [Google Scholar]
- 3.Saxén L, Thesleff I, Epithelial-mesenchymal interactions in murine organogenesis. Ciba Found. Symp 165, 183–193 (1992). [DOI] [PubMed] [Google Scholar]
- 4.Jacobson AG, Inductive processes in embryonic development. Science 152, 25–34 (1966). [DOI] [PubMed] [Google Scholar]
- 5.Gurdon JB, Embryonic induction—Molecular prospects. Development 99, 285–306 (1987). [DOI] [PubMed] [Google Scholar]
- 6.Jessell TM, Melton DA, Diffusible factors in vertebrate embryonic induction. Cell 68, 257–270 (1992). [DOI] [PubMed] [Google Scholar]
- 7.Jernvall J, Thesleff I, Reiterative signaling and patterning during mammalian tooth morphogenesis. Mech. Dev 92, 19–29 (2000). [DOI] [PubMed] [Google Scholar]
- 8.Bénazet JD, Bischofberger M, Tiecke E, Gonçalves A, Martin JF, Zuniga A, Naef F, Zeller R, A self-regulatory system of interlinked signaling feedback loops controls mouse limb patterning. Science 323, 1050–1053 (2009). [DOI] [PubMed] [Google Scholar]
- 9.Mina M, Kollar EJ, The induction of odontogenesis in non-dental mesenchyme combined with early murine mandibular arch epithelium. Arch. Oral Biol 32, 123–127 (1987). [DOI] [PubMed] [Google Scholar]
- 10.Vainio S, Karavanova I, Jowett A, Thesleff I, Identification of BMP-4 as a signal mediating secondary induction between epithelial and mesenchymal tissues during early tooth development. Cell 75, 45–58 (1993). [PubMed] [Google Scholar]
- 11.Thesleff I, Vaahtokari A, Partanen AM, Regulation of organogenesis. Common molecular mechanisms regulating the development of teeth and other organs. Int. J. Dev. Biol 39, 35–50 (1995). [PubMed] [Google Scholar]
- 12.Jernvall J, Kettunen P, Karavanova I, Martin LB, Thesleff I, Evidence for the role of the enamel knot as a control center in mammalian tooth cusp formation: Nondividing cells express growth stimulating Fgf-4 gene. Int. J. Dev. Biol 38, 463–469 (1994). [PubMed] [Google Scholar]
- 13.Davidson EH, Emerging properties of animal gene regulatory networks. Nature 468, 911–920 (2010). [DOI] [PMC free article] [PubMed] [Google Scholar]
- 14.Atilla-Gokcumen GE, Williams DS, Bregman H, Pagano N, Meggers E, Organometallic compounds with biological activity: A very selective and highly potent cellular inhibitor for glycogen synthase kinase 3. Chembiochem 7, 1443–1450 (2006). [DOI] [PubMed] [Google Scholar]
- 15.Tomlins SA, Mehra R, Rhodes DR, Cao X, Wang L, Dhanasekaran SM, Kalyana-Sundaram S, Wei JT, Rubin MA, Pienta KJ, Shah RB, Chinnaiyan AM, Integrative molecular concept modeling of prostate cancer progression. Nat. Genet 39, 41–51 (2007). [DOI] [PubMed] [Google Scholar]
- 16.Peters H, Neubüser A, Kratochwil K, Balling R, Pax9-deficient mice lack pharyngeal pouch derivatives and teeth and exhibit craniofacial and limb abnormalities. Genes Dev. 12, 2735–2747 (1998). [DOI] [PMC free article] [PubMed] [Google Scholar]
- 17.Chen Y, Bei M, Woo I, Satokata I, Maas R, Msx1 controls inductive signaling in mammalian tooth morphogenesis. Development 122, 3035–3044 (1996). [DOI] [PubMed] [Google Scholar]
- 18.Zhou P, Byrne C, Jacobs J, Fuchs E, Lymphoid enhancer factor 1 directs hair follicle patterning and epithelial cell fate. Genes Dev. 9, 700–713 (1995). [DOI] [PubMed] [Google Scholar]
- 19.Kratochwil K, Dull M, Farinas I, Galceran J, Grosschedl R, Lef1 expression is activated by BMP-4 and regulates inductive tissue interactions in tooth and hair development. Genes Dev. 10, 1382–1394 (1996). [DOI] [PubMed] [Google Scholar]
- 20.Bei M, Kratochwil K, Maas RL, BMP4 rescues a non-cell-autonomous function of Msx1 in tooth development. Development 127, 4711–4718 (2000). [DOI] [PubMed] [Google Scholar]
- 21.Kratochwil K, Galceran J, Tontsch S, Roth W, Grosschedl R, FGF4, a direct target of LEF1 and Wnt signaling, can rescue the arrest of tooth organogenesis in Lef1−/− mice. Genes Dev. 16, 3173–3185 (2002). [DOI] [PMC free article] [PubMed] [Google Scholar]
- 22.Andl T, Ahn K, Kairo A, Chu EY, Wine-Lee L, Reddy ST, Croft NJ, Cebra-Thomas JA, Metzger D, Chambon P, Lyons KM, Mishina Y, Seykora JT, Crenshaw EB III, Millar SE, Epithelial Bmpr1a regulates differentiation and proliferation in postnatal hair follicles and is essential for tooth development. Development 131, 2257–2268 (2004). [DOI] [PubMed] [Google Scholar]
- 23.Plikus MV, Zeichner-David M, Mayer JA, Reyna J, Bringas P, Thewissen JGM, Snead ML, Chai Y, Chuong CM, Morphoregulation of teeth: Modulating the number, size, shape and differentiation by tuning Bmp activity. Evol. Dev 7, 440–457 (2005). [DOI] [PMC free article] [PubMed] [Google Scholar]
- 24.Liu W, Selever J, Murali D, Sun X, Brugger SM, Ma L, Schwartz RJ, Maxson R, Furuta Y, Martin JF, Threshold-specific requirements for Bmp4 in mandibular development. Dev. Biol 283, 282–293 (2005). [DOI] [PubMed] [Google Scholar]
- 25.Järvinen E, Salazar-Ciudad I, Birchmeier W, Taketo MM, Jernvall J, Thesleff I, Continuous tooth generation in mouse is induced by activated epithelial Wnt/β-catenin signaling. Proc. Natl. Acad. Sci. U.S.A 103, 18627–18632 (2006). [DOI] [PMC free article] [PubMed] [Google Scholar]
- 26.Liu F, Chu EY, Watt B, Zhang Y, Gallant NM, Andl T, Yang SH, Lu MM, Piccolo S, Schmidt-Ullrich R, Taketo MM, Morrisey EE, Atit R, Dlugosz AA, Millar SE, Wnt/β-catenin signaling directs multiple stages of tooth morphogenesis. Dev. Biol 313, 210–224 (2008). [DOI] [PMC free article] [PubMed] [Google Scholar]
- 27.Xu X, Han J, Ito Y, Bringas P Jr., Deng C, Chai Y, Ectodermal Smad4 and p38 MAPK are functionally redundant in mediating TGF-β/BMP signaling during tooth and palate development. Dev. Cell 15, 322–329 (2008). [DOI] [PMC free article] [PubMed] [Google Scholar]
- 28.Wang XP, O’Connell DJ, Lund JJ, Saadi I, Kuraguchi M, Turbe-Doan A, Cavallesco R, Kim H, Park PJ, Harada H, Kucherlapati R, Maas RL, Apc inhibition of Wnt signaling regulates supernumerary tooth formation during embryogenesis and throughout adulthood. Development 136, 1939–1949 (2009). [DOI] [PMC free article] [PubMed] [Google Scholar]
- 29.Chen J, Lan Y, Baek JA, Gao Y, Jiang R, Wnt/β-catenin signaling plays an essential role in activation of odontogenic mesenchyme during early tooth development. Dev. Biol 334, 174–185 (2009). [DOI] [PMC free article] [PubMed] [Google Scholar]
- 30.Fujimori S, Novak H, Weissenböck M, Jussila M, Gonçalves A, Zeller R, Galloway J, Thesleff I, Hartmann C, Wnt/β-catenin signaling in the dental mesenchyme regulates incisor development by regulating Bmp4. Dev. Biol 348, 97–106 (2010). [DOI] [PMC free article] [PubMed] [Google Scholar]
- 31.Li L,Lin M, Wang Y, Cserjesi P, Chen Z, Chen Y, BmprIa is required in mesenchymal tissue and has limited redundant function with BmprIb in tooth and palate development. Dev. Biol 349, 451–461 (2011). [DOI] [PMC free article] [PubMed] [Google Scholar]
- 32.Sarkar L, Sharpe PT, Expression of Wnt signalling pathway genes during tooth development. Mech. Dev. 85, 197–200 (1999). [DOI] [PubMed] [Google Scholar]
- 33.Lu R, Markowetz F, Unwin RD, Leek JT, Airoldi EM, MacArthur BD, Lachmann A, Rozov R, Ma’ayan A, Boyer LA, Troyanskaya OG, Whetton AD, Lemischka IR, Systems-level dynamic analyses of fate change in murine embryonic stem cells. Nature 462, 358–362 (2009). [DOI] [PMC free article] [PubMed] [Google Scholar]
- 34.Lander AD, Gokoffski KK, Wan FYM, Nie Q, Calof AL, Cell lineages and the logic of proliferative control. PLoS Biol. 7, e1000015 (2009). [DOI] [PMC free article] [PubMed] [Google Scholar]
- 35.Kirouac DC, Ito C, Csaszar E, Roch A, Yu M, Sykes EA, Bader GD, Zandstra PW, Dynamic interaction networks in a hierarchically organized tissue. Mol. Syst. Biol 6, 417 (2010). [DOI] [PMC free article] [PubMed] [Google Scholar]
- 36.Huang S, Cell lineage determination in state space: A systems view brings flexibility to dogmatic canonical rules. PLoS Biol. 8, e1000380 (2010). [DOI] [PMC free article] [PubMed] [Google Scholar]
- 37.Mishina Y, Hanks MC, Miura S, Tallquist MD, Behringer RR, Generation of Bmpr/Alk3 conditional knockout mice. Genesis 32, 69–72 (2002). [DOI] [PubMed] [Google Scholar]
- 38.Dassule HR, Lewis P, Bei M, Maas R, McMahon AP, Sonic hedgehog regulates growth and morphogenesis of the tooth. Development 127, 4775–4785 (2000). [DOI] [PubMed] [Google Scholar]
- 39.Purcell P, Joo BW, Hu JK, Tran PV, Calicchio ML, O’Connell DJ, Maas RL, Tabin CJ, Temporomandibular joint formation requires two distinct hedgehog-dependent steps. Proc. Natl. Acad. Sci. U.S.A 106, 18297–18302 (2009). [DOI] [PMC free article] [PubMed] [Google Scholar]
- 40.Närhi K, Thesleff I, Explant culture of embryonic craniofacial tissues: Analyzing effects of signaling molecules on gene expression. Methods Mol. Biol 666, 253–267 (2010). [DOI] [PubMed] [Google Scholar]
- 41.Gerami-Naini B, Dovzhenko OV, Durning M, Wegner FH, Thomson JA, Golos TG, Trophoblast differentiation in embryoid bodies derived from human embryonic stem cells. Endocrinology 145, 1517–1524 (2004). [DOI] [PubMed] [Google Scholar]
- 42.Du P, Kibbe WA, Lin SM, lumi: A pipeline for processing Illumina microarray. Bioinformatics 24, 1547–1548 (2008). [DOI] [PubMed] [Google Scholar]
- 43.Eklund AC, Turner LR, Chen P, Jensen RV, deFeo G, Kopf-Sill AR, Szallasi Z, Replacing cRNA targets with cDNA reduces microairay cross-hybridization. Nat. Biotechnol 24, 1071–1073 (2006). [DOI] [PubMed] [Google Scholar]
- 44.Johnson WE, Li C, Rabinovic A, Adjusting batch effects in microarray expression data using empirical Bayes methods. Biostatistics 8, 118–127 (2007). [DOI] [PubMed] [Google Scholar]
- 45.Smyth GK, Linear models and empirical Bayes methods for assessing differential expression in microarray experiments. Stat. Appl. Genet. Mol. Biol 3, Article3 (2004). [DOI] [PubMed] [Google Scholar]
- 46.Benjamini Y, Hochberg Y, Controlling the false discovery rate: A practical and powerful approach to multiple testing. J. R. Stat. Soc. Ser. B Stat. Methodol 57, 289–300 (1995). [Google Scholar]
- 47.Lee E, Chuang HY, Kim JW, Ideker T, Lee D, Inferring pathway activity toward precise disease classification. PLoS Comput. Biol 4, e1000217 (2008). [DOI] [PMC free article] [PubMed] [Google Scholar]
- 48.Shannon P,Mariciel A, Ozier O, Baliga NS, Wang JT, Ramage D, Amin N, Schwikowski B, Ideker T, Cytoscape: A software environment for integrated models of biomolecular interaction networks. Genome Res. 13, 2498–2504 (2003). [DOI] [PMC free article] [PubMed] [Google Scholar]
- 49.Mendes P, Sha W, Ye K, Artificial gene networks for objective comparison of analysis algorithms. Bioinformatics 19, ii122–ii129 (2003). [DOI] [PubMed] [Google Scholar]
Associated Data
This section collects any data citations, data availability statements, or supplementary materials included in this article.
Supplementary Materials
Text S1. Quality assessment of microarray data.
Text S2. Comparison with qualitative gene expression data from the BITE-IT database.
Text S3. Construction of a gene regulatory network from perturbation data.
Text S4. Simulation of the Wnt-Bmp feedback circuit.
Fig. S1. LCM workflow.
Fig. S2. Principal components analysis of time series gene expression profiles.
Fig. S3. Analysis of gene expression concordance between epithelium and mesenchyme with the LCM and manually dissected time course data sets.
Fig. S4. Average scaled gene expression patterns of different signaling pathway components.
Fig. S5. Expression dynamics of representative extracellular signaling molecules and receptors (Bmp, Wnt, Fgf, and Shh pathways).
Fig. S6. Heat maps of average expression of cellular components in different signaling pathways.
Fig. S7. A schematic illustration of the construction of a molecular concept map.
Fig. S8. Molecular concept maps showing significant overlap between various sets of differentially regulated genes.
Fig. S9. Epithelial and mesenchymal gene regulatory networks reconstructed using our probabilistic method.
Fig. S10. An expanded view of the Wnt-Bmp feedback circuit.
Fig. S11. Constitutive canonical Wnt signaling induces supernumerary tooth development in the absence of Pax9.
Fig. S12. Coronal sections of molar regions from control, Pax9-null, epithelial Apc loss-of-function, and compound epithelial Apc loss-of-function; Pax9-null mutants at E14.0.
Fig. S13. Constitutive canonical Wnt signaling induces supernumerary tooth formation in the absence of Msx1.
Fig. S14. Coronal sections of molar regions from control, Msx1-null, epithelial Apc loss-of-function, and compound epithelial Apc loss-of-function; Msx1-null mutants at E14.0.
Fig. S15. Constitutive canonical Wnt signaling fails to induce tooth formation in the absence of epithelial Bmpr1a.
Fig. S16. qRT-PCR expression analysis at E14.5 in the isolated epithelium of epithelial Apc loss-of-function and of compound epithelial Apc loss-of-function; Bmpr1a loss-of-function mutants.
Fig. S17. Coronal sections of molar regions from control, epithelial Apc loss-of-function, epithelial Bmpr1a loss-of-function, and compound epithelial Apc loss-of-function; Bmpr1a loss-of-function mutants at E14.0.
Table S1. Comparison of BITE-IT and microarray data from this study.
Table S2. Gene sets used in this study.
Table S3. Custom gene sets used in this study.
References