

Abstract
Immune checkpoint blockade has revolutionized the field of oncology, inducing durable anti-tumour immunity in solid tumours. In patients with advanced prostate cancer, immunotherapy treatments have largely failed1–5. Androgen deprivation therapy is classically administered in these patients to inhibit tumour cell growth, and we postulated that this therapy also affects tumour-associated T cells. Here we demonstrate that androgen receptor (AR) blockade sensitizes tumour-bearing hosts to effective checkpoint blockade by directly enhancing CD8 T cell function. Inhibition of AR activity in CD8 T cells prevented T cell exhaustion and improved responsiveness to PD-1 targeted therapy via increased IFNγ expression. AR bound directly to Ifng and eviction of AR with a small molecule significantly increased cytokine production in CD8 T cells. Together, our findings establish that T cell intrinsic AR activity represses IFNγ expression and represents a novel mechanism of immunotherapy resistance.
Sex-dependent differences in response to immunotherapy have been reported6, and in metastatic castration-resistant prostate cancer (mCRPC), checkpoint blockade therapy has largely failed1–5,7. Despite evidence that androgens suppress T cell function and IFNγ production8, it is unclear whether sex hormones can directly impact the effectiveness of T cell-targeted cancer immunotherapies. The mainstay of treatment for incurable prostate cancer is androgen deprivation therapy (ADT), which can be accomplished medically (GnRH agonists or antagonists) or surgically (bilateral orchiectomy), as well as by AR antagonists. Although therapy is intended to target tumour cells, T cells express sex hormone receptors including AR9–11. Since clinical response in cancer immunotherapy trials has been associated with a strong intratumour IFNγ signature before initiation of immunotherapy12–14, we postulated that one mechanism of immunotherapy resistance could be through androgen-mediated repression of IFNγ. Notably, AR inhibition with PD-1 blockade (NCT02312557) (Extended Data Fig. 1a, b) resulted in a response rate of 18%, challenging the paradigm that immunotherapy would not work in patients with advanced prostate cancer15,16. This clinical response raised the possibility that AR inhibition had directly or indirectly enabled T cells to respond to PD-1 inhibition.
Immune landscape of mCRPC
We performed single-cell RNA sequencing (scRNA-seq) on cells isolated from eight individual metastatic tumour lesions from men with mCRPC who had biochemical or radiographic progression on enzalutamide prior to treatment with pembrolizumab. This included three responders and five non-responders, with response defined by a prostate-specific antigen (PSA) decline of > 25% upon immune checkpoint blockade (Extended Data Fig. 1b). Biopsies were obtained and tumour-infiltrating leukocytes (TILs) sorted (Extended Data Fig. 2a). We merged cells from all patients and clustered the data into tumour cell and major lymphoid and myeloid immune cell subsets (Fig. 1a, Extended Data Fig. 2b, c, Supplementary Table 1). Although responders and non-responders showed widespread heterogeneity (Extended Data Fig. 2c), there was no significant difference in CD4 T, CD8 T, natural killer (NK), B cell, or myeloid cell proportions or tumour mutational burden to explain the overall response to checkpoint therapy (Extended Data Figs. 1c, 2d). Consistent with other reports, all responders exhibited abundant CD8 T cells among total leukocytes17,18 (Extended Data Fig. 2d). Two out of the five non-responders showed an abundance of CD8 T cells (Extended Data Fig. 2d), indicating that tumour-associated CD8 T cell abundance was insufficient to stratify responders from non-responders. We also noted the wide distribution of B cells and monocytes in non-responders compared to responders; an observation that is under further investigation.
Fig. 1 |. The immune landscape of tumours from patients with mCRPC prior to checkpoint therapy.
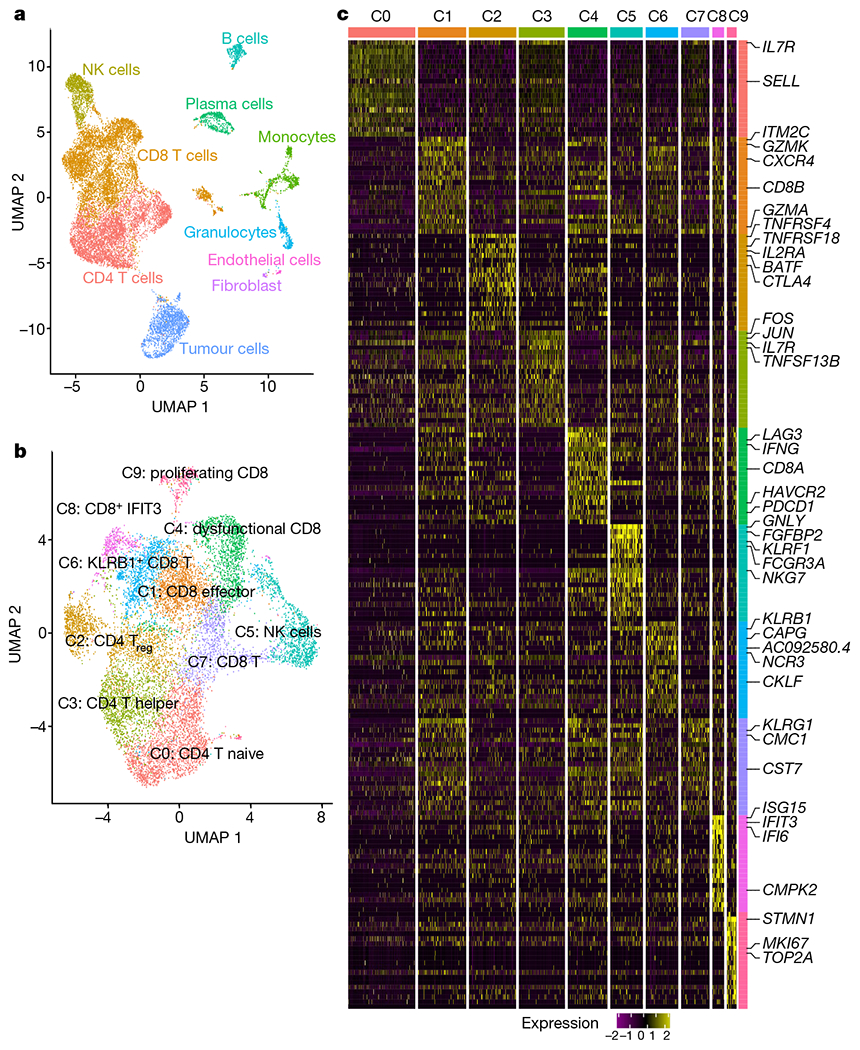
a, Uniform manifold approximation and projection (UMAP) of all cells that passed quality control (n = 16,044 cells). Cells are coloured on the basis of cell type. b, UMAP of all T and NK cells collected in this study with cells coloured by cell type (n = 12,073 cells). c, Heat map showing scaled expression of the top 20 cell markers ranked by fold change in each cluster in b. Colours represent cell types as in b. A list of representative genes is shown on the right.
Unsupervised clustering of all T and NK cells yielded three CD4 clusters, six CD8 clusters, and one NK cell cluster (Fig. 1b, c). Among the different subsets, responder lesions were enriched for CD8 T cells expressing genes associated with antigen encounter and dysfunction (C4 cluster, P = 0.057 two-tailed unpaired Student’s t-test; Extended Data Fig. 2e) as noted by higher transcripts of PDCD1, LAG3, HAVCR2, TIGIT and IFNG (Fig. 1c, Extended Data Fig. 2f, Supplementary Table 2). Pathway analysis revealed enrichment of T cell receptor (TCR) signalling and PD-1 signalling in the C4 cluster (Extended Data Fig. 2g), consistent with TCR signalling inducing transcripts shared by activated and exhausted CD8 T cells19 (Extended Data Fig. 2h). Together, these data revealed multiple lymphocyte subsets in mCRPC lesions. To understand whether androgen signalling could limit immunotherapy efficacy, we focused our analysis on CD8 T cells because of their critical role in PD-1 targeted immunotherapy.
Unbiased CD8 T cell states
Given that two non-responder lesions were abundantly infiltrated with CD8 T cells, we considered whether a T cell intrinsic state correlated with response, as reported in non-prostate tumour studies12–14. Considering two therapeutic outcomes to PD-1 blockade, response or non-response, we performed unsupervised clustering of CD8 T cells from all eight patients to define two transcriptomic states (Fig. 2a). CD8 k1 cells (k-means cluster 1 CD8 T cells) had higher expression of inhibitory genes, and genes associated with cytotoxicity, and MHC II class, and CD8 k2 cells (k-means cluster 2 CD8 T cells) had increased expression of heat-shock genes (Fig. 2b, Supplementary Table 3). CD8 k2 cells also exhibited enhanced expression of BTG1 and BTG2 (Fig. 2b), which have been shown to be involved in the maintenance of T cell quiescence20. The unsupervised k-means clusters, CD8 k1 and CD8 k2, very closely overlapped with CD8 T cells from responders (CD8 R) and non-responders (CD8 NR) (Fig. 2c) in both cell-population and gene-expression profiles (Fig. 2b, d, Extended Data Fig. 3a, Supplementary Table 3). Furthermore, previously reported genes associated with a CD8 T cell state associated with response to PD-1 blockade (that is, TOX, TCF7, FOXP1 and BCL2) were minimally expressed in CD8 k1 and CD8 R (Extended Data Fig. 3c, d). Although both CD8 T cell states existed in responders and non-responders, CD8 k1 cells were enriched in responder biopsies (Extended Data Fig. 3b). Importantly, similar to some non-responder lesions containing an abundance of CD8 T cells (Extended Data Fig. 2c, d), we also observed that some non-responder lesions contained CD8 k1 cells but failed to respond to PD-1 targeted therapy (Extended Data Fig. 3b). Notably, some non-responder lesions were enriched for monocytic cells (Extended Data Fig. 2c, d) compared with responders. CD4 T cells did not exhibit clear states that were associated with response (Extended Data Fig. 4a–c).
Fig. 2 |. CD8 T cell signature associated with response implicates a functional role for AR.
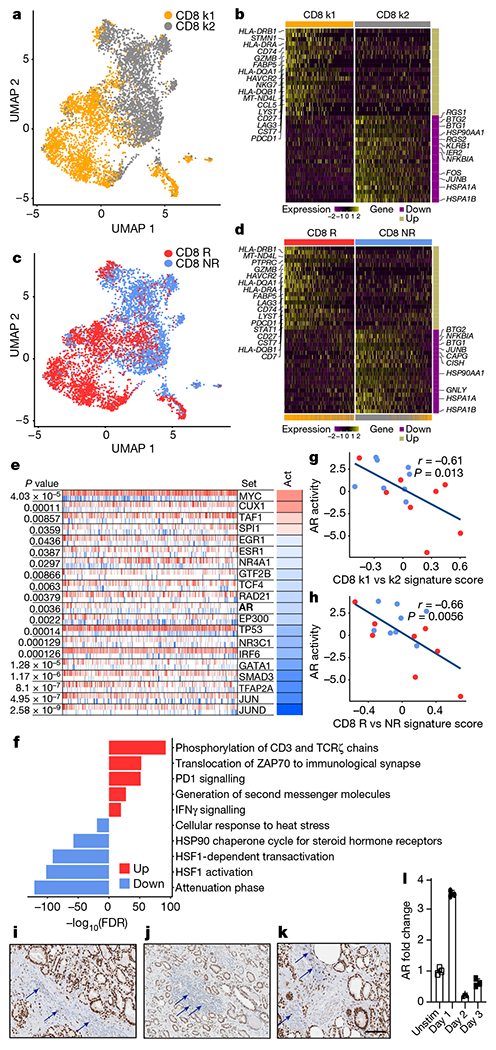
a, Unsupervised k-means clustering (n = 5,664 cells) of CD8 T cells. b, Scaled expression of top 20 differentially expressed genes ranked by fold change between CD8 k1 and CD8 k2 cells. c, UMAP plot showing CD8 T cells coloured by clinical response (CD8 R and CD8 NR) (n = 5,664 cells). d, Scaled expression of the top 20 differentially expressed genes ranked by fold change between CD8 R and CD8 NR T cells. e, Master regulator analysis to identify transcription factors whose activity is different between CD8 R and CD8 NR T cells. The top 20 transcription factors predicted to be most activated (red) or deactivated (blue) in CD8 R versus CD8 NR T cells. Tick marks depict targets of transcription factors that are positively (red) or negatively (blue) regulated. Act, inferred differential activity for each transcription factor. f, Pathway analysis of the top 10 molecular signatures distinguishing CD8 R versus CD8 NR T cells. g, h, Correlation between CD8 k1 versus CD8 k2 signature score (g) or CD8 R versus CD8 NR signature score (h) with AR activity in individual patients on our trial (n = 16 patients, from whom bulk RNA-seq but no single-cell RNA-seq data were available). Each dot represents data from 1 patient. Red, responder; blue, non-responder. Two-tailed Pearson correlation. i–k, Immunohistochemistry of AR in tumours from patients with treatmentnaive prostate cancer, Gleason grades 4 + 3 (i), 3 + 3 (j) and 3 + 4 (k). Arrows indicate positive AR expression in immune cells. l, Kinetics of AR expression in purified human CD8 T cells after TCR stimulation. Individual data points represent technical replicates from one experiment. Data depict one representative experiment of two experiments; two donors of peripheral blood mononuclear cells (PBMC). Data are mean ± s.d. k1, k-means cluster 1; k2, k-means cluster 2.
To define features associated with response in CD8 T cells, we computed differentially expressed genes between CD8 T cells from responders and non-responders (Fig. 2d, Supplementary Table 3) and performed master regulator (MR) analysis. This algorithm infers differentially activated transcription factors in a defined gene signature (that is, CD8 R versus CD8 NR) on the basis of the enrichment of each transcription factor’s gene targets21,22. This analysis predicted the deactivation of multiple transcription factors, including AR, in responder CD8 T cells (Fig. 2e).
Next, we queried the biological processes enriched in CD8 T cells from responders versus non-responders. This analysis associated clinical PSA response with activation of pathways in CD8 T cells including TCR, PD-1 and IFNγ signalling (Fig. 2f). The increase in these pathways corresponded with the deactivation of the NR4A1 pathway (Fig. 2e), a transcription factor reported to limit the function of tumour-specific CD8 T cells and anti-PD-1 antibody targeted immunotherapy23. Resistance to PD-1 blockade was associated with an increase in the HSP90 steroid hormone receptor pathway (Fig. 2f), a chaperone protein that can facilitate AR function. Together, these data revealed distinct CD8 T cell states associated with response and resistance to PD-1 blockade and suggested that AR downregulation in CD8 T cells was correlated with improved function. To corroborate this hypothesis in an independent dataset, we derived a single-cell gene signature from differentially expressed genes between CD8 k1 and CD8 k2, or between CD8 R and CD8 NR and applied this to bulk RNA sequencing data from metastatic biopsies from patients. This approach revealed a negative correlation between single-cell signatures and AR signalling on the basis of either the CD8 k1 (Fig. 2g) or CD8 R cell states (Fig. 2h), which further suggested that favourable T cell signatures associated with low AR signalling, a state more likely to respond to PD-1 blockade.
Considering that our data suggested that AR signalling in CD8 T cells negatively correlated with cell function and response to immunotherapy, we evaluated whether there was evidence of lymphocytes expressing AR within biopsies from prostate cancer patients. In fact, in routine AR staining, we observed AR positive TILs in multiple patients including non-tumour tissue (Fig. 2i, j, k, Supplemental Fig. 1). Furthermore, AR mRNA was detectable in human CD8 T cells by quantitative PCR, and increased after TCR stimulation (Fig. 2l).
AR and PD-L1 blockade reduce tumours
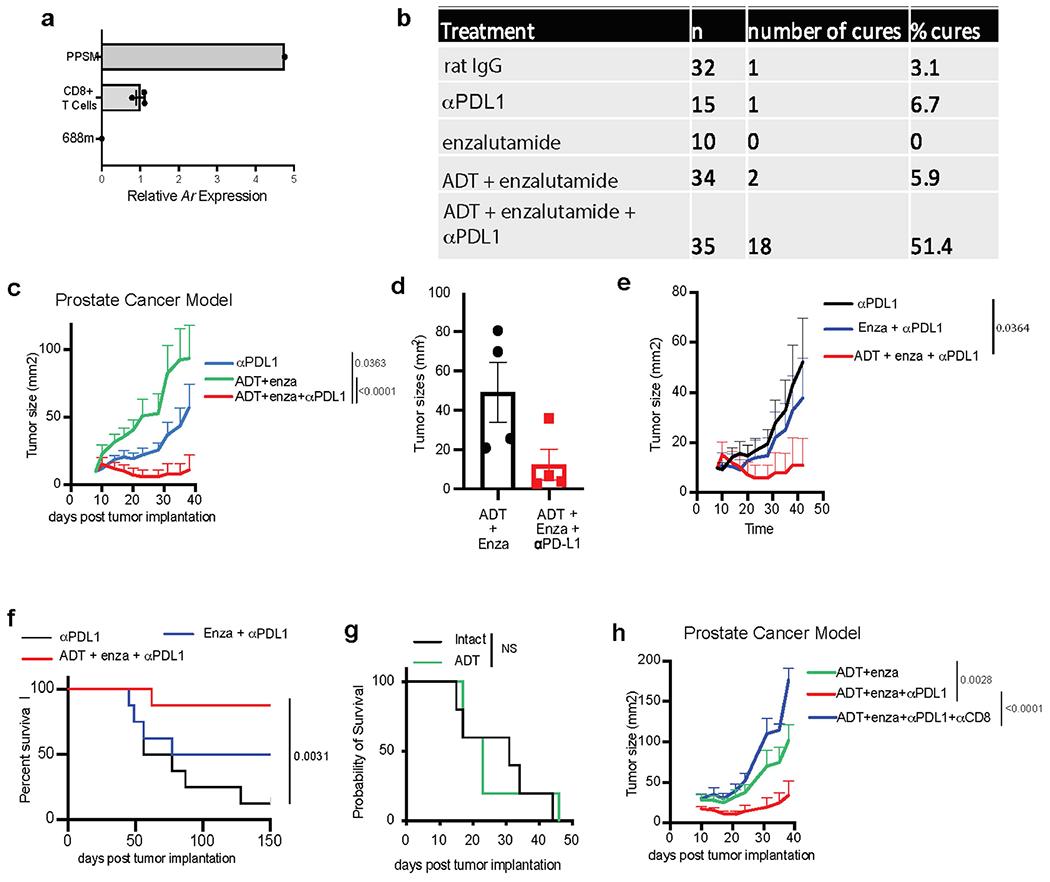
Low AR activity in CD8 T cells appeared to contribute to effective PD-1/PD-L1 blockade in patients with prostate cancer. To determine whether AR perturbation with enzalutamide would enable effective PD-1 axis targeted therapy in mouse tumour models, we confirmed mouse CD8 T cells express Ar (Extended Data Fig. 5a), then implanted male mice subcutaneously with an ADT and anti-PD-1-resistant prostate tumour (Pten−/−; p53−/−; Smad4−/− PPSM)24. Following tumour initiation, mice either underwent surgical ADT or were left intact and were treated with enzalutamide and/or anti-PD-L1 antibodies (Fig. 3a). Although therapy with anti-PD-L1 antibody alone or ADT plus enzalutamide had a minimal effect on tumour growth, ADT plus enzalutamide with anti-PD-L1 antibodies led to significant tumour regression and increased overall survival (Fig. 3b, Extended Data Fig. 5b, c). Similar synergy was observed in orthotopic PPSM tumours (Extended Data Fig. 5d). Anti-PD-L1 antibodies plus enzalutamide without ADT was not as effective as anti-PD-L1 antibodies plus enzalutamide with ADT (Extended Data Fig. 5e, f), suggesting that the functional perturbation of AR with enzalutamide together with reduced testosterone was critical for optimal effect. Of note, ADT alone had no effect on tumour growth (Extended Data Fig. 5g). Given the crucial importance of CD8 T cells in effective PD-1-targeted immunotherapy17, we depleted CD8 T cells from tumour-bearing mice and observed a loss of tumour control with combination therapy (Fig. 3c, Extended Data Fig. 5h). Last, male mice implanted with Ar-negative sarcoma tumours were treated with single or combination therapy. We observed that ADT plus enzalutamide also sensitized these mice to anti-PD-L1 antibody therapy (Fig. 3d), suggesting a direct effect of ADT and enzalutamide on immune cells in the tumour.
Fig. 3 |. Dual inhibition of AR and PD-1/PD-L1 improves T cell function and overall survival in mouse tumour models.
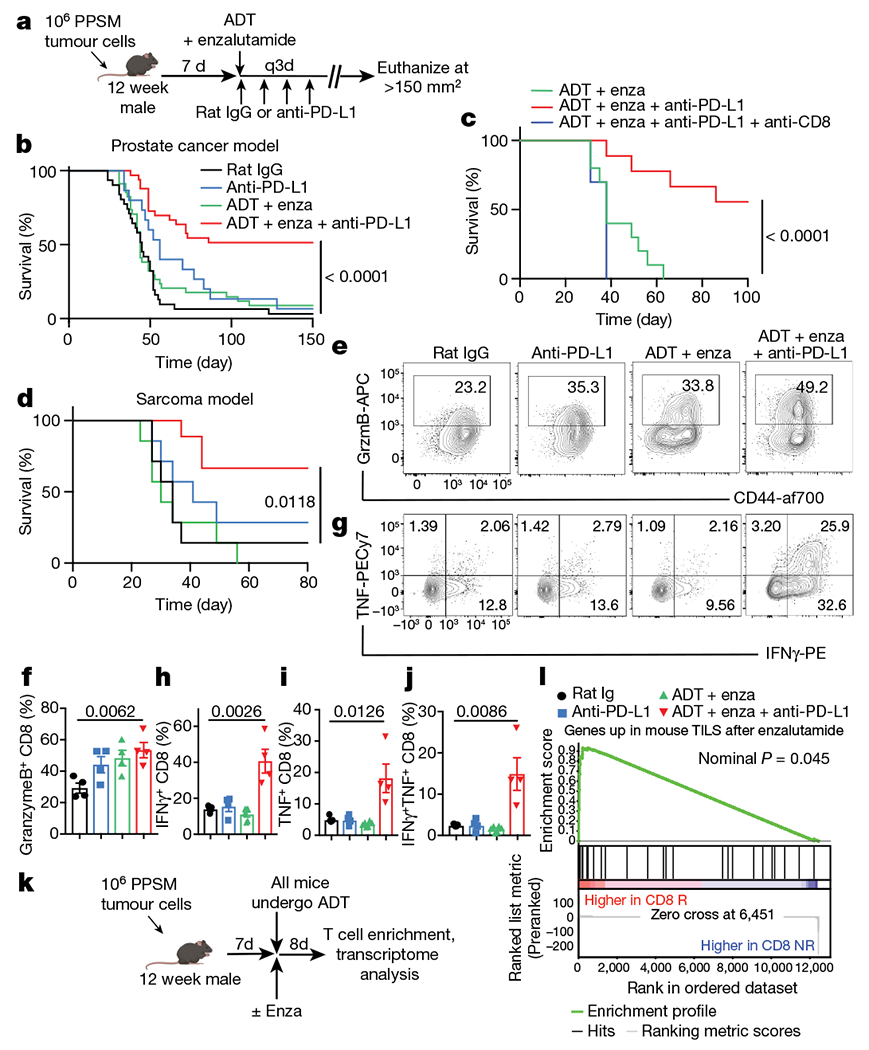
a, Experimental design for mouse tumour model (created with BioRender.com). q3d, dose given every three days. b, Survival curves of PPSM tumour-bearing mice treated as indicated. Data combined from 4 independent experiments, 8 to 10 mice per group per experiment. Enza, enzalutamide. c, Survival curves of PPSM tumour-bearing mice treated with combination therapy and anti-CD8 depleting antibody (10 mice per group). Data depict one representative experiment of two experiments. d, Survival curves of MCA-205 tumour-bearing mice treated as in a. Data depict one representative experiment of two experiments, 8 mice per group. e–j, PPSM tumour-bearing mice were treated as in a and tumours were collected the day after the third anti-PD-L1 antibody treatment. e, CD44 and granzyme B expression in CD8 TILs. f, Percentage of granzyme B+ CD8 T cells. g, IFNγ and TNF expression in CD8 TILs. h–j, Percentage of IFNγ+ (h), TNF+ (i) and IFNγ+TNF+ ( j) CD8 TILs. Data representative of three independent experiments; three mice per group. k, Experimental design (created with Biorender.com). l, GSEA illustrating the association of AR-inhibited genes in mouse TILs with CD8 R single-cell signature (nominal P = 0.045, nonparametric permutation test). Data are mean ± s.e.m.; log-rank (Mantel–Cox) test was used for b–d. Two-tailed unpaired Student t-test was used for f and h–j.
AR inhibition improves T cell function
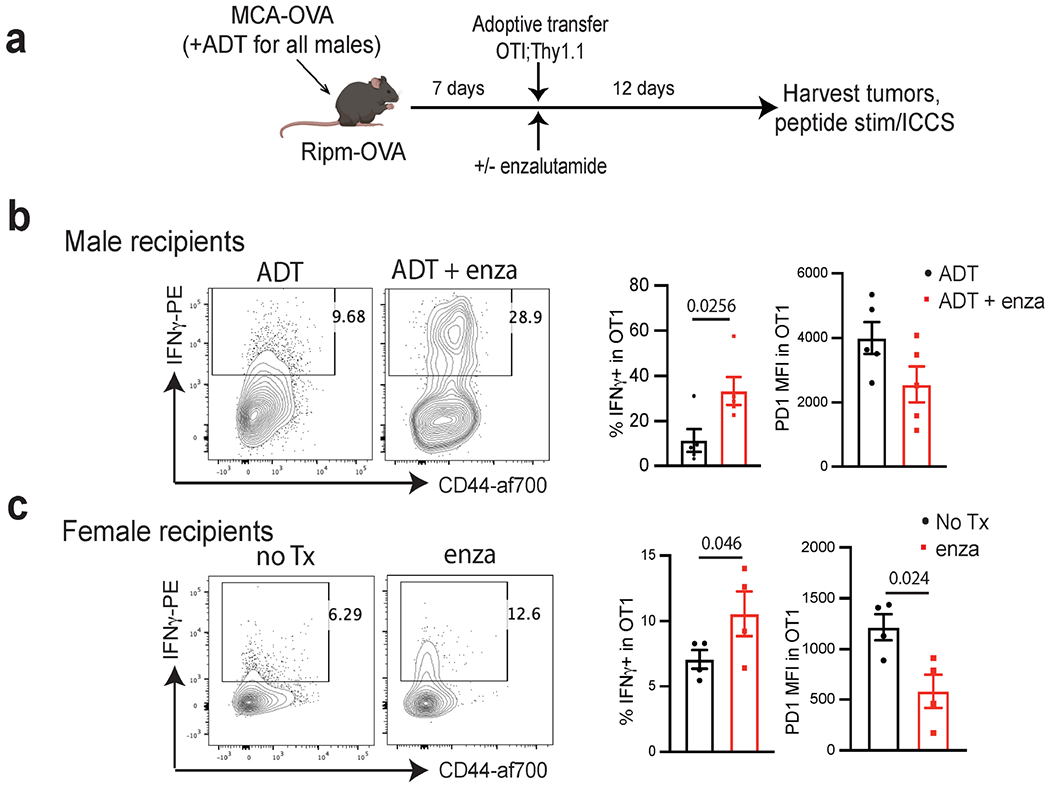
The total number of CD8 TILs was unchanged with monotherapy, but increased significantly with ADT plus enzalutamide plus anti-PD-L1 antibody treatment (Extended Data Fig. 6a), possibly reflecting an increase in proliferation of these cells (Extended Data Fig. 6b). The major difference between groups was the ability of CD8 TILs to produce effector cytokines. Production of granzyme B, IFNγ and TNF was significantly increased in T cells from mice treated with ADT plus enzalutamide plus anti-PD-L1 antibody (Fig. 3e–j). Critically, ADT plus enzalutamide or anti-PD-L1 antibody alone was insufficient to improve the polyfunctionality of tumour-associated CD8 T cells (Fig. 3e–j), suggesting that reduced AR signalling could establish a CD8 T cell state permissive to T cell re-invigoration through PD-1/PD-L1 blockade. Consistent with this idea, ADT plus enzalutamide slightly decreased the overall protein expression of PD-1 and CD44 (Extended Data Fig. 6c, d). Similar increases in cytokine production were observed in orthotopic PPSM tumours (Extended Data Fig. 6e–g) or via ADT with the GnRH antagonist degarelix instead of orchiectomy (Extended Data Fig. 6h–l). Notably, mice treated with enzalutamide plus anti-PD-L1 antibody in the absence of ADT showed a partial increase in T cell effector function (Extended Data Fig. 6m–o). Finally, we used a model of T cell adoptive therapy in male and female tumour-bearing mice. All male mice underwent ADT (degarelix) and were subsequently treated or not treated with enzalutamide (Extended Data Fig. 7a). In this model, enzalutamide treatment increased IFNγ production of tumour-antigen specific CD8 T cells in both male and female mice (Extended Data Fig. 7b, c).
To further investigate whether AR inhibition with enzalutamide plus ADT enhanced T cell function, we transcriptionally profiled T cells isolated from the tumour of orchiectomized mice implanted with PPSM tumours and treated with or without enzalutamide24 (Fig. 3k). Using the genes upregulated in T cells after enzalutamide treatment (Supplementary Table 4), we performed gene set enrichment analysis (GSEA) with the ranked gene list derived from CD8 R versus CD8 NR (Fig. 2d). These results showed that AR-inhibited genes in mouse TILs were significantly enriched in T cells from CD8 R patients (Fig. 3l).
T cell intrinsic AR represses IFNγ
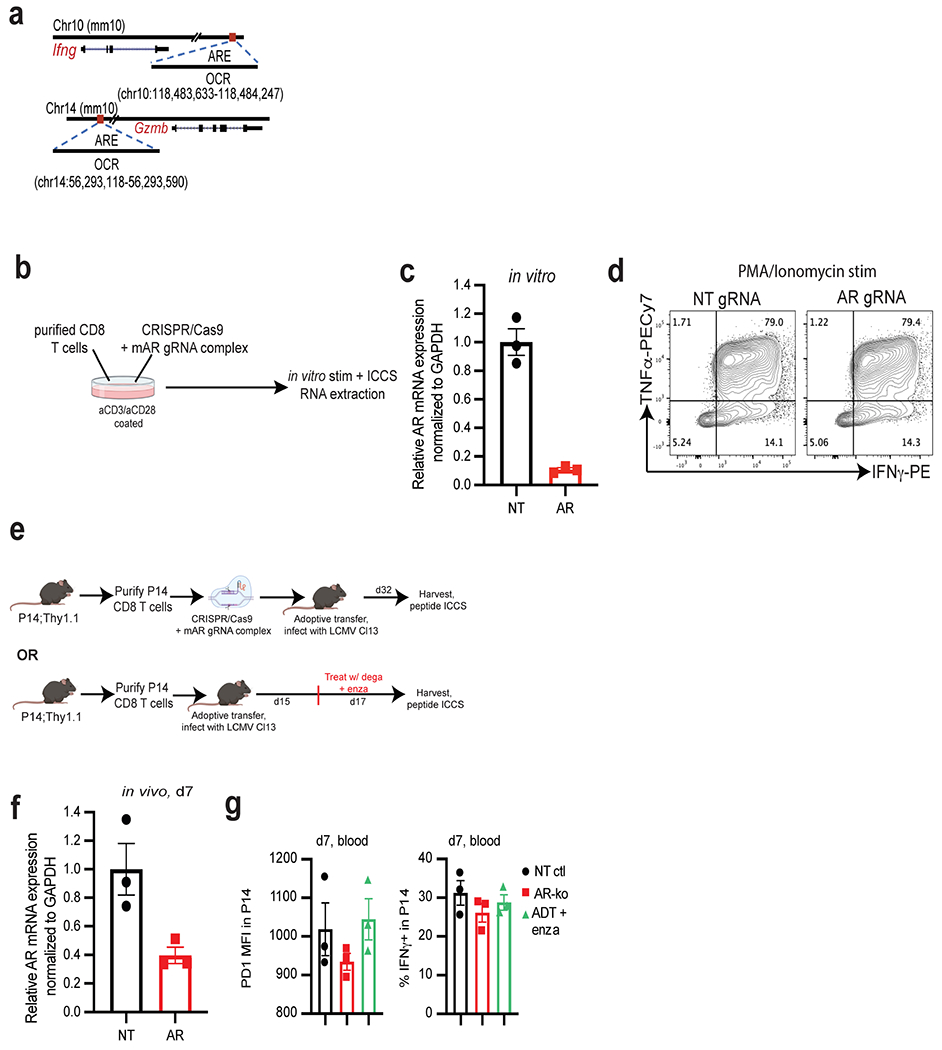
Effector memory CD8 T cells harbour open chromatin regions (OCRs) associated with Ifng and Gzmb25–27, which enable rapid production of IFNγ and granzyme B upon TCR ligation. We hypothesized that AR interacted with the Ifng and Gzmb genes in OCRs associated with functional state. To test this hypothesis, we screened OCRs in Ifng and Gzmb genes at either the CD8 effector or memory cell state28 for canonical androgen response elements (AREs) using the JASPAR database of transcription factor binding profiles29. We identified robust AREs in OCRs associated with Ifng (Extended Data Fig. 8a) in effector memory CD8 T cells (Supplementary Table 5) and in OCRs associated with Gzmb (Extended Data Fig. 8a).
To assess whether AR could be regulating CD8 T cell function through binding to the OCRs (Supplementary Table 5), we performed chromatin immunoprecipitation with quantitative PCR (ChIP–qPCR) of AR from activated T cells. AR bound Ifng and Gzmb OCRs (Fig. 4a), which was reduced by enzalutamide treatment (Fig. 4b). Together, this suggests that AR can directly bind and regulate the expression of Ifng, and that enzalutamide perturbs this by dislodging AR from the chromatin. To further investigate this observation, we deleted Ar from primary CD8 T cells30 and stimulated them for 3 days in vitro (Extended Data Fig. 8b–d) before performing RNA sequencing. We performed GSEA analysis on the ranked gene list generated by comparing Ar-deficient and -sufficient effector CD8 T cells and revealed significant enrichment of the hallmark IFNγ response in Ar-knockout CD8 T cells compared with wild-type controls (Fig. 4c). Moreover, the CD8 R signature was significantly enriched in Ar-knockout CD8 T cells (Fig. 4d).
Fig. 4 |. Suppressing AR function in T cells promotes IFNG activity.
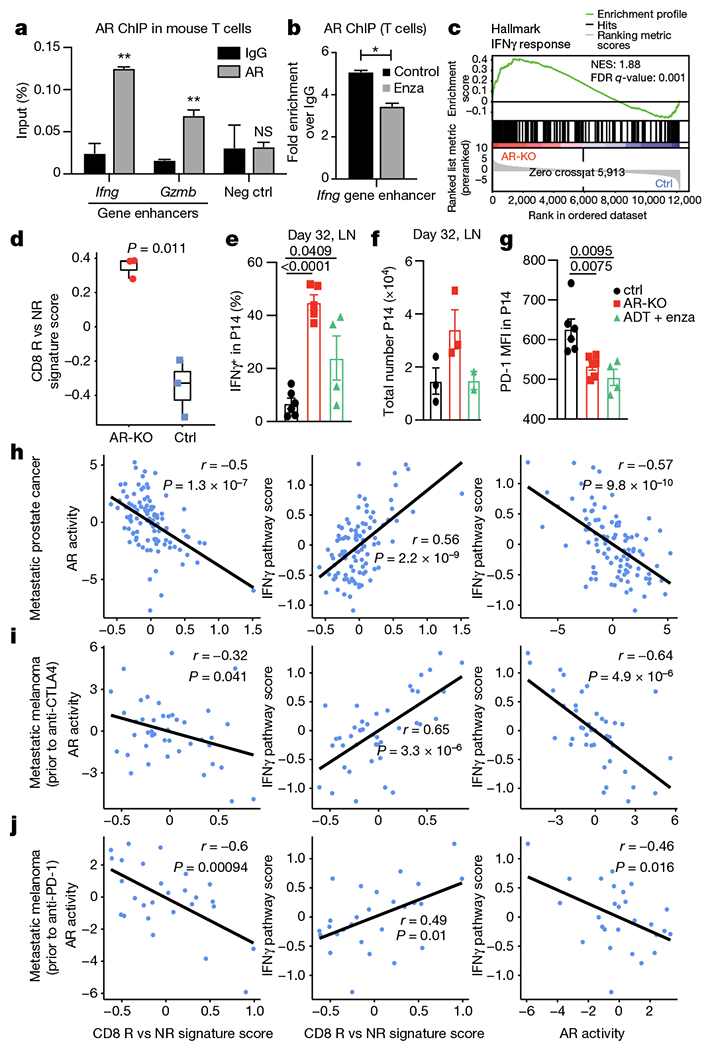
a, b, AR ChIP–qPCR data shows specific binding of AR to the predicted AREs of Ifng and Gzmb genes in activated mouse T cells (a) and the effect of enzalutamide on AR binding to these AREs (b). Data are representative of n = 3 independent experiments; unpaired Student t-test. c, GSEA illustrating the significant enrichment of IFNγ response in mouse Ar-knockout (AR-KO) versus control CD8 T cells (n = 3 biological replicates). NES, normalized enrichment score. d, Enrichment of the human CD8 R versus NR signature in mouse Ar-knockout versus control CD8 T cells. Two-tailed unpaired Student’s t-test. In box plots: centre line, median; box, interquartile range (IQR; the range between the 25th and 75th percentile); whiskers, 1.58 × IQR. e–g, Wild-type or Ar-KO P14 T cells were transferred into congenic recipients; recipients were infected with LCMV clone 13, and transferred T cells in the draining lymph nodes were assessed 32 days later for IFNγ+ (e), total number (f) and PD-1 mean fluorescence intensity (MFI) (g). h–j, Correlation between CD8 R versus NR signature score and AR activity (left) or IFNγ pathway activity (middle) and between AR activity and IFNγ pathway activity (right) in a larger mCRPC patient cohort (h; n = 99 patients) and two metastatic melanoma cohorts (i; n = 42 patients and j; n = 27 patients). Two-tailed Pearson correlation. LN, lymph node. Error bars represent s.e.m.; two-tailed unpaired Student t-test used in e–g.
On the basis of these observations, we hypothesized that loss of AR may protect chronically stimulated CD8 T cells from losing their capacity to make IFNγ31. To test this, we used a model of T cell exhaustion, the lymphocytic choriomeningitis virus 13 (LCMV Cl13) model32 (Extended Data Fig. 8e). The expression of Ar remained low in Ar-knockout CD8 T cells at day 7 after infection (Extended Data Fig. 8f). Notably, Ar-deficient CD8 T cells from P14 transgenic mice (hereafter, P14 T cells) were functionally equivalent at day 7 after infection (Extended Data Fig. 8g), but unlike control transgenic P14 T cells, they retained the capacity to produce IFNγ upon peptide stimulation more than 30 days after infection (Fig. 4e). Likewise, treatment of infected mice with ADT plus enzalutamide 2 weeks before collection partially restored IFNγ production in P14 T cells (Fig. 4e). Notably, there were more antigen-specific CD8 T cells (Fig. 4f) and PD-1 expression levels were lower when Ar was deleted (Fig. 4g).
Last, we evaluated whether the single-cell signature derived from features in CD8 R could delineate patients with mCRPC into ARlowIFNγhI and ARhIIFNγlow, which could be used as a biomarker to identify individuals who might benefit from PD-1 blockade. Indeed, we observed that our CD8 R signature negatively correlated with AR activity (Fig. 4h) and positively correlated with IFNγ pathway activity in a larger cohort of patients with mCRPC 33. Moreover, we postulated that this relationship between our CD8 R signature, IFNγ pathway activity and AR activity could be extended beyond prostate cancer, similar to the therapeutic synergy demonstrated in mouse models of sarcoma and adoptive T cell therapy (Fig. 3d, Extended Data Fig. 7). In two independent melanoma datasets from patients prior to treatment with anti-CTLA4 therapy34 (Fig. 4i) or anti-PD-1 therapy35 (Fig. 4j), we observed similar negative correlations between AR activity and CD8 R signature and IFNγ pathway activity. Together, our findings establish that T cell intrinsic AR activity is a mechanism of IFNγ suppression and immunotherapy resistance, limiting checkpoint blockade efficacy. We propose that in advanced prostate and immunotherapy-resistant cancer patients, intratumour androgens may represent a mechanism of resistance to therapy. Moreover, CD8 T cell intrinsic AR activity may serve as a useful biomarker for identifying patients who could achieve clinical benefit with PD-1/PD-L1 inhibitors.
Discussion
Androgens are described as suppressors of inflammation and immune function8,36–38, potentially contributing to a male bias in the incidence of cancers of nonreproductive organs39–44. Despite low levels of testosterone in the serum of patients with prostate cancer undergoing ADT, the metastatic tumour microenvironment remains enriched with sex hormones45–the source of which is under investigation46. Resistance to immunotherapy is a clinical challenge in patients with advanced prostate cancer, and common mechanisms of resistance to therapy do not explain the lack of durable anti-tumour T cell responses in this disease. Notably, a strong indicator of response to immunotherapy is IFNG expression within the tumour12–14 and androgens can suppress IFNG8. In this study, we leveraged a clinical trial that combined androgen-axis inhibition with checkpoint blockade to identify a novel mechanism of immunotherapy resistance. We note that our observations are restricted to a population of men with European ancestry and may not capture the variability in AR transcriptional activity reported among different ethnic groups47,48. Notably, in a single study of men of African descent, prostate tumour transcriptional analysis showed enrichment for genes associated with inflammation, including the IFNγ pathway49. In addition, sipuleucel-T therapy has higher activity in African Americans than in non-Hispanic white people50. This underscores the need to better understand how racial ancestry infuences hormone receptor biology and cancer immunotherapy outcomes. In addition, our findings provide a mechanistic understanding of how ADT might modify the T cell repertoire in patients with mCRPC51,52. Finally, our data reveal a T cell intrinsic role for AR regulation of IFNγ activity that limits anti-tumour immunity and T cell re-invigoration. The direct binding of AR to critical inflammatory gene enhancer regions provides insight into a mechanism of sexual dimorphism of immunity.
Online content
Any methods, additional references, Nature Research reporting summaries, source data, extended data, supplementary information, acknowledgements, peer review information; details of author contributions and competing interests; and statements of data and code availability are available at https://doi.org/10.1038/s41586-022-04522-6.
Methods
Patient samples
Patients with mCRPC enrolled in clinical trial NCT0231255715,16 underwent biopsy of a metastatic lesion at Oregon Health and Science University (Portland, OR). All patients had progressive disease on enzalutamide. Response to immune checkpoint inhibitor was defined by sustained reduction in PSA from baseline throughout treatment with PD-1 blockade of > 25%. All human investigations were carried out after approval by a local Human Investigations Committee and in accord with an assurance filed with and approved by the Department of Health and Human Services. Data has been anonymized to protect the privacy of the participants. Investigators obtained informed consent from each participant. For single-cell RNA-seq analysis, fresh needle biopsies prior to pembrolizumab infusion were collected from patients enrolled between September 2017 and January 2019 (n = 8 patients) which included three responders and five non-responders. Bulk RNA-seq libraries were made from flash frozen biopsies. Prostate, colon and tonsil tissue sections were obtained through the Knight Biolibrary in compliance with all applicable institutional policies, including Hospital and Clinics and Institutional Review Board (IRB) policies, and with state (Oregon Genetic Privacy Law) and federal (Common Rule and HIPAA Privacy and Security) regulations. AR protein expression was analysed using immunohistochemical analysis (AR (C6F11) XP Rabbit monoclonal antibody), on formalin-fixed, paraffin embedded tissue, using a biotin-free protocol53 (Ventana Ultraview). Images were scanned on a Leica Aperio AT2 digital slide imager.
Dissociation of human samples
Fresh isolated tumour samples were collected immediately upon biopsy and processed the same day. Tissue was first minced into small pieces using a scalpel and transferred to a 15 ml tube followed by digestion at room temperature in a shaker at 180 rpm for 30 min in 1 mg ml−1 collagenase type IV (Worthington Biochemicals), 100 μg ml−1 hyaluronidase (Sigma-Aldrich) and 20 mg ml−1 DNase (Roche) in PBS. Cells were then further disrupted with a 1 cm3 syringe plunger through a 70-μm nylon cell strainer (BD Biosciences) and filtered to obtain a single-cell suspension. Dissociated cells were stained with PE anti-human CD45 (Invitrogen, Clone HI30) for 30 min at 4 °C and subsequently washed three times with PBS + 1% FBS, resuspended, and counted for yield and viability by trypan blue.
Immune cell enrichment for single-cell RNA-seq
To enrich for leukocytes, FACS-sorting of live (Fixable viability dye eF780 negative), CD45 positive cells was performed on a BD Bioscience InFlux cell sorter. Fluidic pressure was minimized at less than 7 PSI and cells were sorted using a large flow nozzle. Sorted cells were collected into cold PBS + 1% FBS. This strategy was used for 7 of 8 samples. One sample used a PE anti-human CD45 magnetic enrichment and release strategy (Stemcell Technologies).
RNA-seq 10X Genomics library preparation and sequencing
The enriched immune cells are immediately proceeded for single-cell RNA-seq library preparation. Single-cell capturing and cDNA library generation were performed using the 10X genomics Chromium single-cell 3′ library construction kit v2 (catalogue (cat.) no. 120267) according to the manufacture’s instructions. Libraries were pooled prior to sequencing based on estimated number of cells in each library as determined by flow cytometry cell counts. Sequencing was performed following 10x Genomics instructions using NextSeq (Illumina) at the Massively Parallel Sequencing Shared Resource (MPSSR) at OHSU.
RNA and DNA isolation from fresh frozen OCT samples and sequencing
OCT samples were first cut with cryostat to remove excessive OCT as much as possible. The remaining tissue block was cut at 50 μm per section and immediately transfer to RiboZol (VWR, cat. no. N580). The tissues were incubated in RiboZol at room temperature with shaking every 3 min until the tissues were completely homogenized. The homogenate was centrifuged at 4 °C for 10 min at 12,000g and the supernatant was transferred to a new tube and proceeded with RNA isolation following the manufacturer’s instructions. DNA was isolated from the lower two layers after removal of the supernatant following the manufacturer’s instructions. RNA-seq library preparation and sequencing were performed by the MPSSR at OHSU. Whole-exome sequencing (WES) was performed by Novogene at a depth of 100×.
Mice, tumour models and antibodies
C57BL/6 (stock no. 000664), RIP-mOVA (stock no. 005431), OTI (stock no. 003831), C57Bl/6;CD90.1 (also known as Thy1.1) congenic mice (stock no. #000406) were purchased from the Jackson Laboratory. P14;Thy1.1 transgenic mice were obtained from the laboratory of S. Kaech. All mice were maintained under specific pathogen-free conditions in the Oregon Health and Science University (Portland, OR) animal facility. Mouse sample size estimates were determined using power analysis (power = 80% (tumour survival) or 90% (phenotyping) and a = 0.05) based on the mean and s.d. from our previous studies. Survival experiments used at least seven mice per group and phenotyping and functional studies at least three mice per group. Mice were randomly assigned to a treatment group based on the initial tumour size to create tumour-size balanced cohorts to eliminate tumour-size differences at the beginning of the experiments. Investigators were blinded to treatment groups during experiments and survival monitoring. Sexually mature 12-week-old males were used for the mouse Pten−/−; p53−/−; Smad4−/− (PPSM) castration-resistant prostate tumour model and 3′-methylcholanthrene (MCA) 205 sarcoma tumour model studies. PPSM (a gift from R. DePinho), MCA-205 cells (a gift from S. Shu) and MCA-205-OVA (a gift from M. Gough) were propagated in vitro using complete media, RPMI 1640 (Lonza) containing 0.292 ng ml−1 glutamine, 100 U ml−1 streptomycin/penicillin, 0.1 mM non-essential amino acids, 1 mM sodium pyruvate, and 10mM HEPES (Sigma-Aldrich) as previously described54–56. Cell lines were authenticated by genome and/or targeted sequencing and tested and confirmed to be mycoplasma and endotoxin-free using the MycoAlert Detection kit (Lonza). All culture media reagents were purchased from Hyclone Laboratories unless noted otherwise. Control rat IgG (mIgG1) and anti-PD-L1 (mIgG1, clone 80) antibodies were obtained from MedImmune (Astra Zeneca)57. Anti-PD-L1 antibodies were used in lieu of PD-1 blocking antibodies as previously described58. Mice were randomly assigned to treatment cohorts, and tumours were about 25 to 50 mm2 (by two-dimension caliper measurement) at the start of treatment. Any mouse with a tumour larger than 150 mm2 was euthanized per our guidelines from the Institutional Animal Care and Use Committee. No outliers were excluded from the data presented. All animal experiments were approved by the Institutional Animal Care and Use Committee of OHSU.
Tumour challenge, treatments and orchiectomy surgeries
One million PPSM or 0.5 × 10⁶ MCA-205 tumour cells were injected on the hind flank of 12-week old C57BL/6 male mice (8 mice per group for survival experiments or 3 per group for phenotyping experiments). On day 7 (survival) or day 14 (phenotyping) post tumour inoculation, the tumour-bearing mice were left intact, orchiectomized as previously described59, or treated with 0.5 μg of degarelix by subcutaneous injection once every 14 days. On the same day, mice were started on enzalutamide diet (50 mg kg−1 in Purina chow 5053, Research Diet, 0.25 mg per mouse per day) or control diet, and treated with 4 doses of 200 μg rat IgG or anti-PD-L1 antibodies 3 days apart (see Fig. 3d). For CD8 depletion studies, 200 μg anti-CD8α (Clone 53-6.7, BioXcell) was given on days 7 and 11. All antibody injections were given intraperitoneally. For orthotopic tumour implantation in the prostate, 106 PPSM cells were injected as previously described60 and orchiectomy was performed during the same surgery. For tumour antigen specific experiments, 0.5 × 10⁶ MCA-205-OVA tumour cells were injected on both flanks of RIP-mOVA mice (4 to 5 mice per group). All males were treated with 0.5 μg of degarelix by subcutaneous injection at time of tumour injection. Seven days later, 1 × 10⁵ OTI;Thy1.1 CD8 T cells isolated from splenocytes of OTI;Thy1.1 mice were adoptively transferred by intravenous injection into the tumour-bearing mice, and mice started on enzalutamide or control diet.
Lymphocyte isolation
Lymph node (inguinal) and spleens were processed to obtain single-cell suspensions using frosted ends of microscope slides. Spleens were incubated with ammonium chloride potassium lysing buffer (Lonza) for 3 min at room temperature to lyse red blood cells. Cells were rinsed with PBS containing 1%FBS and 4 mM EDT. Tumours were collected the day after the third treatment with anti-PD-L1 antibodies, or 12 days post adoptive transfer of OTI T cells into MCA-OVA tumour-bearing mice. TILs were isolated by dissection of tumour tissue into small fragments in a 50-cm3 conical tube followed by digestion at room temperature in a bacterial shaker at 180 rpm for 30 min in 1 mg ml−1 collagenase type IV (Worthington Biochemicals) and 20 mg ml−1 DNAse (Roche) in PBS. Cells were then further disrupted with a 1-cm3 syringe plunger through a 70-μm nylon cell strainer (BD Biosciences) and filtered to obtain a single-cell suspension.
Flow cytometry
Cells were incubated for 20 min on ice with e506 fixable viability dye and the following antibodies: TCRβ (H57-597), CD4 (RM4-5), CD8 (53-6.7), CD44 (IM7), PD-1 (J43) and Thy1.1 (HIS51). Intracellular proteins Ki67 (SolA15), IFNγ (XMG1.2), TNF (MP6-CT22), Nur77 (12.14) and granzyme B (NGZB) were detected using the Fixation/Permeabilization Solution kit from BD Biosciences. All antibodies and viability dyes were purchased from eBioscience, Biolegend, or BD Biosciences61. Data were collected with a Fortessa flow cytometer (BD Biosciences) and analyzed using FlowJo software (Tree Star). Unless noted otherwise in the figure legend, cells were gated through live/TCRβ+/CD8+ gates for analysis.
In vitro activation and intracellular cytokine staining
Bulk TILs, splenocytes and/or blood were plated in 96-well plates and stimulated for 4–5 h with PMA (80 nmol) and ionomycin (1.3 μmol), SIINFEKL peptide (1 nM, GenScript) or gp33 peptide (10 nM, Gen-Script) in presence of brefeldin A (BFA). Cells were then stained for surface markers, fixed and permeabilized, and stained for intracellular cytokines.
NanoString sample preparation and processing
PPSM tumour-bearing mice were treated with one dose of degarelix and started on enzalutamide or control diet on day 7 post tumour inoculation. One week later, tumours were collected and processed to single-cell suspension. For tumour samples, EpCam positive tumour cells were removed using PE positive selection kit (EasySep, STEMCELL) after staining the samples with EpCam-PE antibody. Enriched tumour infiltrated T cells were used to isolate RNA using RNeasy Kit (Qiagen). 50 ng RNA from each sample was used to measure RNA expression of genes in the nCounter mouse immunology panel using nCounter SPRINT profiler.
Chromatin immunoprecipitation
Male splenic T cells were isolated using magnetic separation (Mouse total T cell EasySep, STEMCELL) and plated in a dish coated with 5 μg ml−1 anti-CD3 (145-2C11) and 1.5 μg ml−1 anti-CD28 (37.51) antibodies (ebiosience) to activate T cells, and treated with DMSO or 2.5 μM enzalutamide. After 72 h, the cells were collected, and AR ChIP was performed using the iDeal ChIP kit for transcription factor from Diagenode. In brief, cells were cross-linked using 1% formaldehyde, followed by chromatin isolation. The isolated chromatin was then sheared to obtain a size of 300 to 700 base pairs using Diagenode Bioruptor Pico sonicator. For immunoprecipitation, 250 μl of the sheared chromatin solution was incubated with 5 μg of anti-AR antibody (Sigma-Aldrich 17-10489) or control normal rabbit IgG antibody (Sigma-Aldrich 12-370) bound to protein A/G coated magnetic beads overnight at 4 °C with rotation. The immunoprecipitated protein-DNA complex was washed rigorously, followed by reverse-crosslinking and DNA elution. 2.5 μl of sheared chromatin (1% of input) from control as well as enzalutamide treated samples were processed separately for preparing input sample DNA. The chromatin regions were measured by qPCR in the eluted DNA samples. The primers to amplify OCRs in Ifng (forward: GGTGTTGCAAAGACCTAG, reverse: GCAGTCCTTTTAATTACCCTG) gene were used in qPCR. qPCR signals from each treatment group were normalized to the signal from the corresponding 1% input sample. The relative abundance of the chromatin regions bound to AR was calculated by normalizing to IgG control.
CRISPR–Cas9 Ar gene deletion in naive CD8 T cells
Naive WT or P14 CD8 T cells were purified from spleens using magnetic separation (Mouse CD8 T cell EasySep, STEMCELL). Ar was then deleted in purified naive CD8 T cells according to the detailed protocol30. sgRNA targeting the mouse Ar gene (sgRNA 1: AATACTG AATGACCGCCATC; sgRNA 2: AGGCTTCCGCAACTTGCATG; sgRNA 3: ATTGCCCATCTTGTCGTCTC; sgRNA 4: GGGTGGAAAGTAATAGTCGA) and the mouse genome nontargeting Control sgRNA (5′-GCACUACCAGAGCUAACUCA-3′) were obtained from Synthego. Cas9 recombinant protein was obtained from IDT. Following electroporation of the Cas9–sgRNA complex into wild-type or P14 purified naive CD8 T cells, cells were either put in culture for 3 days in plates coated with 5 μg ml−1 of anti-CD3 and anti-CD28 antibodies, or adoptively transferred in recipient mice.
LCMV Clone 13 experiment
Immediately after Cas9 and mouse Ar or NT (non-targeting) sgRNAs were electroporated in naive purified splenic male P14;Thy1.1 CD8 T cells, 1 × 10⁴ Ar-knockout, NT P14 or wild-type CD8 T cells were adoptively transferred into wild-type recipient male mice by intravenous injection. At the same time, 2 × 10⁶ PFU of LCMV clone 13 was injected intravenously At day 7 post adoptive transfer and LCMV inoculation, mice were bled, red blood cells lysed with ACK buffer, and cells were stimulated for 6 h with 10 μM gp33 peptide in the presence of brefeldin a, and analysed by flow cytometry. One mouse per group was euthanized, adoptively transferred P14;Thy1.1 were sorted from the spleen based on Thy1.1 expression, RNA was extracted and AR levels assessed by qPCR. At day 18, mice adoptively transferred with wild-type CD8 T cells were treated with 0.5 μg degarelix by subcutaneous injection and put on enzalutamide diet for the rest of the experiment. On day 32, spleens and lymph nodes were collected, stimulated with 10 μM gp33 peptide, and analysed by flow cytometry.
Healthy human donor PBMCs and human AR RT–qPCR
Donor deidentified PBMC were from CMV, HIV and HBV seronegative male donors. PBMCs were thawed, and untouched total T cells or CD8 T cells were purified via magnetic separation (human T cell or human CD8+ T cell, EasySep, STEMCELL). T cells were stimulated for 0–3 days with plate bound anti-CD3 (OKT3, 4 μg ml−1) and anti-CD2862 (CD28.2, 2 μg ml−1). Total RNA from unstimulated and TCR stimulated T cells was extracted (RNeasy, Qiagen) and subjected to one-step quantitative PCR with reverse transcription (RT–qPCR) for AR and SDHA (GoTaq 1-step RT–qPCR) amplified in a QuantStudio 3 thermocycler (Applied Biosystems). AR for each sample was internally normalized to SDHA, and data are reported as fold change versus AR expressed in unstimulated T cells.
Human quantitative PCR (qPCR) primer sequences: human AR (forward: 5′-CAGCAGAAATGATTGCACTATTGA-3′; reverse: 5′-AGAGTCATCCCTGCTTCATAAC-3′); human SDHA (forward: 5′-CAGCACAGGGAGGAATCAAT-3′; reverse: 5′-GTGTCGTAGAAATGCCACCT-3′).
Mouse Ar RT–qPCR
P14 T cells were sorted 7 days after adoptive transfer. Total RNA from unstimulated, TCR stimulated T cells, sorted P14, PPSM, or mouse pancreatic tumour cell line 688m63 was extracted (RNeasy, Qiagen) and subjected to one-step RT-qPCR for Ar and Gapdh (GoTaq 1-step RT–qPCR) amplified in a QuantStudio 3 thermocycler (Applied Biosystems). Mouse qPCR primer sequences: mouse Ar (forward: 5′-GGAGAACTACTCCGGACCTTAT-3′; reverse: 5′-GGGTGGAAAGTAATAGTCGATGG-3′), mouse Gapdh (forward: 5′-CTGGCCAAGGTCATCCAT-3′; reverse: 5′-TTCTGGGTGGCAGTGATG-3′).
Quantification and statistical analysis
Preprocessing of single-cell RNA-seq data.
FASTQ files were mapped to human genome (hg19) and unique molecular identifier (UMI) counts quantified per gene per cell to generate a gene-barcode matrix using Cell Ranger software pipeline (version 2.1.1). To account for different sequencing depth of multiple libraries, reads of all samples were aggregated and libraries were normalized to the same sequencing depth using the ‘cellranger aggr’ function with normalize = mapped. The preprocessed matrix of gene counts versus cells contained 16,335 cells at an average sequencing depth of 7,655 reads per cell.
Unsupervised clustering of all cells.
The preprocessed matrix generated by the cellranger pipeline was imported into the Seurat (version 3.0.0) R (version 3.5.1) package64. As a quality control step, we first filtered out cells with fewer than 100 genes and genes expressed in less than 0.1% of cells using zero as a cut-off for UMI counts. We further removed cells based on mitochondrial gene content, UMI counts, and gene counts (mitochondrial % counts ≥10%, UMI counts > 9,000, gene counts > 2,500). The filtered gene-expression matrix (14,609 genes and 16,044 cells) was normalized using the NormalizeData function with the LogNormalize normalization method and scale.factor equal to 10,000. Prior to dimension reduction and clustering analysis, we scaled the data and regressed out the effects of variation of UMI counts and percent mitochondrial contents. Furthermore, we focused on genes that exhibited high cell-to-cell variation and identified 1,608 genes using the FindVariableFeatures function in the Seurat package with mean.var.plot method (mean cut-off between 0.0125 and 8, and dispersion over 0.5). Principal components analysis was performed on the scaled data cut to variable genes and the first 20 principal components were selected for downstream analysis, based on the elbow point on the plot of standard deviations of principal components. Cells were embedded in a shared nearest neighbour (SNN) graph constructed on the selected principal components and partitioned into clusters using the FindClusters function with the resolution parameter set to 0.6 and the other parameters left as default. To visualize cells in two dimensions, UMAP was generated using the RunUMAP function with the same principal components used in clustering analysis. Throughout the analysis, we confirmed the absence of batch effects introduced by samples or other technical factors, and thus did not perform batch effect removal in our data.
This analysis yielded 17 clusters (data not shown). Cell types were identified based on the enrichment of a set of canonical markers for each cluster. We annotated a total of nine T cells clusters, one NK cell cluster, two myeloid cell clusters, one B cell cluster, one plasma cell cluster, one tumour cells cluster, one fibroblast cells cluster, and one endothelial cell cluster. At the all-cells clustering stage, we did not intend to identify distinct cell types in detail and therefore merged clusters into tumour cells and major lymphoid and myeloid immune cell subsets. The fraction of cells in each sample assigned to a given cluster c was computed, and we used Student’s t-test to determine if there was a significant difference between responders and non-responders samples for cluster c. Percentage was calculated out of all leucocytes.
Unsupervised clustering of T and NK cells.
To reveal different cell types in T and NK cells, we extracted all cells classified as T and NK cells in our all-cells clustering analysis. The expression matrix of these cells was extracted from the preprocessed matrix (cellranger output), and analysed through Seurat following the exact steps described above. This analysis used 1,496 variable genes, top 14 principal components, and a resolution of 0.5 in FindClusters. The fraction of cells in each sample assigned to a given cluster c was computed, and we used Student’s t-test to determine whether there was a significant difference between responders and non-responders samples for cluster c.
Unsupervised clustering of CD8 and CD4 T cells.
To identify CD8 T cells states associated with response or resistance, we extracted all single cells classified as CD8 T cells in our T and NK cells clustering analysis, subset the expression matrix from the preprocessed matrix (cellranger output), and processed these cells using Seurat following the exact steps described above. Principal components analysis was performed on the scaled data cut to 1,728 variable genes and the top 14 principal components were used to generate UMAP for cell visualization. k-means clustering was performed on the top 50 principal components and CD8 T cells were classified into two clusters. A similar clustering analysis was performed on CD4 T cells, which used 2,042 variable genes.
Differential gene-expression analysis and marker gene identification.
For all single-cell differential gene-expression tests, we used Wilcoxon rank-sum test implemented in Seurat. The differentially expressed genes for each cluster compared with all other cells were identified using the FindAllMarkers function. Differential gene-expression testing was also performed using the FindMarkers function between responder cells (CD8 R) and non-responder cells (CD8 NR), and between CD8 k1 cells and CD8 k2 cells. To identify top differentially expressed genes, we required an expression difference of at least 1.25 times fold change (FC) (average logFC ≥ log(1.25)) and an adjusted P value (p_val_adj) of ≤0.05 with gene expression detected in at least 10% of cells in either one of the two comparison groups. The top 20 highly and differentially expressed genes, as ranked by the average fold change, were selected and scaled expression data of these genes was visualized in heatmaps.
Pathway enrichment analysis of single cells.
To compute the gene-expression signature which required fold change and P value, we used the output of the Seurat FindMarkers or FindAllMarkers function with the following parameters: logfc.threshold = log(1), min. pct = 0.001, and others set to default. This allowed us to interrogate the fold change and P value for all genes that were expressed in at least 0.1% of cells in either comparison group. The gene-expression signature was calculated using the following formula: average logFC × log10 (1/(P + 10−300)), where average logFC and P were the outputs from Seurat. The gene-expression signature of each comparison was imported into Camera to identify enriched pathways65 and we used C2 canonical pathway reactome from the MSigDB database (version 7.0).
Master regulator analysis of single cells.
Transcription factor activity was inferred using the master regulator (MR) inference algorithm (MARINa)21 compiled in the viper R package22. Gene-expression signature and a regulatory network (regulome) are the two sources of data required as input for viper analysis. Gene-expression signature was computed as described above. The transcription factor regulome used in this study was curated from several databases as previously described66.
NanoString nCounter data analysis.
NanoString nCounter data were normalized and gene-expression fold change calculated using nSolver software from NanoString (version 4.0). A gene was nominated as differentially expressed when the fold change between a comparison group was greater than 1.2 and the gene raw count was above the background threshold for all samples. To determine whether genes upregulated in TIL-enza versus control were enriched in CD8 R single cells, GSEA Preranked tool was used to perform GSEA67 (version 4.0.3), with the ranked gene list computed as described above and a permutation number of 3,000.
Whole transcriptome analysis of bulk tumour samples.
FastQC v0.11.8 software (http://www.bioinformatics.bbsrc.ac.uk/projects/fastqc/) was used to determine the quality of raw fastq files. Sequencing reads were aligned to hg19 human reference genome and per-gene counts and TPM (transcripts per kilobase million) quantified by RSEM68 (1.3.1) based on the gene annotation gencode.v19.annotation.gtf. The regulon activity of AR for each bulk sample was inferred using single-sample VIPER analysis with TPM gene expression as input22. The CD8 R versus NR score of each bulk sample was calculated using the z-score method. In brief, gene-expression values (log2(TPM + 1)) of each sample were converted to z-scores by: z = (x - μ)/σ, where μ is the average log2(TPM + 1) across all samples of a gene and σ is the s.d. of log2(TPM + 1) across all samples of a gene. The CD8 R versus NR score of each sample was the difference between average z-score of all up-regulated genes in CD8 R versus NR and average z-score of all down-regulated genes in CD8.R versus NR. The CD8 k1 versus k2 score was calculated in the same way.
Whole transcriptome analysis of mouse CD8 T cell Ar-knockout and control samples.
Sequencing FASTQ files were aligned to the mouse reference genome (GRCh38.p6) using RSEM (1.3.1)68. The RSEM output of the number of reads per gene was used to quantify the expression level of each gene for downstream analysis. The Broad Institute GSEA software (GSEA, version 4.0.3)67 was used to determine the enrichment of the interferon gamma response pathway from the MSigDB hallmarks gene sets (version 7.0). The CD8 R versus NR score of each sample was calculated using the z-score method as described above.
Tumour mutational burden.
WES reads were aligned against the GrCH37d5 genome using the Sanger cgpmap workflow (https://github.com/cancerit/dockstore-cgpmap) with realignment around indels and base recalibration performed using the Open Genomics GATK cocleaning workflow (https://github.com/OpenGenomics/gatk-cocleaning-tool). Somatic variants were called using a collection of callers via the mc3 workflow69 (https://github.com/opengenomics/mc3), retaining all variants produced by Pindel and all variants reported by two or more tools that were not overlapped by a Pindel variant. The Mbp of genome covered by WES was determined using bedtools genomecov (V.2.26.0), where any base pair covered by at least six aligned reads was considered covered. Coverage-adjusted tumour mutational burden was calculated on a per-sample basis by dividing the total number of somatic variants detected by the Mbp of genome covered.
Analysis of public prostate and melanoma datasets.
The West Coast Dream Team (WCDT) human mCRPC mRNA data33 (n = 99 individuals) was obtained from http://davidquigley.com/prostate.html. The Hugo cohort35 (n = 27 tumours) was downloaded from GSE78220 and the Van Allen cohort34 (n = 42 tumours) was downloaded from the database of Genotypes and Phenotypes (dbGAP) under the accession number phs000452.v2.p1.The gene expressions were quantified by the transcripts per kilobase million (TPM). The regulon activity of AR in each sample was calculated using VIPER as described above. The IFNG pathway gene set was downloaded from the MSigDB database (version 7.0). Single-sample IFNG activity was calculated using z-score as described above. The CD8 R versus NR score of each bulk sample was calculated using z-score method as described above.
Mouse data statistical analysis.
Statistical analysis was performed using two-tailed unpaired Student’s t-test (for comparison between two groups), one-way ANOVA for multiple comparisons or log-rank (Mantel-Cox) test for survival curves using GraphPad Prism 6 (GraphPad Software). Error bars represent s.e.m. unless noted otherwise in the figure legend. Statistical tests and P values are specified for each panel in the respective figure legends, and P values < 0.05 were considered significant. Biological replicates (individual mice) for each experiment are indicated in the figure legends.
Reporting summary
Further information on research design is available in the Nature Research Reporting Summary linked to this paper.
Extended Data
Extended Data Fig. 1 |. Clinical trial scheme of patients enrolled and details on biopsy location and genomics.
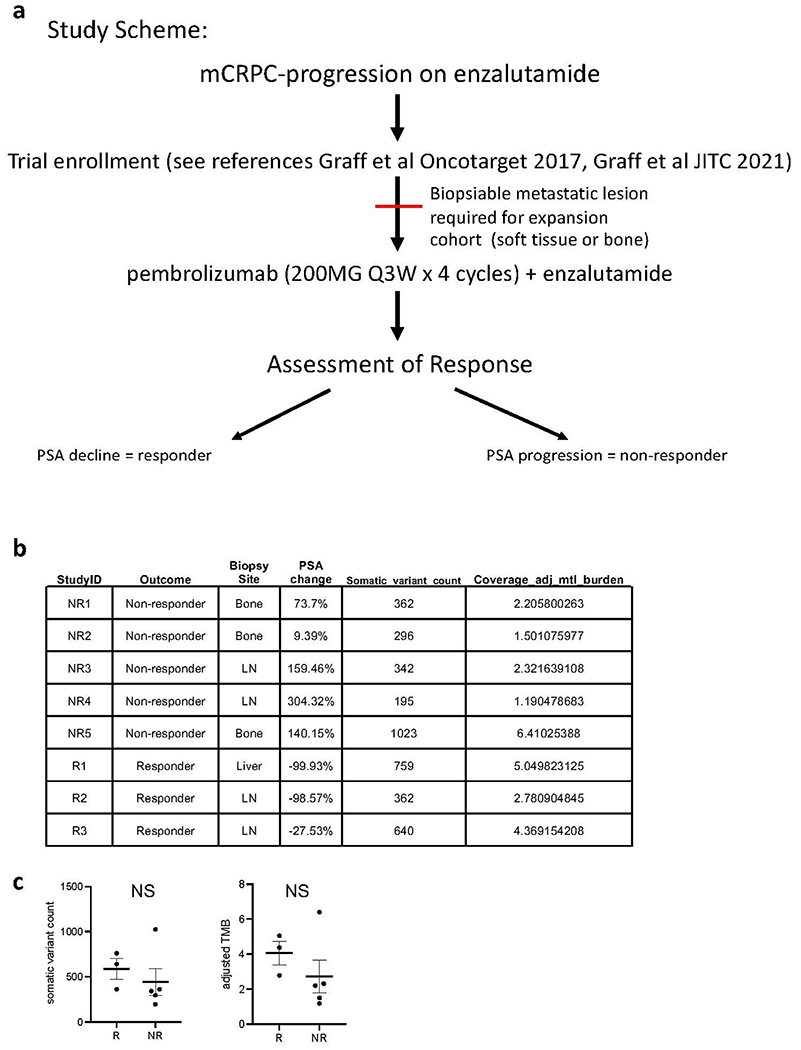
a. Clinical trial study scheme. b. Per-patient tumor mutations are shown in a table with each row representing an individual participant on study, and each column representing the unique participant identifier (StudyID), the participant’s response to study treatment (Outcome), the site of biopsied tissue specimen analyzed (Biopsy Site), the relative (%) change in PSA with treatment (PSA change), the number of somatic variants detected in that tumor specimen (Somatic_variant_count), and the coverage-adjusted tumor mutational burden defined as the Somatic_variant_count / #Mbp genome covered by ≥ 6 reads (Coverage_adj_mtl_burden). c. Comparison of the somatic variant counts (left) or coverage-adjusted tumor mutational burdens (right) for study responders (R, n = 3 patients) versus non-responders (NR, n = 5 patients); NS represents no significant difference detected by two-tailed Student’s t-test; mean values are depicted as bold horizontal lines. Error bars represent S.E.M.
Extended Data Fig. 2 |. CD8 T cell subset associated with response to checkpoint therapy in mCRPC patients.
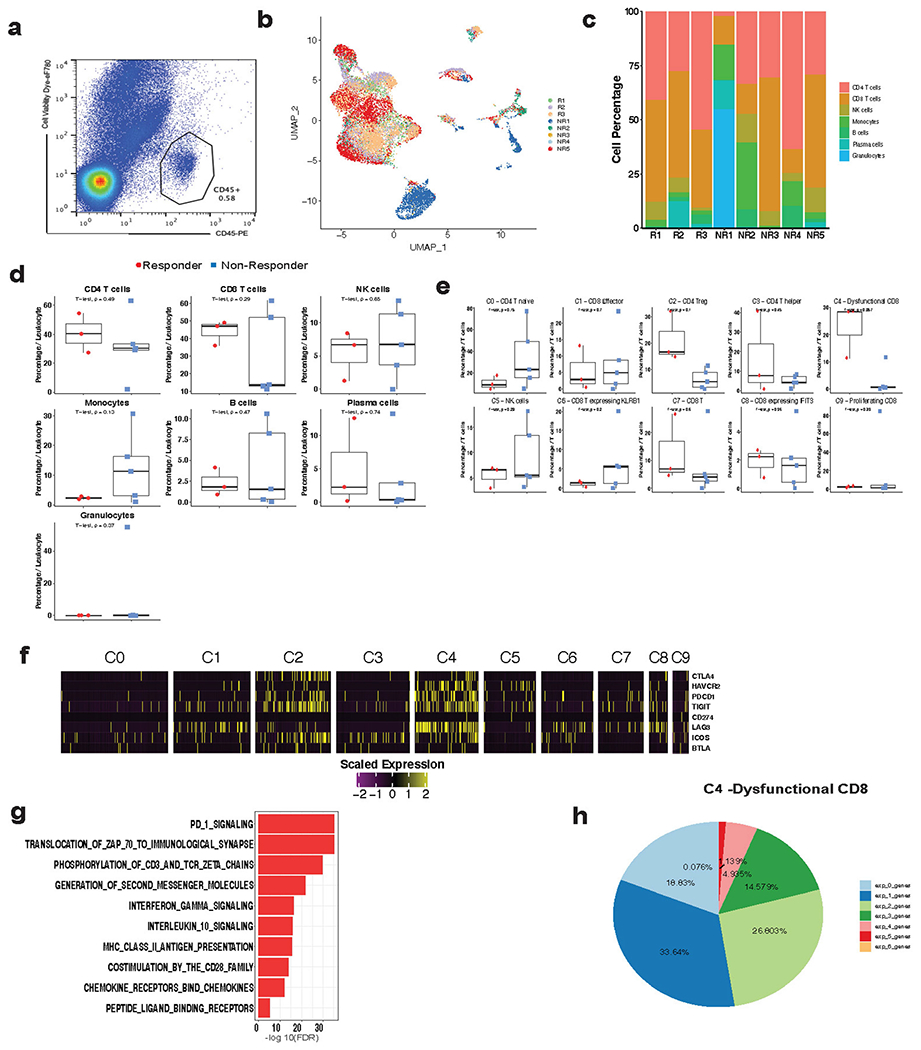
a, Representative flow cytogram for sorting tumor-associated leukocytes prior to scRNAseq. b, UMAP of all single cells (n = 16,044 cells) in this study colored by patient. c, Stack bar graph showing the % of cells per sample for immune cell clusters across each patient biopsy. d, e, Box plots comparing the % of cells per sample for immune cell clusters between responders (n = 3 patients) and non-responders (n = 5 patients). Percentage was calculated out of all immune cells (d) or all T/NK cells (e). Two-tailed unpaired Student’s t-test. Box center line, median; box, the interquartile range (IQR, the range between the 25th and 75th percentile); whiskers, 1.58 times IQR. f, Heatmap showing the expression of CTLA4, HAVCR2, PDCD1, TIGIT, CD274, LAG3, ICOS, BTLA in various T cell clusters. g, Pathways enriched in dysfunctional CD8 T cells (C4 cluster). h, Percentage of cells co-expressing a combination of PDCD1, LAG3, HAVCR2, CTLA4, TNFRSF4, and TIGIT in dysfunctional CD8 T cells (C4 cluster).
Extended Data Fig. 3 |. Expression of various genes associated with CD8 T cytotoxicity and exhaustion.
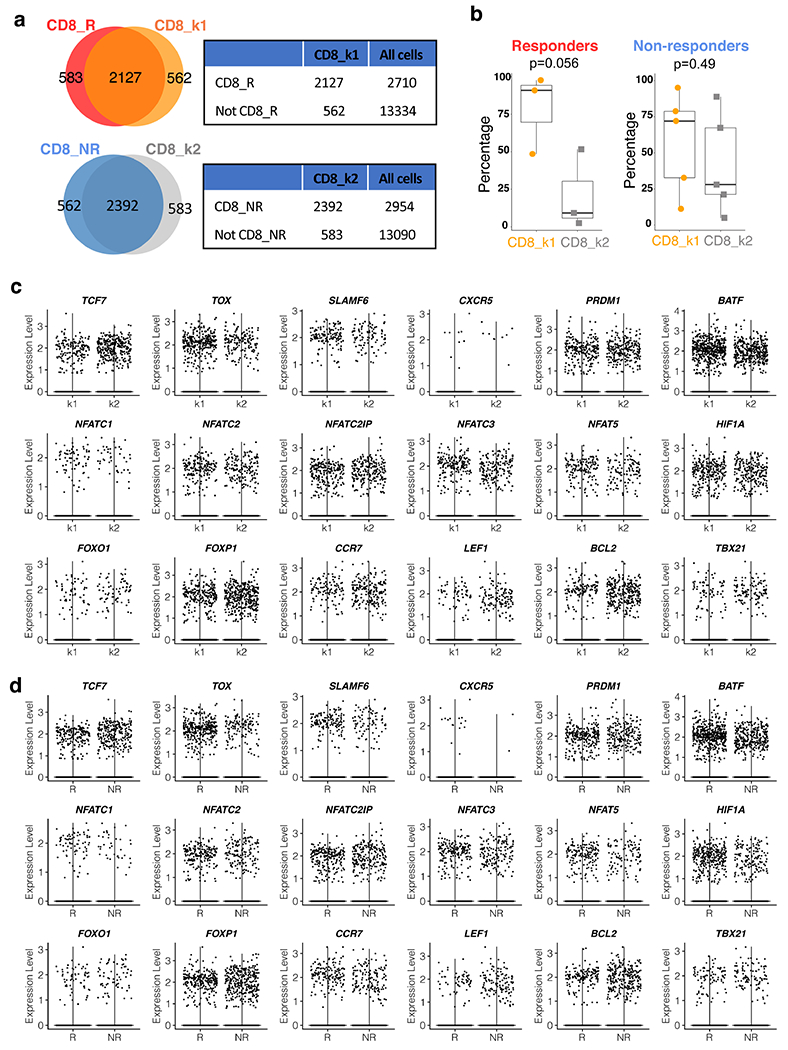
a, Venn diagram and contingency table showing the significant overlap between CD8_R and CD8_k1 (Top, P < 0.0001) and between CD8_NR and CD8_k2 (Bottom, P < 0.0001). All cells: all the single cells that passed quality control in this study, as shown in Fig. 1a. Two-tailed Fisher’s exact test. b, Percentage of CD8_k1 or CD8_k2 clusters per sample in responders (n = 3 patients) and non-responders (n = 5 patients). Two-tailed unpaired Student’s t-test. Box center line, median; box, the interquartile range (IQR, the range between the 25th and 75th percentile); whiskers, 1.58 times IQR. c, d, Violin plot comparing the gene expression in CD8_k1 and CD8_k2 (c), and CD8_R and CD8_NR (d). R, responder; NR, non-responder.
Extended Data Fig. 4 |. CD4_k1 is not associated with response.
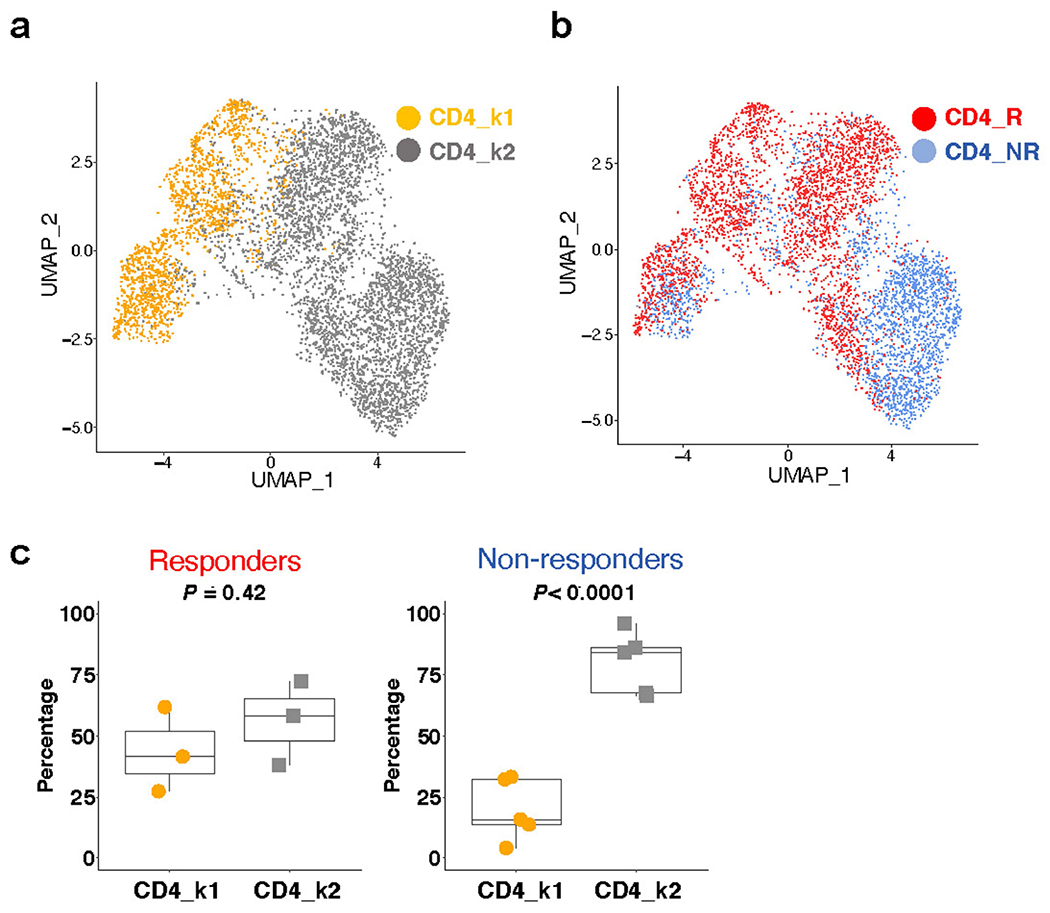
a, UMAP plot showing the two distinct CD4 T cells states identified using k-means clustering (n = 5,322 cells). b, UMAP plot showing CD4 T cells colored by response and non-response patient groups (n = 5,322 cells). c, Percentage of CD4_k1 or CD4_k2 clusters per sample in responders (n = 3 patients) and non-responders (n = 5 patients). Two-tailed unpaired Student’s t-test. Box center line, median; box, the interquartile range (IQR, the range between the 25th and 75th percentile); whiskers, 1.58 times IQR. R, responder; NR, non-responder.
Extended Data Fig. 5 |. Survival data following orthotopic PPSM implantation and enzalutamide + anti-PD-L1 treatment.
a, Ar expression by qPCR in mouse CD8 T cells, as compared with PPSM and 688m AR positive and negative control cell lines, respectively. Data combined from 3 independent experiments. b, Summary table of the experiments described in Fig. 3a. c, Average tumor growth of PPSM tumor bearing animals treated with different treatment combination as described in Fig. 3a. Data combined from 4 independent experiments, 8 to 10 animals per group. d, 12–14 wk old male mice were orchiectomized and PPSM tumor cells were injected orthotopically in the anterior lobe of the prostate. One week later, animals were treated with enzalutamide or enzalutamide + anti-PD-L1 (5 animals per group). 4 weeks post tumor inoculation, tumors were collected and measured. e–f, PPSM tumor bearing animals were treated along the same timeline as Fig. 3a but in the absence of ADT. Average tumor growth (e) and survival curves (f) of tumor bearing animals treated with combination therapy in the presence or absence of ADT (data depict one representative experiment of two experiments, 8 animals per group). g, Survival curves of PPSM tumor bearing animals orchiectomized or not at day 7 (5 animals per group). h, Average tumor growth of PPSM tumor bearing animals treated with combination therapy and α-CD8 depleting antibody (data depict one representative experiment of two experiments, 10 animals per group). Error bars represent S.E.M. Two-way ANOVA was used for c, e and h, and log-rank (Mantel-Cox) was used for f and g.
Extended Data Fig. 6 |. Phenotyping data of tumor infiltrating CD8 T cells from orthotopic PPSM tumors, degarelix treated, and enzalutamide + anti-PD-L1 treated.

a–d, PPSM tumor bearing animals were treated as in Fig 3a. CD8 T cell number (a), Ki67 expression (b), PD-1 MFI (c) and CD44 MFI (d) in CD8 T cells in the tumor the day after the 3rd treatment with α-PD-L1. Data representative of 3 independent experiments with 3 animals per group. e–g, PPSM tumor cells were surgically injected orthotopically in the prostate, and orchiectomy was performed. One week later, animals were treated with enzalutamide only or enzalutamide + α-PD-L1 (5 animals per group). 4 weeks post tumor inoculation, tumors were harvested and processed for flow cytometry. Graphs show percent IFNγ+ (e), TNFα+ (f) and IFNγ+TNFα+ double producing (g) CD8 T cells in the tumor (n = 5 animals). h–l, PPSM tumor bearing animals underwent ADT (degarelix, 1 dose, d14 post tumor inoculation), enzalutamide (started at d14) and α-PD-L1 (3 doses, d14, 17, 20). Tumors were harvested on day 21 and processed for flow cytometry. Graphs show percent Ki67+ (h), IFNγ+ (i), TNFα+ (j), IFNγ+TNFα+ (k) and granzyme B+ (l) CD8 T cells in the tumor. Data representative of 2 independent experiments with 3 animals per group. m–o, PPSM tumor bearing animals were treated with the same timeline as in Fig. 3a, but with enzalutamide + α-PD-L1 or ADT + α-PD-L1. Tumors were harvested the day after the 3rd dose of α-PD-L1 and processed for flow cytometry. m, Percent granzyme B+ CD8 T cells in the tumor. n, Representative flow cytogram showing IFNγ and TNFα expression in CD8 T cells in the tumor, and o, Summarized percent IFNγ+TNFα+ CD8 T cells in the tumor. Data representative of 2 independent experiments with 3 animals per group. Error bars represent S.E.M. Two-tailed unpaired Student t-test.
Extended Data Fig. 7 |. Enzalutamide treatment leads to increased cytokine production in tumour specific T cells.
a, Experimental design. Male or female Ripm-OVA animals were implanted with MCA-OVA tumours. Male animals were treated with ADT (degarelix) at time of tumour inoculation. At d7 animals were adoptively transferred with OT1;Thy1.1 CD8 T cells, and half of the animals were started on enzalutamide treatment (5 animals per group). 12 days post adoptive transfer, tumors were harvested, and TILs were stimulated with SIINFEKL peptide followed by ICCS. b, c, Representative flow cytograms showing CD44 and IFNγ expression in OTI T cells in the tumor, and summarized % IFNγ+ and PD-1 MFI in OTI in the tumor in males (b) and females (c). Data representative of 2 independent experiments with 5 animals per group ICCS; intra-cellular cytokine staining. Error bars represent S.E.M. Two-tailed unpaired Student t-test.
Extended Data Fig. 8 |. T cell deletion of Ar.
a, Open chromatin regions (OCRs) containing predicted androgen receptor elements (AREs) in Ifng and Gzmb loci. b, Experimental design of the generation of Ar-KO CD8 T cells in vitro using CRISPR/Cas9. Purified CD8 T cells were electroporated with Cas9/gRNA complex (NT or AR gRNA), and put in culture in vitro for 3 days in plates coated with α-CD3 and α-CD28. 3 days later, stimulated cells were harvested, and RNA was extracted or cells were restimulated in vitro for 5 h with PMA/Ionomycin, followed by ICCS (made with www.BioRender.com). c, Ar mRNA levels by qPCR in CD8 T cells electroporated with non-targeting (NT) or Ar gRNA/Cas9 after 3 days of in vitro stimulation. Data representative of 4 independent experiments with 3 replicate wells. d, Representative flow cytograms of IFNγ and TNFα expression after restimulation with PMA/Ionomycin. e, Schematic of LCMV experiment (made with www.BioRender.com), 3 animals per group. f, Ar mRNA levels in purified P14 at day 7 post adoptive transfer (from experiment described in Fig. 4e–g). Data representative of 2 independent experiments with 3 replicate wells. g, PD1 MFI and percent IFNγ+ in P14 in the blood at day 7 post adoptive transfer. Error bars represent S.D. for c and f, and S.E.M for g.
Supplementary Material
Acknowledgements
We thank A. Adey and R. Searle for sharing expertise as we developed protocols for single-cell RNA-seq. We are grateful to the OHSU Department of Comparative Medicine for outstanding animal husbandry, the Massively Parallel Sequencing Shared Resource (MPSSR) for their support, and the Knight Cancer Institute Prostate Programs outstanding clinical research team. This work is funded in part by the Collins Medical Trust, OHSU Foundation, Prostate Cancer Foundation, Pacific Northwest Prostate Cancer SPORE NCI 5P50CA097186, NIH 1R37 CA263592-01 (to A.E.M.), M.J. Murdock Charitable Trust NS-201812034 (to S.E.M.), and a sponsored research agreement with MedImmune (to A.E.M.). This work is also supported by Medical Research Foundation at Oregon, NIH 5K01LM012877 and NIH 1R21HL145426 (to Z.X.). The resources of the Exacloud high performance computing environment developed jointly by OHSU and Intel and the technical support of the OHSU Advanced Computing Center are gratefully acknowledged. BioRender.com software was used for the creation of some figures.
Competing interests
R.F.T. and J.N.G. are employees of the US Government. The contents do not represent the views of the US Department of Veterans Affairs or the United States Government. S.A.H. is an employee of AstraZeneca. A.E.M. received research funding from AstraZeneca.
Footnotes
Code availability
The code for reproducibility of data is publicly available or will be available upon request.
Supplementary information The online version contains supplementary material available at https://doi.org/10.1038/s41586-022-04522-6.
Data availability
The sequence data generated in this study will be deposited in the Gene Expression Omnibus (GEO). Additional datasets generated during the current study for Clinical Trial NCT02312557 are available from the corresponding author on reasonable request. Source data are provided with this paper.
References
- 1.Beer TM et al. Randomized, double-blind, phase III trial of ipilimumab versus placebo in asymptomatic or minimally symptomatic patients with metastatic chemotherapy-naive castration-resistant prostate cancer. J. Clin. Oncol 35, 40–47 (2017). [DOI] [PubMed] [Google Scholar]
- 2.Kwon ED et al. Ipilimumab versus placebo after radiotherapy in patients with metastatic castration-resistant prostate cancer that had progressed after docetaxel chemotherapy (CA184-043): a multicentre, randomised, double-blind, phase 3 trial. Lancet Oncol. 15, 700–712 (2014). [DOI] [PMC free article] [PubMed] [Google Scholar]
- 3.Fong PC et al. Pembrolizumab plus enzalutamide in abiraterone-pretreated patients with metastatic castrate resistant prostate cancer: cohort C of the phase 1b/2 KEYNOTE-365 study. J. Clin. Oncol 37, suppl:abstr 5010 (2019) [Google Scholar]
- 4.Sharma P et al. Nivolumab plus ipilimumab for metastatic castration-resistant prostate cancer: preliminary analysis of patients in the CheckMate 650 trial. Cancer Cell. 38, 489–499 (2020). [DOI] [PubMed] [Google Scholar]
- 5.Antonarakis ES et al. Pembrolizumab for treatment-refractory metastatic castration-resistant prostate cancer: multicohort, open-label phase II KEYNOTE-199 study. J. Clin. Oncol 38, 395–405 (2020). [DOI] [PMC free article] [PubMed] [Google Scholar]
- 6.Conforti F et al. Cancer immunotherapy efficacy and patients’ sex: a systematic review and meta-analysis. Lancet Oncol. 19, 737–746 (2018). [DOI] [PubMed] [Google Scholar]
- 7.Small EJ et al. A pilot trial of CTLA-4 blockade with human anti-CTLA-4 in patients with hormone-refractory prostate cancer. Clin. Cancer Res 13, 1810–1815 (2007). [DOI] [PubMed] [Google Scholar]
- 8.Kissick HT et al. Androgens alter T-cell immunity by inhibiting T-helper 1 differentiation. Proc. Natl Acad. Sci. USA 111, 9887–9892 (2014). [DOI] [PMC free article] [PubMed] [Google Scholar]
- 9.Benten WP et al. Functional testosterone receptors in plasma membranes of T cells. FASEB J. 13, 123–133 (1999). [DOI] [PubMed] [Google Scholar]
- 10.Liva SM & Voskuhl RR Testosterone acts directly on CD4+ T lymphocytes to increase IL-10 production. J. Immunol 167, 2060–2067 (2001). [DOI] [PubMed] [Google Scholar]
- 11.Walecki M et al. Androgen receptor modulates Foxp3 expression in CD4+CD25+Foxp3+ regulatory T-cells. Mol. Biol. Cell 26, 2845–2857 (2015). [DOI] [PMC free article] [PubMed] [Google Scholar]
- 12.Ayers M et al. IFN-gamma-related mRNA profile predicts clinical response to PD-1 blockade. J. Clin. Invest 127, 2930–2940 (2017). [DOI] [PMC free article] [PubMed] [Google Scholar]
- 13.Prat A et al. Immune-related gene expression profiling after PD-1 blockade in non-small cell lung carcinoma, head and neck squamous cell carcinoma, and melanoma. Cancer Res. 77, 3540–3550 (2017). [DOI] [PubMed] [Google Scholar]
- 14.Riaz N et al. Tumor and microenvironment evolution during immunotherapy with nivolumab. Cell 171, 934–949.e916 (2017). [DOI] [PMC free article] [PubMed] [Google Scholar]
- 15.Graff JN et al. Early evidence of anti-PD-1 activity in enzalutamide-resistant prostate cancer. Oncotarget 7, 52810–52817 (2016). [DOI] [PMC free article] [PubMed] [Google Scholar]
- 16.Graff JN et al. A phase II single-arm study of pembrolizumab with enzalutamide in men with metastatic castration-resistant prostate cancer progressing on enzalutamide alone. J. Immunother. Cancer 8, e000642 (2020). [DOI] [PMC free article] [PubMed] [Google Scholar]
- 17.Tumeh PC et al. PD-1 blockade induces responses by inhibiting adaptive immune resistance. Nature 515, 568–571 (2014). [DOI] [PMC free article] [PubMed] [Google Scholar]
- 18.Chen PL et al. Analysis of immune signatures in longitudinal tumor samples yields insight into biomarkers of response and mechanisms of resistance to immune checkpoint blockade. Cancer Discov. 6, 827–837 (2016). [DOI] [PMC free article] [PubMed] [Google Scholar]
- 19.Wherry EJ et al. Molecular signature of CD8+ T cell exhaustion during chronic viral infection. Immunity 27, 670–684 (2007). [DOI] [PubMed] [Google Scholar]
- 20.Hwang SS et al. mRNA destabilization by BTG1 and BTG2 maintains T cell quiescence. Science 367, 1255–1260 (2020). [DOI] [PubMed] [Google Scholar]
- 21.Lefebvre C et al. A human B-cell interactome identifies MYB and FOXM1 as master regulators of proliferation in germinal centers. Mol. Syst. Biol 6, 377 (2010). [DOI] [PMC free article] [PubMed] [Google Scholar]
- 22.Alvarez MJ et al. Functional characterization of somatic mutations in cancer using network-based inference of protein activity. Nat. Genet 48, 838–847 (2016). [DOI] [PMC free article] [PubMed] [Google Scholar]
- 23.Chen J et al. NR4A transcription factors limit CAR T cell function in solid tumours. Nature 567, 530–534 (2019). [DOI] [PMC free article] [PubMed] [Google Scholar]
- 24.Lu X et al. Effective combinatorial immunotherapy for castration-resistant prostate cancer. Nature 543, 728–732 (2017). [DOI] [PMC free article] [PubMed] [Google Scholar]
- 25.Northrop JK, Thomas RM, Wells AD & Shen H Epigenetic remodeling of the IL-2 and IFN-γ loci in memory CD8 T cells is influenced by CD4 T cells. J. Immunol 177, 1062–1069 (2006). [DOI] [PubMed] [Google Scholar]
- 26.Zediak VP, Johnnidis JB, Wherry EJ & Berger SL Cutting edge: persistently open chromatin at effector gene loci in resting memory CD8+ T cells independent of transcriptional status. J. Immunol 186, 2705–2709 (2011). [DOI] [PMC free article] [PubMed] [Google Scholar]
- 27.Kersh EN et al. Rapid demethylation of the IFN-γ gene occurs in memory but not naive CD8 T cells. J. Immunol 176, 4083–4093 (2006). [DOI] [PubMed] [Google Scholar]
- 28.Pauken KE et al. Epigenetic stability of exhausted T cells limits durability of reinvigoration by PD-1 blockade. Science 354, 1160–1165 (2016). [DOI] [PMC free article] [PubMed] [Google Scholar]
- 29.Fornes O et al. JASPAR 2020: update of the open-access database of transcription factor binding profiles. Nucleic Acids Res. 48, D87–D92 (2020). [DOI] [PMC free article] [PubMed] [Google Scholar]
- 30.Nussing S et al. Efficient CRISPR/Cas9 gene editing in uncultured naive mouse T cells for in vivo studies. J. Immunol 204, 2308–2315 (2020). [DOI] [PubMed] [Google Scholar]
- 31.Wherry EJ, Blattman JN, Murali-Krishna K, van der Most R & Ahmed R Viral persistence alters CD8 T-cell immunodominance and tissue distribution and results in distinct stages of functional impairment. J. Virol 77, 4911–4927 (2003). [DOI] [PMC free article] [PubMed] [Google Scholar]
- 32.Ahmed R, Salmi A, Butler LD, Chiller JM & Oldstone MB Selection of genetic variants of lymphocytic choriomeningitis virus in spleens of persistently infected mice. Role in suppression of cytotoxic T lymphocyte response and viral persistence. J. Exp. Med 160, 521–540 (1984). [DOI] [PMC free article] [PubMed] [Google Scholar]
- 33.Quigley DA et al. Genomic hallmarks and structural variation in metastatic prostate cancer. Cell 174, 758–769.e759 (2018). [DOI] [PMC free article] [PubMed] [Google Scholar]
- 34.Van Allen EM et al. Genomic correlates of response to CTLA-4 blockade in metastatic melanoma. Science 350, 207–211 (2015). [DOI] [PMC free article] [PubMed] [Google Scholar]
- 35.Hugo W et al. Genomic and transcriptomic features of response to anti-PD-1 therapy in metastatic melanoma. Cell 168, 542 (2016). [DOI] [PubMed] [Google Scholar]
- 36.Bebo BF, Schuster JC, Vandenbark AA & Offner H Androgens alter the cytokine profile and reduce encephalitogenicity of myelin-reactive T cells. J. Immunol 162, 35–40 (1999). [PubMed] [Google Scholar]
- 37.Gubbels Bupp MR, Potluri T, Fink AL & Klein SL The confluence of sex hormones and aging on immunity. Front. Immunol 9, 1269 (2018). [DOI] [PMC free article] [PubMed] [Google Scholar]
- 38.Lin AA, Wojciechowski SE & Hildeman DA Androgens suppress antigen-specific T cell responses and IFN-γ production during intracranial LCMV infection. J. Neuroimmunol 226, 8–19 (2010). [DOI] [PMC free article] [PubMed] [Google Scholar]
- 39.Ashley DJ The two “hit” and multiple “hit” theories of carcinogenesis. Br. J. Cancer 23, 313–328 (1969). [DOI] [PMC free article] [PubMed] [Google Scholar]
- 40.Cartwright RA, Gurney KA & Moorman AV Sex ratios and the risks of haematological malignancies. Br. J. Haematol 118, 1071–1077 (2002). [DOI] [PubMed] [Google Scholar]
- 41.Fish EN The X-files in immunity: sex-based differences predispose immune responses. Nat. Rev. Immunol 8, 737–744 (2008). [DOI] [PMC free article] [PubMed] [Google Scholar]
- 42.Cook MB, Chow WH & Devesa SS Oesophageal cancer incidence in the United States by race, sex, and histologic type, 1977–2005. Br. J. Cancer 101, 855–859 (2009). [DOI] [PMC free article] [PubMed] [Google Scholar]
- 43.Edgren G, Liang L, Adami HO & Chang ET Enigmatic sex disparities in cancer incidence. Eur. J. Epidemiol 27, 187–196 (2012). [DOI] [PubMed] [Google Scholar]
- 44.Klein SL & Flanagan KL Sex differences in immune responses. Nat. Rev. Immunol 16, 626–638 (2016). [DOI] [PubMed] [Google Scholar]
- 45.Montgomery RB et al. Maintenance of intratumoral androgens in metastatic prostate cancer: a mechanism for castration-resistant tumor growth. Cancer Res. 68, 4447–4454 (2008). [DOI] [PMC free article] [PubMed] [Google Scholar]
- 46.Pernigoni N et al. Commensal bacteria promote endocrine resistance in prostate cancer through androgen biosynthesis. Science 374, 216–224 (2021). [DOI] [PubMed] [Google Scholar]
- 47.Edwards A, Hammond HA, Jin L, Caskey CT & Chakraborty R Genetic variation at five trimeric and tetrameric tandem repeat loci in four human population groups. Genomics 12, 241–253 (1992). [DOI] [PubMed] [Google Scholar]
- 48.Kazemi-Esfarjani P, Trifiro MA & Pinsky L Evidence for a repressive function of the long polyglutamine tract in the human androgen receptor: possible pathogenetic relevance for the (CAG)n-expanded neuronopathies. Hum. Mol. Genet 4, 523–527 (1995). [DOI] [PubMed] [Google Scholar]
- 49.Rayford W et al. Comparative analysis of 1152 African-American and European-American men with prostate cancer identifies distinct genomic and immunological differences. Commun. Biol 4, 670 (2021). [DOI] [PMC free article] [PubMed] [Google Scholar]
- 50.Higano CS et al. Real-world outcomes of sipuleucel-T treatment in PROCEED, a prospective registry of men with metastatic castration-resistant prostate. cancer. Cancer 125, 4172–4180 (2019). [DOI] [PMC free article] [PubMed] [Google Scholar]
- 51.He MX et al. Transcriptional mediators of treatment resistance in lethal prostate cancer. Nat. Med 27, 426–433 (2021). [DOI] [PMC free article] [PubMed] [Google Scholar]
- 52.Bishop JL et al. PD-L1 is highly expressed in Enzalutamide resistant prostate cancer. Oncotarget 6, 234–242 (2015). [DOI] [PMC free article] [PubMed] [Google Scholar]
- 53.Aggarwal R et al. Clinical and genomic characterization of treatment-emergent small-cell neuroendocrine prostate cancer: a multi-institutional prospective study. J. Clin. Oncol 36, 2492–2503 (2018). [DOI] [PMC free article] [PubMed] [Google Scholar]
- 54.Moran AE, Polesso F & Weinberg AD Immunotherapy expands and maintains the function of high-affinity tumor-infiltrating CD8 T cells in situ. J. Immunol 197, 2509–2521 (2016). [DOI] [PMC free article] [PubMed] [Google Scholar]
- 55.Polesso F, Sarker M, Weinberg AD, Murray SE & Moran AE OX40 agonist tumor immunotherapy does not impact regulatory T cell suppressive function. J. Immunol 203, 2011–2019 (2019). [DOI] [PubMed] [Google Scholar]
- 56.Polesso F, Weinberg AD & Moran AE Late-stage tumor regression after PD-L1 blockade plus a concurrent OX40 agonist. Cancer Immunol. Res 7, 269–281 (2019). [DOI] [PubMed] [Google Scholar]
- 57.Schofield DJ et al. Activity of murine surrogate antibodies for durvalumab and tremelimumab lacking effector function and the ability to deplete regulatory T cells in mouse models of cancer. mAbs 13, 1857100 (2021). [DOI] [PMC free article] [PubMed] [Google Scholar]
- 58.Polesso F et al. PD-1-specific “blocking” antibodies that deplete PD-1+ T cells present an inconvenient variable in preclinical immunotherapy experiments. Eur. J. Immunol 51, 1473–1481 (2021). [DOI] [PubMed] [Google Scholar]
- 59.Valkenburg KC, Amend SR & Pienta KJ Murine prostate micro-dissection and surgical castration. J. Vis. Exp 10.3791/53984 (2016). [DOI] [PMC free article] [PubMed] [Google Scholar]
- 60.Pavese J, Ogden IM & Bergan RC An orthotopic murine model of human prostate cancer metastasis. J. Vis. Exp 10.3791/50873 (2013). [DOI] [PMC free article] [PubMed] [Google Scholar]
- 61.Moran AE et al. T cell receptor signal strength in Treg and iNKT cell development demonstrated by a novel fluorescent reporter mouse. J. Exp. Med 208, 1279–1289 (2011). [DOI] [PMC free article] [PubMed] [Google Scholar]
- 62.Murray SE et al. Fibroblast-adapted human CMV vaccines elicit predominantly conventional CD8 T cell responses in humans. J. Exp. Med 214, 1889–1899 (2017). [DOI] [PMC free article] [PubMed] [Google Scholar]
- 63.Gruner BM et al. An in vivo multiplexed small-molecule screening platform. Nat. Methods 13, 883–889 (2016). [DOI] [PMC free article] [PubMed] [Google Scholar]
- 64.Satija R, Farrell JA, Gennert D, Schier AF & Regev A Spatial reconstruction of single-cell gene expression data. Nat. Biotechnol 33, 495–502 (2015). [DOI] [PMC free article] [PubMed] [Google Scholar]
- 65.Wu D & Smyth GK Camera: a competitive gene set test accounting for inter-gene correlation. Nucleic Acids Res. 40, e133 (2012). [DOI] [PMC free article] [PubMed] [Google Scholar]
- 66.Robertson AG et al. Integrative analysis identifies four molecular and clinical subsets in uveal melanoma. Cancer Cell 32, 204–220.e215 (2017). [DOI] [PMC free article] [PubMed] [Google Scholar]
- 67.Subramanian A et al. Gene set enrichment analysis: a knowledge-based approach for interpreting genome-wide expression profiles. Proc. Natl Acad. Sci. USA 102, 15545–15550 (2005). [DOI] [PMC free article] [PubMed] [Google Scholar]
- 68.Li B & Dewey CN RSEM: accurate transcript quantification from RNA-seq data with or without a reference genome. BMC Bioinf. 12, 323 (2011). [DOI] [PMC free article] [PubMed] [Google Scholar]
- 69.Ellrott K et al. Scalable open science approach for mutation calling of tumor exomes using multiple genomic pipelines. Cell Syst. 6, 271–281.e277 (2018). [DOI] [PMC free article] [PubMed] [Google Scholar]
Associated Data
This section collects any data citations, data availability statements, or supplementary materials included in this article.
Supplementary Materials
Data Availability Statement
The sequence data generated in this study will be deposited in the Gene Expression Omnibus (GEO). Additional datasets generated during the current study for Clinical Trial NCT02312557 are available from the corresponding author on reasonable request. Source data are provided with this paper.