Abstract
Background:
Glial fibrillary acidic protein (GFAP) is a promising candidate blood-based biomarker for Alzheimer’s disease (AD) diagnosis and prognostication. The timing of its disease-associated changes, its clinical correlates, and biofluid-type dependency will influence its clinical utility.
Methods:
We evaluated plasma, serum, and CSF GFAP in families with autosomal dominant AD (ADAD), leveraging the predictable age at symptom onset to determine changes by stage of disease.
Results:
Plasma GFAP elevations appear a decade before expected symptom onset, after β-amyloid accumulation and prior to neurodegeneration and cognitive decline. Plasma GFAP distinguished β-amyloid-positive from β-amyloid-negative ADAD participants and showed a stronger relationship with β-amyloid load in asymptomatic than symptomatic ADAD. Higher plasma GFAP was associated with the degree and rate of neurodegeneration and cognitive impairment. Serum GFAP showed similar relationships, but these were less pronounced for CSF GFAP.
Conclusion:
Our findings support a role for plasma GFAP as a clinical biomarker of Aβ related astrocyte reactivity that is associated with cognitive decline and neurodegeneration.
Introduction
The use of cerebrospinal fluid (CSF) biomarkers and positron emission tomography (PET) tracers for β-amyloid (Aβ) and tau has helped overcome the need for histopathological confirmation of the core Alzheimer’s disease (AD) hallmarks, namely Aβ plaques and neurofibrillary tangles, enabling reliable ante-mortem diagnosis 1. However, the invasiveness and cost associated with CSF and PET biomarkers limit their use – especially in resource poor settings. Blood-based biomarkers are less invasive, lower in cost and have wide applicability. Plasma glial fibrillary acidic protein (GFAP) has potential clinical utility for diagnosis and prognostication in AD 2–4.
GFAP contributes to cell structure maintenance as one of the cytoskeletal proteins in astrocytes and is upregulated in reactive astrocytes 5. Reactive astrocytes have been observed surrounding Aβ plaques and can drive neurodegeneration in AD 5–8. GFAP expression in brain tissue is associated with Aβ plaque density 9–11. In addition, evidence of high monoamine oxidase B (MAO-B) PET signal reflecting activated astrocytes has been reported in asymptomatic autosomal dominant AD (ADAD), and prodromal and early symptomatic sporadic AD 10,12–15. Astrocyte activity visualised by MAO-B PET is elevated in asymptomatic ADAD but steadily declines approaching symptom onset, and is correlated with cortical thickness in asymptomatic ADAD 13,14. MAO-B PET signal has also been reported to be significantly higher in the APPswe AD transgenic mouse model at 6 months compared with older mice, while GFAP levels in brain, as indicators of astrocyte reactivity, were higher at the later disease stages 16.
It has been posited that reactive astrocytes release GFAP, either directly or through perivascular glymphatics, into blood via astrocyte end-feet encompassing brain capillaries 17–19. Indeed, circulating levels of plasma and serum GFAP are elevated in sporadic preclinical AD, prodromal AD and AD dementia 19–24, wherein higher plasma GFAP along the AD continuum appear to be driven by brain Aβ load 19,22,24 suggesting that plasma GFAP is a marker of Aβ related reactive astrogliosis. Plasma or serum GFAP levels have a positive association with brain Aβ load, and cerebral atrophy, and a negative association with cognitive function, in different stages along the sporadic AD continuum 19–23, suggesting that plasma GFAP is a promising biomarker in AD that is consistently associated with AD related pathology and disease progression. To determine the clinical utility of GFAP in AD, the timing of GFAP elevation across the disease trajectory, its clinical correlates, and its matrix-dependency must be understood.
The study of GFAP in ADAD is particularly suited for this purpose. Previous biomarker studies in ADAD have provided important insights into the sequence of biomarker changes and clinical events in AD 25,26. Due to the heritable age at symptom onset, it is possible to determine an ADAD mutation carrier’s estimated time (years) to symptom onset (EYO). Employing EYO will provide insight into the trajectory of GFAP from the earliest stage of the disease and will aid investigate the temporal order of GFAP changes with respect to brain Aβ load, neurodegeneration, and cognitive decline. In addition, the typically young age at onset of ADAD means relatively little confounding age-related co-pathology compared with sporadic AD, providing an assessment of the biomarker changes that are specifically related to AD pathogenesis.
In the current study, we compared GFAP concentrations between ADAD mutation carriers and non-carrier siblings and determined when disease-related changes in GFAP occurred across the disease trajectory utilising EYO. We investigated whether GFAP was also associated with brain Aβ load, neurodegeneration and cognitive and functional performance in ADAD. Lastly, comparisons between plasma, serum and CSF, were investigated.
Methods
Participants
Participants were from the Dominantly Inherited Alzheimer Network (DIAN) cohort 25 that comprises biological offspring of individuals carrying an ADAD mutation (in the amyloid precursor protein (APP), presenilin 1 (PSEN1) or presenilin 2 (PSEN2) genes) thus having 50% chance of inheriting the mutation. The presence or absence of an ADAD mutation was confirmed using PCR-based amplification of the relevant exon, followed by Sanger sequencing. Given the complete penetrance of ADAD mutations and the relatively consistent age at symptom onset for mutation carriers within each family, an estimated time to symptom onset in years (EYO) was calculated for each participant (mutation carriers and their non-carrier siblings) based on the difference between each participant’s age and the average age of onset for the specific mutation 27. EYO for symptomatic participants (Clinical Dementia Rating; CDR>0) was defined as the difference between the age at clinical assessment and reported age of actual symptom onset. Participants underwent comprehensive clinical assessments, neuroimaging, and blood and CSF collection after fasting overnight, however, at each visit, each participant may not have completed all procedures. Participants with the Dutch mutation (APP Glu693Gln mutation) were excluded from the study because they manifest an atypical clinical syndrome 28. Plasma samples were available from 86 mutation non-carriers and 98 mutation carriers (DIAN data freeze 13, DIAN request T1605), and serum and CSF samples were available from 30 mutation non-carriers and 30 mutation carriers (DIAN data freeze 15, DIAN request T2010). Twelve overlapping samples were available from DIAN request T1605 (plasma) and DIAN request T2010 (serum/CSF). Samples utilised were based on availability from the DIAN biobank. Serum and CSF samples were paired. The study was approved by the Human Research Ethics Committees (HREC) of Macquarie University, Edith Cowan University, and Ramsay Health Care WA|SA HREC in Australia, and Washington University in St. Louis, USA. All participants provided written informed consent.
Clinical assessments
Participants underwent standardised comprehensive clinical assessments. The Clinical Dementia Rating (CDR®) scale was used to determine the dementia stage wherein CDR=0 was rated as cognitively normal, CDR=0.5 as very mild dementia, CDR=1 as mild dementia and CDR=2 as moderate dementia 29. The primary measures used to examine global cognitive abilities were the Mini-Mental State Examination (MMSE; range between 0 to 30 indicating severe impairment to no impairment) 30 and CDR-Sum of Boxes (CDR-SOB; range between 0 to 18 indicating no dementia to severe dementia). Participants also underwent a comprehensive battery of neuropsychological tests assessing general cognition, as well as specific cognitive domains such as memory, executive function, language and attention 31. A global cognitive composite was generated from the average of the z-scores of the Logical Memory delayed recall, word list learning delayed recall, Digit Symbol and MMSE 32.
Neuroimaging
Cortical Aβ deposition, glucose metabolism and thickness/hippocampal volume were assessed using 11C Pittsburgh Compound B (PiB)-PET, 18F FDG-PET, and T1-weighted MRI scans, respectively, and consistency between all DIAN sites was maintained using standard procedures 33. Briefly, the 11C PiB-PET imaging was conducted over as a 70 min dynamic scan, following ~13 mCi of PiB intravenous bolus. The 18F FDG-PET imaging was conducted over 30 min, acquired after 30 min of ~5 mCi of FDG intravenous bolus. The T1 magnetic resonance sequence was acquired on 3T scanners with repetition time=23,000, echo time=2.95 and resolution=1.0×1.0×1.2 mm3. The 11C PiB-PET and 18F FDG-PET standard uptake value ratios (SUVRs) were obtained using FreeSurfer software (http://surfer.nmr.mgh.harvard.edu/). Region of interest data was corrected for partial volume effects using a geometric transfer matrix 34, and the total cerebellum gray matter was used as the reference region to calculate SUVR. The hippocampal volume was averaged between left and right hemispheres, and normalized utilising intracranial volume.
Measurement of plasma, serum, and cerebrospinal fluid GFAP
EDTA plasma, serum and CSF GFAP concentrations were measured employing the ultra-sensitive single-molecule array (Simoa) platform utilising the Neurology 4-Plex E kit (QTX-103670, Quanterix, Billerica, MA) wherein calibrators and quality controls were run in duplicates and samples were run in singlicates. All plasma samples had undergone two extra freeze thaw (FT) cycles, and serum and CSF samples underwent one extra FT cycle prior to GFAP measurement. Plasma GFAP was measured at Edith Cowan University, Australia, and serum and CSF GFAP were measured at Amsterdam University Medical Centres, the Netherlands. The CV% of quality control samples run in duplicate were <5% in both laboratories. The analytical lowest limit of quantification was 11.6 pg/ml for GFAP.
Statistical analyses
Participant characteristics were presented as mean±SD for continuous variables and n (%) for categorical variables. P values for comparing the differences among non-carriers, asymptomatic mutation carriers and symptomatic mutation carriers were obtained using linear mixed-effects models (LMEMs) for continuous variables and generalized LMEMs with a logistic link for categorical variables. These models included a random intercept for participants from the same family. A cortical 11C PiB-PET SUVR=1.25 was utilised as the cut-off for presence of aberrant cortical Aβ load (Aβ+) 26.
Plasma GFAP levels were estimated as a function of EYO using non-linear mixed effect models. Potential non-linear effects were accounted for by modelling EYO as a restricted cubic spline with knots at the 0.10, 0.50, and 0.90 quantiles 33. The non-linear mixed effect models for the plasma biomarkers included as fixed effects the mutation status and the linear EYO component; the cubic EYO component; the linear EYO by mutation status interaction; the cubic EYO by mutation status interaction; and a random intercept for family effect. All models were estimated using an opensource package for Hamiltonian Markov chain Monte Carlo analyses, using R, as used previously 35,36. From this approach a distribution of parameter estimates across iterations is achieved that allows for the estimation of the credible intervals of the model fits at every EYO for non-carriers and mutation carriers, and the distribution of the 99% difference between non-carriers and mutation carriers. The first EYO point where the 99% credible intervals of the difference curve between non-carriers and mutation carriers did not include zero was considered to be the EYO at which the non-carriers and mutation carriers differed. Analyses for brain Aβ load, hippocampal volume, precuneus thickness and cognitive measures as well as for serum and cerebrospinal GFAP were carried out utilising the same method.
Kruskal-Wallis tests followed by pairwise comparisons were used to compare plasma GFAP by Aβ PiB-PET quartile and across clinical progression in mutation carriers. Logistic regression using absence or presence of aberrant brain Aβ load as response (Aβ−/+) was used to evaluate classification models, and receiver operating characteristic (ROC) curves were constructed from the logistic scores within mutation carriers.
The cross-sectional relationships of GFAP with brain Aβ load, hippocampal volume, precuneus thickness, precuneus glucose metabolism, global cognitive composite, MMSE and CDR-SOB were evaluated using LMEMs adjusting for sex (and education for cognition) with family as a random effect. For sensitivity analyses, we tested the effect of additional age-adjustment in the models for the cross-model relationships. Age-adjustment is notoriously difficult to interpret in the context of ADAD, because age is highly correlated with disease stage. Therefore age-adjustment can within the mutation carriers be an unintended adjustment for disease stage instead of for general aging effects, due to the correlation of EYO and age in the mutation carriers. Within the mutation carriers, associations between plasma GFAP levels and subsequent neurodegeneration, cerebral glucose metabolism, cognitive and functional performance (as continuous variables) were evaluated using LMEMsadjusting for age and sex (and education for cognition) with family as a random effect and individual random slopes. For the visualization in Figure 4, two groups within the mutation carriers were created based on the Youden index cut-off for Aβ positivity. Assumptions of LMEMs were checked, and plasma/serum/CSF GFAP was natural log transformed. Spearman’s correlation coefficient was used to investigate correlations between serum and CSF GFAP (n=60), plasma and serum GFAP (n=12) and plasma and CSF GFAP (n=12). Analyses were conducted using R (v4.0.4) and IBM SPSS (v27). P<.05 was considered to be statistically significant; all statistical tests were two-tailed.
Results
We utilised samples from the global multi-site Dominantly Inherited Alzheimer Network (DIAN) cohort comprising adults at risk of, or having, symptomatic AD due to a confirmed ADAD mutation in their family. The participants comprise mutation carriers and non-carriers. In total, 184 plasma GFAP levels were analysed, as well as 60 paired serum and CSF samples (including 12 matched to plasma samples). Participant demographics, imaging measures, clinical assessments, and plasma, serum and CSF GFAP concentrations are presented in Table 1. Mean (±standard deviation) EYO and age of participants were −11 (±12) and 37 (±12) years, respectively, for plasma samples. Mean EYO and age of participants was −7 (±13) and 40 (±12) years, respectively, for serum and CSF samples. All characteristics were significantly different among the non-carrier, asymptomatic mutation carrier and symptomatic mutation carrier groups except for the Apolipoprotein E (APOE) ε4 carrier frequency. No differences in plasma GFAP levels among APP, PSEN1 and PSEN2 mutation carriers were observed (Supplementary Figure 1).
Table 1.
Demographic, neuroimaging, cognition parameters and GFAP levels for A.) plasma and B.) matched serum and cerebrospinal fluid samples from ADAD mutation carriers and non-carriers.
| A. | N | Mutation non-carriers | Mutation carriers | P | |
|---|---|---|---|---|---|
| (n=86) | Asymptomatic (n=66) | Symptomatic (n=32) | |||
| Age (years, median (IQR)) | 184 | 34 (17) | 32 (11) | 49 (19) | <.0001 |
| Female (n (%)) | 184 | 58 (67) | 36 (54) | 14 (44) | .046 |
| Education (years, median (IQR)) | 184 | 15 (4) | 16 (4) | 14 (3) | .020 |
| Apolipoprotein-E ε4 (n (%)) | 184 | 28 (33) | 19 (29) | 13 (41) | .55 |
| EYO (years, median (IQR)) | 184 | −15 (19) | −16 (10) | 3 (3) | <.0001 |
| Cortical PiB-PET SUVR (median (IQR)) | 147 (73, 56, 18) | 1.05 (0.09) | 1.14 (0.56) | 2.10 (1.40) | <.0001 |
| PiB+ (cut-off=1.25; n (%)) | 147 (73, 56, 18) | 1 (1) | 23 (41) | 16 (89) | <.0001 |
| Hippocampal volume (cm3, median (IQR)) | 168 (81, 62, 25) | 8.80 (0.99) | 8.97 (0.90) | 7.09 (1.55) | <.0001 |
| Precuneus thickness (mm, median (IQR)) | 168 (81, 62, 25) | 2.40 (0.18) | 2.39 (0.17) | 2.19 (0.30) | <.0001 |
| Precuneus FDG-PET SUVR (median (IQR)) | 159 (75, 60, 24) | 1.69 (0.17) | 1.70±0.18 | 1.67±0.38 | <.0001 |
| Cognitive composite score (median (IQR)) | 176 (84, 65, 27) | 0.30 (0.69) | 0.23 (0.84) | −0.85 (0.96) | <.0001 |
| MMSE score (median (IQR)) | 182 (84, 66, 31) | 29 (2) | 30 (1) | 27 (4) | <.0001 |
| CDR-SOB score (median (IQR)) | 184 | 0 (0) | 0 (0) | 2.75 (3.88) | <.0001 |
| Plasma GFAP (pg/mL, median (IQR)) | 184 | 71 (39) | 75 (43) | 149 (112) | <.0001 |
| B. | N | Mutation non-carriers | Mutation carriers | P | |
| (n=30) | Asymptomatic (n=22) | Symptomatic (n=8) | |||
| Age (years, median (IQR)) | 60 | 43 (23) | 32 (13) | 37 (14) | <.0001 |
| Female (n (%)) | 60 | 18 (60) | 6 (27) | 5 (62) | .042 |
| Education (years, median (IQR)) | 60 | 14 (3) | 16 (4.5) | 12 (4) | .005 |
| Apolipoprotein-E ε4 (n (%)) | 60 | 14 (47) | 5 (23) | 4 (50) | .153 |
| EYO (years, median (IQR)) | 60 | −4 (23.64) | −18 (14) | 0 (7.46) | .0001 |
| Cortical PiB-PET SUVR (median (IQR)) | 52 (26, 21,5) | 1.03 (0.08) | 1.43 (0.71) | 2.54 (1.35) | <.0001 |
| PiB+ (cut-off=1.25; n (%)) | 52 (26, 21,5) | 0 (0) | 11 (52) | 5 (100) | - |
| Hippocampal volume (cm3, median (IQR)) | 53 (27, 21,5) | 8.76 (1.09) | 9.16 (1.04) | 6.69 (0.70) | .0008 |
| Precuneus thickness (mm, median (IQR)) | 53 (27, 21,5) | 2.34 (0.24) | 2.38 (0.13) | 2.29 (0.55) | .023 |
| Precuneus FDG-PET SUVR (median (IQR)) | 53 (27, 21,5) | 1.93 (0.23) | 1.87 (0.22) | 1.73 (0.58) | .005 |
| Cognitive composite score (median (IQR)) | 60 | 0.36 (0.75) | 0.28 (0.51) | −1.66 (1.35) | <.0001 |
| MMSE score (median (IQR)) | 60 | 29 (2) | 30 (1) | 21 (12) | <.0001 |
| CDR-SOB score (median (IQR)) | 60 | 0 (0) | 0 (0) | 4 (7) | <.0001 |
| Serum GFAP (pg/mL, median (IQR)) | 60 | 61 (32) | 61 (44) | 156 (312) | .0001 |
| CSF GFAP (pg/mL, median (IQR)) | 60 | 6926±4344 | 6289±5670 | 9816±4029 | .057 |
Among non-carriers, asymptomatic mutation carriers and symptomatic mutation carriers, the significance of the characteristic difference was calculated using linear mixed-effects models (for continuous outcomes) and generalized linear mixed-effects models with a logistic link (for categorical outcomes). All mixed models included a random family effect to account for the associations on the outcome measures between participants within the same family. Continuous measures are presented as median (IQR). N: total number of participants (with numbers of mutation non-carriers, asymptomatic mutation carriers and symptomatic mutation carriers, respectively). EYO: estimated years to symptom onset; PiB: 11C-Pittsburgh compound B; PET: Positron Emission Tomography; FDG: 18F-fluorodeoxyglucose; SUVR: Standard Uptake Value Ratio; MMSE: Mini-Mental State Examination; CDR-SOB: Clinical Dementia Rating – Sum of Boxes; GFAP: glial fibrillary acidic protein.
Plasma GFAP between mutation carriers and non-carriers
Plasma GFAP levels were higher in symptomatic mutation carriers compared with non-carriers (mean difference (95% Confidence Interval (CI)): 125 pg/mL (116 – 134); P<.0001) and asymptomatic mutation carriers (mean difference (95% CI): 107 pg/mL (100 – 114); P<.0001; Supplementary Figure 2). Plasma GFAP levels were higher in asymptomatic mutation carriers compared with non-carriers (mean difference (95% CI): 18 pg/mL (16 – 19); P=.035).
When stratifying the asymptomatic mutation carriers by Aβ−/+ status, plasma GFAP was higher in symptomatic mutation carriers compared with Aβ+ asymptomatic mutation carriers (mean difference (95% CI): 80 pg/mL (78 – 83); P=.002) and Aβ− asymptomatic mutation carriers (mean difference (95% CI): 124 pg/mL (123 – 126); p<.0001). Plasma GFAP was higher in Aβ+ asymptomatic mutation carriers compared with non-carriers (mean difference (95% CI): 45 pg/mL (33 – 56); P=.0003) and compared with Aβ− asymptomatic mutation carriers (mean difference (95% CI): 44 (40 – 48); P=.002), however, no significant difference was observed between Aβ− asymptomatic mutation carriers and non-carriers (Figure 1a).
Figure 1. Plasma GFAP in ADAD mutation non-carriers and carriers.
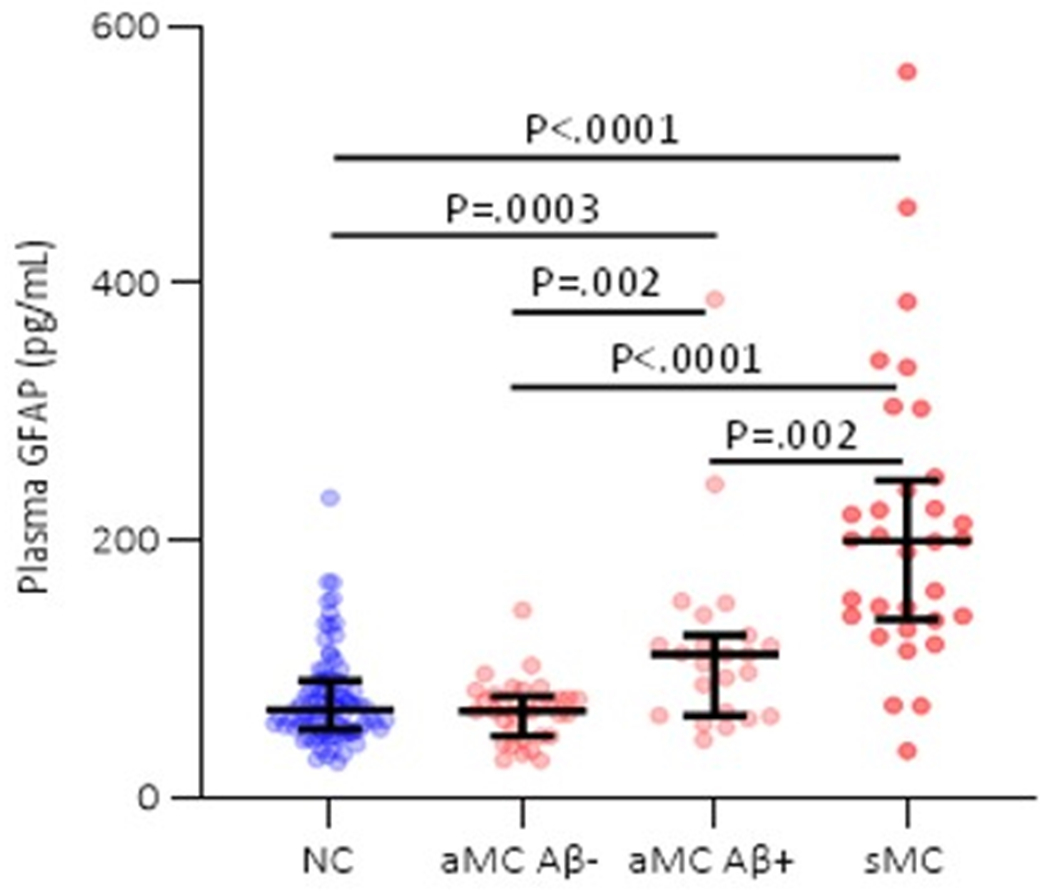
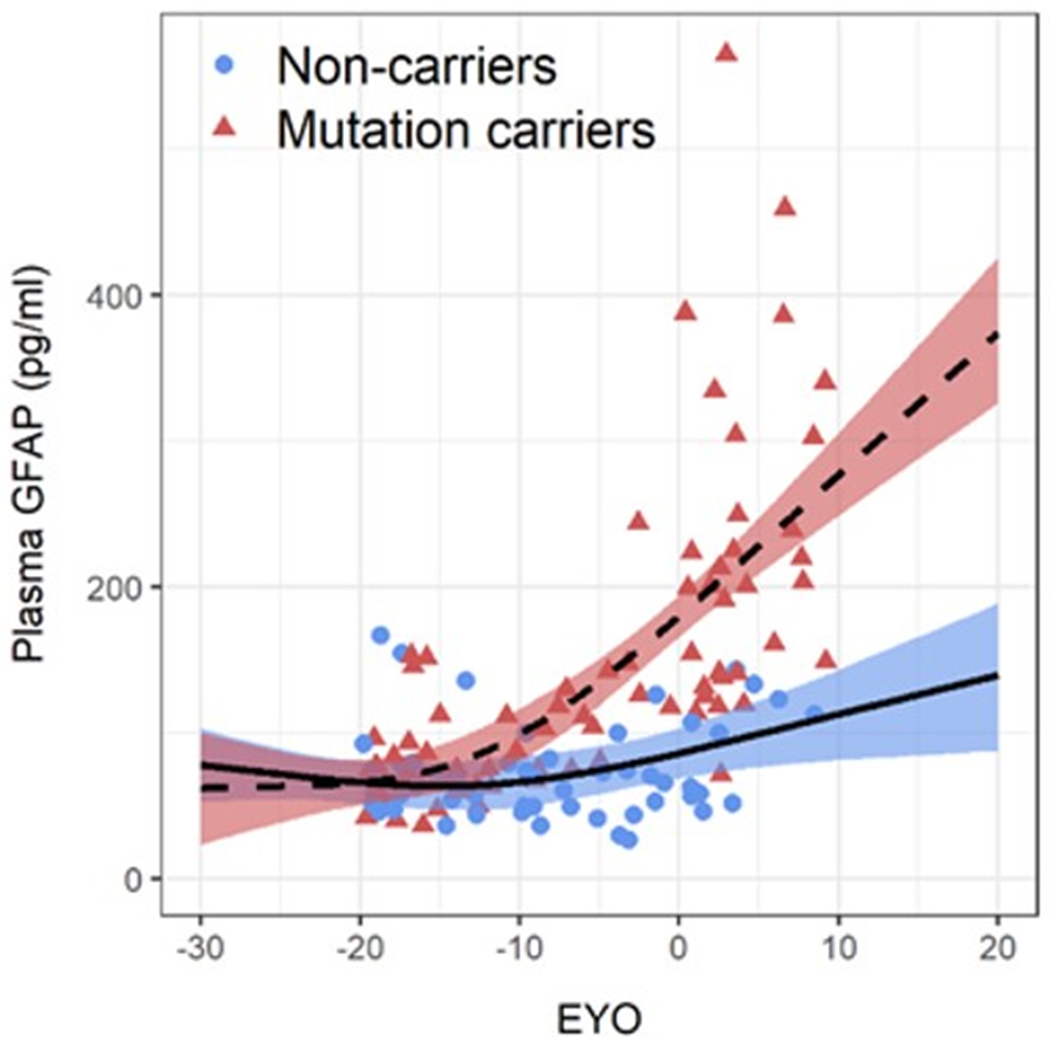
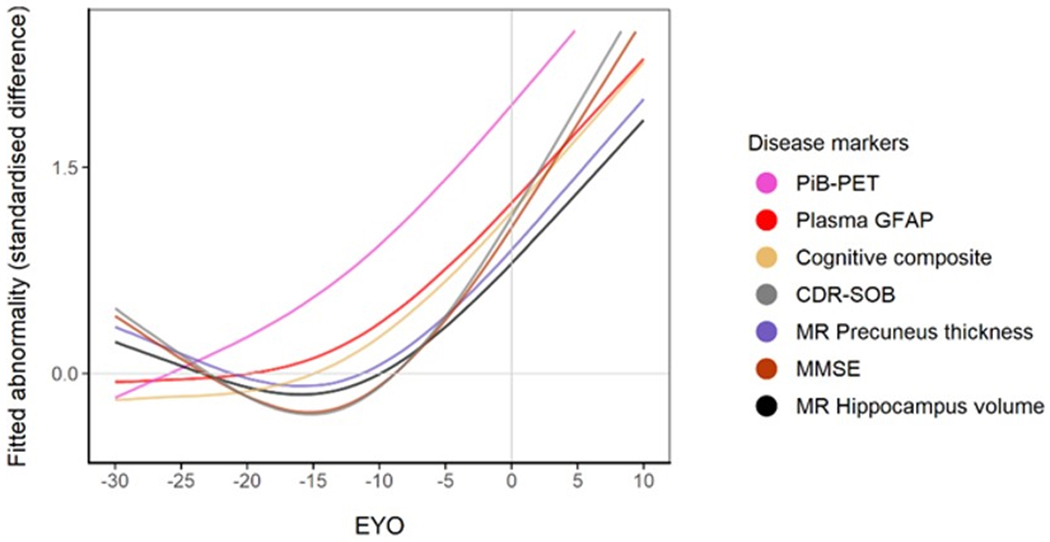
(a) Comparison of plasma GFAP levels between non-carriers (NC, n=86), Aβ-PET negative asymptomatic mutation carriers (aMC Aβ−, n=33), Aβ-PET positive asymptomatic mutation carriers (aMC Aβ+, n=23) and symptomatic mutation carriers (sMC, n=32). The middle line represents the median and the error bars represent the interquartile range. Natural log GFAP values were used to calculate P values from LMEMs adjusting for age and sex with family as a random effect with Tukey’s post hoc test for pairwise comparisons. P<.05 was considered statistically significant and all tests were two-tailed. (b) Plasma GFAP levels as a function of expected years to symptom onset (EYO) for mutation carriers and non-carriers. The curves and shaded 95% credible intervals represent the distributions of model fits derived by the Hamiltonian Markov chain Monte Carlo analyses (refer to Methods section). The displayed points on the EYO are jittered and the range limited to −20 to +10 to prevent inadvertent identification of individuals contributing to the study dataset. (c) Divergence curves show the standardised differences between mutation carriers and non-carriers by EYO, which was considered significant when the 99% credible interval did not include 0. The y-axis represents the degree of abnormality of the markers in a comparable way. The temporal EYO order of this divergence was after aberrant amyloid-β (Aβ) accumulation started and before cognitive decline and neurodegeneration: PiB-PET −18.4; Plasma GFAP −10.0; Cognitive Composite −7.9; CDR-SOB −5.3; MR Precuneus Thickness −5; MMSE −4.7; MR Hippocampal volume −4.2.
An EYO was calculated for each participant based on the difference between each participant’s age and the average age of symptom onset for the specific mutation in that family for both mutation carriers and non-carriers 27. When investigating plasma GFAP as a function of EYO in mutation carriers versus non-carriers, plasma GFAP was significantly higher in mutation carriers compared with non-carriers at −10.0 EYO (Figure 1b, Supplementary Figure 3). Using the same methods to estimate the sequence of events, we found that the divergence of plasma GFAP between mutation carriers and non-carriers lies between aberrant Aβ accumulation (EYO −18.4) and cognitive decline and structural neurodegeneration (EYO −7.9 to −4.2, Figure 1c).
Association of plasma GFAP with Aβ-PET and clinical progression in ADAD
In the mutation carriers, we observed a significant association between plasma GFAP and brain Aβ load (β=0.66, P<.0001). Upon stratifying mutation carriers by absence/presence of symptoms, the association of plasma GFAP levels with brain Aβ load was highly significant in the asymptomatic mutation carriers (β=0.57, P<.0001) but not in the symptomatic mutation carriers (Supplementary Table 1A, Figure 2). Additional adjustment for age did not have a major effect on these associations (Supplementary Table 1B). When stratifying this progression purely based upon cortical PiB-PET quartiles (Q1≤1.072, 1.072<Q2≤1.264, 1.264<Q3≤2.105) in mutation carriers, GFAP levels in PiB-PET quartiles 3 and 4 were significantly higher than GFAP levels in PiB-PET quartiles 1 and 2 (Figure 3a). This could be attributed to all participants in Q3 and Q4 meeting the Aβ+ threshold.
Figure 2. Association of plasma GFAP with brain Aβ load, hippocampal volume, precuneus thickness, FDG-PET and cognitive and functional performance.
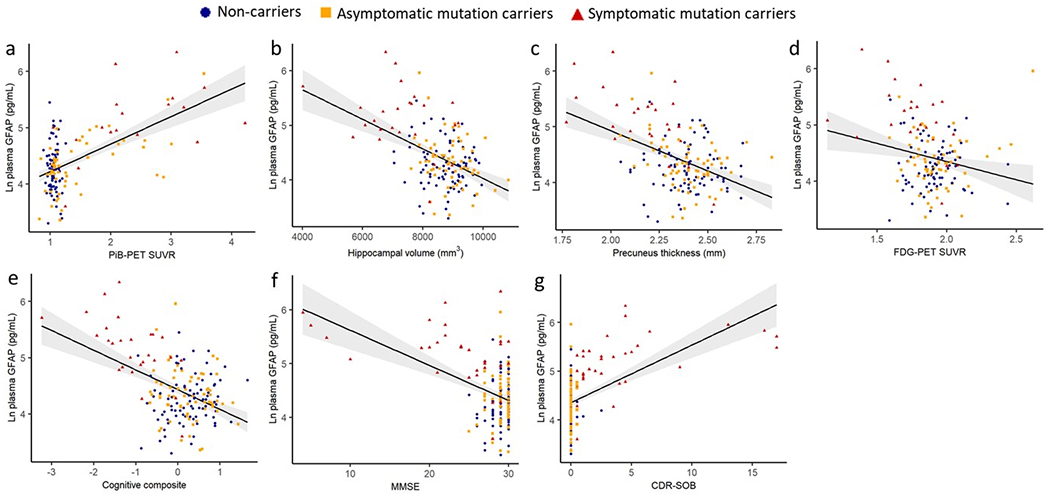
Associations between plasma GFAP and (a) PiB-PET SUVR (N =147; β=0.54, <.001) (b) hippocampal volume (N=168; β=−0.37, P <.001), (c) precuneus thickness (N = 168; β=−0.37, P<.001), (d) FDG-PET (N =159; β=−0.10, P=.187), (e) cognitive composite (N = 176; β=−0.44, P <.001), (f) MMSE (N =181; β=−0.34, P <.001) and (g) CDR-SOB (N = 184; β=0.45, P <.001) were assessed in all participants using LMEMs, with covariates age and sex (and education for cognition) with family as a random effect. Plasma GFAP was significantly associated with FDG-PET in all participants and in the mutation carrier subset before correcting for age (Supplementary Table 1). The shaded areas represent 95% confidence intervals. P<.05 was considered statistically significant and all tests were two-tailed.
Figure 3. Plasma GFAP levels and Aβ-PET load, Aβ-PET −/+ status and clinical progression in ADAD.
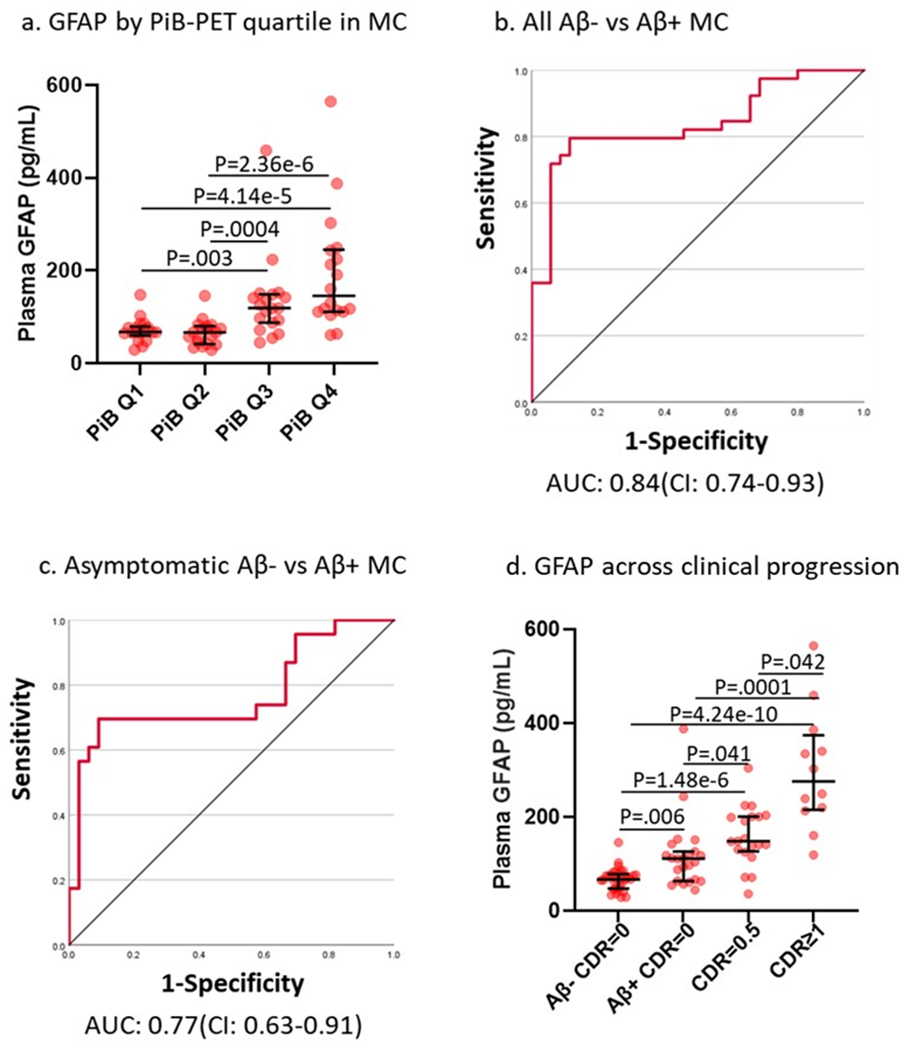
(a) Plasma GFAP by PiB-PET quartile (n(Q1: Aβ SUVR≤1.07)=18; n(Q2: 1.07<Aβ SUVR≤1.26)=19; n(Q3: 1.26<Aβ SUVR≤2.10)=19; n(Q4: Aβ SUVR>2.10)=18) in mutation carriers suggests higher plasma GFAP levels with increasing PiB-PET uptake (Kruskal-Wallis test followed by pairwise comparisons). Receiver operating characteristic curves using plasma GFAP to distinguish between Aβ-PET negative/positive based on PiB-PET SUVR in (b) all mutation carriers (Aβ− SUVR<1.25 (n=35); Aβ+ SUVR≥1.25 (n=39)) and (c) in asymptomatic mutation carriers (Aβ− SUVR<1.25 (n=33); Aβ+ SUVR≥1.25 (n=23)). (d) Higher plasma GFAP levels in mutation carriers (n(Aβ− CDR=0)=33, n(Aβ+ CDR=0)=23, n(CDR=0.5)=20, n(CDR≥1)=12) with clinical progression. GFAP increases with the onset of amyloid-β pathology and continues to increase with clinical severity in mutation carriers (Kruskal-Wallis test followed by pairwise comparisons). For plots in a and d, the middle line represents the median and the error bars represent the interquartile range. P<.05 was considered statistically significant and all tests were two-tailed.
Using ROC curves, plasma GFAP levels classified absence/presence of aberrant brain Aβ load (Aβ−/+, PiB-PET SUVR≥1.25 26) within the entire mutation carrier group with an area under the curve (AUC)=84% (95% CI:74%-93%) (Figure 3b). In the asymptomatic mutation carrier subset, GFAP was observed to have an AUC=77% (95% CI:63%-91%) for distinguishing between Aβ−/+ status (Figure 3c), similar to sporadic preclinical AD 23. Sensitivity and specificity along with model diagnostics (including optimal cut-off, accuracy, negative predictive value, and positive predictive value) are provided in Supplementary Table 2.
Additionally, we investigated plasma GFAP levels across clinical progression in mutation carriers, spanning the Aβ− cognitively normal status, Aβ+ cognitively normal status and CDR>0 symptomatic stages. Plasma GFAP levels increased with the onset of Aβ pathology in the asymptomatic stage and these levels increased further with disease severity (Figure 3d).
Cross-sectional association of plasma GFAP with neurodegeneration, cerebral glucose metabolism, cognitive and functional performance in ADAD
Associations of plasma GFAP with hippocampal volume (β=−0.47, P<.0001), precuneus thickness (β=−0.47, P<.0001), precuneus FDG-PET (β=−0.22, P=.004), a cognitive composite (β=−0.53, P<.0001), MMSE (β=−0.46, P<.0001) and CDR-SOB (β=0.55, P<.0001) were observed after adjusting for sex (and education for cognition; Figure 2, Supplementary Table 1). Within the mutation carriers, similar associations were observed (β between 0.27 and 0.66), while in the non-carriers no significant relationships were observed between GFAP and these markers (β between 0 and 0.12). As a sensitivity analysis, we adjusted the models for age. When adjusting for age, plasma GFAP levels and FDG-PET SUVR were no longer associated; all other associations persisted (Supplementary Table 1).
Association of plasma biomarkers with subsequent neurodegeneration, cerebral glucose hypometabolism, and cognitive and functional decline in ADAD
Prospective analyses were performed to investigate whether plasma GFAP was associated with subsequent neurodegeneration, cerebral glucose hypometabolism, cognitive and functional decline in mutation carriers with longitudinal MR (n=36), FDG-PET (n=36), cognitive composite (n=36), MMSE (n=38) and CDR-SOB (n=38) data available. We observed that GFAP was predictive of future hippocampal atrophy (Unstandardised beta (B) in all mutation carriers = −0.20, P=.013), cortical thinning (B= −0.04, P=.001) and cognitive and functional decline based on performance on the MMSE (B= −0.72, P=.041) and CDR-SOB (B= 0.57, P=.013) adjusting for age and sex (and education for cognition) (Supplementary Table 3, Figure 4). Plasma GFAP was not significantly associated with subsequent glucose hypometabolism represented by FDG-PET. Similar analyses were not performed for changes in brain Aβ load due to limited data.
Figure 4. Association of plasma GFAP with prospective neurodegeneration, cerebral glucose hypometabolism and cognitive and functional decline in mutation carriers.
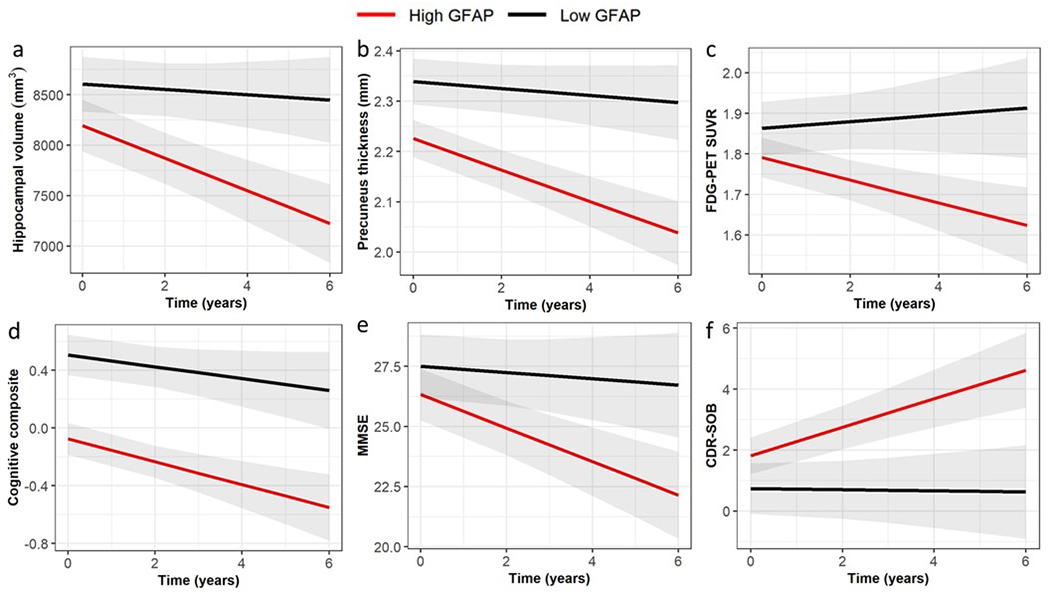
Relationships between plasma GFAP and change in neurodegeneration (represented by hippocampal volume (B=−0.202, P=.013) and precuneus thickness (B=−0.039, P=.001), cerebral glucose metabolism (FDG-PET, B=−0.031, P=.150) and cognition (represented by Mini-Mental State Examination (MMSE, B=−0.722, P=.041) and Clinical Dementia Rating – Sum of Boxes (CDR-SOB, B=0.570, P=.013) were assessed using LMEMs, with covariates age and sex (and education for cognition) with family as a random effect. Unstandardised B and P-values were calculated using natural log GFAP. For this visualization, the cut-off for low/high GFAP was based on the optimal cut-point at Youden’s index (low (<87.5 pg/mL, black) and high (≥87.5 pg/mL, red)). P<.05 was considered as statistically significant.
Serum and CSF GFAP in ADAD
Serum and plasma GFAP collected from twelve overlapping participants yielded very similar levels, that were strongly correlated between these blood matrices (Spearman’s Rho=0.902, P<.0001; Figure 5a). CSF GFAP levels showed moderate correlations with the blood matrices (Spearman’s Rho=0.64–0.65, P<.005; Figure 5b–c). In line with the plasma results, serum GFAP was higher in symptomatic (mean difference (95% CI): 81 pg/mL (73 – 88)) and asymptomatic mutation carriers (mean difference (95% CI): 26 pg/mL (25 – 27)) compared with non-carriers (Figure 5d). CSF GFAP was only higher in symptomatic mutation carriers (mean difference (95% CI): 3845 pg/mL (2811 – 4880)) compared with non-carriers (Figure 5e). Serum, but not CSF, GFAP trajectory diverged between mutation carriers and non-carriers at EYO −10.2 (Supplementary Figure 3).
Figure 5. GFAP in serum and CSF in ADAD mutation non-carriers and carriers.
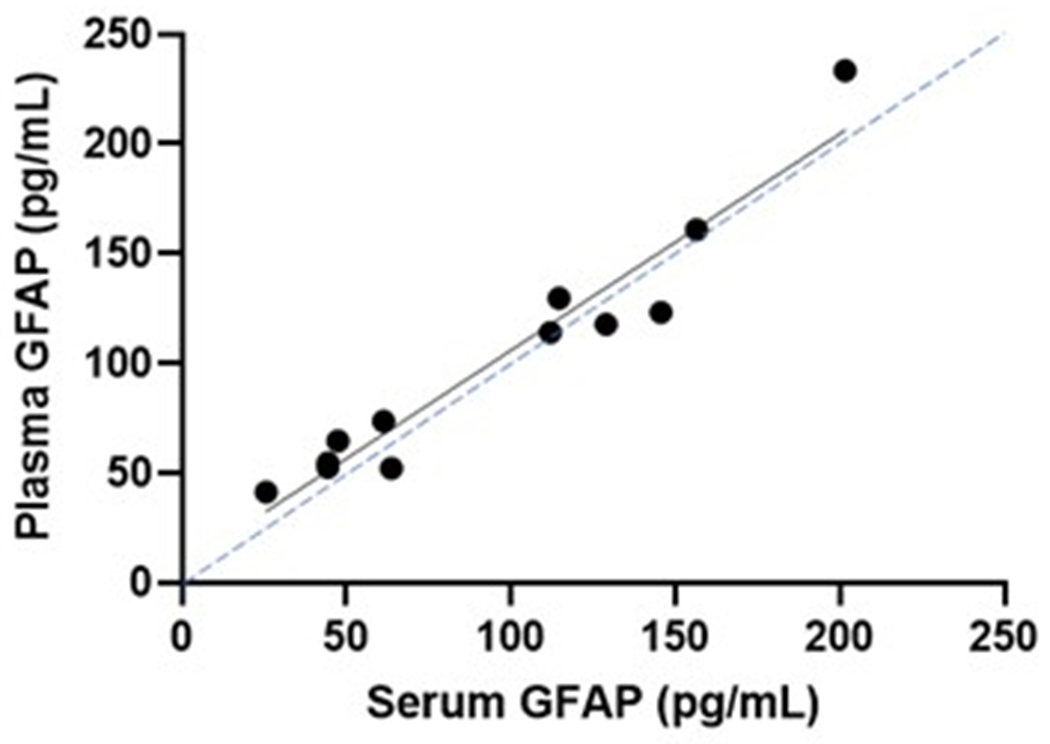
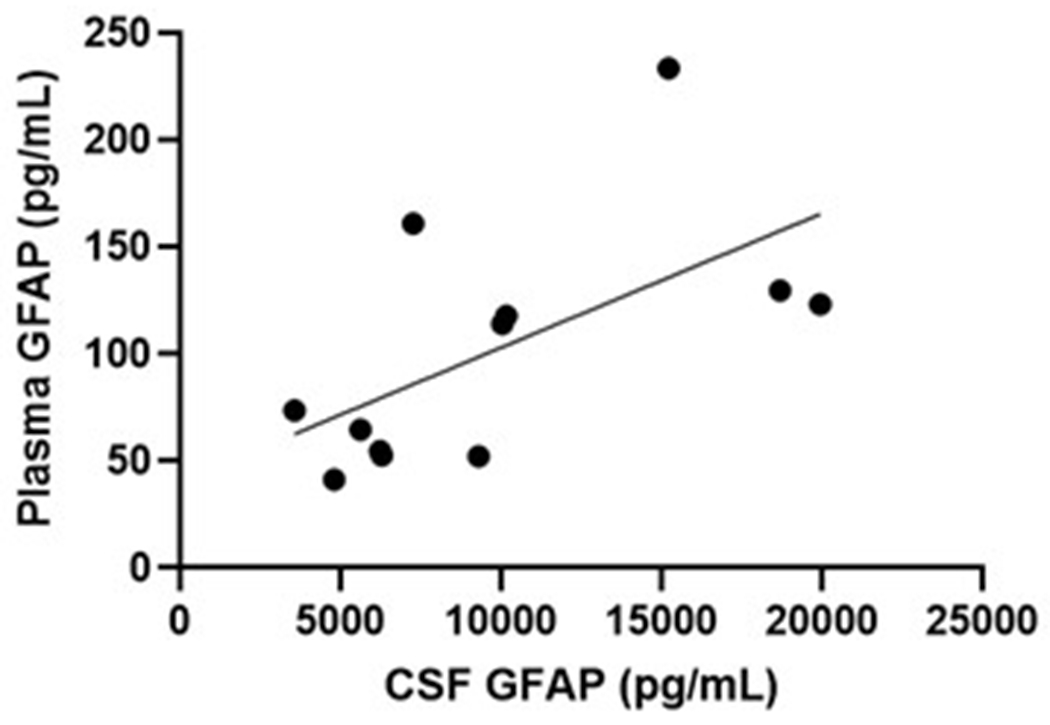
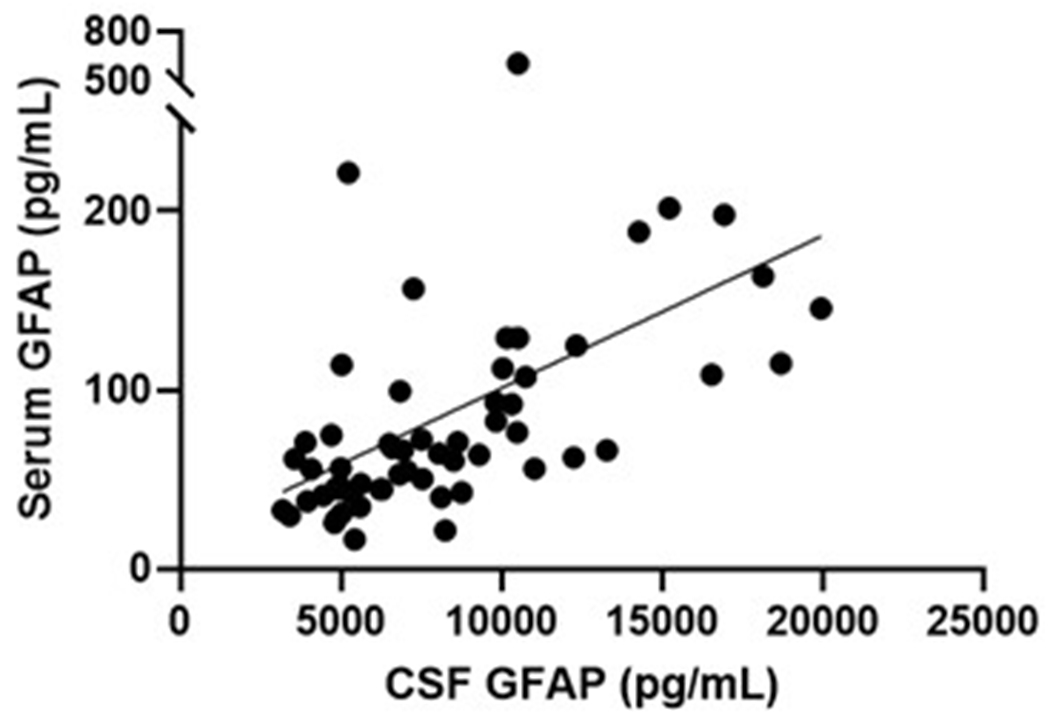
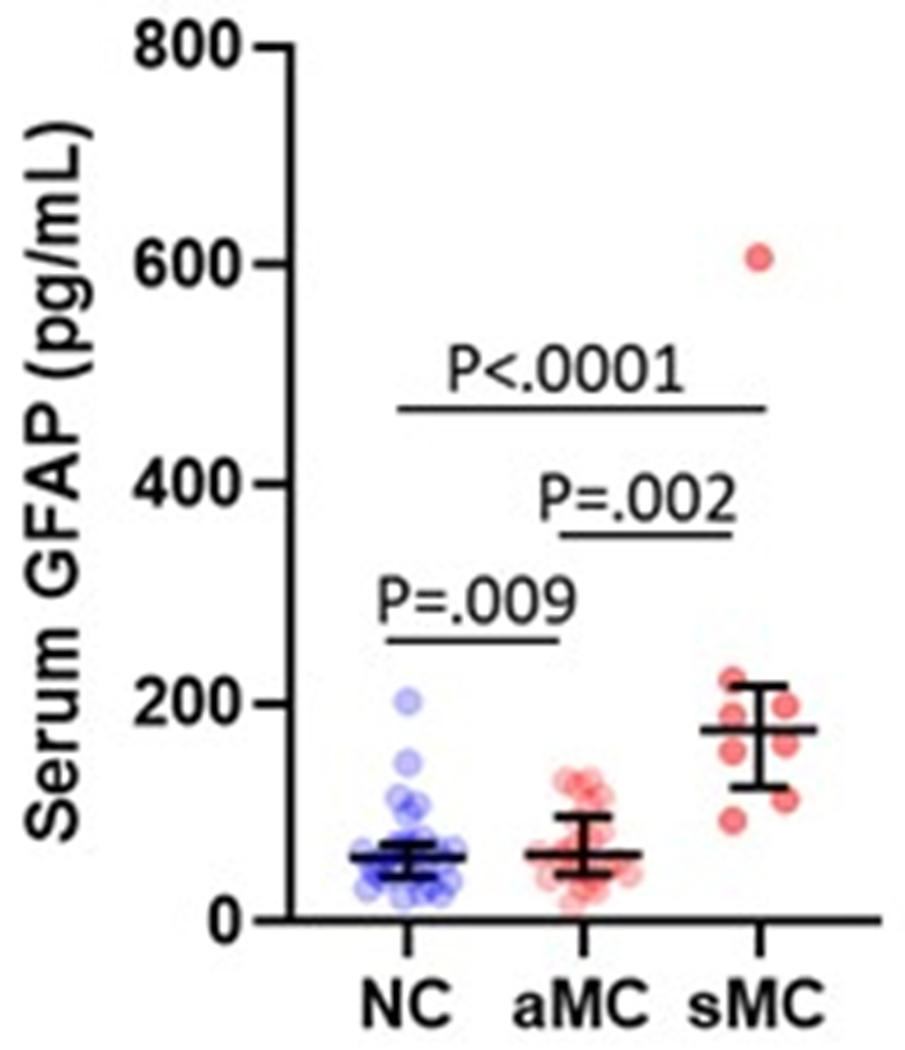
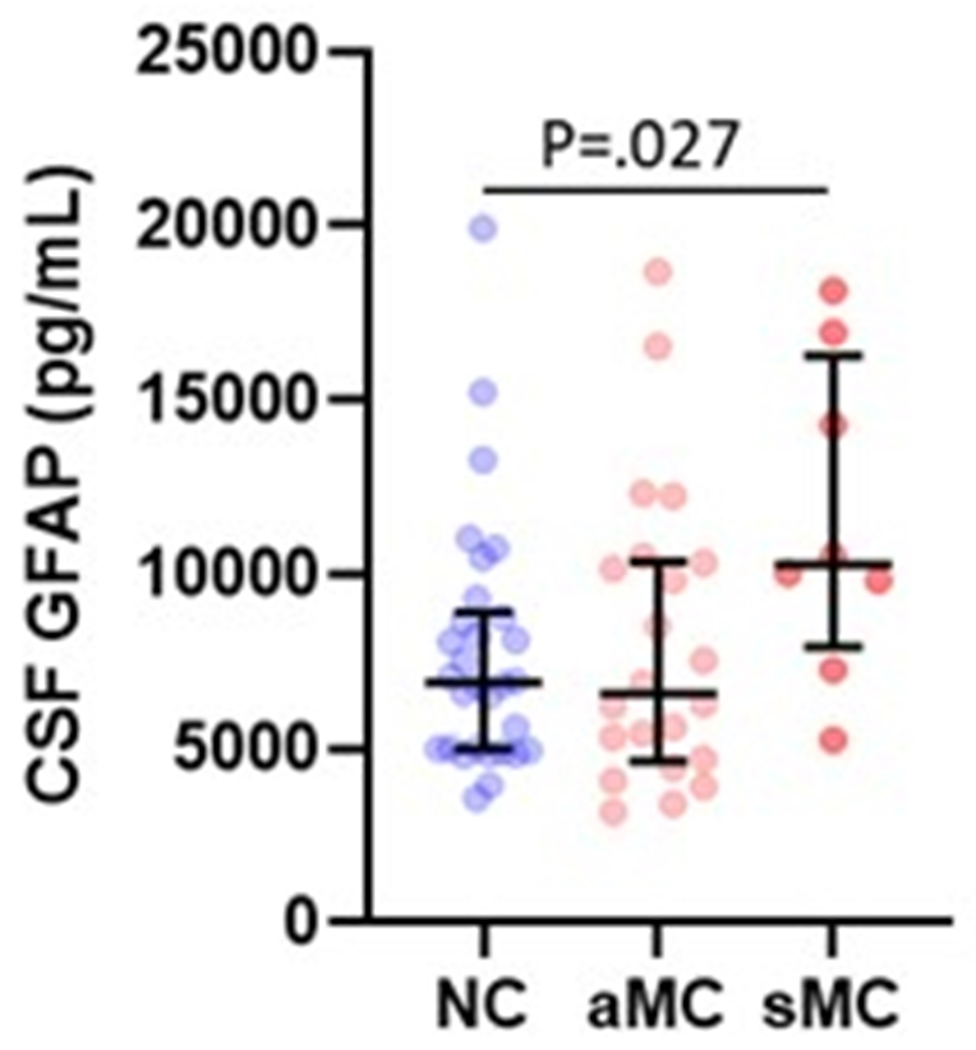
(a) Association between serum GFAP (N=12) and plasma GFAP (Spearman’s Rho=0.902, P= P<.0001). Association between CSF GFAP and blood matrices (b) plasma GFAP (Spearman’s Rho=0.650, P=.022), (c) serum GFAP (N=60, Spearman’s Rho=0.640, P=3.78e-8). Comparison of (d) serum and (e) CSF GFAP levels are presented between non-carriers (NC, n=30), asymptomatic mutation carriers (aMC, n=22) and symptomatic mutation carriers (sMC, n=8). For plots in d and e, the middle line represents the median and the error bars represent the interquartile range. Natural log GFAP values were used to calculate P values from LMEMs adjusting for age and sex with family as a random effect. Tukey’s post hoc test was used for pairwise comparisons. P<.05 was considered statistically significant and tests were two-tailed.
Serum GFAP (β=0.38, P=.002), but not CSF GFAP (β=0.15, P=.27), was associated with brain Aβ load, however, after stratifying for mutation carrier status, did not reach statistical significance thresholds (β=0.32, P=.079). Serum GFAP was more strongly associated with neurodegeneration (hippocampal volume β=−0.46, P=.001; precuneus thickness β=−0.36, P=.009); cerebral glucose metabolism (β=−0.35, P=.008); cognition (cognitive composite β=−0.59, P<.001; MMSE β=−0.45, P<.001) and functional (CDR-SOB β=0.46, P<.001) performance in all participants than CSF GFAP (hippocampal volume β=−0.39, P=.002; precuneus thickness β=−0.28, P=.040; cognitive composite β=−0.34, P=.006; MMSE β=−0.29, P=.019; CDR-SOB β=0.28, P=.021, Supplementary Tables 4 and 5). Similar observations were found in the mutation carrier subset. Associations between serum, but not CSF, GFAP and hippocampal volume (β=−0.50, P=.006), cognitive composite (β=−0.37, P=.004), and CDR-SOB (β=0.35, P=.029) persisted after correcting for age in mutation carriers.
Discussion
The main findings from the current study are that plasma GFAP levels (i) were elevated in ADAD mutation carriers relative to non-carriers 10 years prior to symptom onset, which was after aberrant Aβ accumulation but prior to cognitive decline and structural neurodegeneration; (ii) differentiated cortical Aβ PET+ from Aβ PET- in all mutation carriers and in the asymptomatic mutation carrier subset with AUCs of 84% and 77% respectively; (iii) were associated with brain Aβ load more strongly in the asymptomatic stage than in the symptomatic stage; (iv) were associated with cerebral atrophy and worse cognition in mutation carriers; (v) were associated with subsequent hippocampal atrophy, cortical thinning and cognitive decline in mutation carriers; and (vi) had a similar AD-related elevation pattern to serum GFAP but was much more pronounced compared to CSF GFAP.
Elevated plasma GFAP in mutation carriers compared with non-carriers was observed around 10 years prior to expected symptom onset and is consistent with studies reporting higher plasma GFAP in Aβ PET defined preclinical sporadic AD 21,23,37–39. Elevation in plasma GFAP relative to other biomarker and clinical events was observed after aberrant Aβ accumulation and before neurodegeneration and cognitive decline. This is in line with studies in transgenic AD mouse models showing that astrocyte reactivity in the presence of Aβ pathology may drive disease progression in AD 8,11,40,41. In addition, reports on the high discriminative performance of plasma GFAP for Aβ PET −/+ individuals with AUCs ranging between 76% to 81% within the sporadic AD continuum 21,23,37–39 corroborate our observations in ADAD (AUCs 77%-84%), highlighting the commonalities between sporadic AD and ADAD, and the utility of ADAD as a model to explore biomarker trajectories in sporadic AD 42.
It is well established that astrocytes respond dynamically to AD pathology by becoming reactive wherein, reactive astrocytes undergo morphological, molecular and functional changes in response to AD pathology with marked changes in GFAP expression reported in AD patients 40,43. In line with this, in the current study, we observed higher plasma GFAP levels with increasing brain Aβ load in ADAD mutation carriers and significantly higher Aβ-PET signal prior to significantly higher plasma GFAP in ADAD mutation carriers, compared with non-carriers, suggesting that plasma GFAP is a marker of Aβ related reactive astrogliosis. It could be posited that different markers reflect different states of astrocytes within the different stages of the ADAD pathogenesis trajectory16. Therefore, future studies are needed to provide insight into the relationship of different astrocyte markers with astrocyte reaction within the different stages of the ADAD pathogenesis trajectory, in addition to investigating the association between plasma GFAP, brain GFAP and MAO-B PET signal.
In the current study, we also observed higher plasma GFAP levels with advancing clinical progression (plasma GFAP in MC with CDR≥1 > MC with CDR=0.5 > Aβ+ MC with CDR=0 > Aβ− MC with CDR=0). This is in line with a previous study on plasma GFAP in the AD continuum, wherein median levels were higher in individuals with a more advanced clinical diagnosis 19. Similar to plasma/serum GFAP levels, CSF GFAP was also observed to be elevated in the mutation carriers; however, in line with previous reports, this relationship was specific to the dementia stage of AD, 44,45 or when both Aβ and tau PET biomarkers were positive 19,46. Taken together, these findings suggest that plasma GFAP (but not CSF GFAP) may serve as an early biomarker of AD associated neuropathological changes. It could therefore be speculated that plasma GFAP is more closely associated with astrocyte reactivity because of Aβ accumulation, whilst CSF GFAP is more reflective of reactive astrogliosis due to advanced neurodegeneration 11. Further, given that astrocyte end feet encompass brain capillaries, it could be posited that blood matrices are more sensitive to astrocyte reaction in AD than the CSF 40. Future studies employing stable isotope labelling kinetics, animal and/or cell models are required to explore the release and turnover of GFAP in different matrices in AD.
In line with our observations, plasma GFAP levels have been reported to be positively associated with cognitive dysfunction and cerebral atrophy 21,47,48. These clinical observations fit well with pathology studies that show a gradual increase of GFAP levels in the brain in relation to AD severity 49,50. Plasma GFAP levels have also been reported to associate with longitudinal cognitive decline and cerebral atrophy, which is confirmed in our study, 51–54 and higher incident dementia risk 39,47. Thus, familial, clinical, and population-based studies suggest that increased plasma or serum GFAP levels not only associate with, but also predict, disease progression in AD.
A limitation of this study involves the inclusion of a modest Aβ-PET imaged sample size subset, particularly among the symptomatic mutation carriers. For CSF samples, due to a modest sample size of mutation carriers (n=30), subtle effects could have been missed. However, the sample size was identical to that of serum, which showed similar relations as plasma. GFAP levels have been shown to be sensitive to freeze-thaw cycles in CSF but not in plasma/serum 55,56. However, this is unlikely to affect our results, because both, mutation carrier and non-carrier samples, underwent the same freeze-thaw cycles, and stronger blood-matrix than CSF effects with respect to Aβ pathology is supported by earlier work 19. It is also important to note that the analysis of plasma biomarker changes as a function of EYO may be influenced by sample size. Therefore, interpretation of the EYO at which plasma GFAP changes were observed in this study should be considered relative to other markers in the sequence of events of ADAD. Additionally, GFAP is a putative marker of astrocyte reactivity, and it has been reported to be associated with various pathological conditions such as traumatic brain injury57,58, major depressive disorder59,60 and thyroid dysfunction61, although further confirmatory studies are required. Recent studies also show that other putative blood-based biomarkers for AD, such as p-tau181 and p-tau217, or for neurodegeneration, such as NFL, are associated with other comorbidities 62,63. Therefore, it is possible to find abnormal plasma GFAP levels in some participants irrespective of mutation status at an earlier EYO. It is also important to note that while GFAP is a putative astrocyte reactivity marker in the literature 64, not all astrocytes produce GFAP 65–70. Further, given that PSEN1 mutations before or after codon 200 position are known to affect the balance of parenchymal versus vascular Aβ burden 71,72, pilot findings on stratifying PSEN1 mutation carriers based on mutation position before or after codon 200 or the mutation type (PSEN1 or APP) showed that plasma GFAP levels are significantly elevated in the following order: PSEN1 MC before codon 200 followed by PSEN1 MC after codon 200 followed by APP MC, compared with non-carriers (Supplementary Figure 4), however, given the modest sample size of the subgroups, further confirmatory studies are required. Future studies with longitudinal GFAP measures are required to (i) calculate the rate of change of GFAP and how early its levels begin to differ between mutation carriers and non-carriers, (ii) investigate whether the rate of change of GFAP improves the predictive value for future decline and, (iii) investigate true longitudinal changes within individuals.
To conclude, findings from the current study indicate that plasma, serum and CSF GFAP are elevated in ADAD and, suggest that plasma GFAP is a marker of Aβ related astrocyte reactivity that is associated with cognitive decline and neurodegeneration.
Supplementary Material
Highlights.
Plasma GFAP elevations appear a decade before expected symptom onset in ADAD
Plasma GFAP was associated to amyloid positivity in asymptomatic ADAD
Plasma GFAP increased with clinical severity and predicted disease progression
Plasma and serum GFAP carried similar information in ADAD, while CSF GFAP did not
Research in context.
1. Systematic review:
The authors reviewed the literature using PubMed. Studies on plasma glial fibrillary acidic protein (GFAP), a putative plasma biomarker of Alzheimer’s disease (AD), in autosomal dominant AD (ADAD) are lacking.
2. Interpretation:
In ADAD, plasma GFAP elevations appear prior to symptom onset, after β-amyloid accumulation and prior to neurodegeneration and cognitive decline. Plasma GFAP levels were related to disease progression. Serum GFAP showed similar relationships, but these were less pronounced for CSF GFAP. Our findings aid the interpretation of plasma GFAP levels in sporadic AD, and support its role as clinical biomarker in AD.
3. Future directions:
Longitudinal GFAP measures are required to (i) calculate the rate of change of GFAP and how early its levels begin to differ between mutation carriers and non-carriers and (ii) investigate whether the rate of change of GFAP improves the predictive value for future decline.
Acknowledgements
Data collection and sharing for this project was supported by the Dominantly Inherited Alzheimer Network (DIAN, U19AG032438) funded by the NIA, the National Health and Medical Research Council, Australia (NHMRC, APP1129627), the German Center for Neurodegenerative Diseases (DZNE), and partial support by the Research and Development, grants for Dementia from Japan Agency for Medical Research and Development. This work was additionally supported by R01 AG071865 (JPC) and by an Alzheimer’s Association Grant (AARF-21-846786; SAS). The study also received support from the Lions Alzheimer’s Foundation and Lions Club International for their generous donations that allowed the purchase of the Simoa-HD-X instrument used in this study. We also acknowledge the Australian Alzheimer’s Research Foundation. We thank Philip Scheltens for his early stage feedback, Alzheimer Nederland (Fellowship 2018) and Stichting Dioraphte (Netherlands Neurdegeneration in Families project). This manuscript has been reviewed by DIAN Study investigators for scientific content and consistency of data interpretation with previous DIAN Study publications. The authors gratefully acknowledge the altruism of the participants and their families and contributions of the DIAN research and support staff at each of the participating sites for their contributions to this study.
Conflict of Interest and Disclosure Statement
All authors report no conflicts of interest related to this manuscript. These are the disclosures per author: Pratishtha Chatterjee has nothing to disclose; Lisa Vermunt received grants from ZonMw, Alzheimer Nederland and OLINK, paid to her institution, and consultancy fees for Roche, paid to her institution. Brian A. Gordon has nothing to disclose. Steve Pedrini has nothing to disclose. Lynn Boonkamp has nothing to disclose Nicola J. Armstrong has nothing to disclose Chengjie Xiong has received grants or contracts from NIH and consulting fees from DIADEM. He participated on a Data Safety Monitoring Board or Advisory Board for the FDA Medical Imaging Drug Advisory Committee. He also serves on the External advisory Committee for University of Wisconsin Alzheimer disease research center. Abhay K. Singh has nothing to disclose Yan Li has nothing to disclose Hamid R. Sohrabi received funding from Alnylam, Biogen, Australian Alzheimer’s Research Foundation Partially, Medical Research Future Fund-Australia (AU-ARROW and SenseCog), NIH Subcontract and other financial interests director of Memory Clinic SMarT Minds WA and Rater for Alector Pharma. Kevin Taddei has nothing to disclose. Mark Molloy has nothing to disclose. Tammie L. Benzinger has grants to her institution from NIH, and received personal payments from Biogen and Eisai. She has participated on a Data Safety Monitoring Board or Advisory Board for Biogen (payments made to her). She has received Precursor for flortaucipir from Avid Radiopharmaceuticals. John C. Morris has received National Institutes of Health (NIH) grants, royalties or licenses for clinical dementia rating (CDR) registration, consulting fees from Barcelona BetaBrain Research Center and from Centre for Brain Research, Bangalore, India. He has received payment or honoraria from Montefiore, New York Grand Rounds. He has received support for attending meetings and/or travel from TS Srinavasan 40th Oration, India; World Congress of Neurology; Cure Alzheimer Board meeting; and CBR International Advisory Board. He has held a leadership or fiduciary role in Cure Alzheimer Board Meeting. Celeste M. Karch has nothing to disclose. Sarah Berman has nothing to disclose. Jasmeer P. Chhatwal has received grants or contracts from NIH and Doris Duke Charitable Foundation Career Dev Award to his institution. He has received support for attending meetings and/or travel from NIH and Doris Duke Charitable Foundation. Carlos Cruchaga has nothing to disclose. Neill R. Graff-Radford has nothing to disclose. Gregory S Day reports grant funding NIH/NIA (K23AG064029) and expert testimony Barrow Law, Clinical Director of the Anti-NMDA Receptor Foundation, stock Parabon Nanolabs, Inc Martin R. Farlow is a coinventor for US Patent No. 6184435 (does not relate to this manuscript). He has received consulting fees from Avanir, Biogen, Eli Lilly & Company, Cognition Therapeutics, Longeveron, Otsuka Proclara Therapeutics, Lexeo, Ionis, McClena and Athira. He has received payment for expert testimony: confidential. Nick Fox: His institution has received payments from Ixico for the use of the Boundary Shift Intergral. He has provided consultancy for Eli Lilly and for Ionis - payments were to his institution. He has participated in advisory boards for Roche and Biogen - payment was to his institution. He has served on a DSMB for Biogen - payment was to him. Alison Goate has received NIH grants and grants or contracts from Rainwater Charitable Foundation, Picower Foundation, Neurodegeneration Consortium. She has received royalties or licenses from Taconic, Athena Diagnostics. She has received consulting fees from Genentech, UK DRI, VIB centers in Antwerp and Leuven. She has received personal honoraria for presentations from Eisai, GSK, AbbVie. Jason Hassenstab has received several NIH grants, payments to institution from BrightFocus foundation and personal consulting fees from Roche. He has participated on a Data Safety Monitoring Board or Advisory Boardfor Eisai. Payments were made to him. Jae-Hong Lee has nothing to disclose. Johannes Levin reports speaker fees from Bayer Vital, Biogen, and Roche, consulting fees from Axon Neuroscience and Biogen, author fees from Thieme medical publishers and W. Kohlhammer GmbH medical publishers, non-financial support from Abbvie and compensation for duty as part-time CMO from MODAG, outside the submitted work. Eric McDade has received grants or contracts from National Institutes of Health; Janssen; Eli Lilly; and Roche. He has received royalties or licenses from UpToDate. He has received personal consulting fees from: DSMB Eli Lilly, DSMB Alzamend, and Fondation Alzheimer. He has received payment or honoraria from Eisai (personal payment). He has received personal support for attending meetings and/or travel from Fondation Alzheimer Association. He has had any patents planned, issued, or pending: Novel Tau isoforms to predict onset of symptoms and dementia in Alzheimer’s disease. He has participated on a Data Safety Monitoring Board or Advisory Board: see above. Hiroshi Mori reports a grant for DIAN-J by AMED (Japanese Government). Takeshi Ikeuchi has received grants by AMED. He has received honoraria for lectures from Eisai, Daiichi-Sankyo, Ono, Takeda, and Ajinomoto. Kazushi Suzuki has nothing to disclose. Richard J. Perrin has received grants or contracts from NIH. Gregory Day has received grants to institution: K23AG064029 (NIH/NIA), Chan Zuckerberg Initiative (Neurodegeneration Challenge Network; WU-20–421), Alzheimer’s Association (LDRFP-21–824473). He has received personal payments: DynaMED (Topic Editor, Dementia), Parabon Nanolabs (Consulting for NIA SBAR Grant) Texas Neurological Institute, Continuing Education Company, Barrow Law. He has held a leadership or fiduciary role in Anti-NMDA Receptor Encephalitis Foundation, Inc. Raquel Sanchez-Valle has received support for the present manuscript: ISCIII, Spain (grant number PI20/00448). She received grants or contracts from ISCIII, Sage Ph, and Biogen, payments were made to her institution. She reports personal fees from Wave pharmaceuticals and Ionis Pharmaceuticals for attending Advisory board meetings, and personal fees from Roche diagnostics, Janssen, and Neuraxpharm for educational activities. Peter R. Schofield has received support for the present manuscript: US National Institutes of Health, National Institute of Aging, Grant No UF1AG032438. He has received grants or contracts from: NSW Health Project, NHMRC Investigator Grant, NHMRC NNIDR Boosting Dementia Research Grants, MRFF Mental Health Pharmacogenomics 2020 Grant, Spanish Internationalisation Network I-Link Grant. He has held a leadership or fiduciary role in Neuroscience Research Australia, Neuroscience Research Australia Foundation, The Health-Science Alliance, Schizophrenia Research Institute, Australian Association of Medical Research Institutes, Australian Dementia Network, StandingTall Pty Ltd, Australasian Neuroscience Society, Maridulu Budyari Gumal - Sydney Partnership for Health Education, Research and Enterprise (SPHERE), The Judith Jane Mason & Harold Stannett Williams Memorial Foundation, Business Events Sydney. Allan Levey reports stock option in EmTheraPro. Mathias Jucker has received grants or contracts from DFG, IMI2, AluCure. He has received payment or honoraria from Roche, Synapsis. Colin L. Master has nothing to disclose. Anne Fagan has received many grants from the NIH/National Institute of Aging (NIA), paid to her institution. She also received a research grant from Centene, paid to her institution. She is on the scientific advisory boards for Roche Diagnostics/Genentech and also a consultant for Diadem, DiamiR, and Siemens Healthcare Diagnostics Inc; payments were made to her. Randall J. Bateman has received support for the present manuscript from NIA. He has received grants or contracts from Avid Radiopharmaceuticals, Janssen, Eisai, Genentech, Abbvie, Biogen, Centene, United Neuroscience, Eli Lilly & Co, Hoffman-LaRoche. He has equity ownership interest in C2N Diagnostics and receive royalty income based on technology (stable isotope labeling kinetics and blood plasma assay) licensed by Washington University to C2N Diagnostics. He has received consulting fees from Janssen, Eisai, C2N Diagnostics, AC Immune, Amgen, Hoffman-LaRoche, and Pfizer. He has received support for attending meetings and/or travel from AC Immune, Hoffman-LaRoche. He has participated on a Data Safety Monitoring Board or Advisory Board for C2N Diagnostics, Hoffman-LaRoche, and Pfizer. He has held stock or stock options in entities related to the current manuscript and/or area of research included in this manuscript or related area of research: C2N Diagnostics- Equity ownership interests. Ralph Martins has nothing to disclose. Charlotte Teunissen has a collaboration contract with ADx Neurosciences, performed contract research or received grants from Probiodrug, AC Immune, Biogen-Esai, CogRx, Toyama, Janssen prevention center, Boehringer, AxonNeurosciences, Fujirebio, EIP farma, PeopleBio and Roche (fees paid to Amsterdam UMC.
References
- 1.Scheltens P, et al. Alzheimer’s disease. Lancet 397, 1577–1590 (2021). [DOI] [PMC free article] [PubMed] [Google Scholar]
- 2.Teunissen CE, et al. Blood-based biomarkers for Alzheimer’s disease: towards clinical implementation. Lancet neurology 21, 66–77 (2022). [DOI] [PubMed] [Google Scholar]
- 3.Oeckl P, et al. Serum GFAP differentiates Alzheimer’s disease from frontotemporal dementia and predicts MCI-to-dementia conversion. J Neurol Neurosurg Psychiatry (2022). [DOI] [PubMed] [Google Scholar]
- 4.Thijssen EH, et al. Differential diagnostic performance of a panel of plasma biomarkers for different types of dementia. Alzheimers Dement (Amst) (2022). [DOI] [PMC free article] [PubMed] [Google Scholar]
- 5.Escartin C, et al. Reactive astrocyte nomenclature, definitions, and future directions. Nat Neurosci 24, 312–325 (2021). [DOI] [PMC free article] [PubMed] [Google Scholar]
- 6.Liddelow SA, et al. Neurotoxic reactive astrocytes are induced by activated microglia. Nature 541, 481–487 (2017). [DOI] [PMC free article] [PubMed] [Google Scholar]
- 7.Long JM & Holtzman DM Alzheimer Disease: An Update on Pathobiology and Treatment Strategies. Cell 179, 312–339 (2019). [DOI] [PMC free article] [PubMed] [Google Scholar]
- 8.Habib N, et al. Disease-associated astrocytes in Alzheimer’s disease and aging. Nat Neurosci 23, 701–706 (2020). [DOI] [PMC free article] [PubMed] [Google Scholar]
- 9.Muramori F, Kobayashi K & Nakamura I A quantitative study of neurofibrillary tangles, senile plaques and astrocytes in the hippocampal subdivisions and entorhinal cortex in Alzheimer’s disease, normal controls and non-Alzheimer neuropsychiatric diseases. Psychiatry Clin Neurosci 52, 593–599 (1998). [DOI] [PubMed] [Google Scholar]
- 10.Carter SF, et al. Evidence for astrocytosis in prodromal Alzheimer disease provided by 11C-deuterium-L-deprenyl: a multitracer PET paradigm combining 11C-Pittsburgh compound B and 18F-FDG. J Nucl Med 53, 37–46 (2012). [DOI] [PubMed] [Google Scholar]
- 11.Heneka MT, et al. Neuroinflammation in Alzheimer’s disease. Lancet neurology 14, 388–405 (2015). [DOI] [PMC free article] [PubMed] [Google Scholar]
- 12.Scholl M, et al. Early astrocytosis in autosomal dominant Alzheimer’s disease measured in vivo by multi-tracer positron emission tomography. Sci Rep 5, 16404 (2015). [DOI] [PMC free article] [PubMed] [Google Scholar]
- 13.Rodriguez-Vieitez E, et al. Diverging longitudinal changes in astrocytosis and amyloid PET in autosomal dominant Alzheimer’s disease. Brain 139, 922–936 (2016). [DOI] [PMC free article] [PubMed] [Google Scholar]
- 14.Vilaplana E, et al. Cortical microstructural correlates of astrocytosis in autosomal-dominant Alzheimer disease. Neurology 94, e2026–e2036 (2020). [DOI] [PMC free article] [PubMed] [Google Scholar]
- 15.Villemagne VL, et al. Assessing reactive astrogliosis with (18)F-SMBT-1 across the Alzheimer’s disease spectrum. J Nucl Med (2022). [DOI] [PMC free article] [PubMed] [Google Scholar]
- 16.Rodriguez-Vieitez E, et al. Astrocytosis precedes amyloid plaque deposition in Alzheimer APPswe transgenic mouse brain: a correlative positron emission tomography and in vitro imaging study. Eur J Nucl Med Mol Imaging 42, 1119–1132 (2015). [DOI] [PMC free article] [PubMed] [Google Scholar]
- 17.Giannoni P, et al. The pericyte-glia interface at the blood-brain barrier. Clin Sci (Lond) 132, 361–374 (2018). [DOI] [PubMed] [Google Scholar]
- 18.Plog BA, et al. Biomarkers of traumatic injury are transported from brain to blood via the glymphatic system. J Neurosci 35, 518–526 (2015). [DOI] [PMC free article] [PubMed] [Google Scholar]
- 19.Benedet AL, et al. Differences Between Plasma and Cerebrospinal Fluid Glial Fibrillary Acidic Protein Levels Across the Alzheimer Disease Continuum. JAMA Neurol 78, 1471–1483 (2021). [DOI] [PMC free article] [PubMed] [Google Scholar]
- 20.Oeckl P, et al. Glial Fibrillary Acidic Protein in Serum is Increased in Alzheimer’s Disease and Correlates with Cognitive Impairment. J Alzheimers Dis 67, 481–488 (2019). [DOI] [PubMed] [Google Scholar]
- 21.Verberk IMW, et al. Combination of plasma amyloid beta(1–42/1–40) and glial fibrillary acidic protein strongly associates with cerebral amyloid pathology. Alzheimers Res Ther 12, 118 (2020). [DOI] [PMC free article] [PubMed] [Google Scholar]
- 22.Pereira JB, et al. Plasma GFAP is an early marker of amyloid-beta but not tau pathology in Alzheimer’s disease. Brain 144, 3505–3516 (2021). [DOI] [PMC free article] [PubMed] [Google Scholar]
- 23.Chatterjee P, et al. Plasma glial fibrillary acidic protein is elevated in cognitively normal older adults at risk of Alzheimer’s disease. Transl Psychiatry 11, 27 (2021). [DOI] [PMC free article] [PubMed] [Google Scholar]
- 24.Chatterjee P, et al. Plasma Aβ42/40 ratio, p‐tau181, GFAP, and NfL across the Alzheimer’s disease continuum: A cross‐sectional and longitudinal study in the AIBL cohort. Alzheimer’s & Dementia: the Journal of the Alzheimer’s Association (2022). [DOI] [PubMed] [Google Scholar]
- 25.Bateman RJ, et al. Clinical and biomarker changes in dominantly inherited Alzheimer’s disease. N Engl J Med 367, 795–804 (2012). [DOI] [PMC free article] [PubMed] [Google Scholar]
- 26.Barthelemy NR, et al. A soluble phosphorylated tau signature links tau, amyloid and the evolution of stages of dominantly inherited Alzheimer’s disease. Nat Med 26, 398–407 (2020). [DOI] [PMC free article] [PubMed] [Google Scholar]
- 27.Ryman DC, et al. Symptom onset in autosomal dominant Alzheimer disease: a systematic review and meta-analysis. Neurology 83, 253–260 (2014). [DOI] [PMC free article] [PubMed] [Google Scholar]
- 28.Natte R, et al. Dementia in hereditary cerebral hemorrhage with amyloidosis-Dutch type is associated with cerebral amyloid angiopathy but is independent of plaques and neurofibrillary tangles. Ann Neurol 50, 765–772 (2001). [DOI] [PubMed] [Google Scholar]
- 29.Morris JC The Clinical Dementia Rating (CDR): current version and scoring rules. Neurology 43, 2412–2414 (1993). [DOI] [PubMed] [Google Scholar]
- 30.Folstein MF, Folstein SE & McHugh PR “Mini-mental state”. A practical method for grading the cognitive state of patients for the clinician. Journal of psychiatric research 12, 189–198 (1975). [DOI] [PubMed] [Google Scholar]
- 31.Storandt M, Balota DA, Aschenbrenner AJ & Morris JC Clinical and psychological characteristics of the initial cohort of the Dominantly Inherited Alzheimer Network (DIAN). Neuropsychology 28, 19–29 (2014). [DOI] [PMC free article] [PubMed] [Google Scholar]
- 32.Lim YY, et al. BDNF Val66Met moderates memory impairment, hippocampal function and tau in preclinical autosomal dominant Alzheimer’s disease. Brain 139, 2766–2777 (2016). [DOI] [PMC free article] [PubMed] [Google Scholar]
- 33.Gordon BA, et al. Spatial patterns of neuroimaging biomarker change in individuals from families with autosomal dominant Alzheimer’s disease: a longitudinal study. Lancet neurology 17, 241–250 (2018). [DOI] [PMC free article] [PubMed] [Google Scholar]
- 34.Su Y, et al. Partial volume correction in quantitative amyloid imaging. Neuroimage 107, 55–64 (2015). [DOI] [PMC free article] [PubMed] [Google Scholar]
- 35.Preische O, et al. Serum neurofilament dynamics predicts neurodegeneration and clinical progression in presymptomatic Alzheimer’s disease. Nat Med 25, 277–283 (2019). [DOI] [PMC free article] [PubMed] [Google Scholar]
- 36.Quiroz YT, et al. Plasma neurofilament light chain in the presenilin 1 E280A autosomal dominant Alzheimer’s disease kindred: a cross-sectional and longitudinal cohort study. Lancet neurology 19, 513–521 (2020). [DOI] [PMC free article] [PubMed] [Google Scholar]
- 37.Cicognola C, et al. Plasma glial fibrillary acidic protein detects Alzheimer pathology and predicts future conversion to Alzheimer dementia in patients with mild cognitive impairment. Alzheimers Res Ther 13, 68 (2021). [DOI] [PMC free article] [PubMed] [Google Scholar]
- 38.Chatterjee P, et al. Diagnostic and prognostic plasma biomarkers for preclinical Alzheimer’s disease. Alzheimers Dement (2021). [DOI] [PubMed] [Google Scholar]
- 39.Stocker H, et al. Association of plasma biomarkers, p-tau181, glial fibrillary acidic protein, and neurofilament light, with intermediate and long-term clinical Alzheimer’s disease risk: Results from a prospective cohort followed over 17 years. Alzheimers Dement (2022). [DOI] [PubMed] [Google Scholar]
- 40.Perez-Nievas BG & Serrano-Pozo A Deciphering the Astrocyte Reaction in Alzheimer’s Disease. Front Aging Neurosci 10, 114 (2018). [DOI] [PMC free article] [PubMed] [Google Scholar]
- 41.Olabarria M, Noristani HN, Verkhratsky A & Rodriguez JJ Concomitant astroglial atrophy and astrogliosis in a triple transgenic animal model of Alzheimer’s disease. Glia 58, 831–838 (2010). [DOI] [PubMed] [Google Scholar]
- 42.Schindler SE & Fagan AM Autosomal Dominant Alzheimer Disease: A Unique Resource to Study CSF Biomarker Changes in Preclinical AD. Front Neurol 6, 142 (2015). [DOI] [PMC free article] [PubMed] [Google Scholar]
- 43.Escartin C, Guillemaud O & Carrillo-de Sauvage MA Questions and (some) answers on reactive astrocytes. Glia 67, 2221–2247 (2019). [DOI] [PubMed] [Google Scholar]
- 44.Fukuyama R, Izumoto T & Fushiki S The cerebrospinal fluid level of glial fibrillary acidic protein is increased in cerebrospinal fluid from Alzheimer’s disease patients and correlates with severity of dementia. Eur Neurol 46, 35–38 (2001). [DOI] [PubMed] [Google Scholar]
- 45.Ishiki A, et al. Glial fibrillar acidic protein in the cerebrospinal fluid of Alzheimer’s disease, dementia with Lewy bodies, and frontotemporal lobar degeneration. J Neurochem 136, 258–261 (2016). [DOI] [PubMed] [Google Scholar]
- 46.Mila-Aloma M, et al. Amyloid beta, tau, synaptic, neurodegeneration, and glial biomarkers in the preclinical stage of the Alzheimer’s continuum. Alzheimers Dement 16, 1358–1371 (2020). [DOI] [PMC free article] [PubMed] [Google Scholar]
- 47.Gonzales MM, et al. Blood biomarkers for cognitive decline and clinical progression in a Mexican American cohort. Alzheimers Dement (Amst) 14, e12298 (2022). [DOI] [PMC free article] [PubMed] [Google Scholar]
- 48.Shir D, et al. Association of plasma glial fibrillary acidic protein (GFAP) with neuroimaging of Alzheimer’s disease and vascular pathology. Alzheimers Dement (Amst) 14, e12291 (2022). [DOI] [PMC free article] [PubMed] [Google Scholar]
- 49.Hondius DC, et al. Profiling the human hippocampal proteome at all pathologic stages of Alzheimer’s disease. Alzheimers Dement 12, 654–668 (2016). [DOI] [PubMed] [Google Scholar]
- 50.Johnson ECB, et al. Large-scale proteomic analysis of Alzheimer’s disease brain and cerebrospinal fluid reveals early changes in energy metabolism associated with microglia and astrocyte activation. Nat Med 26, 769–780 (2020). [DOI] [PMC free article] [PubMed] [Google Scholar]
- 51.Pereira JB, et al. Plasma glial fibrillary acidic protein is an early marker of Aβ pathology in Alzheimer’s disease. 2021.2004.2011.21255152 (2021).
- 52.Simren J, et al. The diagnostic and prognostic capabilities of plasma biomarkers in Alzheimer’s disease. Alzheimers Dement (2021). [DOI] [PMC free article] [PubMed] [Google Scholar]
- 53.Rajan KB, et al. Remote Blood Biomarkers of Longitudinal Cognitive Outcomes in a Population Study. Ann Neurol 88, 1065–1076 (2020). [DOI] [PMC free article] [PubMed] [Google Scholar]
- 54.Verberk IMW, et al. Serum markers glial fibrillary acidic protein and neurofilament light for prognosis and monitoring in cognitively normal older people: a prospective memory clinic-based cohort study. The Lancet Healthy Longevity 2, e87–e95 (2021). [DOI] [PubMed] [Google Scholar]
- 55.Abdelhak A, et al. Glial Activation Markers in CSF and Serum From Patients With Primary Progressive Multiple Sclerosis: Potential of Serum GFAP as Disease Severity Marker? Front Neurol 10, 280 (2019). [DOI] [PMC free article] [PubMed] [Google Scholar]
- 56.Verberk IMW, et al. Characterization of pre-analytical sample handling effects on a panel of Alzheimer’s disease-related blood-based biomarkers: Results from the Standardization of Alzheimer’s Blood Biomarkers (SABB) working group. Alzheimers Dement (2021). [DOI] [PMC free article] [PubMed] [Google Scholar]
- 57.Yue JK, et al. Association between plasma GFAP concentrations and MRI abnormalities in patients with CT-negative traumatic brain injury in the TRACK-TBI cohort: a prospective multicentre study. Lancet neurology 18, 953–961 (2019). [DOI] [PubMed] [Google Scholar]
- 58.Huebschmann NA, et al. Comparing Glial Fibrillary Acidic Protein (GFAP) in Serum and Plasma Following Mild Traumatic Brain Injury in Older Adults. Front Neurol 11, 1054 (2020). [DOI] [PMC free article] [PubMed] [Google Scholar]
- 59.Michel M, et al. Increased GFAP concentrations in the cerebrospinal fluid of patients with unipolar depression. Transl Psychiatry 11, 308 (2021). [DOI] [PMC free article] [PubMed] [Google Scholar]
- 60.Steinacker P, et al. Glial fibrillary acidic protein as blood biomarker for differential diagnosis and severity of major depressive disorder. Journal of psychiatric research 144, 54–58 (2021). [DOI] [PubMed] [Google Scholar]
- 61.Noda M Possible role of glial cells in the relationship between thyroid dysfunction and mental disorders. Front Cell Neurosci 9, 194 (2015). [DOI] [PMC free article] [PubMed] [Google Scholar]
- 62.Mielke MM, et al. Performance of plasma phosphorylated tau 181 and 217 in the community. Nat Med 28, 1398–1405 (2022). [DOI] [PMC free article] [PubMed] [Google Scholar]
- 63.Syrjanen JA, et al. Associations of amyloid and neurodegeneration plasma biomarkers with comorbidities. Alzheimers Dement 18, 1128–1140 (2022). [DOI] [PMC free article] [PubMed] [Google Scholar]
- 64.Bellaver B, et al. Astrocyte Biomarkers in Alzheimer Disease: A Systematic Review and Meta-analysis. Neurology (2021). [DOI] [PubMed] [Google Scholar]
- 65.Connor JR & Berkowitz EM A demonstration of glial filament distribution in astrocytes isolated from rat cerebral cortex. Neuroscience 16, 33–44 (1985). [DOI] [PubMed] [Google Scholar]
- 66.Walz W & Lang MK Immunocytochemical evidence for a distinct GFAP-negative subpopulation of astrocytes in the adult rat hippocampus. Neurosci Lett 257, 127–130 (1998). [DOI] [PubMed] [Google Scholar]
- 67.Bushong EA, Martone ME, Jones YZ & Ellisman MH Protoplasmic astrocytes in CA1 stratum radiatum occupy separate anatomical domains. J Neurosci 22, 183–192 (2002). [DOI] [PMC free article] [PubMed] [Google Scholar]
- 68.Kimelberg HK The problem of astrocyte identity. Neurochem Int 45, 191–202 (2004). [DOI] [PubMed] [Google Scholar]
- 69.Giffard RG & Swanson RA Ischemia-induced programmed cell death in astrocytes. Glia 50, 299–306 (2005). [DOI] [PubMed] [Google Scholar]
- 70.Tatsumi K, et al. Olig2-Lineage Astrocytes: A Distinct Subtype of Astrocytes That Differs from GFAP Astrocytes. Front Neuroanat 12, 8 (2018). [DOI] [PMC free article] [PubMed] [Google Scholar]
- 71.Mann DM, Pickering-Brown SM, Takeuchi A, Iwatsubo T & Members of the Familial Alzheimer’s Disease Pathology Study, G. Amyloid angiopathy and variability in amyloid beta deposition is determined by mutation position in presenilin-1-linked Alzheimer’s disease. Am J Pathol 158, 2165–2175 (2001). [DOI] [PMC free article] [PubMed] [Google Scholar]
- 72.Chhatwal JP, et al. Variant-dependent heterogeneity in amyloid beta burden in autosomal dominant Alzheimer’s disease: cross-sectional and longitudinal analyses of an observational study. Lancet neurology 21, 140–152 (2022). [DOI] [PMC free article] [PubMed] [Google Scholar]
Associated Data
This section collects any data citations, data availability statements, or supplementary materials included in this article.


