

Abstract
There is growing evidence that ion channels are critically involved in cancer cell invasiveness and metastasis. However, the molecular mechanisms of ion signaling promoting cancer behavior are poorly understood and the complexity of the underlying remodeling during metastasis remains to be explored. Here, using a variety of in vitro and in vivo techniques, we show that metastatic prostate cancer cells acquire a specific Na+/Ca2+ signature required for persistent invasion. We identify the Na+ leak channel, NALCN, which is overexpressed in metastatic prostate cancer, as a major initiator and regulator of Ca2+ oscillations required for invadopodia formation. Indeed, NALCN‐mediated Na+ influx into cancer cells maintains intracellular Ca2+ oscillations via a specific chain of ion transport proteins including plasmalemmal and mitochondrial Na+/Ca2+ exchangers, SERCA and store‐operated channels. This signaling cascade promotes activity of the NACLN‐colocalized proto‐oncogene Src kinase, actin remodeling and secretion of proteolytic enzymes, thus increasing cancer cell invasive potential and metastatic lesions in vivo. Overall, our findings provide new insights into an ion signaling pathway specific for metastatic cells where NALCN acts as persistent invasion controller.
Keywords: calcium oscillations, invasion, oncochannelopathy, Sodium leak channel, vesicle secretion
Subject Categories: Cancer; Cell Adhesion, Polarity & Cytoskeleton; Signal Transduction
Na+ leak channel NALCN is enriched in prostate cancer, driving Ca2+‐dependent invasive remodeling and metastasis.
Introduction
Prostate cancer (PCa) is the most common noncutaneous human malignancy and the second most lethal tumor among men, with its highest incidence in industrialized countries. Understanding the processes facilitating the progression of PCa to aggressive metastatic phenotypes and developing new therapeutic targets are necessary to improve both the survival rate and the everyday life of the patients. In most cases of PCa, metastasis but not the primary tumor per se is the main cause of mortality, with the bone metastases being the most likely and highly incurable complication.
To effectively escape the tumor, enter the circulation and establish secondary growth in distant organs cancer cells must develop an enhanced invasiveness. The invasion capacity gained by tumor cells is the hallmark of malignancy. To become invasive, tumor cells need to acquire traits enabling enhanced migration and proteolysis of extracellular matrix (ECM). There is increasing evidence indicating that development of invasive tumor phenotype involves altered ionic homeostasis driven by aberrant ion channel expression/function, referred to as “oncochannelopathies” (Prevarskaya et al, 2018). It is now well‐established that, on the one hand, Ca2+ signaling plays a crucial role in cancer development (Monteith et al, 2017), while, on the other hand, elevated tissue Na+ concentration is a highly specific in vivo indicator of malignant lesions in human cancer patients (Haneder et al, 2015; Zaric et al, 2016). This pinpoints the mechanisms coupling the alteration in Na+ homeostasis to intracellular Ca2+ events upon cancer progression as one of the central subjects in the field of oncochannelopathies.
Over the years, several studies have revealed some striking similarities in the behavior between neuronal and metastatic cancer cells. Indeed, gene products traditionally known for their role in normal neuronal migration, axonal growth and embryonic development, were also pinpointed in metastasis, where they contribute to the aggressive cancer phenotype (Biankin et al, 2012; Shah et al, 2018). Interestingly, ion channels responsible for generation of action potential in the electrically excitable cells were also reported in metastatic cells (Djamgoz et al, 2019). An intriguing player in metastatic cancer cells seems to be the Na+ leak channel, NALCN, first reported in neurons (Lu et al, 2007). Its expression was then reported to be altered in some types of cancer (reviewed in Cochet‐Bissuel et al, 2014) with, as yet, unknown consequences for cancer cells behavior. NALCN baseline activity in neurons produces about 10 mV depolarizing shift in their resting membrane potential (Vr) (Lu et al, 2007). Importantly, NALCN is part of a channelosome, a multiprotein complex whose members are involved in channel folding, stabilization, cellular localization, and activation (Cochet‐Bissuel et al, 2014), thereby providing great degree of versatility for the regulation of its function not only in neurons, but also in cancer cells.
Another important question is how transmembrane Na+ fluxes can promote cancer cell invasiveness. Indeed, it is mainly dysregulated intracellular Ca2+ signaling, with the specific spatial and temporal signatures adopted by cancer cells, which is currently acknowledged to drive the progression of certain cancer hallmarks, including invasion and metastasizing (Prevarskaya et al, 2011, 2018). Given the existence of several tightly linked Na+/Ca2+‐dependent molecular pathways that participate in the maintenance of the intracellular Ca2+ and Na+ homeostasis (Verkhratsky et al, 2018), we hypothesized that in metastatic cancer cells, NALCN could provide signaling input encouraging the cell invasion via intracellular Ca2+ events.
Thus, in the present work, we have undertaken a thorough investigation of the neuronal‐type NALCN in prostate cancer cells in the context of its significance for prostate carcinogenesis. Our findings identify NALCN as a major mechanism responsible for Na+ influx that governs Ca2+ oscillatory signaling, involving changes of Ca2+ concentration in cytoplasm ([Ca2+]c), endoplasmic reticulum ([Ca2+] ER ) and mitochondria ([Ca2+] mito ), ROS production and initiation of invadopodia formation (referred hereafter as invadopodogenesis) in strongly metastatic prostate cancer cells. Importantly, formation of dynamin puncta, reporting invadopodial precursor assembly, occurred at sites of the [Ca2+]c wave initiation enriched with NALCN. The NALCN‐governed oscillatory Ca2+ events facilitate secretion of proteolytic enzymes (matrix metalloproteinases, MMPs) and promote invadopodogenesis via Src kinase activation and actin remodeling (also encouraged by N‐WASP—Cdc42 coupling). Modulation of NALCN bioavailability strongly affects in vivo prostate cancer progression and bone metastasis formation.
Overall, our study uncovers malignant assignment of NALCN and demonstrates its role as the central element of critical Na+/Ca2+ signaling axis promoting metastatic progression. Our data suggest that NALCN gene must be included in the panel of screened genes for early diagnosis of metastatic prostate cancer.
Results
NALCN promotes metastasis‐associated cancer cell behavior
Initial immunohistochemical analysis of human prostate tissue arrays detected NALCN upregulation during cancer progression, whereas NALCN was not detected in noncancerous prostate glands (Fig 1A). In clinically localized prostate cancer, NALCN expression was significantly higher within the ISUP group (Gleason score that reflects loss of differentiation) (Fig 1B). NALCN expression was also significantly higher in pT3 tumors (with extraprostatic extension) as compared to pT2 tumors (limited to the prostate gland) (Fig 1B). In human prostate cancer, NALCN immunostaining was observed in 57% of clinically localized hormone‐naïve cases, 6% (3/48) of castration‐resistant prostate cancer (CRPC) and 62% (13/21) of metastases. The expression of NALCN was strongly correlated with the expression of Src‐kinase (Fig 1C). Similar results were obtained for NALCN expression in other cancers: positive staining in bone metastases from breast (11/19) and colon (5/8) cancers, without any detectable expression in corresponding normal tissues (0/5) (Fig 1D). These data suggest that NALCN expression has clinical relevance and that NALCN may contribute to malignancy in several carcinomas.
Figure 1. NALCN promotes prostate cancer progression augmenting invasiveness of the cancer cells.
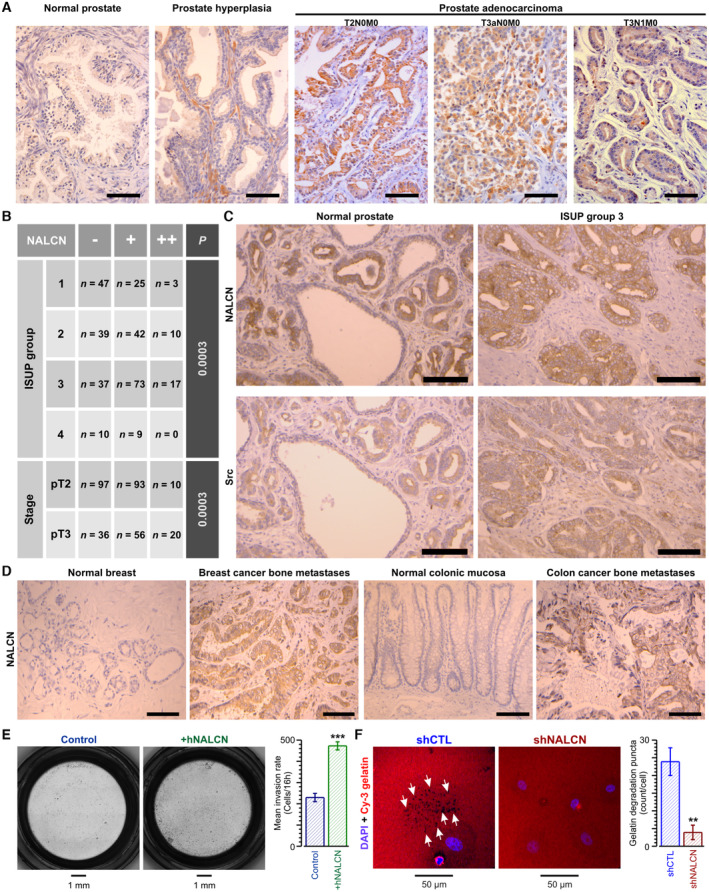
- Immunohistochemical positive staining for NALCN in human prostate adenocarcinoma tissues, but not in normal or hyperplastic prostate tissues (tissue microarray: PR484, US Biomax, Inc). T2N0M0—tumor invaded submucosa without any regional or distant metastases (stage II); T3aN0M0—tumor had broken through the capsule of the prostate gland and invaded through muscularis propria (stage III); T3N1M0 – tumor invaded through muscularis propria with 1 to 3 regional lymph node metastases (stage IV).
- NALCN expression in hormone naïve clinically localized cancer (n = 338).
- Immunohistochemistry: significant correlation (P < 0.0001) between positive staining of NALCN and Src in clinically localized prostate cancer, but not in non‐cancerous prostate.
- Immunohistochemistry: positive staining of NALCN in bone metastases produced by breast and colon cancers, but not in corresponding normal tissues.
- Invasion assay: Photos of Boyden chambers (left) show preparations used for count of control PC‐3 cells (Control) and PC‐3 cells overexpressing NALCN (+hNALCN). Bar diagram plot (right): NALCN overexpression causes significant increase of the number of invading cells counted within 16‐h incubation.
- NALCN knockdown suppresses invadopodia formation reported by Cy3‐fluorescent gelatin degradation (arrows). Confocal images (left) of Cy3 (red) and DAPI (blue; nuclei) fluorescence in control (shCTL) and shNALCN 48 h after plating the cells on gelatin. Bar diagram plot: NALCN suppression causes significant decrease of the number of gelatin degradation puncta counted within 48‐h incubation.
Data information: The images: scale bar is 100 μm. Bar diagram plots show the count of cell (E) or degradation puncta per cell (F) mean ± SEM for N = 3 (E), N = 5 (F) biological replicates per condition. **P < 0.01, ***P < 0.001, unpaired two‐tailed Student's t‐test.
Source data are available online for this figure.
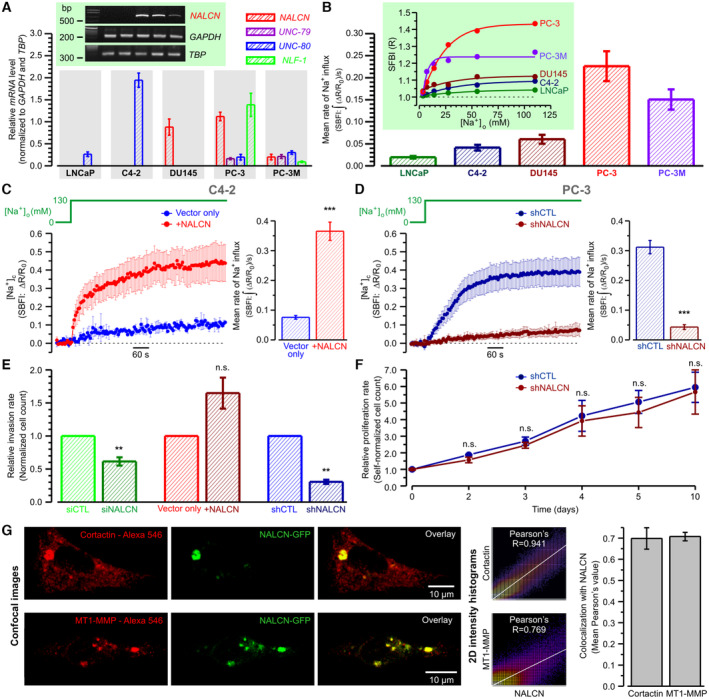
Screening of various metastatic prostate cancer cell lines revealed simultaneous expression of NALCN with all members of the NALCN channelosome—UNC‐79, UNC‐80, and NLF‐1—only in PC‐3 and PC‐3 M cell lines, with little or no expression in LNCaP, LNCaP C4‐2, and DU‐145 cell lines (Fig EV1A). Furthermore, Na+ influx (assessed with ratiometric Na+ dye SFBI) in PC‐3 and PC‐3 M cells, expressing all the components necessary for the assembly of functional NALCN channelosome, was found to be significantly greater than in the cancer cell lines lacking this feature (Fig EV1B). Na+ influx following step‐wise increase of extracelleular Na+ concentration ([Na+]o switch) was augmented following transient NALCN overexpression in C4‐2 cells (Fig EV1C) and was suppressed by transient NALCN silencing with siRNA (siNALCN) in PC‐3 cells (Fig EV1D). Importantly, modulation of NALCN bioavailability affects prostate cancer cell invasion rate (Figs 1E and EV1E) but not their proliferation rate (Fig EV1F).
Figure EV1. NALCN in human prostate cancer cells: expression, function, localization and role in metastatic hallmarks.
-
ART‐qPCR for NALCN channelosome genes in human prostate cancer (PCa) cell lines, as indicated. Inset (top left) shows conventional PCR for the same cell lines (left to right) for NALCN, and 2 housekeeping gene GAPDH and TBP.
-
BInset: elevation of intracellular Na+ concentration ([Na+]c) in SBFI‐loaded cells from 5 different human prostate cancer cell lines upon gradually increasing 5‐min steps of extracellular Na+ concentration ([Na+]o): from 1.7 to 3.5, 7, 14, 27.5, 55 and 110 mM. The bar diagram plot: recalculated mean rates of Na+ influx.
-
C, D[Na+]o switch – induced Na+ influx in weakly (C) and strongly (D) metastatic prostate cancer cells. Note that Na+ influx was augmented by transient NALCN overexpression (+NALCN) in C4‐2 cells (C) and was suppressed by transient NALCN silencing with siRNA (siNALCN) in PC‐3 cells (D). Left: mean traces of self‐normalized SBFI fluorescence reflect the dynamics of Na+ influx caused by [Na+]o switch from 0 to 130 mM. Right: corresponding mean rates of Na+ influx calculated as SBFI signal mass per second.
-
EEffect of NALCN bioavailability on PC‐3 cell invasion reported by Transwell® Matrigel invasion assay. Transient transfection (72‐h incubation) with either siRNA targeting firefly luciferase (siCTL); or empty vector pcDNA3.1 (Vector only), or siRNA‐1 (siNALCN), or pcDNA3.1‐NALCN‐HA (+NALCN). Stable downregulation was achieved with shNALCN.
-
FEffect of NALCN bioavailability on cell proliferation rate reported by sulforhodamine B assay.
-
GCo‐localisation of NALCN with invadopodia markers ‐ cortactin and MT1‐MMP: confocal images (left), 2D intensity histograms (middle) and statistical analysis (right).
Data information: RT‐qPCR data (A) are normalized to GAPDH and TBP. Data show mean ± SEM: N = 5 (A), n = 40–60 (B), n = 27–62 (C), n = 203–241 (D), N = 4 (E), N = 3 (F), n = 17 MT1‐MMP and n = 7 cortactin (G). N = biological replicate, n = number of cell ***P < 0.001, two‐tailed Student's t‐test (C, D). *P < 0.05, **P < 0.01, and n.s., not significant, two‐tailed Mann–Whitney U test (E, F).
Source data are available online for this figure.
Assessment of the NALCN recruitment to invadopodogenesis with cyanine‐3 (Cy3)‐fluorescent gelatinase assay revealed that NALCN silencing significantly reduced the number of the gelatin degradation puncta accumulated over time as a result of the invadopodium formation (Fig 1F).
Previously, pro‐invasive role of Na+ influx through the de novo expressed Nav channels in breast cancer cells was attributed to facilitated H+ extrusion via Na+/H+ exchanger type 1 (NHE‐1), leading to acidification of the pericellular microenvironment and activation of ECM‐degrading cysteine cathepsins at invadopodia sites (Gillet et al, 2009; Brisson et al, 2013). Surprisingly, in our experiments, knockdown of Na+‐conducting NALCN (NALCN‐KD) had no effect on either intracellular pH or H+ extrusion from the PC‐3 cells (Appendix Fig S1A). This argued against the possibility that metastasis‐promoting significance of NALCN‐mediated Na+ influx in prostate cancer cells is somehow linked to pH changes.
Immunocytochemical analysis revealed strong colocalization of NALCN with Src kinase, a key signaling component of the invasion pathway, and with invadopodial proteins (cortactin, dynamin, matrix metalloproteinase MT1‐MMP and adaptor protein Tks5) (for review, see Murphy & Courtneidge, 2011) within specific morphological structures referred to as “invadopodia puncta and rosettes” (Figs 2A and EV1G). Futhermore, 3D confocal imaging on PC‐3 cells placed on gelatin and co‐expressing NALCN‐GFP and Tks5 revealed co‐localization of NALCN with Tks5 in newly formed invadopodia (Appendix Fig S1B). Although previous studies have reported that Src kinase is recruited to NALCN channelosome (Lu et al, 2009), no evidence of Src kinase regulation by NALCN was presented. Here, we found that NALCN‐KD markedly suppressed Src kinase activity in metastatic PC‐3 cells without significant effect on Src expression (Appendix Fig S1C and D).
Figure 2. Spatial distribution of NALCN and its signaling input in PC‐3 cells.
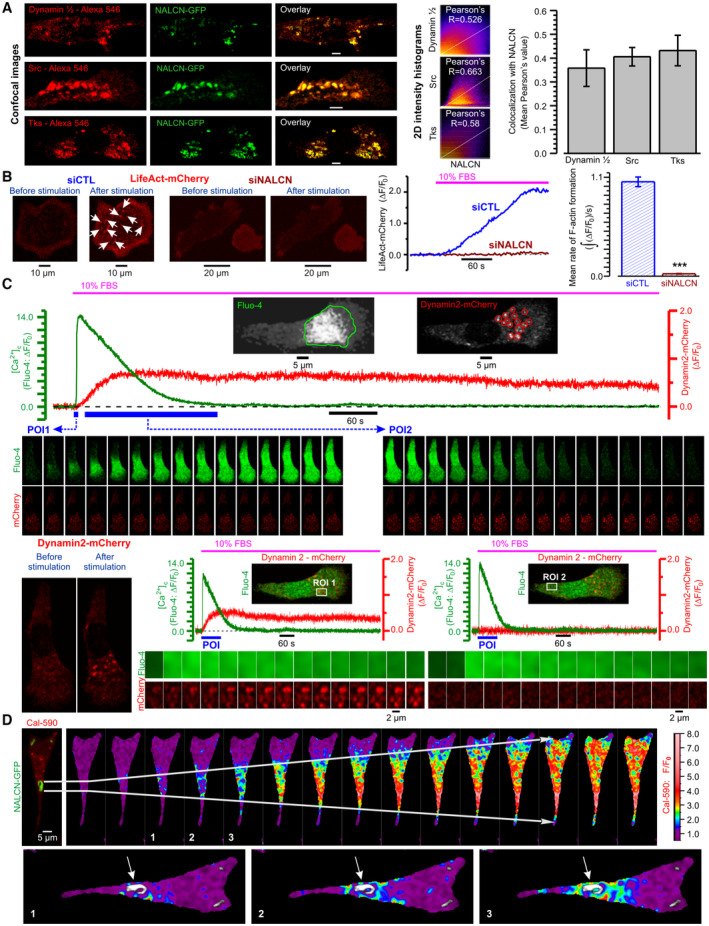
- Co‐localisation of NALCN with invadopodia markers – Dynamin, Src and Tks: confocal images (left), 2D intensity histograms (middle) and statistical analysis (right). Scale bar: 5 μm.
- NALCN silencing suppresses invadopodial precursor assembly. Left: near‐cell‐bottom confocal images captured before and 3 min after stimulation with 10% fetal bovine serum (FBS). Arrows: F‐actin‐enriched regions reported by LifeAct‐mCherry. Middle: corresponding traces of relative changes in mCherry fluorescence. Right: mean rates of F‐actin formation.
- Top: temporal profiles of self‐normalized fluorescence intensity (ΔF/F0) of fluo‐4 (green), averaged within outlined region (inset: left, green outline), and mCherry (red), averaged within 14 circles (inset: right, red outlines). Middle: galleries show confocal images of fluo‐4 and mCherry fluorescence captured during two periods of interests, POIs (blue bars): for POI1‐ every image, for POI2 ‐ every 100th image. Bottom left: confocal images of Dynamin2‐mCherry fluorescence captured before and 3 min after stimulation with 10% FBS. Bottom middle and right: plots relate the dynamics of [Ca2+]c changes (Fluo‐4) to formation of dynamin puncta (Dynamin2‐mCherry) at two regions of interests (ROIs) (insets); the galleries (below) show every 40th image (after 90° rotation) during the POIs (plots: blue bars).
- Top the overlay of NALCN‐GFP and Cal‐590 images is related to the gallery of self‐normalized rainbow‐coded Cal‐590 images showing [Ca2+]c response to 10% FBS. Bottom: 3 rainbow‐coded Cal‐590 images are superimposed on gray‐coded NALCN‐GFP image and rotated by 90°. Arrows: NALCN‐enriched structure.
Data information: The colocalization intensity (A) was measured using Pearson's correlation coefficient with Fiji ImageJ software. Bar diagram plots show mean ± SEM: (A) Pearson's correlation coefficient as a measure of co‐localization with NALCN of Dynamin (n = 4), Src (n = 14) and Tks (n = 4), and (B) Mean rates of F‐actin formation estimated as signal mass () of mCherry fluorescence per second in cells transfected with siCTL (n = 93) and with siNALCN (n = 140). n = number of cell ***P < 0.001, unpaired two‐tailed Student's t‐test.
Source data are available online for this figure.
Fetal bovine serum (FBS) contains mixture of various growth factors, including epidermal growth factor (EGF), and mediates its effects via activation of surface receptor tyrosine kinases (RTKs) or G‐protein‐coupled receptors (GPCRs). Fetal bovine serum can be used to induce pro‐invasive behavior of prostate cancer cells cultured under starving conditions. Indeed, both FBS and EGF were reported as potent pro‐invasive stimuli (Sun et al, 2014). It was previously demonstrated that stimulation of starved melanoma cells with fetal bovine serum induces Ca2+ oscillations and facilitates invasion. However, the casual link between the two processes remained unknown. We found that in PC‐3 cells, the FBS – induced [Ca2+]c response is associated with: (i) deviation of PI(4,5)P2 (phosphatidylinositol 4,5‐bisphosphate) from equilibrium (Fig EV2A) and (ii) facilitated interaction between N‐WASP (neuronal Wiskott–Aldrich syndrome protein) and Cdc42 (cell division cycle 42 protein) (Fig EV2B), and induces invadopodial precursor assembly detectable as (i) F‐actin enriched regions (Fig EV2C) and (ii) dynamin puncta (Fig EV2D). The role of PIP2, N‐WASP, and Cdc42, respectively, in invadopodia function has been previously highlighted by numerous studies (for review see Murphy & Courtneidge, 2011). Importantly, the invadopodial precursor assembly was strongly suppressed by NALCN‐KD (Fig 2B). To assess further our hypothesis that in invasive cells a specific Ca2+‐Na+ signaling axis is recruited to invadopodogenesis, we related spatiotemporal profiles of the FBS‐induced [Ca2+]c responses to subcellular structural features and their dynamic changes. We found that in PC‐3 cells, formation of dynamin puncta, reporting invadopodial precursor assembly, occurred at sites of the [Ca2+]c wave initiation (Fig 2C) that, in turn, coincided with NALCN‐enriched rosettes (Fig 2D).
Figure EV2. FBS‐induced [Ca2+]c response in PC‐3 cells is associated with changes in PI(4,5)P2, N‐WASP/Cdc42, dynamin and Actin consistent with initiation of invadopodia formation.
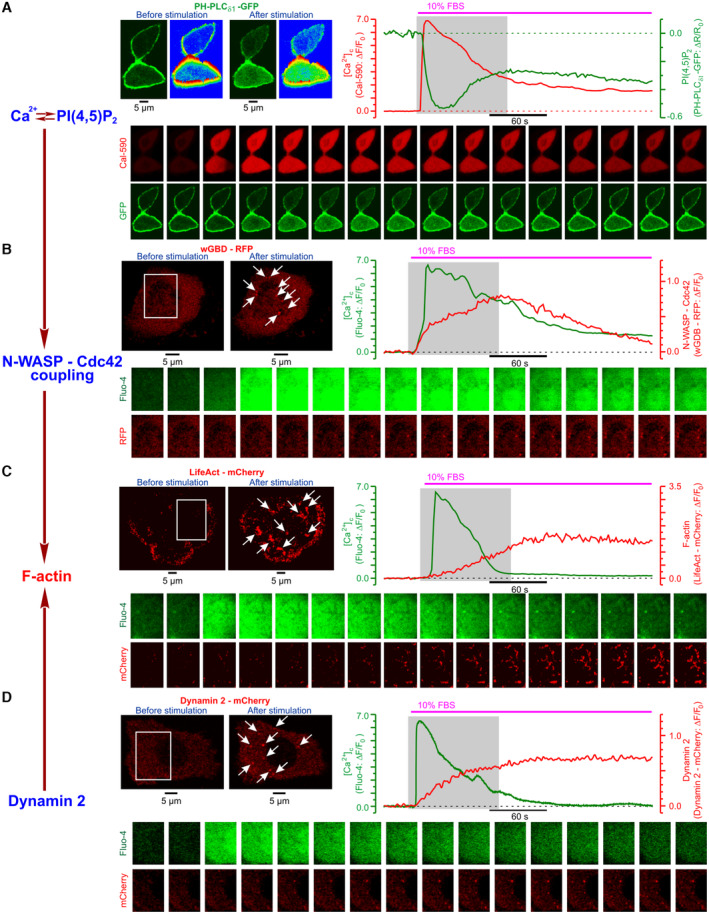
- Left: confocal images of PH‐PLC∂1 ‐ GFP fluorescence captured before and 1 min after stimulation with 10% FBS, and their rainbow‐coded 3D shaded‐surface plots. Right: corresponding traces of relative (R = Fplasmalemma/Fcytosol) changes in GFP fluorescence (green), reflecting translocation PH‐PLC∂1 from the plasma membrane to cytosol caused by PI(4,5)P2 degradation, and in Cal‐590 fluorescence (red) reflecting [Ca2+]c dynamics.
- Left: near cell bottom confocal (< 0.8 μm) images of wGBD ‐ RFP fluorescence before and 2 min after stimulation with 10% FBS. Note puncta formation (arrows) reflecting spots where Cdc42 is activated to bind N‐WASP. Right: corresponding traces of relative changes in RFP fluorescence (red), reflecting the dynamics of Cdc42 activation, and in Fluo‐4 fluorescence (green) reflecting [Ca2+]c dynamics.
- Left: near cell bottom confocal (< 0.8 μm) images of PC‐3 cell transfected with F‐actin marker LifeAct ‐ mCherry were captured before and 3 min after stimulation with 10% FBS. Note F‐actin‐enriched structures (arrows) induced by stimulation with FBS. Right: corresponding traces of relative changes in mCherry fluorescence (red), reflecting F‐actin dynamics, and in Fluo‐4 fluorescence (green) reflecting [Ca2+]c dynamics.
- Left: near cell bottom confocal (< 0.8 μm) images of PC‐3 cell transfected with Dynamin 2 ‐ mCherry were captured before and 2 min after stimulation with 10% FBS. Note dynamin puncta (arrows) induced by stimulation with FBS. Right: corresponding traces of relative changes in mCherry fluorescence (red) reflecting the dynamics of the dynamin puncta formation and in Fluo‐4 fluorescence (green) reflecting [Ca2+]c dynamics.
Data information: The galleries below the plots show images (A) or enlarged boxed regions of the images (B–D) captured during the periods highlighted on the plots by gray background: every 3rd image (A–C), every 35th image (D).
Source data are available online for this figure.
NALCN drives Ca2+ oscillations
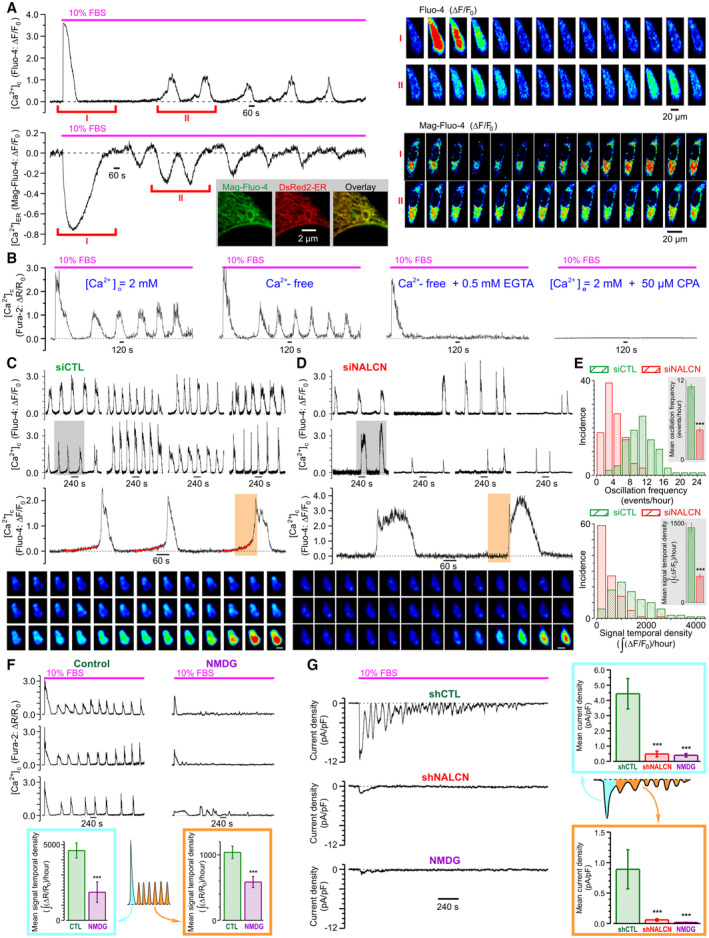
Long‐term (up to 2 h) monitoring of the PC‐3 cell responses to stimulation with either EGF alone (Appendix Fig S1E) or FBS (Fig 3A) revealed that an initial [Ca2+]c transient was followed by [Ca2+]c oscillations. These were accompanied by reciprocal changes of Ca2+ concentration in [Ca2+]ER (Fig 3A). The initial [Ca2+]c transient, but not the subsequent [Ca2+]c oscillations, persisted in Ca2+‐free solution supplemented with 0.5 mM EGTA, while both were abolished following Ca2+ store depletion with 50 μM cyclopiazonic acid (CPA), even when the cells were bathed in Ca2+‐containing solution (Fig 3B). We concluded, therefore, that generation of these [Ca2+]c oscillations involves both Ca2+ entry and Ca2+ recycling by the endoplasmic reticulum (ER).
Figure 3. NALCN regulates Ca2+ oscillations in PC‐3 cells.
-
AFBS‐induced transient [Ca2+]c elevations (Fluo‐4, top left) are associated with transient decreases of Ca2+ concentration in endoplasmic reticulum ([Ca2+]ER) (Mag‐Fluo‐4, bottom left). Corresponding galleries (right) show every 100th image during the highlighted POIs (I and II, respectively). Visualization of the ER with pDsRed2‐ER confirms the ER origin of Mag‐Fluo‐4 signal (inset bottom left: confocal images of cell fragment).
-
BContribution of Ca2+ influx and Ca2+ release to FBS‐induced [Ca2+]c response (Fura‐2) illustrated by sample traces (left to right): control, nominally Ca2+‐free or EGTA‐supplemented solutions, and Ca2+‐containing solution but depleted Ca2+ stores.
-
C, D[Ca2+]c oscillations reported by Fluo‐4 fluorescence in FBS‐exposed PC‐3 cells pre‐treated with siCTL (C) or siNALCN (D) for 72 h. Top: sample traces from 8 different cells. Middle: POIs (top: gray background) are presented on enlarged plots to emphasize that NALCN suppression abolishes “pacemaker events” observed in control (fitted red curves). Bottom: the galleries show every 3rd image during the POIs (middle: orange background). Scale bars: 10 μm.
-
EStatistical analysis confirms contribution of NALCN to genesis of the Ca2+ oscillations.
-
FFBS‐induced [Ca2+]c response (Fura‐2) is attenuated following reduction of extracellular Na+ concentration ([Na+]o) to 19.5 mM (substitution with NMDG).
-
GFBS‐induced inward current (perforated patch, Vh = −80 mV) is suppressed following pretreatment with shNALCN or reduction of [Na+]o to 13 mM (substitution with NMDG).
Data information: Data show mean ± SEM The histograms (E) compare the oscillation frequency (top) and signal temporal density (bottom) distributions for siCTL (n = 98) and siNALCN (n = 107). Insets: corresponding mean ± SEM The bar diagram plots show mean signal temporal densities (F, n = 20–23) and mean current densities (G, n = 4–6) during initial transient (cyan) and oscillations (orange). n = number of cell ***P < 0.001, unpaired two‐tailed Student's t‐test.
Source data are available online for this figure.
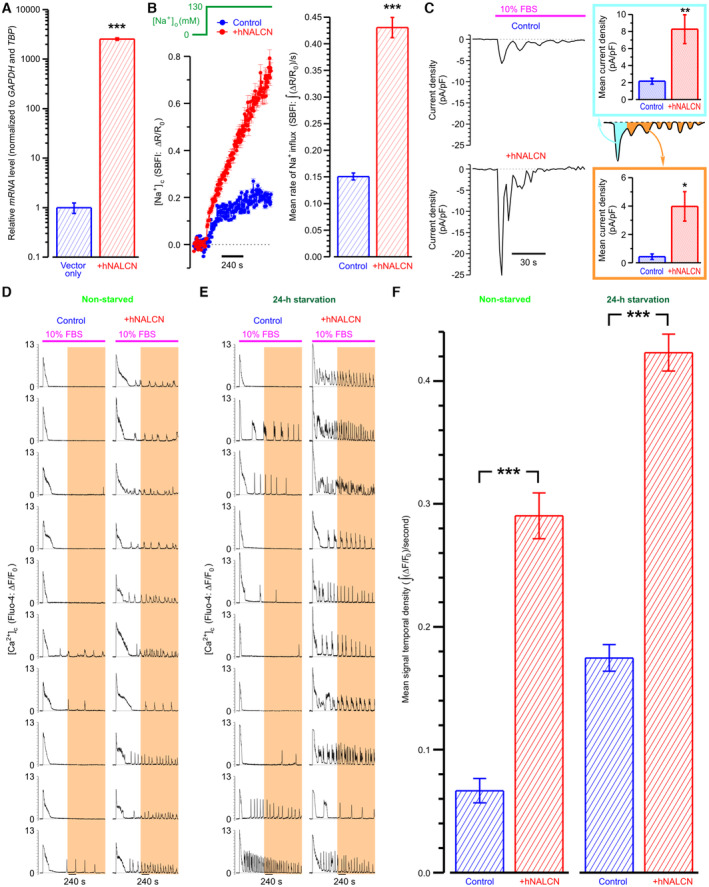
To assess the role of NALCN in the [Ca2+]c oscillations, we compared spatiotemporal patterns of the FBS‐induced [Ca2+]c response in serum‐starved control and NALCN‐KD PC‐3 cells (Fig 3C and D; Appendix Fig S1F). This revealed that the FBS‐induced [Ca2+]c oscillations (both frequency and signal temporal density) were significantly attenuated in NALCN‐KD cells (Fig 3E). Interestingly that “pacemaker phase” observed in [Ca2+]c oscillations (i.e., the phase of slow [Ca2+]c rise preceding the regenerative response) appeared to be NALCN‐dependent as well (Fig 3C and D). Attenuation of the FBS‐induced [Ca2+]c oscillations following reduction of [Na+]o (Fig 3F) further confirmed that genesis of these [Ca2+]c oscillations relies on continuous Na+ influx. The direct demonstration of this influx was achieved by perforate‐patch recording of the whole‐cell current activated in PC‐3 cells at holding potential of −80 mV in response to FBS application (Fig 3G). This oscillating inward current was virtually completely abolished following NALCN‐KD or reduction of [Na+]o. These findings were substantiated by a reversal strategy: NALCN overexpression (Fig EV3A) significantly increased FBS‐induced Na+ influx (Fig EV3B), the whole‐cell inward current (Fig EV3C) and the [Ca2+]c oscillations (Fig EV3D–F).
Figure EV3. Elevated Na+ influx in PC‐3 cells overexpressing NALCN promotes FBS‐induced [Ca2+]c oscillations.
-
ANALCN mRNA levels in PC‐3 cells permanently overexpressing either luciferase (Vector only: PC‐3 Luc) or NALCN (+hNALCN).
-
BLeft: mean traces of self‐normalized SBFI fluorescence reflect the dynamics of Na+ influx caused by [Na+]o switch from 0 to 130 mM in PC‐3 Luc and + hNALCN cells (n = 141–287). Right: corresponding mean rates of Na+ influx calculated as SBFI signal mass per second.
-
CLeft: representative traces of the FBS‐induced whole‐cell current recorded in PC‐3 cells using perforated patch‐clamp technique. Note that overexpression of NALCN augments inward Na+ current. Right: the bar diagram plots compare mean current densities (n = 4–6) during initial transient (cyan) and oscillations (orange).
-
D, ERepresentative traces of FBS‐induced [Ca2+]c responses reported by confocal time‐series imaging of fluo‐4 fluorescence. Note that overexpression of NALCN facilitates [Ca2+]c oscillations in non‐starved (D) and pre‐starved (E) PC‐3 cells.
-
FMean Fluo‐4 signal temporal densities during highlighted periods were compared between PC‐3 Luc and + hNALCN in non‐starved (n = 259 and 254, respectively) and pre‐starved (n = 360 and 317, respectively) cells.
Data information: Data show mean ± SEM RT‐qPCR data (A) are normalized to GAPDH and TBP (N = 3). N = biological replicate, n = number of cell *P < 0.05, **P < 0.01, ***P < 0.001; two‐tailed Mann–Whitney U test (A) or two‐tailed Student's t‐test (B,C and F).
Source data are available online for this figure.
Coupling between NALCN‐mediated Na+ influx and [Ca2+]c events
Oscillations generally require positive feedback between the contributing elements. We, therefore, assessed (i) modulation of NALCN‐mediated Na+ influx by extracellular ([Ca2+]o) and intracellular ([Ca2+]c) Ca2+ concentrations as well as (ii) coupling between Na+ influx and rise of [Ca2+]c.
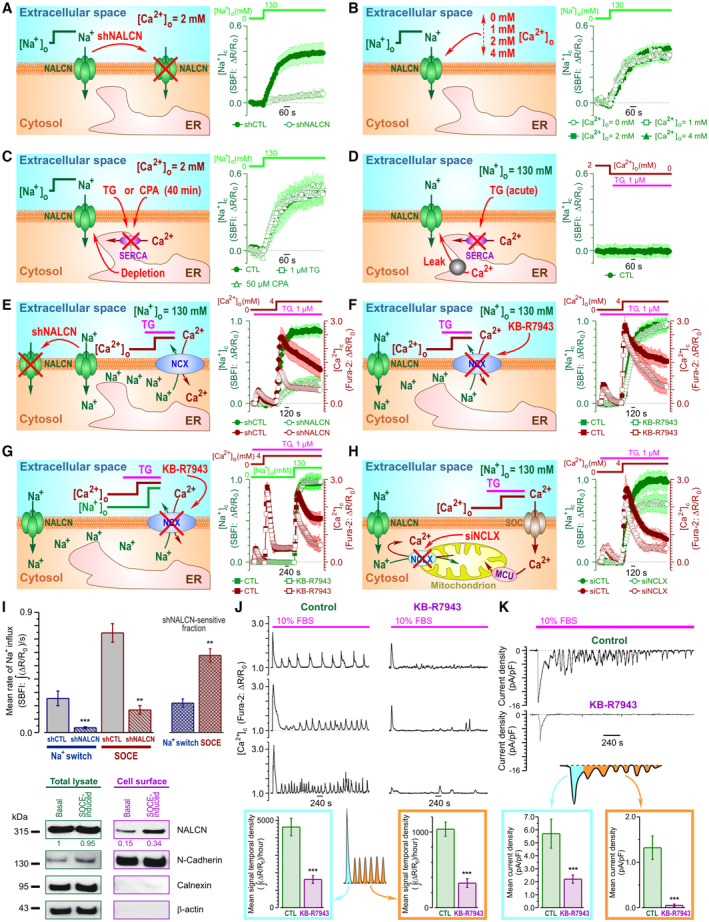
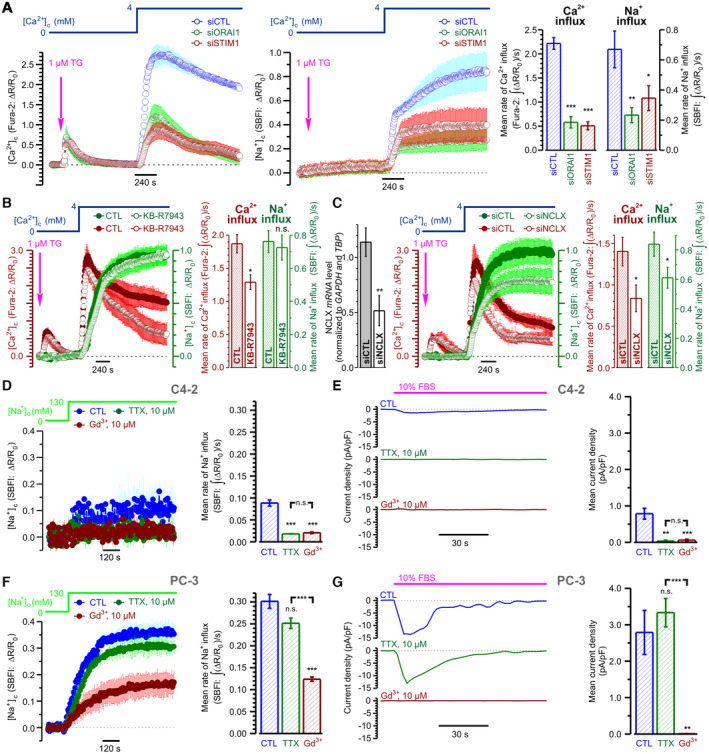
To unravel the net effect of [Ca2+]c elevation on NALCN‐mediated Na+ influx, we assessed the Na+ influx induced by switching [Na+]o from 0 to 130 mM (Fig 4A–C) and by store‐operated Ca2+ entry (SOCE) (Fig 4E–H). The two were then compared (Fig 4I, top). We have found that the [Na+]o switch induced a significant Na+ influx (Fig 4A–C) which: (i) was dramatically suppressed by NALCN‐KD (Fig 4A); (ii) was not modulated by [Ca2+]o, at least within the range of 0–4 mM (Fig 4B), in contrast to what was reported for neurons (Lu et al, 2010); and (iii) was not affected by Ca2+ store depletion (Fig 4C). Furthermore, [Ca2+]c elevation brought about by acute inhibition of sarco/endoplasmic reticulum Ca2+‐ATPase (SERCA) with thapsigargin (TG) failed to induce Na+ influx when the cells were bathed in Ca2+‐free external solution supplemented with 0.5 mM EGTA, i.e., when SOCE was prevented (Fig 4D). Moreover, we have found that: (i) SOCE activation triggers Na+ influx even at constant physiological [Na+]o (Fig 4E, F and H), (ii) NALCN‐KD significantly suppresses not only this Na+ influx but also SOCE (Fig 4E); and (iii) inhibition of the reverse‐mode of plasmalemmal Na+/Ca2+ exchanger (RM‐NCX) KB‐R7943 curtails [Ca2+]c transient caused by SOCE at [Na+]o = 130 mM (Fig 4F), does not affect it at [Na+]o = 0 mM (Fig 4G) and attenuates [Ca2+]c transient triggered by Na+ readmission following SOCE activation (Fig 4G). Comparison of the effects of NALCN‐KD on Na+ influx caused by the [Na+]o switch (Fig 4A) with that triggered by SOCE (Fig 4E) revealed that SOCE significantly augmented NALCN‐mediated Na+ influx (Fig 4I, top). In addition, the cell‐surface biotinylation assay reported that SOCE facilitates accumulation of NALCN protein in the plasma membrane (PM) (Fig 4I, bottom). Taking into account our previous demonstration that in prostate cancer cells the key event of SOCE activation is the interaction between the ER Ca2+ sensor STIM1 and highly selective Ca2+ channel protein ORAI1 resulting in accumulation of ORAI1 in the PM and Ca2+ influx (Dubois et al, 2014), inhibition of both SOCE and SOCE‐induced Na+ influx by silencing of either ORAI1 or STIM1 (Fig EV4A) confirms further functional interplay between SOCE and NALCN.
Figure 4. Interplay between SOCE, NALCN, NCX and NCLX in PC‐3 cells.
-
A–DCytosolic Na+ concentration ([Na+]c) changes reported by ratiometric Na+ indicator SBFI following (A–C) switch of extracellular Na+ concentration ([Na+]o) from 0 to 130 mM or (D) application of 1 μM thapsigargin (TG). The effects of: (A) NALCN knockdown, (B) extracellular Ca2+ concentration ([Ca2+]o) and (C) Ca2+ store depletion.
-
E–HStore‐operated Ca2+ entry (SOCE)‐induced changes of [Na+]c (SBFI) and [Ca2+]c (Fura‐2). The effects of: NALCN knockdown (E), the reverse‐mode plasmalemmal Na+/Ca2+ exchanger (RM‐NCX) inhibitor KB‐R7943 (1 μM) either at [Na+]o = 130 mM (F) or upon [Na+]o switch from 0 to 130 mM following SOCE activation (G), and knockdown of the mitochondrial Na+/Ca2+ exchanger, siNCLX (H).
-
ISOCE augments NALCN‐mediated Na+ influx (top) by addressing NALCN to plasma membrane (bottom).
-
J, KThe effect of KB‐R7943 (1 μM) on FBS‐induced [Ca2+]c responses (Fura‐2, ΔR/R0) and inward current (perforated patch, Vh = −80 mV), respectively.
Data information: Data show mean ± SEM The cartoons (A–H) highlight experimental design and the plots show mean ± SEM traces (n = 45–501) of SBFI (olive) and Fura‐2 (wine) fluorescence with the axes (ΔR/R0) presented in corresponding color. Plots (I, top) compare mean rates of Na+ influx induced by [Na+]o‐switch (n = 283–360) and SOCE (n = 180–216), and their shNALCN‐sensitive fractions. Immunoblotting (I, bottom) compares NALCN expression in total cell lysates and biotinylated fractions before and after SOCE induction. Numbers show (in corresponding color) mean values (n = 3) of NALCN protein levels (band intensity) normalized to N‐Cadherin, Calnexin and β‐actin. The bar diagram plots show mean signal temporal densities (J, n = 20) and mean current densities (K, n = 6–8) during initial transient (cyan) and oscillations (orange). n = number of cell **P < 0.01, ***P < 0.001, unpaired two‐tailed Student's t‐test.
Source data are available online for this figure.
Figure EV4. Na+/Ca2+ signaling cascade in weakly and strongly metastatic prostate cancer cells recruit NALCN to different extents.
-
AThe effect of silencing of STIM1 or ORAI1 on SOCE‐linked changes in [Ca2+]c (Fura‐2) and [Na+]c (SBFI) in PC‐3 cells.
-
BThe effect of pharmacological inhibition of the reverse‐mode plasmalemmal Na+/Ca2+ exchanger (RM‐NCX) on SOCE‐linked changes in [Ca2+]c (Fura‐2) and [Na+]c (SBFI) in PC‐3 cells.
-
CThe effect of silencing (plot left: RT‐qPCR) of mitochondrial Na+/Ca2+ exchanger (NCLX) on SOCE‐linked changes in [Ca2+]c (Fura‐2) and [Na+]c (SBFI) in PC‐3 cells.
-
D–GDifference between weakly (D, E) and strongly (F, G) metastatic prostate cancer cells in pharmacological profile of [Na+]o switch – induced Na+ influx (D, F) and FBS – induced inward current (E, G). Note that in strongly metastatic PC‐3 cells both [Na+]o switch – induced Na+ influx and FBS – induced inward current were significantly bigger than in weakly metastatic C4‐2 cells. Also note that in PC‐3 cells both responses were Gd3+‐sensitive but tetrodotoxin (TTX)‐resistant, while in C4‐2 cells both responses were virtually completely abolished by 10 μM of either TTX or Gd3+.
Data information: Data show mean ± SEM of temporal profiles of the responses and corresponding estimated mean rates of Na+ and Ca2+ influx, as indicated, except for left panels (E, F) presenting individual whole‐cell current traces (perforated patch, Vh = −80 mV); n = 109–182 (A), n = 132–501 (B, C), n = 702–772 (D), n = 4–5 (E, G), n = 1,117–1,571 (F). RT‐qPCR (C) data are normalized to GAPDH and TBP in 3 biological replicates. n = number of cell *P < 0.05, **P < 0.01, ***P < 0.001, and n.s., non‐significant; two‐tailed Student's t‐test (A–D, F) or two‐tailed Mann–Whitney U test (E, G).
Source data are available online for this figure.
The above results indicate that Ca2+ influx during SOCE (Fig 4E–I), but not Ca2+ release from the ER (Fig 4D) or Ca2+ store depletion per se (Fig 4C), enhances NALCN‐mediated Na+ influx by promoting translocation of NALCN protein to the PM (Fig 4I, bottom). In turn, the rise in cytosolic Na+ concentration ([Na+]c) facilitates Ca2+ influx either via reverse mode of plasma membrane Na+/Ca2+ exchanger, RM‐NCX (Figs 4F and G, and EV4B), and/or by relieving SOCE inactivation. The latter may involve mitochondrial Na+/Ca2+ exchanger (NCLX), which was shown previously to affect SOCE via modulation of reactive oxygen species (ROS) production (Ben‐Kasus Nissim et al, 2017). Consistent with this, we have found that NCLX silencing indeed suppressed SOCE (Figs 4H and EV4C; Appendix Fig S1G).
Thus, in view of the obtained results the following sequence of events in PC‐3 cells can be proposed: NALCN‐mediated Na+ influx → NCLX‐mediated Ca2+ extrusion from mitochondria → decrease of ROS production → relief of SOCE inactivation. At the same time, attenuation of the FBS‐induced [Ca2+]c events (both the initial transient and oscillations) by the RM‐NCX inhibitor KB‐R7943 (Fig 4J), suggests that NALCN‐mediated Na+ influx facilitates RM‐NCX‐mediated Ca2+ entry, while inhibition of FBS‐induced inward current by this compound (Fig 4K) indicates that this Ca2+ entry encourages NALCN‐mediated Na+ influx. This positive feedback between NALCN and RM‐NCX is, most likely, the mechanism sustaining the [Ca2+]c oscillations. The modulation of the feedback via the ER Ca2+ recycling is also tuned by SOCE and RM‐NCX. We also verified that in contrast to LNCaP and C4‐2 cells (both lacking NALCN), the Na+ influx, attributed to the NALCN‐mediated current in PC‐3 cells is tetrodotoxin (TTX) – resistant (Fig EV4D–G). This pharmacological profile—sensitivity to Gd3+ but not to TTX—is similar to neuronal NALCN (Lu et al, 2007).
NALCN – NCLX Functional coupling recruits mitochondria to regulation of [Ca2+]c oscillations
The tight functional coupling between SOCE and NALCN (Figs 4 and EV4A), the dependence of [Ca2+]c oscillations on NALCN‐mediated Na+ influx (Fig 3D–F) and the involvement of NCLX in SOCE regulation (Figs 4H and EV4C) via ROS‐mediated oxidation of Ca2+ release‐activated Ca2+ channel protein Orai1 (Ben‐Kasus Nissim et al, 2017), suggest that, apart from RM‐NCX (Fig 4J), the NALCN‐mediated Na+ influx may also regulate [Ca2+]c oscillations via NCLX. Indeed, NCLX would exchange mitochondrial Ca2+ to Na+ delivered via NALCN, and hence oppose Ca2+ uptake by the mitochondrial Ca2+ uniporter (MCU) and subsequent ROS production.
Consistent with this, we observed that the FBS‐induced [Ca2+]c oscillations were associated with oscillations of (i) [Ca2+] mito ; (Fig 5A) and (ii) mitochondrial superoxide (O2 •‐) production (Fig 5B). Also, application of H2O2 (endogenous product of O2 •‐) suppressed the [Ca2+]c oscillations (Fig 5C).
Figure 5. NALCN and recruitment of mitochondria to [Ca2+]c oscillations in PC‐3 cells.
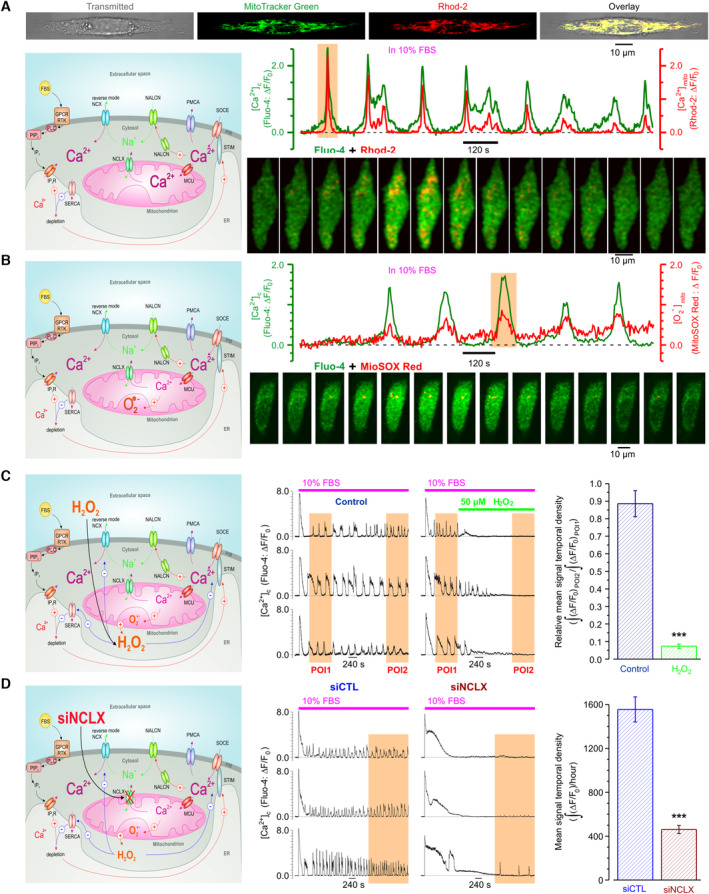
- Top: visualization of mitochondria with MitoTracker Green confirms mitochondrial origin of Rhod‐2 signal. Middle: FBS‐induced [Ca2+]c oscillations (Fluo‐4) are associated with [Ca2+] mito oscillations (Rhod‐2). Bottom: every 2nd image from the highlighted (orange background) period.
- Top: FBS‐induced [Ca2+]c oscillations (Fluo‐4) are associated with oscillations in O2 − production by mitochondria (MitoSOX Red). Bottom: every 3rd image from the highlighted (orange background) period.
- O2 − metabolite, H2O2, suppresses FBS‐induced [Ca2+]c oscillations (Fluo‐4).
- Suppression of NCLX with siNCLX attenuates [Ca2+]c oscillations (Fluo‐4).
Data information: In (C), mean signal temporal density during POI2 was normalized to that during POI1 in control (n = 58) and in 50 μM of H2O2 (n = 74), and compared. In (D), mean signal temporal densities during highlighted periods were compared in control (n = 18) and following 48 h pretreatment with siNCLX (n = 17). Bar diagram plots: mean ± SEM n = number of cell, ***P < 0.001, unpaired two‐tailed Student's t‐test. Cartoons (left) highlight experimental design and assessed signaling pathways. Note that Na+ delivered to the cytosol by NALCN, on the one hand, activates RM‐NCX, while on the other hand, is exchanged by NCLX to Ca2+ thus restricting elevation of [Ca2+] mito and, hence, production of superoxide (O2 −) and H2O2, which is known to inhibit SERCA, RM‐NCX and SOCE elements.
Source data are available online for this figure.
In support of the above hypothesis, we have also found that NCLX silencing (siNCLX, Appendix Fig S1G) dramatically attenuated the FBS‐induced [Ca2+]c oscillations (Fig 5D). Interestingly, the initial [Ca2+]c transient caused by the FBS application had significantly longer duration in the cells pre‐treated with siNCLX, likely due to suppression of SERCA by enhanced ROS production by mitochondria lacking NCLX (Qin et al, 2014). Thus, interplay between Ca2+ and Na+ signals not only would affect mitochondrial Ca2+ shuttling and mitochondrial redox status (Ben‐Kasus Nissim et al, 2017), but also serve to maintain persistent [Ca2+]c oscillations required for Src activation (Sun et al, 2014).
NALCN regulates secretion of ECM‐degrading enzymes in Ca2+‐dependent manner
In cancer cells, secretion of ECM‐degrading enzymes is the principal mechanism facilitating extracellular proteolysis and invasion (Friedl & Wolf, 2008). To assess a role of NALCN in regulation of secretion in aggressive prostate cancer cells, we have analyzed the effect of NALCN bioavailability on the rate of FBS‐induced secretion visualized by dynamic 3D confocal imaging of FM1‐43 fluorescent reporter pre‐accumulated in the secretory vesicles of starved PC‐3 cells (Fig 6A). We have found that presence of NALCN proved to be critical for controlling both the rate of vesicle secretion by PC‐3 cells (Fig 6B, D and E) and the activity of ECM‐degrading enzymes such as MMP‐9 (Appendix Fig S1H). Furthermore, by comparison of the effect of Ca2+ chelators with different dynamic properties on the rate of this secretion, we have demonstrated that this process is not only Ca2+‐ dependent, but is, in fact, regulated by [Ca2+]c in microdomains, since both fast and slow Ca2+ chelators decreased the rate of secretion to different extents (Fig 6C–E).
Figure 6. NALCN regulates vesicular secretion in Ca2+‐dependent manner.
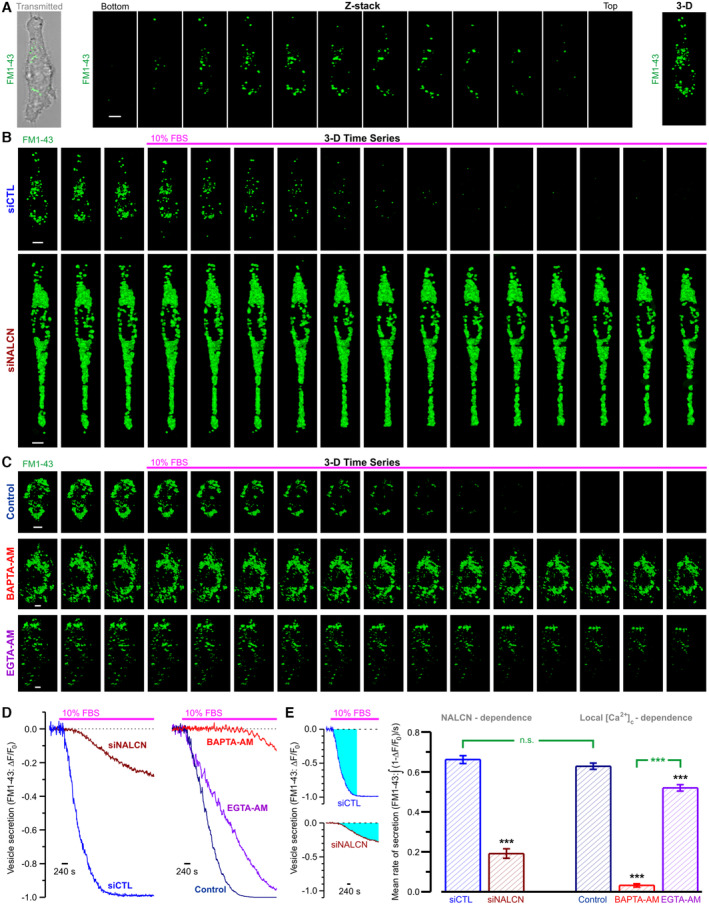
-
A3D distribution of FM1‐43‐labeled secretory vesicles in PC‐3 cell. Left: overlay of transmitted and x‐y confocal images of FM1‐43 fluorescence. Middle: confocal z‐sections. Right: corresponding reconstructed 3D image.
-
B, CThe galleries of 3D images (every 25th image) compare FBS‐induced degradation of FM1‐43‐labeled secretory vesicles in PC‐3 cells: (B) pre‐treated with either siCTL or siNALCN, and (C) in untreated (Control) PC‐3 cells with those loaded with slow (EGTA‐AM) or fast (BAPTA‐AM) Ca2+ chelators, as indicated.
-
DCorresponding traces of relative changes in total z‐stack fluorescence, as indicated.
-
EPlot: mean rates of secretion calculated as signal mass (cyan, left) per second.
Data information: Scale bar (A–C): 5 μm. Data (E): mean ± SEM for siCTL (n = 35), siNALCN (n = 40), Control (n = 45), EGTA‐AM (n = 35) and BAPTA‐AM (n = 62). n = number of cell, ***P < 0.001; and n.s., not significant, unpaired two‐tailed Student's t‐test.
Source data are available online for this figure.
NALCN promotes prostate cancer aggressiveness In vivo
Finally, we have analyzed the role of NALCN in cancer progression in vivo by using several mice models. Since phosphatase and tensin homolog (PTEN) is one of the most commonly deleted/mutated tumor suppressor genes in human prostate cancer, we utilized the PTEN‐knockout mouse with conditional gene inactivation (floxed allele; L2) as our first in vivo model (Parisotto et al, 2018). Following prolonged treatment with tamoxifen, PTEN−/− mice produced prostate adenocarcinoma, whereas PTEN−/−p53−/− developed more aggressive and invasive phenotype of prostate cancer. Ex vivo analyses performed on these prostate tumors revealed that NALCN was markedly upregulated in PTEN−/−p53−/− tumors (i.e., during progression of adenocarcinoma to aggressive phenotype characterized by high invasiveness of cancer cells), compared with the PTEN−/− tumors (i.e., during initial tumorigenesis) (Fig 7A).
Figure 7. In vivo and ex vivo analysis of the effect of NALCN bioavailability on metastatic spread.
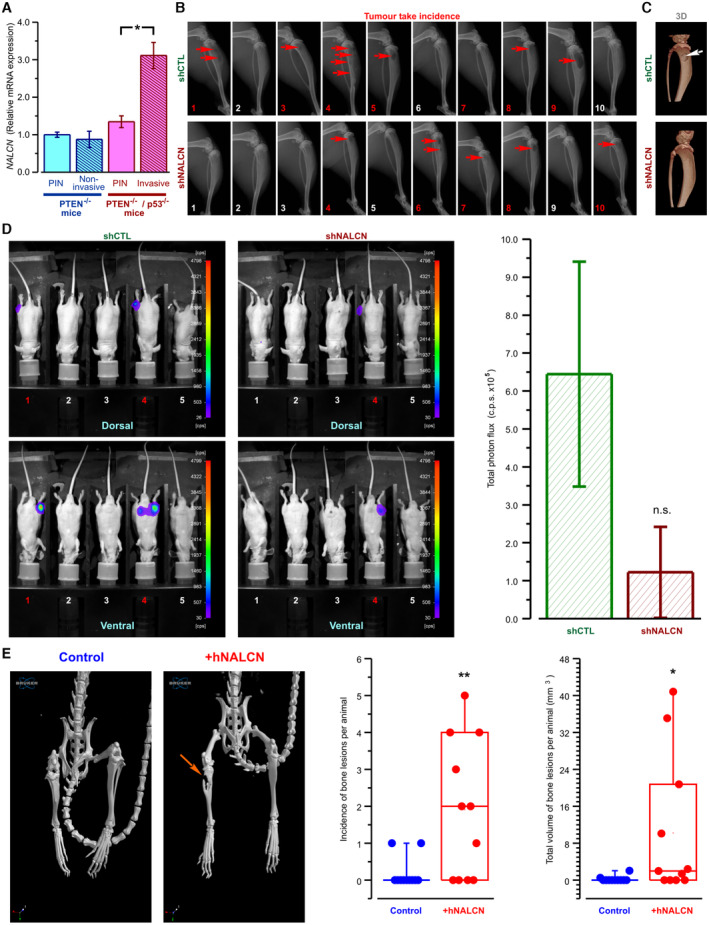
- NALCN mRNA level was not different between prostatic intraepithelial neoplasia (PIN) and non‐invasive prostate adenocarcinoma of PTEN(i)pe−/− mice. In contrast, invasive adenocarcinoma of PTEN/p53(i)pe−/− mice exhibited significant upregulation of NALCN mRNA relative to corresponding PIN.
- X‐ray images: osteolysis (arrow) 31 days after intra‐tibial injection of control (shCTL: PC‐3 Luc‐shCTL) or NALCN depleted cells (shNALCN: PC‐3 Luc‐shNALCN).
- X‐ray 3D images: osteolysis (arrow) 31 days after intra‐tibial injection of PC‐3‐Luc‐shCTL or PC‐3‐Luc‐shNALCN cells.
- Left: Dorsal (top) and ventral (bottom) images of bioluminescence from mice 31 days after intra‐tibial injection of control (shCTL: PC‐3 Luc‐shCTL) or NALCN depleted cells (shCTL: PC‐3 Luc‐shNALCN). Right: statistical comparison of total photon fluxes between the two groups of 10 mice (c.p.s., count of photons per second ± SD).
- Left: x‐ray 3D images obtained from mice 8 weeks after intracardiac injections with control (PC‐3 Luc) and cells stably overexpressing NALCN (+hNALCN). Right: box plots compare the incidence and total volume of bone lesions between the two groups of 11 mice: central band shows the mean, the boxes show lower and upper quartiles and whiskers show maximum data values.
Data information: (A) Data from PTEN(i)pe−/− mice were normalized to control PTEN(i)pe+/+ mice, whereas data from PTEN/p53(i)pe−/− mice ‐ to control PTEN/p53(i)pe+/+ mice. RT‐qPCR data are normalized to GAPDH and TBP and presented as mean ± SEM (N = 5). Red numbers and/or arrows in the images (B–E) depict tumor take incidence/bone lesions. *P < 0.05, **P < 0.01, and n.s., not significant, two‐tailed Mann–Whitney U test.
Source data are available online for this figure.
It is well known that prostate cancer frequently metastasizes to bone (in fact, the PC‐3 cell line was originally derived from the bone metastases of a prostate cancer patient). Therefore, in our second in vivo model, we have compared the effect of the direct injection into the tibia of nude mice of the two types of PC‐3 cells: (i) the control PC‐3 cells expressing NALCN (shCTL: PC‐3 Luc‐shCTL) and (ii) NALCN depleted cells (shCTL: PC‐3 Luc‐shNALCN). The X‐ray imaging revealed that the destruction of the bone tissue following the injection of the cells with NALCN‐KD was significantly reduced in comparison to that induced by the injection of the control PC‐3 cells (Fig 7B and C), while bioluminescence imaging showed that this effect was associated with attenuated metastaic spread of the injected PC‐3 cells (Fig 7D).
In agreement with the above, performed on nude mice the intracardiac injection of PC‐3 cells (our third in vivo model) reveled that permanent overexpression of NALCN in the injected cells significantly promotes the destruction of the bone tissue: in control group (PC‐3 Luc) only 18% of mice (2/11) developed a single osteolytic lesion located in fibula in both cases, while in the group, injected with NALCN‐overexpressing cells (+hNALCN), 64% of mice (7/11) developed multiple osteolytic lesions of larger volumes (Fig 7E) and various locations (fibula, tibia, hip, humeral, skull, and jaw bones).
Taking together, the results of our in vivo experiments demonstrate that the extent of PC‐3‐derived bone metastasis depends on bioavailability of NALCN in the prostate cancer cells (Fig 7B–E) and that its expression in these cells increases with prostate cancer aggressiveness (Fig 7A).
Discussion
Present study was undertaken to assess pro‐invasive potential of neuronal‐type Na+ leak channel, NALCN, in prostate carcinogenesis using complex multidisciplinary approach involving: (i) prostate cancer‐derived cell lines for elucidating mechanistic aspects of NALCN involvement in cellular signaling promoting invasive behavior, (ii) in vitro animal models for determining metastatic impact of NALCN on tumor xenografts and (iii) primary human prostate cancer biopsy tissues for correlating NALCN expression with clinical tumor scoring and staging. In this study we report on four major findings of the utmost importance for understanding the genesis of the prostate cancer invasiveness: (i) NALCN is overexpressed in highly metastatic prostate cancer cell lines and primary human prostate cancer metastasis; (ii) NALCN‐mediated Na+ entry in metastatic prostate cancer cell lines governs intracellular Ca2+ oscillations and promotes invadopodia formation and secretion of ECM‐degrading proteolytic enzymes; (iii) activation of Na+ entry via NALCN engages signaling pathway involving increased mitochondrial Ca2+ extrusion via NCLX, decreased mitochondrial ROS production, relief of SOCE inactivation by ROS, augmentation of plasma membrane SOCE and enhancement of Src kinase activity; and (iv) in the in vivo mice models NALCN expression determines metastatic potential of xenograft tumors and formation of bone metastasis.
NALCN channel was first discovered in neurons where its activity provides for constitutively depolarizing influx of Na+ which decreases the cell resting membrane potential (Vr) by about 10 mV (Lu et al, 2007). Subsequently, NALCN gene expression was detected in several types of human cancers (reviewed in (Cochet‐Bissuel et al, 2014)), Recently, it has been shown that the deletion of Nalcn from gastric adenocarcinomas in mice increased the number of circulating tumor cells and distant metastasis in mice (Rahrmann et al, 2022). The authors also identified a number of nonsynonymous mutations and, using HOLE analysis (Jackson et al, 2001) and predicted that most of them in gastric and colorectal cancers as loss‐of‐function. Although this theoretical analysis provides an important background for further investigations, only functional studies of the mutated channel activity may deliver the information about significance of the selected mutations and unravel the molecular mechanisms linking loss of NALCN function to cell dissemination. It is now well established that oncochannelopathies could involve the same channel for distinct functions in different types of cancers and in a context dependent manner (for review see Prevarskaya et al, 2018). For example, one of the recent studies provides evidence that SOCE, in contrast to that reported previously (Sun et al, 2014), may also extinguish invasive behavior by specific molecular mechanism dependent on cholesterol biosynthesis, and that the suppression of this mechanism promotes invasion and metastasis (Gross et al, 2022). Further studies are needed to understand the role of NALCN alterations in different types of human cancers.
In view of the fact that cancer cells' channelosome is known to undergo essential modification characterized by acquisition of ion channel types inherent to excitability (Prevarskaya et al, 2018), expression of neuronal‐type channel, NALCN, in nonexcitable cancer cells, per se, is not surprising. Understanding of the promotion of particular cancer hallmark(s) by specific newly expressed channel(s) and of underlying intracellular signaling pathways is the problem of much greater practical significance.
Among the ion channels inherent in excitability, the voltage‐gated Na+ channels of Nav1 family are specifically linked to cancer cells invasion and metastasis (Roger et al, 2007; House et al, 2010). It is believed that small steady‐state “window current” through these channels is the major contributor to the cancer cells27 depolarized Vr and increased [Na+]c (Roger et al, 2003; Gillet et al, 2009; Campbell et al, 2013), both of which are considered to be of importance in mediation of pro‐invasive Nav1 channel action. For instance, depolarization of the Vr due to Nav1.5 activity in colon cancer cells was implicated in the transcriptional induction of invasion‐related genes through protein kinase A (PKA), Rap1B, MEK, ERK1/2 signaling pathway (House et al, 2010, 2015), whereas in breast cells, the same feature was linked to modulation of F‐actin polymerization and invadopodia formation (Brisson et al, 2013). Furthermore, in breast cancer cells, Nav1.5‐mediated Na+ entry was shown to underlie intra‐ and extracellular pH changes via Na+/H+ exchanger type 1 (NHE1) which, in turn, favored higher activity of secreted ECM‐digesting proteases, cathepsins, thus, facilitating breast cancer cells invasiveness (Brisson et al, 2013).
With identification of NALCN in cancer cells, an essential part of depolarized Vr and enhanced Na+ influx in these cells could be ascribed to activity of this channel. Our results, however, show that in highly metastatic prostate cancer cells, it is rather coupling of NALCN‐mediated Na+ influx to intracellular oscillatory Ca2+ signaling that promots invasive behavior of the cells via formation of invadopodia and secretion of ECM‐degrading proteolytic enzymes.
A number of Na+‐permeable channels were suggested to influence [Ca2+]c events in different cell models (Verkhratsky et al, 2018). In cancer cells, functional coupling of Nav channels activity to intracellular Ca2+ signaling was predicted in human colon cancer (House et al, 2010). Later, it was shown that spontaneous [Ca2+]c oscillations in strongly metastatic human prostate and breast cancer cells were inhibited by Nav channel blockers (Rizaner et al, 2016). However, the molecular mechanisms coupling Na+ influx to [Ca2+]c oscillations as well as their role in metastatic cell behavior remained largely unknown. The importance of Ca2+ signaling in invasion and invadosome function is currently emerging. Yet, the identification of the specific roles of ion channels at different steps of complex adhesive and degradative functions of invadosomes remains challenging. For example, it has been recently shown that TRPV4 calcium channel colocalizes with β1‐integrins at the invadosome periphery and regulates coupling between acto‐adhesive and degradative processes (Vellino et al, 2021).
In prostate cancer cells we have unraveled a novel, previously not anticipated pathway composed of several feedback elements through which NALCN‐mediated Na+ influx governs the oscillatory pattern of intracellular Ca2+ signaling, which, in turn, drives the invasive behavior (Appendix Fig S2). Importantly, we have found that this pathway involves mitochondrial Ca2+ handling, NCLX and ROS production which were recently referred to as important determinants of cancer growth and metastasis (Sun et al, 2014; Verkhratsky et al, 2018). It has been shown that on the one hand, SOCE is accompanied by a rise in cytosolic Na+ concentration that, in turn, activates mitochondrial NCLX exchanging cytosolic Na+ to mitochondrial Ca2+; on the other hand, SOCE activates a mitochondrial redox transient which is dependent on NCLX and is required for preventing Orai1 inactivation (Ben‐Kasus Nissim et al, 2017). Interestingly, the loss of NCLX has been reported as driver of metastasis in colon cancer, suggesting the mechanisms of the mitochondrial Ca2+ handling as therapeutic targets in metastatic colorectal cancer (Pathak et al, 2020). This pathway (Appendix Fig S2), that could be initiated by the EGF‐mediated stimulation of RTK/GPCR, involves initial Ca2+ store depletion via derivation of Ca2+‐mobilizing second messenger, IP3, with ensuing activation of transmembrane SOCE. The resulting elevation of [Ca2+]c facilitates NALCN translocation to PM channelosome to enable NALCN‐mediated Na+ entry and increase of [Na+]c which, in turn, promotes additional Ca2+ influx via RM‐NCX. Significant rise of [Ca2+]c triggers Ca2+ uptake back into the ER via SERCA pump and MCU‐mediated Ca2+ uptake into mitochondria. The latter facilitates production of ROS, which is known to inhibit SERCA (Patel & Brackenbury, 2015), RM‐NCX (Liu & O'Rourke, 2013) and SOCE elements (Bogeski et al, 2012), and whose action is opposed by NCLX exchanging NALCN‐delivered Na+ to mitochondrial Ca2+. This positive and/or negative feedbacks underlie generation of [Ca2+]c oscillations maintaining the activity of Src, which is an essential component of NALCN channelosome. Active Src, in turn, phosphorylates downstream proteins (cortactin, dynamin and Tks5) recruiting them to actin polymerization regions and giving rise to invadopodia formation. RTK/GPCR activation is also linked to activation of the Rho family GTPase, Cdc42, leading to its binding with N‐WASP and subsequent actin nucleation (Beaty & Condeelis, 2014). In addition, invadopodia maturation is facilitated by Ca2+‐dependent secretion of ECM‐degrading MMPs.
The validity of this NALCN‐dependent pathway was confirmed in the in vivo experimentation on mice xenograft tumors wherein xenografts produced by NALCN‐KD cells were characterized by significant downsizing of skeletal metastases and reduction in bone tissue destruction.
Conclusion
In this study, we identified for the first time that the expression of NALCN is upregulated in human prostate carcinoma samples compared with normal tissues. We have found that NALCN is functional and promotes invasiveness and metastatic potential of prostate cancer cells by controlling the Na+/Ca2+ signature. Specifically, we demonstrated a novel NALCN‐mediated mechanism of cancer cell aggressiveness where long‐term intracellular Ca2+ oscillations play a central role. These oscillations are controlled mainly by SOCE, NCX, NCLX, SERCA and ROS, and are necessary for Src kinase activation, invadopodia formation and Ca2+‐dependent vesicular secretion of ECM degrading enzymes. Furthermore, our results obtained in several mice models suggest that NALCN expression promotes the metastatic impact of prostate cancer in vivo.
In overall conclusion, our study identifies a novel ionic checkpoint during the metastatic transformation and pinpoint NALCN as a key player governing this process in prostate cancer.
Materials and Methods
Cell culture
LNCaP, DU 145 and PC‐3 were from the American Type Culture Collection (ATCC®). C4‐2 and PC‐3M were kindly provided by Dr Florence Cabon (Cancer Research Centre of Toulouse, France) and by Dr Scott Fraser and Prof. Mustafa Djamgoz (Imperial College London, UK), respectively. In accordance with their origin/tumorigenic potential these cancer cell lines are classified as: LNCaP—lymph node/weakly metastatic (Horoszewicz et al, 1980); C4‐2—chimeric tumor induced by co‐inoculating castrated mouse with LNCaP‐derived subline and bone fibroblasts/weakly metastatic (Wu et al, 1994); DU 145 – brain/moderately metastatic (Stone et al, 1978); PC‐3—bone/highly metastatic (Kaighn et al, 1979); and PC‐3M—liver metastases induced by inoculating mouse with PC‐3/highly metastatic (Kozlowski et al, 1984). Cells were cultured at 37°C in RPMI 1640 medium (Gibco™, Thermo Fischer Scientific) supplemented with 10% fetal bovine serum (Gibco™) and 2 mM L‐Glutamine (Gibco™).
Cell transfection
Cells were transfected with 2 μg of corresponding construct or 50 nM of siRNA and 0.2 μg of pmax GFP using either Nucleofector (Amaxa), or X‐tremeGene HP DNA Transfection Reagent (Roche), or HiPerFect Transfection Reagent (QIAGEN).
Cloning procedures
The human NALCN cDNA was previously described (Swayne et al, 2009) and the mCherry cDNA was obtained from the pAAV‐EF1a‐mCherry plasmid (Addgene #114470). The human NALCN cDNA and the mCherry cDNAs were subcloned in the pLV‐EF1a‐IRES‐Blast (Addgene #85133) using standard molecular biology techniques.
Lentiviral transduction
Lentiviruses were made at the Vectorology facility of Montpellier (https://www.biocampus.cnrs.fr/index.php/en/). Briefly, replication‐deficient lentiviruses were produced and titrated as described by co‐transfection of the resulting constructs in HEK‐293 T cells with the HIV‐1 packaging plasmid psPAX2 (Addgene #12260) and the plasmid pMD2.G (Addgene #12259) that encodes the vesicular stomatitis virus glycoprotein envelope. Viruses were harvested and then concentrated. Titers were calculated as described (Naldini et al, 1996). Once PC‐3 cells that were seeded in 35 mm Petri dishes reached the confluence of 80–90%, they were transduced with 120.4 μg p24 of the lentiviral suspension.
Establishment of stable cell lines
48 h after transfection/transduction PC‐3 cells were cultured with antibiotics (700 μg/ml G418; 2 μg/ml puromycin; 5 μg/ml blasticidin S). The establishment of stable cell lines was confirmed by RT‐qPCR and immunoblotting analysis. In order to verify the luciferase activity 150 μg/ml of D‐luciferin was used.
Chemicals
Chemicals were purchased from Invitrogen Life Technologies and Sigma‐Aldrich Chemicals unless stated otherwise.
RNA purification and reverse transcription polymerase chain reaction
Organ tissues and cells were preserved in RNAlater™ (Sigma). Cellular RNA was purified with the NucleoSpin RNA Plus Kit (Macherey‐Nagel). Organ tissues were homogenized with Precellys® Tissue Homogenizer and purified with TRIzol™ Reagent (Invitrogen). The cDNA from was obtained with the RNA reverse transcription (Applied Biosystems) following the DNase treatment (Ambion). Conventional RT‐PCR was performed by using AmpliTaq Gold® (Applied Biosystems) on C1000 Touch™ Thermal Cycler (Bio‐Rad), whereas quantitative (RT‐qPCR) ‐ with SsoFast™ EvaGreen® (Bio‐Rad) on CFX96 Touch™ Real‐Time PCR Detection System.
Immunoblotting
The cells were lysed in RIPA buffer containing protease and phosphatase inhibitors, sonicated for 10 s and centrifuged at 13,000 g for 10 min in order to eliminate nuclei. The concentration of protein lysate was measured with Pierce® BCA Protein Assay (Thermo Fisher Scientific). 1xSample Reducing Agent and 1xLDS Sample Buffer (Bolt™, Thermo Fisher Scientific) were added to 50 μg of protein lysate and heated at 95°C for 5 min. Proteins were resolved due to 3–8% Tris‐acetate SDS–PAGE and transferred onto methanol‐activated PVDF membrane with Pierce G2 Fast Blotter (Thermo Fisher Scientific). Afterwards, the blots were blocked with 5% milk TBS‐T buffer (15 mM Tris–HCl, 140 mM NaCl, 0.05% Tween20®, pH 7.4) for 1 h, and then incubated with antibodies. For HRP‐conjugated secondary antibodies blots were developed using SuperSignal™ West Dura Extended Duration Substrate (Thermo Fisher Scientific) Images were captured with Amersham Imager 600 (GE Healthcare Life Sciences).
Proliferation assay
Cells were plated into 96‐well plates (103 cells/well) and left overnight at standard growth conditions. At each desired time point, cells were fixed with 50% Trichloroacetic acid at 4°C for 1 h. After removing fixative solution, cells were stained with 0.4% Sulforhodamine B (Santa Cruz) in 1% acetic acid. The dye taken up by cells was then dissolved in 10 mM Tris‐base, pH 10.5. The absorbance was measured at 560 nm with TriStar2 Multimodal Reader LB942 (Berthold Technologies).
Transwell® migration and invasion assay
Cells (75 × 103/passage) were plated into upper compartment of 8 μm pore Transwell® inserts (Falcon™) in a serum‐free media, whereas lower compartment was filled with standard growth media, as a chemoattractant. For invasion assay inserts were pre‐coated with 1.25 mg/ml Matrigel™ Basement Membrane Matrix (Becton Dickinson). After 16 h at 37°C, 5% CO2 cells were fixed in ice‐cold 100% methanol and stained with 1% crystal‐violet in 25% methanol. Inserts were then washed and the upper area of the filter was rubbed dry to eliminate the non‐migrated cells. The data acquisition was made using an inverted microscope DMIRE2 (Leica) at ×5 magnification. The results of the cell count from five randomly selected fields were averaged. At least two inserts for each condition were analyzed.
Electrophysiological recordings
Whole‐cell transmembrane ion currents were recorded in perforated patch configuration at room temperature. The patch pipette solution supplemented with 100 μg/ml gramicidin was composed of (in mM): 150 KCl, 1 MgCl2 and 10 HEPES; pH adjusted to 7.3 with KOH. The cells were bathed in solution containing (in mM): 140 NaCl, 5 KCl, 1 MgCl2, 2 CaCl2, 5 glucose and 10 Hepes; pH adjusted to 7.3 NaOH. Patch pipettes were made from borosilicate glass (WPI) and had free tip resistance 2–4 MΩ. The currents were recorded using an Axopatch 200B amplifier (Molecular Devices), and analyzed offline using pClamp (Molecular Devices) and MicroCal Origin (MicroCal Software Inc., Northampton, MA, USA).
Calcium and sodium imaging
The following solutions were used (in mM): (i) the Hank's balanced salt solution (HBSS) – NaCl 150, KCl 5, MgCl2 1, CaCl2 2, D‐Glucose 10, HEPES 10; pH 7.4 with NaOH; (ii) Na+‐free solution – choline chloride 150, MgCl2 1, KCl 5, CaCl2 2, D‐Glucose 5.6, HEPES 10; pH 7.4 with KOH; (iii) Ca2+‐free solution – EGTA‐NMDG 5, NaCl 150, MgCl2 3, KCl 5, D‐Glucose 5.6, HEPES 10; pH 7.4 with NaOH; (iv) high Ca2+ solution – NaCl 150, KCl 5, CaCl2 8, D‐Glucose 5.6, HEPES 10; pH 7.4 with NaOH.
Cytosolic Ca2+ and Na+ concentrations were measured using Fura‐2‐acetoxymethyl ester (AM) (Interchim) and SBFI‐AM (Interchim), correspondingly, as previously described (Iamshanova et al, 2016). Briefly, the dyes were dissolved in DMSO containing 0.02% Pluronic® F127 and diluted in HBSS to the final concentrations: 1 and 7 μM, respectively. The fluorescence was excited with a xenon lamp (300 W) light using an illumination DG4 system (Sutter) equipped with excitation filter pair 340/26 nm and 387/11 nm (wavelength/bandwidth). The fluorescence was acquired with objective 20× using Superfluor Nikon Eclipse Ti‐ series inverted microscope equipped with the emission filter 510/84 nm and coupled to an EMCCD camera Rolera EM‐C2 (Qimaging), and processed using the Metafluor 7.7.5.0 software (Molecular Devices).
Confocal microscopy
Confocal imaging was performed with LSM 510 META confocal workstation using a Plan‐Neofluar 40× 1.3 NA or Plan‐Apochromat 63× 1.4 NA objectives (Carl Zeiss, Germany). The illumination intensity was attenuated to 0.5–6% (depending on the laser line) with an acousto‐optical tunable filter (Zeiss, Oberkochen, Germany). To optimize signal quality, the pinhole was set to provide a confocal optical section 0.6–2.5 μm, depending on experimental protocol. To avoid any bleed‐through of the fluorescence signal in multistaining experiments, fluorochromes with well separated excitation and emission spectra were used and imaging was performed using the frame‐by‐frame or line‐by‐line multitrack mode of the confocal scanner. The photomultiplier gain and offset in each optical channel were set individually to achieve similar signal intensity at each channel and remove sub‐signal noise from the images. The adequacy of the imaging protocol applied to the multi‐labeled cells was confirmed by control experiments with monolabeling.
Fluo‐4, Mag‐Fluo‐4, GFP and FM1‐43 were excited by 488 nm line of 500 mW Argon ion laser (Laser‐Fertigung, Hamburg, Germany) and the fluorescence was captured at wavelengths 505–530 nm or above 505 nm. Alexa Fluor 546, mCherry, Cal‐590™, DsRed2 were exited by the 543 nm line of 5 mW Helium/Neon ion laser and the fluorescence was captured at wavelengths above 560 nm. CellMask™ Plsama Membrane Stain was excited by 633 nm line of 15 mW Helium/Neon ion laser and the fluorescence was captured at wavelengths above 650 nm. The MitoSOX™ was excited by 514 nm line of a 500 mW Argon ion laser and the fluorescence was captured at wavelengths above 560 nm. DAPI was excited by 405 nm blue diode laser and the fluorescence was captured at 470–500 nm. Image processing was carried out using LSM 5 software (Zeiss, Oberkochen, Germany) and with custom routines written in IDL (Research Systems, Inc., Boulder, CO, USA). Statistical analysis was performed using MicroCal Origin (MicroCal Software Inc., Northampton, MA, USA).
Biotinylation
Protein extraction from cell surface fraction was performed with EZ‐Link™ Sulfo‐NHS‐LC–LC‐Biotin (Thermo Fisher Scientific).
Src‐family kinase activity assay
After extraction of proteins (see above) without proteinase and phosphatase inhibitors, the Src activity was evaluated with ProFluor® Src‐Family Kinase Assay (Promega).
Zymography
Zymography was performed using 1% gelatin 10% SDS–PAGE. The cells were grown in FBS‐free media overnight. The condition media was centrifuged and the protein samples were extracted (see above) without addition of reducing agents and boiling. The zymograms were developed with 0.5% Coomassie G‐250 in 30% ethanol and 10% acetic acid.
Tissue biopsies
Normal prostate tissues (n = 58) were obtained from patients without prostate cancer (PCa) underwent cystoprostatectomy for bladder carcinoma.
Hormone naïve clinically localized cancer samples (HNCLC; n = 338) were obtained from patients treated with radical prostatectomy for localized PCa.
Forty‐eight cases of castration resistant prostate cancers (CRPC) were selected from patients treated with exclusive androgen deprivation therapy (ADT). Tissues were collected by transurethral resection, performed due to lower urinary tract symptoms associated with local tumor progression.
Twenty‐one cases of metastatic prostate cancer were selected from patients with tissues available for analysis: either lymph nodes (n = 14) or bone (n = 7). Among these, five patients (all with bone metastasis) had been previously treated by hormone deprivation but revealed castration resistance.
Study approval
Written informed consents were obtained from patients in accordance with the requirements of the medical ethic committee (DC‐2014–2045).
Prostate adenocarcinoma tissue microarray (PR484) was obtained from US Biomax, Inc.
Immuno‐histochemical analysis
Slides were deparaffinized, rehydrated, and heated in citrate buffer with pH 6 for antigenic retrieval. After blocking for endogenous peroxidase with 3% hydrogen peroxide, the slides were incubated with the primary antibodies. Immunohistochemistry was performed using the streptavidin‐biotin‐peroxydase method with diaminobenzidine as the chromogen (Kit LSAB, Dakocytomation, Glostrup, Denmark). Slides were finally counterstained with hematoxylin. In control experiments, corresponding primary antibodies were omitted from the staining protocol.
In vivo xenografts
Intra‐tibial injections
SCID male mice, 6 weeks of age, were housed in barrier conditions under isolated laminar flow hoods. Mice bearing tumor xenografts were closely monitored for established signs of distress and discomfort. Intra‐osseous tumor xenograft experiments were performed as previously described (Fradet et al, 2013): two PC‐3 Luc cell lines (shCTRL 10 mice, shNALCN 10 mice) were suspended as 6 × 10⁵ in 15 μL PBS and injected in the bone marrow cavity. Mice were sacrificed after 31 days. Radiographs (LifeRay HM Plus, Ferrania) of animals were taken at that time after inoculation using X‐ray (MX‐20; Faxitron X‐ray Corporation). Hind limbs were collected for histology and histomorphometrics analysis. The bone lesion surface, that includes lytic and osteoblastic regions, was measured using the computerized image analysis system MorphoExpert (Exploranova). The extent of bone lesions for each animal was expressed in mm2. Tibiae were scanned using microcomputed tomography (Skyscan1174, Skyscan) with an 8.1 μM voxel size and an X‐ray tube (50 kV; 80 μA) with 0.5 μm aluminum filter. Three‐dimensional reconstructions and rendering were performed using the manufacturer's suite (Respectively, NRecon&CTVox, and Skyscan). Bone Volume/Tissue Volume (%BV/TV) includes residual trabecular and remaining cortical bone.
Intracardiac injections
5–6‐week‐old male NMRI Nude Mice (Charles River Laboratories) were injected into the heart with PC‐3 Luc (11 mice) and cells stably overexpressing NALCN (11 mice) suspended in 100 μl PBS. Computed tomography scans were performed on a fast microtomograph Bruker 1278 using an image pixel size of 51.4 μm. The source voltage was 59 kV (753 μA) with a 1 mm aluminum filter. A whole body acquisition consisted in two 360° scans with one projection acquired each 0.5°. Reconstructions were achieved with NRecon software (1.7.1.6, Bruker, Germany) and images were analyzed with CTvox software (3.3.0 r1403, Bruker, Germany) and DataViewer software (1.5.6.2, Bruker, Germany) to vizualize respectively, the 3D skeleton volume and the transversal slices of scan areas. During the exam, mice were anesthetized with a mixture consisting of air/isoflurane 2% (Iso‐Vet, Piramal Healthcare).
PTEN null mice models
PTEN null mice models used in this study were previously described (Parisotto et al, 2018). In brief, gene ablation was induced by intraperitoneal injections of Tamoxifen (1 mg/mouse) daily for 5 days to 8‐week‐old mice in order to generate mutant PTEN(i)pe−/− and PTEN/p53(i)pe−/− mice (pe – prostate epithelium, (i) – induced). After Tamoxifen treatment 8‐week‐old mice developed prostatic intraepithelial neoplasia (PIN) in both groups, whereas 72‐week‐old PTEN(i)pe−/− mice developed noninvasive adenocarcinoma and 18‐week‐old PTEN/p53(i)pe−/− mice developed invasive adenocarcinoma. Respective control mice (PTENpe+/+ and PTEN/p53pe+/+) were subjected to corresponding Tamoxifen administration and sacrificed at the given age.
Study approval
The project was approved by the French national ethical committee (APAFIS #2837‐2015112314119496v2).
PTEN null mice were approved by the Institutional Animal Care and Use Committee of the Emory University (Atlanta, GA), which is accredited by the American Association for the Accreditation of Laboratory Animal Care.
Mice for intratibial and intracardiac injections were purchased from Charles River and handled according to the French Ministerial Decree No.87–848 of 19 October 1987.
Experimental protocols were approved by the Institutional Animal Care and Use Committee at the Université Lyon‐1 (France) (CEEA‐55 Comité d'Ethique en Expérimentation Animale DR2014–32) and at CNRS Orléans (CECCOn°3) and received the number 19911 for authorization from the Ministerial Services.
Statistics
In vitro data were analyzed using two‐tailed Student's t‐test to assess the differences between groups. Pairwise comparisons were tested using a non‐parametric two‐tailed Mann–Whitney U test.
Immunohistochemical comparison between tissue biopsies groups was performed using the χ2 test for categorical data and non‐parametric Mann–Whitney U test and Kruskal–Wallis tests for continuous data.
In vivo data for mice studies were compared using non‐parametric two‐tailed Mann–Whitney U test.
In all cases, P‐values < 0.05 were considered significant. Statistical analysis was performed using GraphPad Prism 7 (GraphPad Software Inc., San Diego, USA), StatView, version 5.0, (Abacus Concepts, Berkeley, CA) and OriginPro 2015 Beta3 software (1991–2014 OriginLab Corporation). The figures were created using CorelDRAW 11.633 software (2002 Corel Corporation).
Author contributions
Antoine Folcher: Formal analysis; investigation; methodology; writing – review and editing. Dmitri Gordienko: Conceptualization; data curation; formal analysis; investigation; writing – original draft; writing – review and editing. Oksana Iamshanova: Data curation; formal analysis; investigation; writing – original draft. Alexandre Bokhobza: Investigation. George Shapovalov: Investigation. Dheeraj Kannancheri‐Puthooru: Investigation. Pascal Mariot: Investigation. Laurent Allart: Investigation. Emilie Desruelles: Investigation. Corentin Spriet: Investigation. Raquel Diez: Investigation. Thibauld Oullier: Resources; investigation. Séverine Marionneau‐Lambot: Resources; investigation. Lucie Brisson: Investigation. Sandra Geraci: Investigation. Hathaichanok Impheng: Investigation. V'yacheslav Lehen'kyi: Investigation. Aurelien Haustrate: Investigation. Adriana Mihalache: Data curation; investigation. Pierre Gosset: Data curation; investigation. stephanie chadet: Resources; investigation. Stéphanie Lerondel: Resources; investigation. Stéphanie Retif: Resources; investigation. Julien Sobilo: Resources; investigation. Maryline Laube: Resources; investigation. Giulia Villari: Investigation. Guido Serini: Investigation. Alessandra Fiorio Pla: Investigation. Sébastien Roger: Investigation. Gaelle Fromont: Data curation; investigation. Mustafa Djamgoz: Investigation. Philippe Clézardin: Investigation. Arnaud Monteil: Investigation. Natalia Prevarskaya: Conceptualization; data curation; supervision; validation; visualization; writing – original draft; writing – review and editing.
Disclosure and competing interests statement
We declare that the authors do not have any competing interests related to this manuscript. All authors have approved the manuscript for submission to EMBO Jounal.
Supporting information
Appendix
Expanded View Figures PDF
Source Data for Expanded View
PDF+
Source Data for Figure 1
Source Data for Figure 2
Source Data for Figure 3
Source Data for Figure 4
Source Data for Figure 5
Source Data for Figure 6
Source Data for Figure 7
Acknowledgments
We thank F. Cabon (Cancer Research Centre of Toulouse, France) and S. Fraser (Imperial College London, United Kingdom) for C4‐2 and PC‐3M cell lines, accordingly. We thank E. Dewailly (Inserm U1003, University of Lille, France) for help with reagents and cellular biology methods. We thank C. Slomianny, E. Richard and A.‐S. Lacoste of the BICeL‐ Campus Scientific City Facility for access to instruments and technical advices. We are indebted to the Research Federation FRABio (University of Lille, CNRS, FR 3688, FRABio, Biochimie Structurale et Fonctionnelle des Assemblages Biomoléculaires) for providing the scientific and technical environment conducive to achieving this work. We thank Dr. C. Lemmers (Vectorology facility, PVM, Biocampus Montpellier, CNRS UMS3426) for lenvirus production. We thank C. Lagadec and R.‐A. Toillon for help with their flow‐cytometry facility (Inserm U908, University of Lille, France). We thank Daniel Metzger (Inserm U1258, University of Strasbourg, France) and Emmanuelle Germain (Inserm U1003, University of Lille, France) for providing us with cDNA from PTEN null mice model. We also thank Pr. Stephan Reshkin (University of Bari) and Pr. Philippe Chavrier (Curie Institute, Paris) for helpful discussions. O. I. was funded by the Ligue Nationale Contre le Cancer, France (R22016EE) and Laboratory of Excellence in Ion Channel Science and Therapeutics. H. I. is co‐funded by both Naresuan University (Thailand) and the French Embassy in Thailand. G.S was funded by AIRC (IG‐2018/ID 21315). The research in the authors' laboratory is supported by INSERM, la Ligue Nationale Contre le Cancer (équipe labellisée), Institute for Cancer Research (grant 2014–166); Le Ministere de l'Education Nationale, the Region Nord/Pas‐de‐Calais, la Fondation de Recherche Medicale, and l'Association pour la Recherche sur le Cancer.
The EMBO Journal (2023) 42: e112198
Data availability
We declare that the material of the present manuscript has been neither published nor submitted for publication elsewhere, in part or in whole. All data generated or analyzed during this study are included in this published article (and its supplementary information files).
References
- Beaty BT, Condeelis J (2014) Digging a little deeper: the stages of invadopodium formation and maturation. Eur J Cell Biol 93: 438–444 [DOI] [PMC free article] [PubMed] [Google Scholar]
- Ben‐Kasus Nissim T, Zhang X, Elazar A, Roy S, Stolwijk JA, Zhou Y, Motiani RK, Gueguinou M, Hempel N, Hershfinkel M et al (2017) Mitochondria control store‐operated Ca2+ entry through Na+ and redox signals. EMBO J 36: 797–815 [DOI] [PMC free article] [PubMed] [Google Scholar]
- Biankin AV, Waddell N, Kassahn KS, Gingras M, Muthuswamy LB, Johns AL, Miller DK, Wilson PJ, Wu J, Chang DK et al (2012) Pancreatic cancer genomes reveal aberrations in axon guidance pathway genes. Nature 491: 399–405 [DOI] [PMC free article] [PubMed] [Google Scholar]
- Bogeski I, Kilch T, Niemeyer BA (2012) ROS and SOCE: recent advances and controversies in the regulation of STIM and Orai. J Physiol 590: 4193–4200 [DOI] [PMC free article] [PubMed] [Google Scholar]
- Brisson L, Driffort V, Benoist L, Poet M, Counillon L, Antelmi E, Rubino R, Besson P, Labbal F, Chevalier S et al (2013) NaV1.5 Na+ channels allosterically regulate the NHE‐1 exchanger and promote the activity of breast cancer cell invadopodia. J Cell Sci 126: 4835–4842 [DOI] [PubMed] [Google Scholar]
- Campbell TM, Main MJ, Fitzgerald EM (2013) Functional expression of the voltage‐gated Na+−channel Nav1.7 is necessary for EGF‐mediated invasion in human non‐small cell lung cancer cells. J Cell Sci 126: 4939–4949 [DOI] [PubMed] [Google Scholar]
- Cochet‐Bissuel M, Lory P, Monteil A (2014) The sodium leak channel, NALCN, in health and disease. Front Cell Neurosci 8: 1–17 [DOI] [PMC free article] [PubMed] [Google Scholar]
- Djamgoz MBA, Fraser SP, Brackenbury WJ (2019) In vivo evidence for voltage‐gated Sodium Channel expression in carcinomas and potentiation of metastasis. Cancers 11: 1675 [DOI] [PMC free article] [PubMed] [Google Scholar]
- Dubois C, Vanden Abeele F, Lehen'kyi V, Gkika D, Guarmit B, Lepage G, Slomianny C, Borowiec A, Bidaux G, Benahmed M et al (2014) Remodeling of channel‐forming ORAI proteins determines an oncogenic switch in prostate cancer. Cancer Cell 26: 19–32 [DOI] [PubMed] [Google Scholar]
- Fradet A, Sorel H, Depalle B, Serre CM, Farlay D, Turtoi A, Bellahcene A, Follet H, Castronovo V, Clézardin P et al (2013) A new murine model of osteoblastic/osteolytic lesions from human androgen‐resistant prostate cancer. PLoS One 8: e75092 [DOI] [PMC free article] [PubMed] [Google Scholar]
- Friedl P, Wolf K (2008) Tube travel: the role of proteases in individual and collective cancer cell invasion. Cancer Res 68: 7247–7249 [DOI] [PubMed] [Google Scholar]
- Gillet L, Roger S, Besson P, Lecaille F, Gore J, Bougnoux P, Lalmanach G, Le Guennec JY (2009) Voltage‐gated sodium channel activity promotes cysteine cathepsin‐dependent invasiveness and colony growth of human cancer cells. J Biol Chem 284: 8680–8691 [DOI] [PMC free article] [PubMed] [Google Scholar]
- Gross S, Hooper R, Tomar D, Armstead AP, Shanas N, Mallu P, Joshi H, Ray S, Chong PL‐G, Astsaturov I et al (2022) Suppression of Ca(2+) signaling enhances melanoma progression. EMBO J 41: e110046 [DOI] [PMC free article] [PubMed] [Google Scholar]
- Haneder S, Giordano FA, Konstandin S, Brehmer S, Buesing KA, Schmiedek P, Schad LR, Wenz F, Schoenberg SO, Ong MM (2015) 23Na‐MRI of recurrent glioblastoma multiforme after intraoperative radiotherapy: technical note. Neuroradiology 57: 321–326 [DOI] [PubMed] [Google Scholar]
- Horoszewicz JS, Leong SS, Chu TM, Wajsman ZL, Friedman M, Papsidero L, Kim U, Chai LS, Kakati S, Arya SK et al (1980) The LNCaP cell line ‐ a new model for studies on human prostatic carcinoma. Prog Clin Biol Res 37: 115–132 [PubMed] [Google Scholar]
- House CD, Vaske CJ, Schwartz AM, Obias V, Frank B, Luu T, Sarvazyan N, Irby R, Strausberg RL, Hales TG et al (2010) Voltage‐gated Na+ channel SCN5A is a key regulator of a gene transcriptional network that controls colon cancer invasion. Cancer Res 70: 6957–6967 [DOI] [PMC free article] [PubMed] [Google Scholar]
- House CD, Wang B‐D, Ceniccola K, Williams R, Simaan M, Olender J, Patel V, Baptista‐Hon DT, Annunziata CM, Silvio Gutkind J et al (2015) Voltage‐gated Na+ channel activity increases colon cancer transcriptional activity and invasion via persistent MAPK signaling. Sci Rep 5: 11541 [DOI] [PMC free article] [PubMed] [Google Scholar]
- Iamshanova O, Mariot P, Lehen'kyi V, Prevarskaya N (2016) Comparison of fluorescence probes for intracellular sodium imaging in prostate cancer cell lines. Eur Biophys J 45: 765–777 [DOI] [PMC free article] [PubMed] [Google Scholar]
- Jackson EL, Willis N, Mercer K, Bronson RT, Crowley D, Montoya R, Jacks T, Tuveson DA (2001) Analysis of lung tumor initiation and progression using conditional expression of oncogenic K‐ras. Genes Dev 15: 3243–3248 [DOI] [PMC free article] [PubMed] [Google Scholar]
- Kaighn ME, Narayan KS, Ohnuki Y, Lechner JF, Jones LW (1979) Establishment and characterization of a human prostatic carcinoma cell line (PC‐3). Invest Urol 17: 16–23 [PubMed] [Google Scholar]
- Kozlowski JM, Fidler IJ, Campbell D, Xu ZL, Kaighn ME, Hart IR (1984) Metastatic behavior of human tumor cell lines grown in the nude mouse. Cancer Res 44: 3522–3529 [PubMed] [Google Scholar]
- Liu T, O'Rourke B (2013) Regulation of the Na+/Ca2+ exchanger by pyridine nucleotide redox potential in ventricular myocytes. J Biol Chem 288: 31984–31992 [DOI] [PMC free article] [PubMed] [Google Scholar]
- Lu B, Su Y, Das S, Liu J, Xia J, Ren D (2007) The neuronal channel NALCN contributes resting sodium permeability and is required for Normal respiratory rhythm. Cell 129: 371–383 [DOI] [PubMed] [Google Scholar]
- Lu B, Su Y, Das S, Wang H, Wang Y, Liu J, Ren D (2009) Peptide neurotransmitters activate a cation channel complex of NALCN and UNC‐80. Nat Rev Cancer 457: 741–744 [DOI] [PMC free article] [PubMed] [Google Scholar]
- Lu B, Zhang Q, Wang H, Wang Y, Nakayama M, Ren D (2010) Extracellular calcium controls background current and neuronal excitability via an UNC79‐UNC80‐NALCN Cation Channel complex. Neuron 68: 488–499 [DOI] [PMC free article] [PubMed] [Google Scholar]
- Monteith GR, Prevarskaya N, Roberts‐Thomson SJ (2017) The calcium‐cancer signalling nexus. Nat Rev Cancer 17: 367–380 [DOI] [PubMed] [Google Scholar]
- Murphy DA, Courtneidge SA (2011) The “ins” and “outs” of podosomes and invadopodia: characteristics, formation and function. Nat Rev Mol Cell Biol 12: 413–426 [DOI] [PMC free article] [PubMed] [Google Scholar]
- Naldini L, Blomer U, Gage FH, Trono D, Verma IM (1996) Efficient transfer, integration, and sustained long‐term expression of the transgene in adult rat brains injected with a lentiviral vector. Proc Natl Acad Sci USA 93: 11382–11388 [DOI] [PMC free article] [PubMed] [Google Scholar]
- Parisotto M, Grelet E, El Bizri R, Dai Y, Terzic J, Eckert D, Gargowitsch L, Bornert JM, Metzger D (2018) PTEN deletion in luminal cells of mature prostate induces replication stress and senescence in vivo . J Exp Med 215: 1749–1763 [DOI] [PMC free article] [PubMed] [Google Scholar]
- Patel F, Brackenbury WJ (2015) Dual roles of voltage‐gated sodium channels in development and cancer. Int J Dev Biol 59: 357–366 [DOI] [PMC free article] [PubMed] [Google Scholar]
- Pathak T, Gueguinou M, Walter V, Delierneux C, Johnson MT, Zhang X, Xin P, Yoast RE, Emrich SM, Yochum GS et al (2020) Dichotomous role of the human mitochondrial Na+/Ca2+/Li+ exchanger NCLX in colorectal cancer growth and metastasis. Elife 9: e59686 [DOI] [PMC free article] [PubMed] [Google Scholar]
- Prevarskaya N, Skryma R, Shuba Y (2011) Calcium in tumour metastasis: new roles for known actors. Nat Rev Cancer 11: 609–618 [DOI] [PubMed] [Google Scholar]
- Prevarskaya N, Skryma R, Shuba Y (2018) Ion channels in cancer: are cancer hallmarks oncochannelopathies? Physiol Rev 98: 559–621 [DOI] [PubMed] [Google Scholar]
- Qin F, Siwik DA, Pimentel DR, Morgan RJ, Biolo A, Tu VH, James Kang Y, Cohen RA, Colucci WS (2014) Cytosolic H2O2 mediates hypertrophy, apoptosis, and decreased SERCA activity in mice with chronic hemodynamic overload. Am J Physiol Heart Circ Physiol 306: 1453–1463 [DOI] [PMC free article] [PubMed] [Google Scholar]
- Rahrmann EP, Shorthouse D, Jassim A, Hu LP, Ortiz M, Mahler‐Araujo B, Vogel P, Paez‐Ribes M, Fatemi A, Hannon GJ et al (2022) The NALCN channel regulates metastasis and nonmalignant cell dissemination. Nat Genet 54: 1827–1838 [DOI] [PMC free article] [PubMed] [Google Scholar]
- Rizaner N, Onkal R, Fraser SP, Pristerá A, Okuse K, Djamgoz MBA (2016) Intracellular calcium oscillations in strongly metastatic human breast and prostate cancer cells: control by voltage‐gated sodium channel activity. Eur Biophys J 45: 735–748 [DOI] [PubMed] [Google Scholar]
- Roger S, Besson P, Le Guennec J‐Y (2003) Involvement of a novel fast inward sodium current in the invasion capacity of a breast cancer cell line. Biochim Biophys Acta 1616: 107–111 [DOI] [PubMed] [Google Scholar]
- Roger S, Rollin J, Barascu A, Besson P, Raynal P‐I, Iochmann S, Lei M, Bougnoux P, Gruel Y, Le Guennec J‐Y (2007) Voltage‐gated sodium channels potentiate the invasive capacities of human non‐small‐cell lung cancer cell lines. Int J Biochem Cell Biol 39: 774–786 [DOI] [PubMed] [Google Scholar]
- Shah K, Patel S, Mirza S, Rawal RM (2018) Unravelling the link between embryogenesis and cancer metastasis. Gene 642: 447–452 [DOI] [PubMed] [Google Scholar]
- Stone KR, Mickey DD, Wunderli H, Mickey GH, Paulson DF (1978) Isolation of a human prostate carcinoma cell line (DU 145). Int J Cancer 21: 274–281 [DOI] [PubMed] [Google Scholar]
- Sun J, Lu F, He H, Shen J, Messina J, Mathew R, Wang D, Sarnaik AA, Chang W, Kim M et al (2014) STIM1‐ and Orai1‐mediated Ca2+ oscillation orchestrates invadopodium formation and melanoma invasion. J Cell Biol 207: 535–548 [DOI] [PMC free article] [PubMed] [Google Scholar]
- Swayne LA, Mezghrani A, Varrault A, Chemin J, Bertrand G, Dalle S, Bourinet E, Lory P, Miller RJ, Nargeot J et al (2009) The NALCN ion channel is activated by M3 muscarinic receptors in a pancreatic β‐cell line. EMBO Rep 10: 873–880 [DOI] [PMC free article] [PubMed] [Google Scholar]
- Vellino S, Oddou C, Rivier P, Boyault C, Hiriart‐Bryant E, Kraut A, Martin R, Coute Y, Knölker HJ, Valverde MA et al (2021) Cross‐talk between the calcium channel TRPV4 and reactive oxygen species interlocks adhesive and degradative functions of invadosomes. J Cell Biol 220: e201910079 [DOI] [PMC free article] [PubMed] [Google Scholar]
- Verkhratsky A, Khananshvili D, Trebak M, Sekler I, Perocchi F (2018) Crosslink between calcium and sodium signalling. Exp Physiol 103: 157–169 [DOI] [PMC free article] [PubMed] [Google Scholar]
- Wu H, Hsieh J, Gleave M, Brown N, Pathak S, Chung W (1994) Derivation of androgen‐independent human LNCaP prostatic cancer cell sublines: role of bone stromal cells. Int J Cancer 57: 406–412 [DOI] [PubMed] [Google Scholar]
- Zaric O, Pinker K, Zbyn S, Strasser B, Robinson S, Minarikova L, Gruber S, Farr A, Singer C, Helbich TH et al (2016) Quantitative sodium MR imaging at 7 T: initial results and comparison with diffusion‐weighted imaging in patients with breast tumors. Radiology 280: 39–48 [DOI] [PubMed] [Google Scholar]