Abstract
Background and Aims:
Pancreatitis is a disease continuum, starting with acute pancreatitis (AP) and, in some cases, progressing to recurrent acute pancreatitis (RAP) and chronic pancreatitis (CP). Currently, there are no approved therapies or early diagnostic or prognostic biomarkers for pancreatitis. The current study aimed to examine whether patient serum immune profiling could identify non-invasive biomarkers and provide mechanistic insight into the disease continuum of pancreatitis.
Methods:
Using Olink immunoassay, we assessed the protein levels of 92 immune markers in serum samples from participants enrolled in the PROCEED study of the CPDPC consortium. Samples (n=231) were obtained from subjects without the pancreatic disease (n=56) and those with chronic abdominal pain (CAP) (n=24), AP (n=38), RAP (n=56), and CP (n=57).
Results:
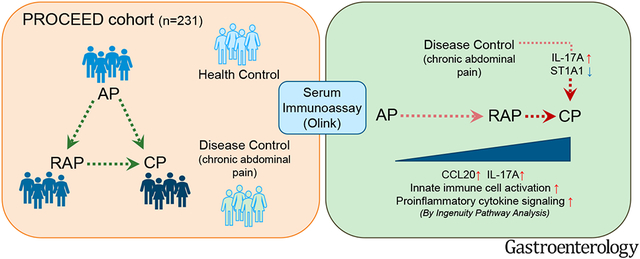
Thirty-three immune markers differentiated the combined pancreatitis groups from controls. Immune markers related to IL-17 signaling distinguished CP from AP and RAP. Similarly, the serum level of IL-17A and CCL20 differentiated CP from CAP, suggesting the involvement of Th17 cells in CP pathogenesis. The receiver operator characteristic (ROC) curve with two immune markers (IL-17A and ST1A1) could differentiate CP from CAP (optimistic AUC=0.78). Macrophage classical activation pathway elevated along the continuum of pancreatitis, suggesting an accumulation of proinflammatory signals over disease progression. Several immune markers were associated with smoking, alcohol, and diabetes status.
Conclusion:
Immune profiling of serum samples from a large pancreatitis cohort led to identifying distinct immune markers that could serve as potential biomarkers to differentiate the varying pancreatitis disease states. In addition, the finding of IL-17 signaling in CP could provide insight into the immune mechanisms underlying disease progression.
Keywords: pancreatitis, serum, immunity, alcohol, smoking
Graphical Abstract
INTRODUCTION
Pancreatitis is an inflammatory disease of the exocrine pancreas ranging from acute pancreatitis (AP) to recurrent acute pancreatitis (RAP) and chronic pancreatitis (CP). AP, RAP, and CP represent a disease continuum in many cases1, 2. One-fifth of AP patients will develop RAP, and one-third of patients with RAP will develop CP2. Among gastrointestinal diseases, AP is among the most frequent principal hospital discharge diagnosis and the second most common cause of total hospital stays3. Severe AP, defined by the presence of organ failure, carries a mortality rate of up to 20%, and this makes AP the fifth leading cause of hospital death4, 5. RAP refers to having more than one attack of AP. Patients with greater than three attacks have up to 50% risk of progression to CP6, 7. CP is a particularly debilitating disease marked by irreversible parenchymal tissue destruction, fibrosis, endocrine and exocrine dysfunction, and intractable pain. About 5% of CP patients will develop pancreatic cancer8, which portends a dismal 5-year survival rate of about 10% 9. Also, patients’ reduced quality of life and life expectancy are significant negative social impacts of CP10. Despite the prevalence and social impact, minimal progress has been made in treatment strategies for pancreatitis. In addition, there are currently no FDA-approved therapies, early diagnostics, or prognosis biomarkers available for pancreatitis.
Inflammation is a hallmark of pancreatitis11. Studies using experimental animal models demonstrate interactions between pancreatic cells and immune cells and that modulation of immune signaling can drive changes in the disease course and progression12-15. Emerging studies with human specimens also indicate the involvement of distinct immune subsets belonging to both adaptive and innate immunity in pancreatitis and their correlation with disease severity16-22. In the current study, we examine the immune characteristics of blood samples from a pancreatitis cohort to identify circulating immune biomarkers and provide mechanistic insight.
We screened circulating immune marker expressions in the spectrum of acute and chronic pancreatitis from a multi-center study of the Consortium for the Study of Chronic Pancreatitis, Diabetes, and Pancreatic Cancer (CPDPC) using a DNA oligonucleotide-based Olink immunoassay. This is the first large prospective serum immune profiling study (n=231) which, in addition to patients with AP, RAP, and CP, also includes no pancreas disease controls and disease controls. This cross-sectional analysis aimed to define unique inflammatory signatures in each pancreatitis stage and over the disease continuum. In addition, our study aimed to identify distinct immune markers associated with pancreatitis risk factors and complications (such as smoking, alcohol, and diabetes). The findings in this study expand our current understanding of systemic immune responses in pancreatitis and provide potential biomarkers that can predict disease progression and guide the development of strategies for treatment and/or prevention.
METHODS
Subject samples
Human samples for this study were collected from the Prospective Evaluation of Chronic Pancreatitis for Epidemiologic and Translational Studies (PROCEED) (NCT 03099850), a longitudinal, observational study of the CPDPC in adults23. CPCPC consortium has designated four clinical centers to provide samples for discovery research and the other five centers for validation research. In this study, samples are from the “discovery cohort” collected from those four centers (Ohio State University, Stanford University, University of Florida, and University of Pittsburgh Medical Center) and followed along the spectrum of clinical disease, including no pancreas disease controls, chronic abdominal pain of suspected pancreatic origin (CAP, disease controls), AP, RAP, and CP. Serum samples were collected during a quiescent state. The recruitment strategy and eligibility criteria for no pancreas disease controls are listed in Supplemental Table 1. The inclusion criteria for the pancreatic disease cohort included in this study are the same as those previously published23. In addition to sociodemographic and clinical data, a wide array of biospecimens is collected using a standard operating procedure and centrally banked for future study24. This study was approved by the CPDPC Steering Committee.
Serum Protein Profiling Using Olink Multiplex Panel
Study samples were quantified using Olink multiplex proximity extension assay (PEA) panels (Olink Proteomics; www.olink.com) according to the manufacturer’s instructions and as previously described25. The basis of PEA is a dual-recognition immunoassay, where two matched antibodies labeled with unique DNA oligonucleotides simultaneously bind to a target protein in solution. Once antibodies bind to a target protein, the two antibodies would be placed in proximity, allowing their DNA oligonucleotides to hybridize, serving as a template for a DNA polymerase-dependent extension step. The hybridized DNA creates a double-stranded DNA “barcode”, which is unique for the specific antigen and quantitatively proportional to the initial concentration of the target protein. The hybridization and extension are immediately followed by PCR amplification, and the amplicon is finally quantified by microfluidic qPCR using a Fluidigm BioMark HD system (Fluidigm Corporation. South San Francisco, California). In this study, we used the Target 96 Inflammation panel, which consists of 92 unique markers.
Ingenuity Pathway Analysis (IPA)
The differential expression level of each immune marker from Olink data was calculated as mean differences of the adjusted normalized protein expression (NPX) value in the disease group compared with controls. Estimated mean differences and accompanying p-values were obtained via nonlinear least squares26, following the removal of extreme values (see below) and assuming residual error has a homogeneous variance and with the application of the delta method27. Estimated mean differences and p-values adjusted to control for a false discovery rate at 5% were used as input for the IPA (Qiagen, United States). We used a core analysis module to determine differentially activated canonical pathways and top regulator effect networks to generate a graphical summary based on Fisher’s exact test (p-value cut off at 0.05). We also used a comparison analysis module to determine the differentially activated canonical pathways and upstream analysis in the disease groups (AP, RAP, and CP) compared with no pancreas disease controls.
Statistical Analysis
Regression Analysis:
Data that were extreme values were removed by first fitting a robust regression28 model to the data. Data with extreme values were flagged using a cutoff of three times the estimate of scale (robust standard deviation), a "three-sigma rule." Flagged data were removed from subsequent ordinary least squares (OLS) regression, where OLS was used for hypothesis testing. Age, sex, smoking, and alcohol status were employed as covariates throughout analyses comparing pancreatitis groups, as indicated in the figure legends. Standard errors for OLS were adjusted for any heterogeneity in variance29. All p-values were adjusted to control the false discovery rate at 5% across cytokines within each comparison30, 31. For dot plots, data were detrended for covariates after data that were extreme values were removed.
ROC Curves:
As NPX values are relative readings, we calculated the ratio of each cytokine's NPX reading to the NPX reading of cytokines of minimum variance in means among cohorts (IL1-alpha). These normalized data were employed as training data. In training data, we fit an elastic net regression model32, with alpha = 1/2, to determine which cytokines discriminate disease states. We applied repeated cross-validation33, 50 repeats, to obtain a stable result from the elastic net. We then applied the fit of that model to training data to construct a ROC curve and estimate the area under the curve (AUC) and optimal threshold for discriminating disease states. One can plug in observed values from a participant for the selected subset of cytokines into the estimated optimal regression function to generate a predicted probability of having the target disease state. The optimal cutpoint (shown on ROC curves) optimizes the balance between increased sensitivity and increased specificity. The optimal cutpoint is applied to the participant’s predicted probability. A predicted probability above the optimal cutpoint classifies the participant as having a target disease state. In each ROC graph, the target disease state is listed first in the title. Reported AUCs are optimistic (biased high) because they are estimated in training data. The data set was not large enough to partition into training and testing subsets and obtain reliable results.
Analysis and figure preparation were conducted in SAS®/STAT (SAS® Institute, Cary, North Carolina, USA) and R (www.r-project.org) with R package glmnet34 for the elastic net.
RESULTS
Study cohort and subject characteristics
Ninety-two immune markers, including cytokines, chemokines, and surface proteins, were assessed by Olink assay in the serum samples (Supplementary Fig. 1A-B). Participant samples analyzed (n=231) included controls (n=56), those with chronic abdominal pain (CAP, disease control) (n=24), AP (n=38), RAP (n=56), and CP (n=57) (Table 1). All groups had similar sex and age distributions. The percentage of current smokers and very heavy drinkers were highest in the CP group, followed by RAP and then AP among pancreatitis groups. Similarly, diabetes prevalence also increased with disease progression. To identify immune markers affected by pancreatitis and to rule out potential effects by variables shown to be statistically different among pancreatitis groups, all data were analyzed after adjusting for covariates of age, sex, smoking, and drinking status.
Table 1.
Demographics and clinical characteristics.
| Patient groups | Control (n=56) |
CAP (n=24) |
AP (n=38) |
RAP (n=56) |
CP (n=57) |
p-value |
|---|---|---|---|---|---|---|
| Age a | 50.13 ± 14.10 | 48.79 ± 14.44 | 46.61 ± 13.29 | 47.36 ± 13.25 | 53.19 ± 10.76 | 0.0902 |
| Sexb, Female/Male | 26/30 | 11/13 | 21/17 | 28/28 | 23/34 | 0.6859 |
| Ethnicityb, Hispanic/non-Hispanic | 6/50 | 2/22 | 1/37 | 6/50 | 0/57 | 0.0808 |
| BMI (kg/m2) a | 26.87 ± 4.91 | 27.33 ± 7.96 | 26.03 ± 5.10 | 28.27 ± 6.70 | 24.98 ± 5.42 | 0.0506 |
| DMb, n (%) | 2 (3.57) | 6 (25) | 4 (10.53) | 15 (26.79) | 24 (42.11) | <0.0001 |
| Smoking statusb, n (%) | <0.0001 | |||||
| Never | 42 (75) | 12 (50) | 16 (42.11) | 32 (57.14) | 12 (21.05) | |
| Past | 12 (21.43) | 7 (29.17) | 13 (34.21) | 11 (19.64) | 14 (24.56) | |
| Current | 2 (3.57) | 5 (20.83) | 7 (18.42) | 13 (23.21) | 31 (54.39) | |
| Drinking statusb, n (%) | 0.0282 | |||||
| Abstainers | 10 (17.86) | 4 (16.67) | 5 (13.16) | 11 (19.64) | 3 (5.26) | |
| Light drinkers | 15 (26.79) | 6 (25) | 8 (21.05) | 7 (12.5) | 6 (10.53) | |
| Moderate drinkers | 13 (23.21) | 6 (25) | 6 (15.79) | 14 (25) | 11 (19.30) | |
| Heavy drinkers | 10 (17.86) | 2 (8.33) | 7 (18.42) | 12 (21.43) | 13 (22.81) | |
| Very heavy drinkers | 3 (5.36) | 5 (20.83) | 6 (15.79) | 10 (17.86) | 21 (36.84) | |
| Etiology of pancreatitis, n (%) | ||||||
| Alcoholic | - | - | 7 (18) | 11 (20) | 30 (53) | |
| Genetic | - | - | 1 (3) | 3 (5) | 6 (11) | |
| Hypertriglyceridemia | - | - | 2 (5) | 8 (14) | 1 (2) | |
| Obstructive | - | - | 3 (8) | 2 (4) | 0 | |
| Miscellaneous | - | - | 1 (3) | 1 (2) | 1 (2) | |
| Idiopathic | - | - | 24 (63) | 31 (55) | 19 (33) | |
Note.
Mean ± SD, the p-values were from one-way ANOVA tests
Chi square tests were performed for p-values of categorical data. Missing data were excluded from testing.
Pro-inflammatory immune markers in serum distinguish pancreatitis from controls
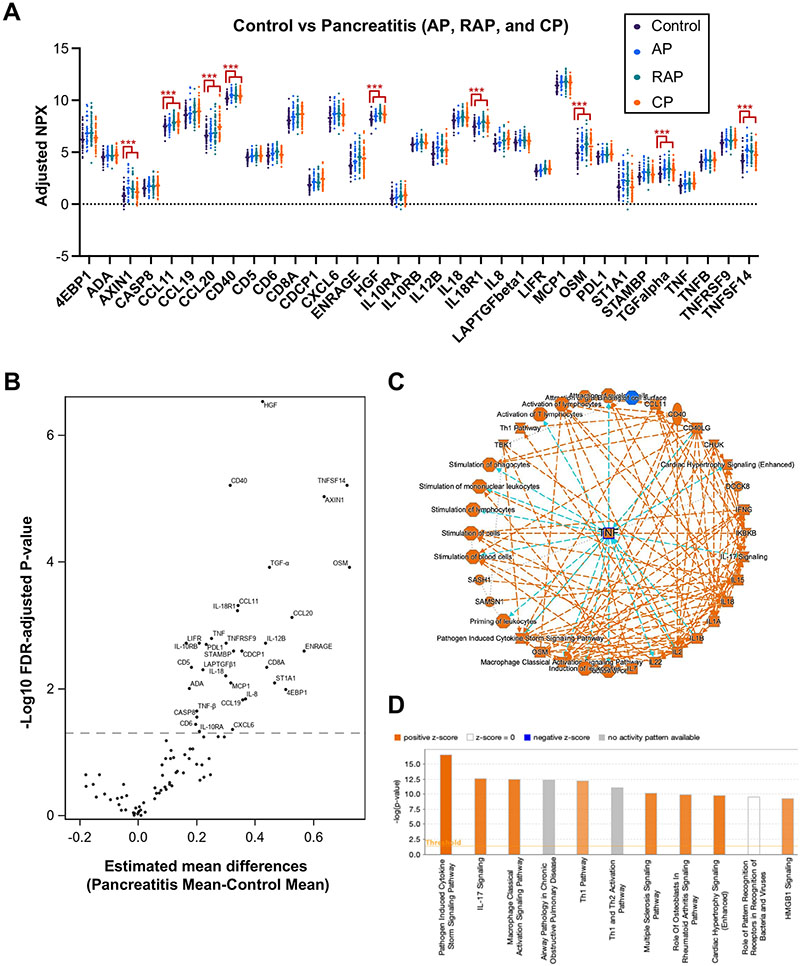
Thirty-three immune markers were differentially expressed in the combined pancreatitis groups (AP, RAP, and CP) compared with controls (Fig. 1A-B). By Ingenuity pathway analysis (IPA), TNF-α was identified as a top regulator molecule. TNF-α-related pathways were identified as activated, including ‘Pathogen induced cytokine storm signaling,’ ‘IL-17 signaling’, and ‘Macrophage classical activation signaling’ (Fig. 1C-D). Consistent with previous studies35-37, our data also indicate that the TNF-α-centered pro-inflammatory signal is a major feature of the combined pancreatitis groups consisting of AP, RAP, and CP.
Figure 1. Serum immune profiling analysis differentiates the combined pancreatitis groups from controls.
A. Normalized protein expression (NPX) values of 33 differentially expressed serum immune markers among the combined pancreatitis groups (AP, RAP, and CP; n=151) vs. controls (n=56), using an Olink assay. Data are adjusted for the covariates of age, sex, smoking, and drinking status. FDR-adjusted p-values of all markers displayed are less than 0.05, ***p<0.001. B. Volcano plot of differentially expressed immune markers in all pancreatitis vs. controls. C. Graphical summary depicting TNF-centered molecular interactions in all pancreatitis groups versus control. D. Potentially activated pathways revealing pathogen-induced cytokine storm signaling pathway and IL-17 signaling as positively activated pathways in all pancreatitis groups vs. control. C-D. Ingenuity Pathway Analysis (IPA) was performed with Olink data (Estimated mean differences of NPX values in all pancreatitis vs. controls and FDR-adjusted p-values).
Th17 responses discriminate CP from other acute pancreatitis groups and CAP
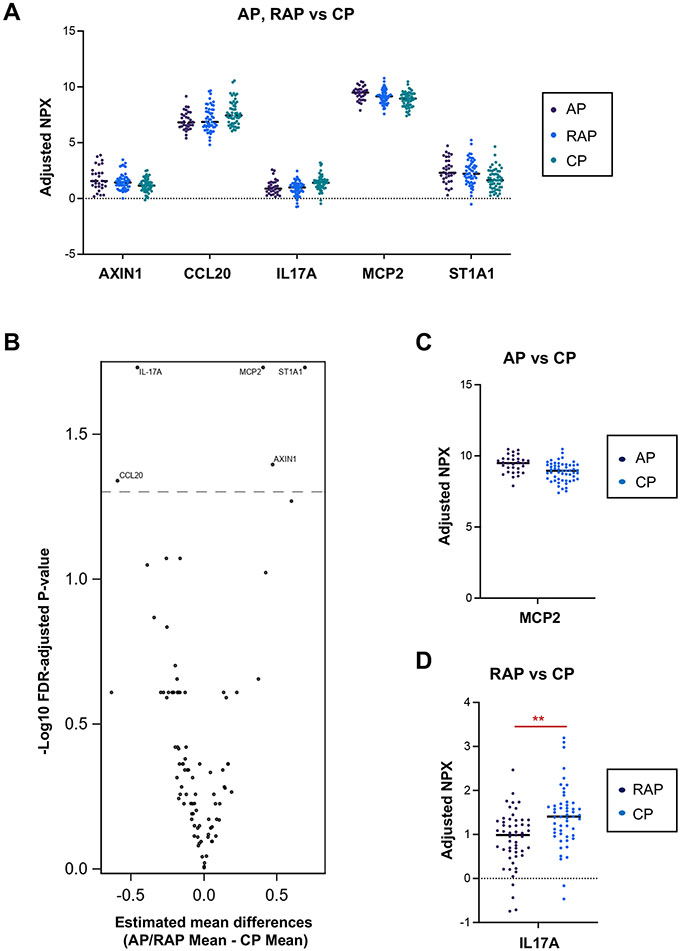
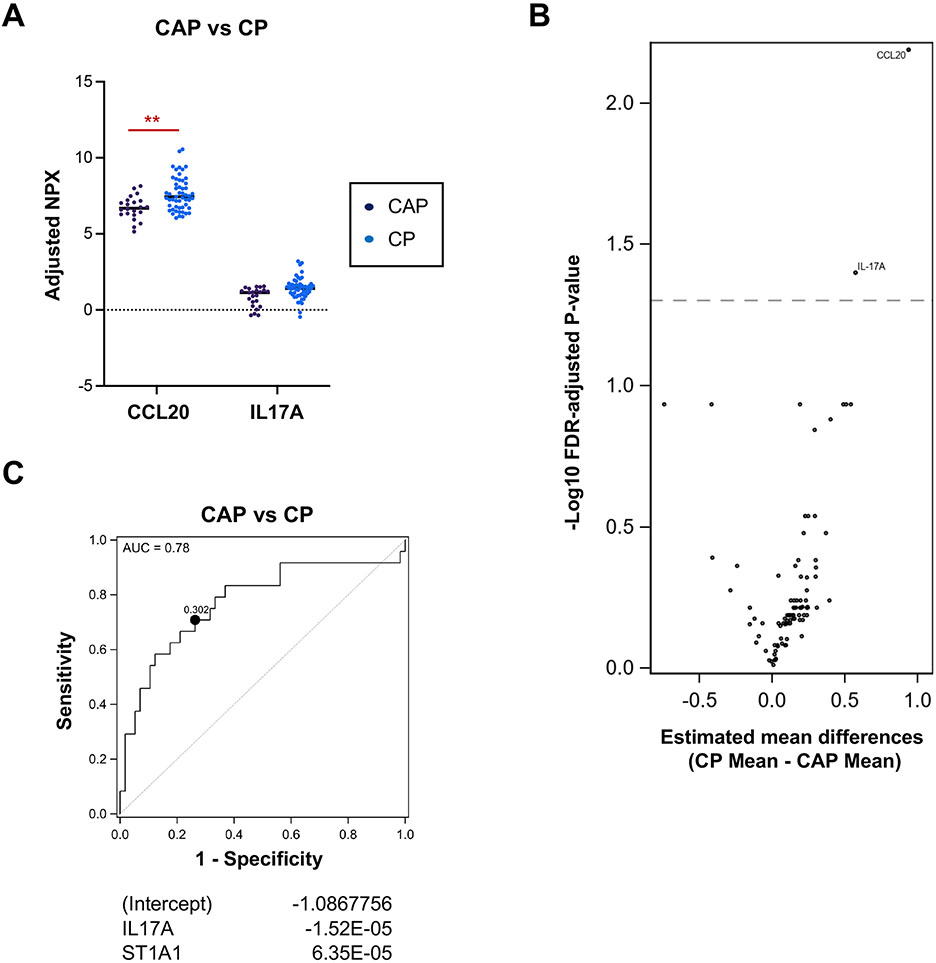
Next, we sought to identify immune markers that distinguish the varying types of pancreatitis and differentiate CP from CAP. Five immune markers, including CCL20 and IL-17A, were different in CP over AP and RAP (Fig. 2A-B). Among those five markers, MCP2 was downregulated in CP versus AP, and IL-17A was upregulated in CP compared with RAP alone. (Fig. 2C-D). Compared with CAP, the Th17-related chemokines and cytokines, CCL20 and IL-17A, were upregulated in CP (Fig. 3A-B), suggesting a potential involvement of Th17 cells in CP disease pathogenesis. Finally, the receiver operator characteristic (ROC) curve was generated with two immune markers (IL-17A and ST1A1) that could predict CP over CAP patients with an optimistic area under the curve (AUC) of 0.78 (Fig. 3C).
Figure 2. IL-17 signaling discriminates CP from other pancreatitis groups.
A. Protein levels of differentially expressed serum immune markers in AP and RAP (n=94) vs. CP (n=57). B. Volcano plot of differentially expressed immune markers in AP and RAP vs. CP. C. Protein levels of differentially expressed serum immune markers in AP (n=38) vs. CP (n=57). D. Protein levels of differentially expressed serum immune markers in RAP (n=56) vs. CP (n=57). Data are adjusted for the covariates of age, sex, smoking, and drinking status. FDR-adjusted p-values of all markers displayed are less than 0.05, **p<0.01.
Figure 3. Th17 responses discern CP from the chronic abdominal pain (CAP) group.
A. Protein levels of differentially expressed serum immune markers in CAP (n=24) vs. CP (n=57). Data are adjusted for the covariates of age, sex, smoking, and drinking status. FDR-adjusted p-values of all markers displayed are less than 0.05, **p<0.01. B. Volcano plot of differentially expressed immune markers in CAP vs. CP. C. Receiver Operator Characteristic (ROC) curve for CP versus CAP with IL17A and ST1A1 (optimistic AUC: 0.78, Optimal cutpoint: 0.302). Shown are regression coefficient estimates from the elastic net. A positive coefficient indicates a positive association with CAP.
Unique and continually increasing inflammatory responses during pancreatitis progression
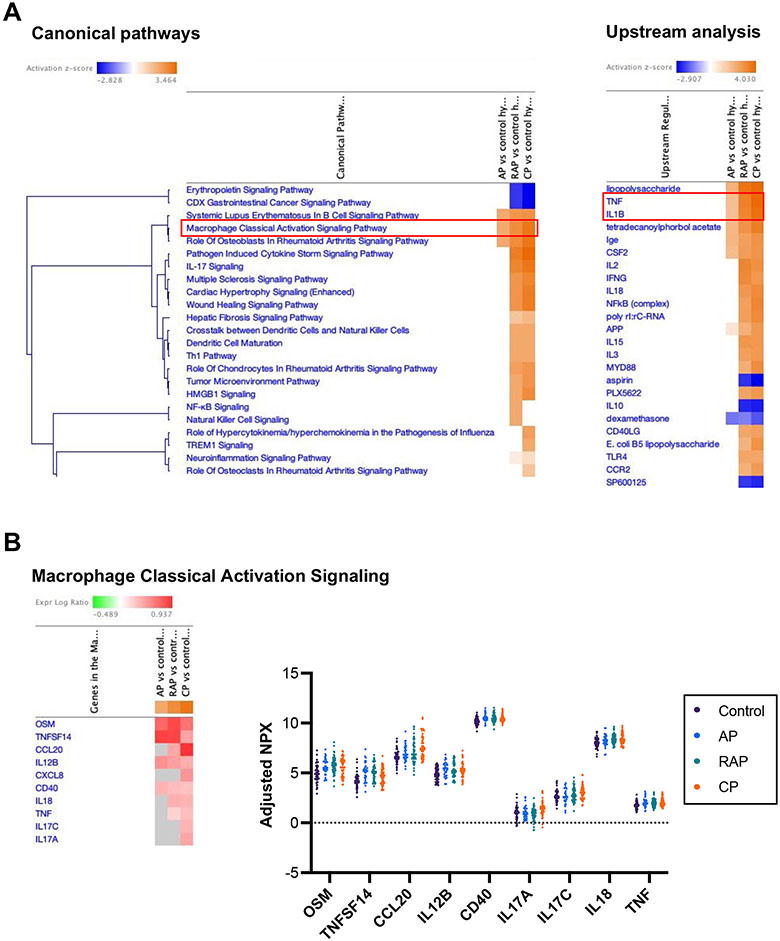
Next, we analyzed the unique inflammatory pathways that distinguished the varying types of pancreatitis in relation to controls. Immune markers that discriminated each disease state (AP, RAP, or CP) from controls were defined by ROC curves that display the optimal thresholds and AUC values (Supplementary Fig. 2A-C). Immune markers differentially regulated in each pancreatitis group compared to controls (Supplementary Fig. 3A-C) were further analyzed with IPA. IPA revealed unique pathway activation signatures in each comparison. Overall, the IPA results from AP versus controls differed from RAP and CP (Supplementary Fig. 4A, B, and D). Interestingly, RAP and CP groups shared several activated signaling pathways, including ‘Pathogen induced cytokine storm signaling’ and ‘IL-17 signaling’, and also shared IL-18 as a central immune marker (Supplementary Fig. 4C and E). Using IPA comparison analysis, positively or negatively activated immune pathways from all three groups were simultaneously compared. When comparing the progression of canonical and upstream pathways, the analysis revealed that the ‘Macrophage classical activation signaling pathway’ and pro-inflammatory upstream signaling (TNF and IL-1β) had gradually increasing heat intensity patterns with pancreatitis disease progression along the continuum of AP, RAP, and CP (Fig. 4A). Similarly, circulating levels of individual immune markers associated with ‘Macrophage classical activation signaling’ showed gradually increasing trends from controls to AP, RAP, and CP (Fig. 4B). These data demonstrate that the serum immune signature of RAP is different from AP and rather similar to CP. Furthermore, these data show that pro-inflammatory signals in each disease state are not transient but accumulate over disease progression from acute to chronic, making the chronic disease more complex.
Figure 4. Acute (AP, CAP) and chronic (CP) pancreatitis states have distinct but common and increasingly active inflammatory pathway signatures.
A. Comparison analysis from the IPA highlights a progressive increase in inflammatory responses, including macrophage classical activation signaling in canonical pathways and TNF and IL-1β in upstream analysis, throughout the pancreatitis progression from acute to chronic disease. B. Heatmap of differentially expressed immune markers associated with macrophage classical activation signaling in each disease state compared with controls (left). Dot plot depicting protein levels of serum immune markers associated with macrophage classical activation signaling (right). Estimated mean differences of NPX values in each comparison and FDR-adjusted p-values were used for the IPA.
Immune signatures specific to smoking, etiology, and alcohol drinking status in pancreatitis
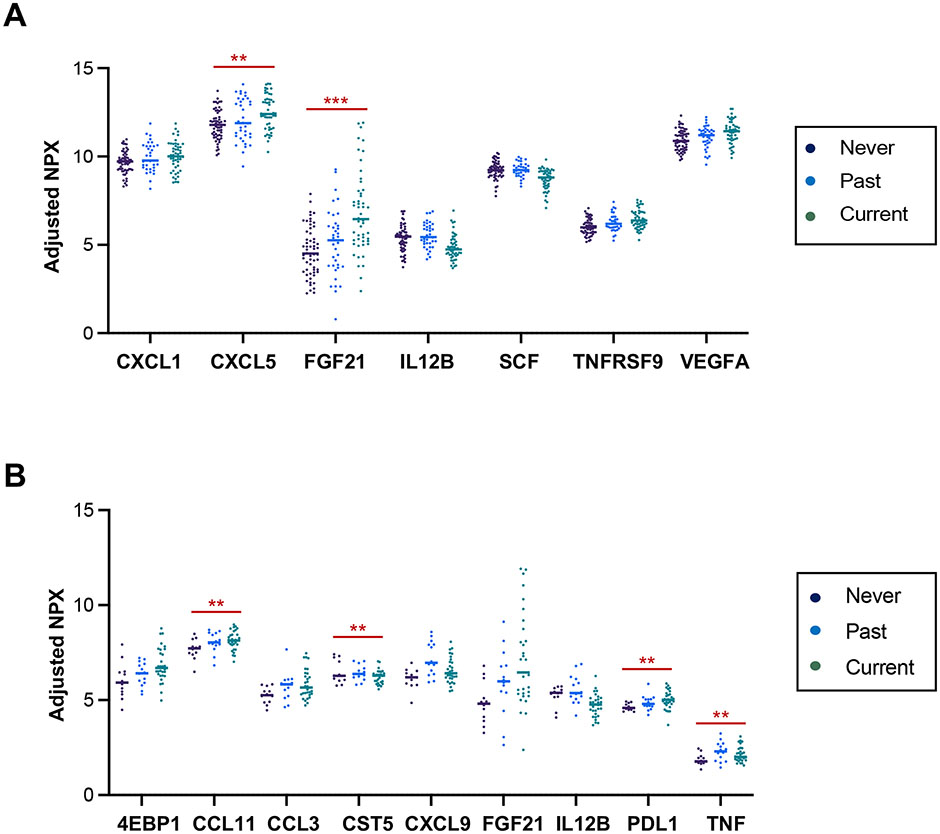
We examined whether smoking status, etiology of pancreatitis, or the amount of alcohol consumption was associated with cytokine expression among the pancreatitis subjects. Where there were sufficient numbers of subjects available, a sub-analysis of the individual pancreatitis group was performed. Smoking is an independent risk factor for pancreatitis and among the most potent risk factors associated with progression from AP to CP38-40. For this reason, we examined whether circulating immune markers are associated with the subject’s smoking status. Seven immune markers were differentially altered by smoking status in the combined all pancreatitis group (Fig. 5A). Among them, the expression of five immune markers, including CXCL5 and FGF21, gradually increased from subjects who never smoked to past and current smokers. Nine immune markers were differentially expressed based on the smoking status in CP, and FGF21 consistently showed an increased trend in CP correlating with the recently exposed degree of smoking (Fig. 5B). The correlation of circulating FGF21 level with smoking status suggests its role in pathophysiological mechanisms of smoking-related pancreatitis. In fact, FGF21 is one of the Klotho-related molecules, which is increased in the circulation of smokers41. FGF21 is also increased in a STAT3-dependent manner following IL-22 administration in the liver after myocardial infarction42. IL-22 production is induced by cigarette smoke and promotes pancreatic fibrosis in CP14. Our study was unable to detect serum levels of IL-22 in the cohort as the Olink panel did not include IL-22, but previous studies and our data indicate that smoking-induced elevated serum levels of FGF21 are potentially linked via the IL-22-IL22R-STAT3 axis. Multiple cytokines and surface markers, including CD8A, IL-17C, and TGFα, were differentially expressed across the different etiologies of pancreatitis (Supplementary Fig. 5A). The circulating level of CD8A was significantly higher in RAP patients with hypertriglyceridemia than those with other etiologies suggesting the association with cytotoxic T cell response (Supplementary Fig. 5B).
Figure 5. Serum immune markers associated with smoking in pancreatitis.
A. Protein expression levels of statistically significant and different serum immune markers in all pancreatitis subjects (n=151) based on smoking status. B. Protein expression values of statistically significant and different serum immune markers in CP subjects (n=57) stratified by smoking status. FDR-adjusted p-values of all markers displayed are less than 0.05, **p<0.01, and ***p<0.001.
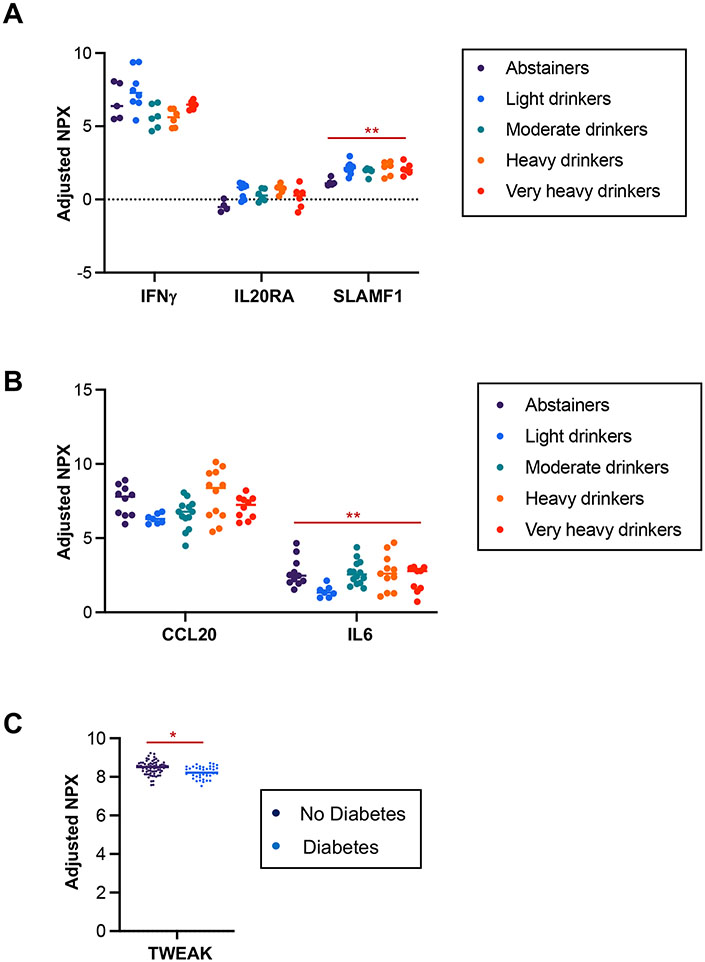
Alcohol is a major etiology and risk factor for pancreatitis38, 39. Thus, we examined whether the circulating immune markers were influenced by alcohol-drinking status among the pancreatitis groups. Circulating levels of IFNγ, IL20R, and SLAMF1 were altered by drinking status in AP (Fig. 6A), while only CCL20 and IL-6 levels were affected by drinking status in RAP (Fig. 6B). None of the immune markers were detectably altered by drinking status in CP. Diabetes is a common complication of advanced CP and contributes to the higher mortality rate in CP 43, 44. We found lower TWEAK levels in the RAP and CP groups with diabetes (Fig. 6C). TWEAK (Tumor necrosis factor weak inducer of apoptosis) is a cytokine of the TNF superfamily. Reduced circulating levels of soluble TWEAK are associated with diabetes in patients at high risk for cardiovascular and renal disease45, 46. Our data indicate that serum TWEAK levels could differentiate RAP and CP patients with diabetes from those without diabetes. However, whether TWEAK levels predict the progression to diabetes among pancreatitis patients, or conversely whether TWEAK levels predict the emergence of pancreatitis among patients with diabetes, would need further study.
Figure 6. Serum immune markers associated with alcohol consumption or diabetes in pancreatitis.
A. Protein expression levels of statistically significant and different serum immune markers in AP with different drinking statuses. B. Protein expression levels of statistically significant and different serum immune markers in RAP with different drinking statuses. C. TWEAK levels among RAP and CP combined, divided between the presence or absence of diabetes. Data are adjusted for the covariates of age and sex (C). FDR-adjusted p-values of all markers displayed are less than 0.05, **p<0.01, and ***p<0.001.
DISCUSSION
Inflammation is a hallmark of pancreatitis. Therefore, the characterization of serum immune signatures among the progressive disease states of pancreatitis could help identify novel diagnostic or prognostic biomarkers. In this study, 92 circulating immune markers were assessed in prospectively collected serum samples from controls and subjects with different disease states of pancreatitis enrolled in the PROCEED study23. DNA-based multiplex immunoassay, Olink, a recently spotlighted and widely used proteomic technology due to its sensitivity and specificity47, 48, revealed distinct immune markers unique to each pancreatitis state (AP, RAP, or CP) compared with no pancreas disease controls or disease controls (CAP). First, Th17-involved chemokines and cytokines, including CCL20 and IL-17A, differentiated CP from AP, RAP, or CAP. Second, pathway analysis discovered a similarity in activated signaling pathways between RAP and CP groups and also revealed that pro-inflammatory pathways were gradually activated over the disease continuum from AP and RAP to CP. In addition, we could identify immune markers that are associated with complications of pancreatitis, including risk factors and complications such as smoking, alcohol consumption, and diabetes. Our results provide the early potential for using these immune markers to diagnose or predict the progression from AP to CP.
A remarkable finding in this current study is that distinct pro-inflammatory immune responses are found during non-active intervals among patients with acute (AP and RAP) and chronic phase (CP), which suggests a hyper-inflammatory state even among AP or RAP patients. Notably, cytokines relevant to Th17 cells and signaling were upregulated in CP compared with no pancreas disease controls and CAP or acute pancreatitis (AP and RAP). CCL20, IL-17, and ST1A1 levels distinguished CAP from CP, and identifying these differentiating factors may be helpful in diagnosing CP in CAP, as there is usually some overlap in pain symptoms between the two groups. The involvement of Th17 cells and IL-17 signals in CP is also supported by our recently published CP studies in mouse and human CP15, 21. CCL20 secretion and its role in the recruitment of CCR6-expressing Th17 cells have been reported in various disease conditions49-51. We have recently identified CCL20 as a unique chemokine signal in the local pancreas tissue of hereditary CP patients undergoing total pancreatectomy islet autotransplantation21. CCL20 was also upregulated in the CP group of the current study. These data indicate that the serum inflammatory analytes identified in the study may reflect local disease pathology. Further studies directly comparing circulating immune markers with pancreas tissue or pancreas fluid analysis will definitively establish concordance. Of note, targeting Th17 signaling in CP in clinical trials must be balanced with the beneficial effects of IL-17 on intestinal barrier integrity52.
Pathway analysis of the immune markers among the AP, RAP, or CP conditions revealed distinct pathway activations between acute conditions (AP and RAP) but similar immune pathway activations between RAP and CP groups. Comparison analysis suggested an accumulation of proinflammatory pathways over the disease continuum. These data imply that the disease condition becomes more complex on an immunological level as it progresses from acute to chronic stage. Our results demonstrate disease-specific immune signatures in pancreatitis. The findings could be broadly applicable to other sterile inflammatory diseases that progress to a chronic irreversible state, including in the bowel, liver, lung, kidney, or joints.
Even with the strengths and novelty of the current study that leverages a prospective large well-phenotyped pancreatitis cohort, we acknowledge several limitations. First, the results from this study remain to be validated with more specific assays for the markers of interest as well as independent pancreatitis cohorts in the future. Indeed, CPDPC has launched to collect samples from the independent validation cohort from five distinct centers, and we will validate our current results using the validation cohort. Second, 92 designated immune markers might be insufficient to identify disease- or disease-progression-specific novel biomarkers. Future studies could employ an expanded panel with additional inflammatory and damage-associated markers to predict disease states further. Also, analyses that incorporate prospectively and have multiple biospecimens from the same patients over time will further prove the alterations in systemic immune responses over the disease course. Patients in the current AP cohort, who do not have a recurrent episode, will be followed annually. Thus, longitudinal immune profiling, at least with the current AP cohort, can be performed in the near future. Lastly, given that immune cells closely interact with pancreatic parenchymal cells and stellate cells in the disease state, the integrated multi-omics approach with proteomics, metabolomics, and single-cell sequencing data from human blood samples would provide a further understanding of the disease.
Previous studies have probed serum immune biomarkers using pancreatitis biospecimens20, 53. Our current study is unique in testing a large array of immune markers using serum samples collected prospectively from a multi-center consortium. It is also the first pancreatitis study to test DNA oligonucleotide-based high-multiplex immunoassay. These findings provide potential biomarkers to differentiate pancreatitis phases and immune mechanisms of disease progression from AP to CP.
Supplementary Material
What you need to know:
Background and context
Pancreatitis is an inflammatory disease continuum from acute to chronic with significant mortality and complications. Currently, there are no approved therapies or early diagnostic biomarkers for pancreatitis.
New findings
Circulating immune profiling of serum samples from a large pancreatitis cohort led to identifying distinct immune markers that distinguish chronic from acute states and unique proinflammatory pathways gradually activated throughout disease progression.
Limitations
This study is cross-sectional; thus, longitudinal sample collections from the independent cohort will further validate the current findings and prove the systemic immune alterations over the disease course.
Clinical research relevance
Our study identified IL-17 signaling proteins, CCL20 and IL-17, as unique and actionable potential targets for diagnosing patients with chronic pancreatitis and differentiating them from patients with chronic abdominal pain. These unique immune markers can be potential therapeutic targets for chronic pancreatitis.
Basic Research Relevance
This first large, multi-center prospective serum immune profiling analysis in the spectrum of pancreatitis provides mechanistic insights into circulating immune responses during pancreatitis progression with findings of accumulative activation of the innate immune signaling and pro-inflammatory pathways.
Lay Summary
Analysis of serum immune markers in a large cohort of pancreatitis allowed the identification of distinct immune markers that could serve as potential biomarkers providing mechanistic insights into pancreatitis progression.
ACKNOWLEDGEMENTS
We acknowledge that the Human Immune Monitoring Center (Dr. Tyson H. Holmes) at the Institute for Immunity, Transplantation, and Infection, Stanford University School of Medicine provided regression, ROC analyses, and Olink assays.
FUNDING
Research reported in this publication was supported by National Cancer Institute and National Institute of Diabetes and Digestive and Kidney Diseases of the National Institutes of Health under award numbers related to The Consortium for the Study of Chronic Pancreatitis, Diabetes, and Pancreatic Cancer (CPDPC) (U01DK108300, U01DK108328, U01DK126365, U01DK108306, U01DK108327, U01DK108288, U01DK108323, U01DK126300, U01DK108332, U01DK108314, U01DK108320, U01DK108326). The content is solely the responsibility of the authors and does not necessarily represent the official views of the National Institutes of Health.
ABBREVIATIONS
- PROCEED
Prospective Evaluation of Chronic Pancreatitis for Epidemiologic and Translational Studies
- CPDPC
Consortium for the Study of Chronic Pancreatitis, Diabetes, and Pancreatic Cancer
- AP
acute pancreatitis
- RAP
recurrent acute pancreatitis
- CP
chronic pancreatitis
- CAP
chronic abdominal pain
- PEA
proximity extension assay
- IPA
Ingenuity Pathway Analysis
- AUC
area under the curve
- ROC
receiver operator characteristic
- NPX
normalized protein expression
- FDR
false discovery rate
the Consortium for the Study of Chronic Pancreatitis, Diabetes, and Pancreatic Cancer Group
Liang Li, Dhiraj Yadav, Darwin L. Conwell, Phil A. Hart, Santhi Swaroop Vege, Evan L. Fogel, Jose Serrano, Dana Andersen, Melena D. Bellin, Mark Topazian, Stephen K. Van Den Eeden, Stephen J. Pandol, Chris Forsmark, William E. Fisher, Walter G. Park1
Footnotes
COMPETING INTEREST STATEMENT
MDB declares financial relationships with Viacyte and Dexcom (Research support), Insulet (DSMB member), and Ariel Precision Medicine (advisory board). AH is currently on leave from Stanford University. All other co-authors declare that they have no competing interests.
Publisher's Disclaimer: This is a PDF file of an unedited manuscript that has been accepted for publication. As a service to our customers we are providing this early version of the manuscript. The manuscript will undergo copyediting, typesetting, and review of the resulting proof before it is published in its final form. Please note that during the production process errors may be discovered which could affect the content, and all legal disclaimers that apply to the journal pertain.
DATA AVAILABILITY
Data analytic methods are described in the methods section in detail. All analyzed and processed data are available in the supplemental materials or available from the corresponding authors upon reasonable request.
REFERENCES
- 1.Ahmed Ali U, Issa Y, Hagenaars JC, et al. Risk of Recurrent Pancreatitis and Progression to Chronic Pancreatitis After a First Episode of Acute Pancreatitis. Clin Gastroenterol Hepatol 2016;14:738–46. [DOI] [PubMed] [Google Scholar]
- 2.Sankaran SJ, Xiao AY, Wu LM, et al. Frequency of progression from acute to chronic pancreatitis and risk factors: a meta-analysis. Gastroenterology 2015;149:1490–1500 e1. [DOI] [PubMed] [Google Scholar]
- 3.Xiao AY, Tan ML, Wu LM, et al. Global incidence and mortality of pancreatic diseases: a systematic review, meta-analysis, and meta-regression of population-based cohort studies. Lancet Gastroenterol Hepatol 2016;1:45–55. [DOI] [PubMed] [Google Scholar]
- 4.Frey CF, Bradley EL 3rd, Beger HG. Progress in acute pancreatitis. Surg Gynecol Obstet 1988;167:282–6. [PubMed] [Google Scholar]
- 5.Peery AF, Dellon ES, Lund J, et al. Burden of gastrointestinal disease in the United States: 2012 update. Gastroenterology 2012;143:1179–1187 e3. [DOI] [PMC free article] [PubMed] [Google Scholar]
- 6.Machicado JD, Yadav D. Epidemiology of Recurrent Acute and Chronic Pancreatitis: Similarities and Differences. Dig Dis Sci 2017;62:1683–1691. [DOI] [PMC free article] [PubMed] [Google Scholar]
- 7.Hegyi PJ, Soos A, Toth E, et al. Evidence for diagnosis of early chronic pancreatitis after three episodes of acute pancreatitis: a cross-sectional multicentre international study with experimental animal model. Sci Rep 2021;11:1367. [DOI] [PMC free article] [PubMed] [Google Scholar]
- 8.Raimondi S, Lowenfels AB, Morselli-Labate AM, et al. Pancreatic cancer in chronic pancreatitis; aetiology, incidence, and early detection. Best Pract Res Clin Gastroenterol 2010;24:349–58. [DOI] [PubMed] [Google Scholar]
- 9.Yadav D, Lowenfels AB. The epidemiology of pancreatitis and pancreatic cancer. Gastroenterology 2013;144:1252–61. [DOI] [PMC free article] [PubMed] [Google Scholar]
- 10.Pezzilli R, Bini L, Fantini L, et al. Quality of life in chronic pancreatitis. World J Gastroenterol 2006;12:6249–51. [DOI] [PMC free article] [PubMed] [Google Scholar]
- 11.Habtezion A. Inflammation in acute and chronic pancreatitis. Curr Opin Gastroenterol 2015;31:395–9. [DOI] [PMC free article] [PubMed] [Google Scholar]
- 12.Xue J, Nguyen DT, Habtezion A. Aryl hydrocarbon receptor regulates pancreatic IL-22 production and protects mice from acute pancreatitis. Gastroenterology 2012;143:1670–80. [DOI] [PMC free article] [PubMed] [Google Scholar]
- 13.Xue J, Sharma V, Hsieh MH, et al. Alternatively activated macrophages promote pancreatic fibrosis in chronic pancreatitis. Nat Commun 2015;6:7158. [DOI] [PMC free article] [PubMed] [Google Scholar]
- 14.Xue J, Zhao Q, Sharma V, et al. Aryl Hydrocarbon Receptor Ligands in Cigarette Smoke Induce Production of Interleukin-22 to Promote Pancreatic Fibrosis in Models of Chronic Pancreatitis. Gastroenterology 2016;151:1206–1217. [DOI] [PMC free article] [PubMed] [Google Scholar]
- 15.Zhao Q, Manohar M, Wei Y, et al. STING signalling protects against chronic pancreatitis by modulating Th17 response. Gut 2019;68:1827–1837. [DOI] [PMC free article] [PubMed] [Google Scholar]
- 16.Grundsten M, Liu GZ, Permert J, et al. Increased central memory T cells in patients with chronic pancreatitis. Pancreatology 2005;5:177–82. [DOI] [PubMed] [Google Scholar]
- 17.Schmitz-Winnenthal H, Pietsch DH, Schimmack S, et al. Chronic pancreatitis is associated with disease-specific regulatory T-cell responses. Gastroenterology 2010;138:1178–88. [DOI] [PubMed] [Google Scholar]
- 18.Chand SK, Singh RG, Pendharkar SA, et al. Interplay between innate immunity and iron metabolism after acute pancreatitis. Cytokine 2018;103:90–98. [DOI] [PubMed] [Google Scholar]
- 19.Wu J, Zhang R, Hu G, et al. Carbon Monoxide Impairs CD11b(+)Ly-6C(hi) Monocyte Migration from the Blood to Inflamed Pancreas via Inhibition of the CCL2/CCR2 Axis. J Immunol 2018;200:2104–2114. [DOI] [PubMed] [Google Scholar]
- 20.Park WG, Li L, Appana S, et al. Unique circulating immune signatures for recurrent acute pancreatitis, chronic pancreatitis and pancreatic cancer: A pilot study of these conditions with and without diabetes. Pancreatology 2020;20:51–59. [DOI] [PMC free article] [PubMed] [Google Scholar]
- 21.Lee B, Namkoong H, Yang Y, et al. Single-cell sequencing unveils distinct immune microenvironments with CCR6-CCL20 crosstalk in human chronic pancreatitis. Gut 2021. [DOI] [PMC free article] [PubMed] [Google Scholar]
- 22.Manohar M, Jones EK, Rubin SJS, et al. Novel Circulating and Tissue Monocytes as Well as Macrophages in Pancreatitis and Recovery. Gastroenterology 2021;161:2014–2029 e14. [DOI] [PMC free article] [PubMed] [Google Scholar]
- 23.Yadav D, Park WG, Fogel EL, et al. PROspective Evaluation of Chronic Pancreatitis for EpidEmiologic and Translational StuDies: Rationale and Study Design for PROCEED From the Consortium for the Study of Chronic Pancreatitis, Diabetes, and Pancreatic Cancer. Pancreas 2018;47:1229–1238. [DOI] [PMC free article] [PubMed] [Google Scholar]
- 24.Fisher WE, Cruz-Monserrate Z, McElhany AL, et al. Standard Operating Procedures for Biospecimen Collection, Processing, and Storage: From the Consortium for the Study of Chronic Pancreatitis, Diabetes, and Pancreatic Cancer. Pancreas 2018;47:1213–1221. [DOI] [PMC free article] [PubMed] [Google Scholar]
- 25.Assarsson E, Lundberg M, Holmquist G, et al. Homogenous 96-plex PEA immunoassay exhibiting high sensitivity, specificity, and excellent scalability. PLoS One 2014;9:e95192. [DOI] [PMC free article] [PubMed] [Google Scholar]
- 26.Ray WD. Applied Linear Statistical-Models, 3rd Edition - Neter,J, Wasserman,W, Kutner,Mh. Journal of the Operational Research Society 1991;42:815–815. [Google Scholar]
- 27.Rice JA. Mathematical statistics and data analysis. Belmont, CA: Duxbury Press, 1995. [Google Scholar]
- 28.Yohai VJ. High Breakdown-Point and High-Efficiency Robust Estimates for Regression. Annals of Statistics 1987;15:642–656. [Google Scholar]
- 29.Long JS, Ervin LH. Using heteroscedasticity consistent standard errors in the linear regression model. American Statistician 2000;54:217–224. [Google Scholar]
- 30.Benjamini Y, Krieger AM, Yekutieli D. Adaptive linear step-up procedures that control the false discovery rate. Biometrika 2006;93:491–507. [Google Scholar]
- 31.Kim KI, van de Wiel MA. Effects of dependence in high-dimensional multiple testing problems. BMC Bioinformatics 2008;9:114. [DOI] [PMC free article] [PubMed] [Google Scholar]
- 32.Zou H, Hastie T. Regularization and variable selection via the elastic net (vol B 67, pg 301, 2005). Journal of the Royal Statistical Society Series B-Statistical Methodology 2005;67:768–768. [Google Scholar]
- 33.Kim JH. Estimating classification error rate: Repeated cross-validation, repeated hold-out and bootstrap. Computational Statistics & Data Analysis 2009;53:3735–3745. [Google Scholar]
- 34.Friedman J, Hastie T, Tibshirani R. Regularization Paths for Generalized Linear Models via Coordinate Descent. J Stat Softw 2010;33:1–22. [PMC free article] [PubMed] [Google Scholar]
- 35.Granell S, Pereda J, Gomez-Cambronero L, et al. Circulating TNF-alpha and its soluble receptors during experimental acute pancreatitis. Cytokine 2004;25:187–91. [DOI] [PubMed] [Google Scholar]
- 36.Malleo G, Mazzon E, Siriwardena AK, et al. TNF-alpha as a therapeutic target in acute pancreatitis--lessons from experimental models. ScientificWorldJournal 2007;7:431–48. [DOI] [PMC free article] [PubMed] [Google Scholar]
- 37.Perides G, Weiss ER, Michael ES, et al. TNF-alpha-dependent regulation of acute pancreatitis severity by Ly-6C(hi) monocytes in mice. J Biol Chem 2011;286:13327–35. [DOI] [PMC free article] [PubMed] [Google Scholar]
- 38.Cote GA, Yadav D, Slivka A, et al. Alcohol and smoking as risk factors in an epidemiology study of patients with chronic pancreatitis. Clin Gastroenterol Hepatol 2011;9:266–73; quiz e27. [DOI] [PMC free article] [PubMed] [Google Scholar]
- 39.Yadav D, Hawes RH, Brand RE, et al. Alcohol consumption, cigarette smoking, and the risk of recurrent acute and chronic pancreatitis. Arch Intern Med 2009;169:1035–45. [DOI] [PMC free article] [PubMed] [Google Scholar]
- 40.Nojgaard C, Becker U, Matzen P, et al. Progression from acute to chronic pancreatitis: prognostic factors, mortality, and natural course. Pancreas 2011;40:1195–200. [DOI] [PubMed] [Google Scholar]
- 41.Nakanishi K, Nishida M, Yamamoto R, et al. An implication of Klotho-related molecules in different smoking-related health outcomes between men and women. Clin Chim Acta 2018;476:44–48. [DOI] [PubMed] [Google Scholar]
- 42.Tang TT, Li YY, Li JJ, et al. Liver-heart crosstalk controls IL-22 activity in cardiac protection after myocardial infarction. Theranostics 2018;8:4552–4562. [DOI] [PMC free article] [PubMed] [Google Scholar]
- 43.Bellin MD, Whitcomb DC, Abberbock J, et al. Patient and Disease Characteristics Associated With the Presence of Diabetes Mellitus in Adults With Chronic Pancreatitis in the United States. Am J Gastroenterol 2017;112:1457–1465. [DOI] [PMC free article] [PubMed] [Google Scholar]
- 44.Goodarzi MO, Petrov MS, Andersen DK, et al. Diabetes in chronic pancreatitis: risk factors and natural history. Curr Opin Gastroenterol 2021;37:526–531. [DOI] [PMC free article] [PubMed] [Google Scholar]
- 45.Diaz-Lopez A, Chacon MR, Bullo M, et al. Serum sTWEAK concentrations and risk of developing type 2 diabetes in a high cardiovascular risk population: a nested case-control study. J Clin Endocrinol Metab 2013;98:3482–90. [DOI] [PubMed] [Google Scholar]
- 46.Kralisch S, Ziegelmeier M, Bachmann A, et al. Serum levels of the atherosclerosis biomarker sTWEAK are decreased in type 2 diabetes and end-stage renal disease. Atherosclerosis 2008;199:440–4. [DOI] [PubMed] [Google Scholar]
- 47.Carlyle BC, Kitchen RR, Mattingly Z, et al. Technical Performance Evaluation of Olink Proximity Extension Assay for Blood-Based Biomarker Discovery in Longitudinal Studies of Alzheimer's Disease. Front Neurol 2022;13:889647. [DOI] [PMC free article] [PubMed] [Google Scholar]
- 48.Haslam DE, Li J, Dillon ST, et al. Stability and reproducibility of proteomic profiles in epidemiological studies: comparing the Olink and SOMAscan platforms. Proteomics 2022;22:e2100170. [DOI] [PMC free article] [PubMed] [Google Scholar]
- 49.Hirota K, Yoshitomi H, Hashimoto M, et al. Preferential recruitment of CCR6-expressing Th17 cells to inflamed joints via CCL20 in rheumatoid arthritis and its animal model. J Exp Med 2007;204:2803–12. [DOI] [PMC free article] [PubMed] [Google Scholar]
- 50.Harper EG, Guo C, Rizzo H, et al. Th17 cytokines stimulate CCL20 expression in keratinocytes in vitro and in vivo: implications for psoriasis pathogenesis. J Invest Dermatol 2009;129:2175–83. [DOI] [PMC free article] [PubMed] [Google Scholar]
- 51.Dohlman TH, Chauhan SK, Kodati S, et al. The CCR6/CCL20 axis mediates Th17 cell migration to the ocular surface in dry eye disease. Invest Ophthalmol Vis Sci 2013;54:4081–91. [DOI] [PMC free article] [PubMed] [Google Scholar]
- 52.Martinez-Lopez M, Iborra S, Conde-Garrosa R, et al. Microbiota Sensing by Mincle-Syk Axis in Dendritic Cells Regulates Interleukin-17 and -22 Production and Promotes Intestinal Barrier Integrity. Immunity 2019;50:446–461 e9. [DOI] [PMC free article] [PubMed] [Google Scholar]
- 53.Farrell PR, Jones EK, Hornung L, et al. Cytokine Profile Elevations on Admission Can Determine Risks of Severe Acute Pancreatitis in Children. J Pediatr 2021;238:33–41 e4. [DOI] [PMC free article] [PubMed] [Google Scholar]
Associated Data
This section collects any data citations, data availability statements, or supplementary materials included in this article.
Supplementary Materials
Data Availability Statement
Data analytic methods are described in the methods section in detail. All analyzed and processed data are available in the supplemental materials or available from the corresponding authors upon reasonable request.


