Abstract
Biomolecular and physical cues of the extracellular matrix environment regulates collective cell dynamics and tissue patterning. Nonetheless, how the viscoelastic properties of the matrix regulate collective cell spatial and temporal organization is not fully understood. Here we show that the passive viscoelastic properties of the matrix that encapsulate a spheroidal tissue of breast epithelial cells guide tissue proliferation in space and in time. Matrix viscoelasticity prompts symmetry breaking of the spheroid, leading to the formation of invading finger-like protrusions, YAP nuclear translocation and epithelial to mesenchymal transition both in vitro and in vivo in a Arp2/3 complex dependent manner. Computational modelling of these observations allow us to establish a phase diagram relating morphological stability with matrix viscoelasticity, tissue viscosity, cell motility and cell division rate, which is experimentally validated by biochemical assays and in vitro experiments with an intestinal organoid. Altogether, this work highlights the role of stress relaxation mechanisms in tissue growth dynamics, a fundamental process in morphogenesis and oncogenesis.
Introduction
The patterning of tissues in space and time is relevant for many biological processes1–3, and is driven by cell number, size, shape and position changes and leads to symmetry breaking instabilities such as buckling, folding, tearing, budding, fingering or branching4, 5. At a molecular level, the spatio-temporal organization of tissues is regulated by intrinsic gene expression6, and a variety of environmental chemical and mechanical cues7. While the importance of chemical morphogen gradients in development is long appreciated8, it is increasingly clear that mechanical cues9–12 in the tissue and the surrounding 3D extracellular matrix (ECM) also regulate tissue organization and morphogenesis. The role of stiffness in tissue organization has been studied extensively1, 13, 14. However, the role of viscosity versus elasticity of the matrix in the tissue response is unclear, although the time-varying viscoelastic properties of the ECM are increasingly thought to be an important player in morphogenesis15, 16, Indeed, matrix viscoelasticity has been shown to regulate single cell behavior15, but it is not known how it regulates collective behavior. Thus, tissue organization is expected to be impacted by the viscoelastic properties of the matrix17 whose behaviors vary from an elastic solid-like response to a liquid-like viscous response, with stress relaxation time scales that range from a second to a few hundred seconds. Here we report an experimental and computational study of the role of the viscoelasticity of well-defined model matrices in regulating tissue organization in two commonly used in vitro models of development and pathology, breast epithelial growth18 and intestinal organoid development2. These studies demonstrate the role of stress relaxation in determining the dynamics of tissue growth and the symmetry breaking instabilities associated with fingering, a fundamental process in morphogenesis and oncogenesis.
Results
ECM viscoelasticity regulates epithelial tissue organization
We first studied the importance of matrix viscoelasticity in the organization and growth of mammary tissues from spheroids of MCF10A non-malignant breast epithelial cells. Hydrogels formed from the natural polysaccharide alginate were chosen as the model matrix system, as mammalian cells do not express enzymes to degrade these polymers, allowing effects related to matrix degradation to be eliminated19. The relative viscoelastic properties of these gels can be readily altered independently of the stiffness, pore size and adhesive ligands20. This was achieved here by changing the molecular weight of alginate and the calcium crosslinker density in concert (Figure 1a) to create gel matrices of constant elastic moduli (Figure1b), but varying stress relaxation times to achieve matrices that are more elastic , or more viscoelastic (Figure 1c). As alginate does not present intrinsic integrin adhesion ligands, Arg-Gly-Asp (RGD) containing peptides were conjugated to the polymer backbone to provide a constant level of cell binding sites in all gels21. MCF10A breast epithelial cells, widely used to study mammary development and oncogenesis18, were formed into spheroids of ~2000 cells and encapsulated in hydrogels.
Figure 1. Matrix viscoelasticity determines symmetry breaking, tissue branching, and epithelial to mesenchymal transition.
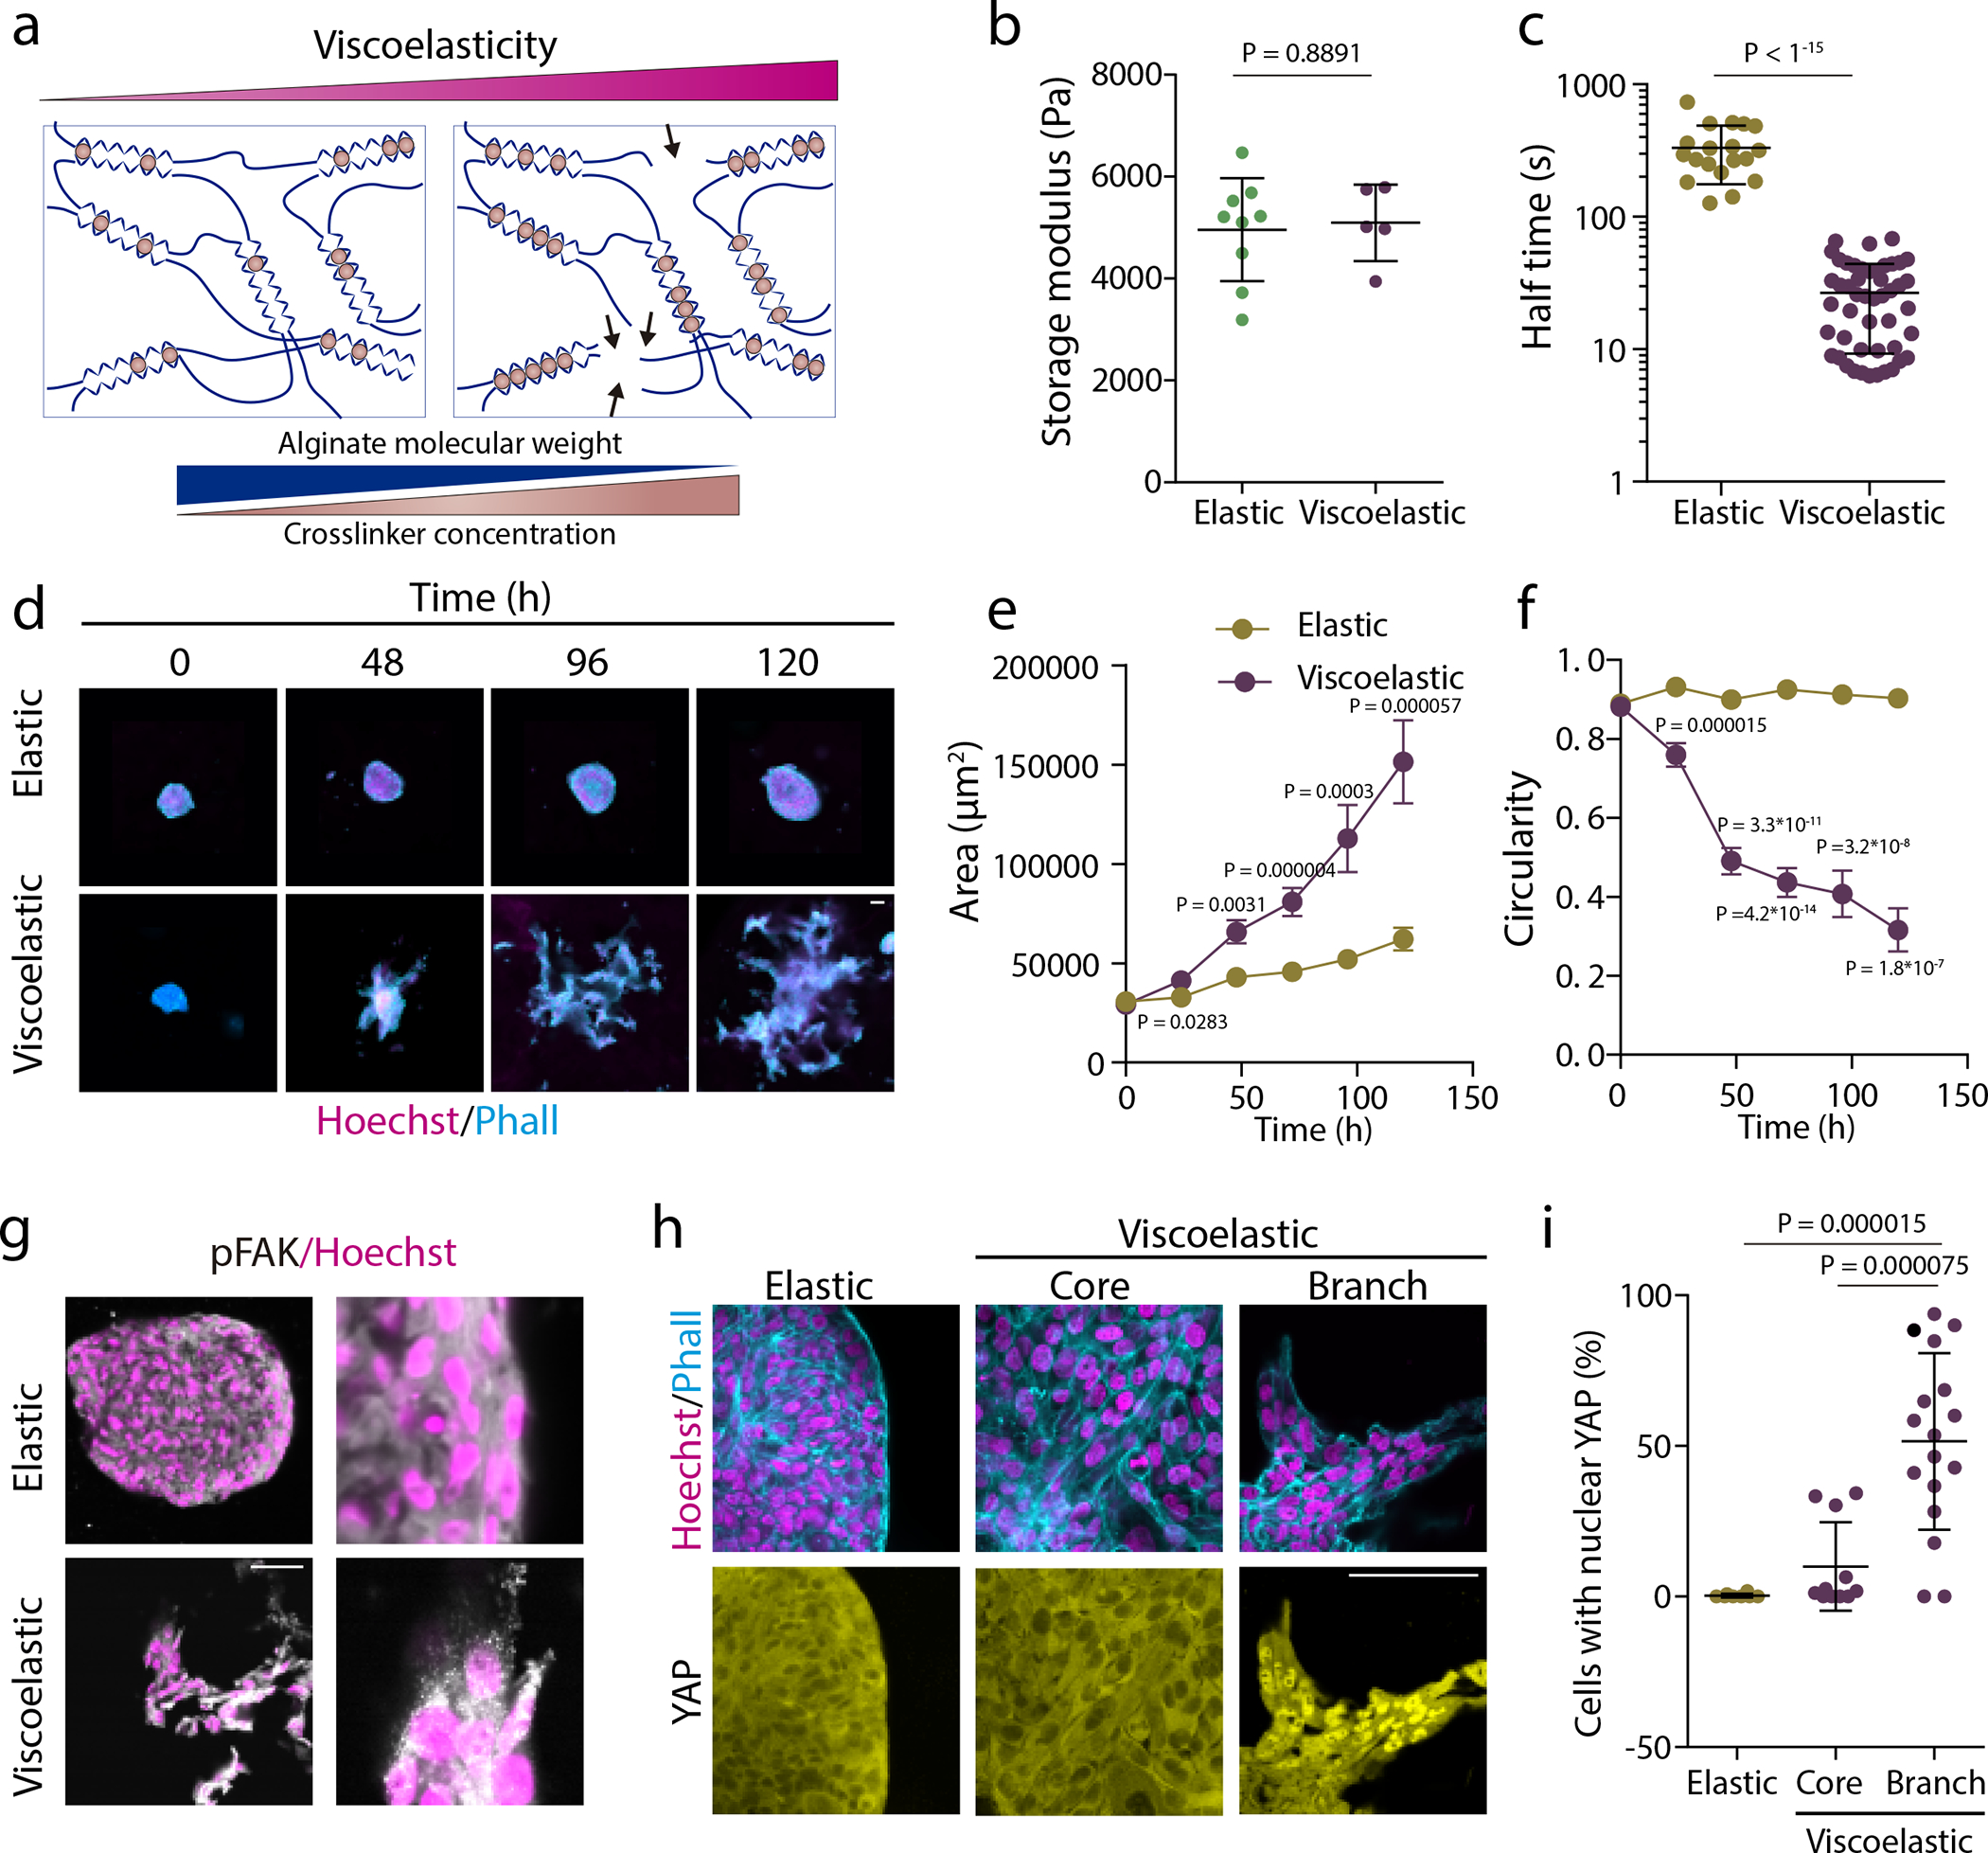
a, Schematic demonstrating how simultaneously changing the polymer molecular weight and extent of crosslinking allows for constant gel stiffness but altered viscoelastic properties. b, Quantification of the storage modulus of resulting alginate hydrogels (n=5,9 gels per condition). c, Quantification of the timescale at which an initially applied stress is relaxed to half its original value (n=19 gels per condition). d, Examples of growth of MCF10A spheroids in elastic versus viscoelastic hydrogels over 5 days. Phalloidin in cyan, Hoechst in magenta. e-f, Quantification of the spheroids area (e) and circularity (f), respectively (error bars, s.e.m). n=19–43 spheroids/condition/day. g, Representative examples of phosphorylated FAK focal adhesions in MCF10A celll spheroids growing in elastic and viscoelastic gels. pFAK in gray and hoechst in magenta (n=3,4 images per condition). h. Representative examples of phalloidin, Hoechst (upper row) and YAP (lower row) stainings of spheroids in elastic and viscoelastic gels (spheroids core cells and branch leader cells). i. Quantification from stainings of the percentage of cells with nuclear YAP per image for the indicated regions (n=8,11,17 images per condition). Statistical analysis was performed using Kruskal–Wallis test followed by post hoc Dunn’s test. For panels b,c,e,f, statistical analysis was performed using two-sided Mann-Whitney U-test. All data are mean ± s.d. except where indicated, all scale bars are 75 μm.
Over time, tissues in elastic matrices grew slowly and were morphologically stable; they increased in size while maintaining their spherical symmetry. However, tissues in viscoelastic matrices grew much faster. As they increased in size, they exhibited morphological instability and broke spherical symmetry, formed fingers, and invaded the matrix, leading to a significant increase in the surface area and a decrease in circularity (Figure 1d–f, Extended Data Figure 1a and Supplementary Video S1). As these differences resulted from changes in the mechanical properties of the matrix, our studies next focused on two major mechanosensitive hubs in cells, the focal adhesion kinase (FAK) complex, and the mechanosensitive transcriptional regulator Yes-Associated protein (YAP)22. Viscoelastic matrices promoted the expression and formation of phosphorylated pFAK adhesions, but elastic matrices did not (Figure 1g and Extended Data Figure 1d,e), while YAP remained in the cytoplasm in cells in elastic matrices, but translocated to the nucleus in cells in fingers in viscoelastic matrices (Fig.1h,i). Although YAP nuclear translocation has been observed at the single cell level in 3D viscoelastic matrices20, it has also been observed that YAP was not mechanosensitive in 3D spheroids of MCF10A cells23. However, we used more rapidly relaxing matrices than used in that earlier study, supporting a viscoelasticity-sensitive mechanism. When FAK was inhibited (Extended Data Figure 1b,c), breast epithelium was morphologically stable, confirming the importance of mechanotransduction. Despite differences in YAP localization, no significant differences in nesprin or emerin expression were observed in spheroids in elastic or viscoelastic matrices (Extended Data Figure 1f,g). When proliferation was inhibited with thymidine, YAP was mainly cytoplasmic in viscoelastic matrices (Extended Data Figure 1h).
The behavior observed in viscoelastic matrices is seen in many biological processes that demonstrate symmetry breaking accompanied by epithelial to mesenchymal transitions (EMT)24. In agreement with that precedent, cells in viscoelastic matrices demonstrated an EMT, as vimentin was expressed in fingers (Figure 2a,b), cytokeratin 14 expression was low in cells in spheroids in viscoelastic matrices (Figure 2c,d) and the EMT transcription factors Snail-1, Slug and Zeb1 were more expressed in cells in viscoelastic matrices (Figure 2e–g and Supplementary Figure 1 and Extended Data Figure 2). Furthermore, a number of cancer-related pathways were not altered in cells within elastic matrices, but were upregulated in viscoelastic stiff hydrogels (Supplementary Figure 2). To determine whether viscoelasticity enhanced tissue growth in vivo we followed two approaches; First, MDA-MB-231 malignant breast epithelial cells encapsulated either in viscoelastic or elastic matrices were injected in NOD-SCID mice. Tissues grew significantly more rapidly in viscoelastic rather than in elastic matrices (Figure 2h and Supplementary Figure3). MDA-MB-231 also grew more rapidly in vitro (Figure 2i and Extended Data Figure 2h,i). Second, MCF10A spheroids encapsulated either in viscoelastic or elastic matrices were injected in NU/J mice. After one week, we observed significant growth and fingering in cells in viscoelastic matrices, while the cells in elastic matrices showed only limited growth (Figure 2j). Additionally, these cells in vivo expressed significantly more vimentin (Figure 2j) and Slug (Figure 2k and Extended Data Figure 2f,g) in viscoelastic matrices. While previous studies have shown that spheroids in elastic matrices are unable to break symmetry and invade25, 26, our results demonstrate that matrix viscoelasticity can promote EMT and tumor growth.
Figure 2. Matrix viscoelasticity promotes epithelial to mesenchymal transition and tumor growth.
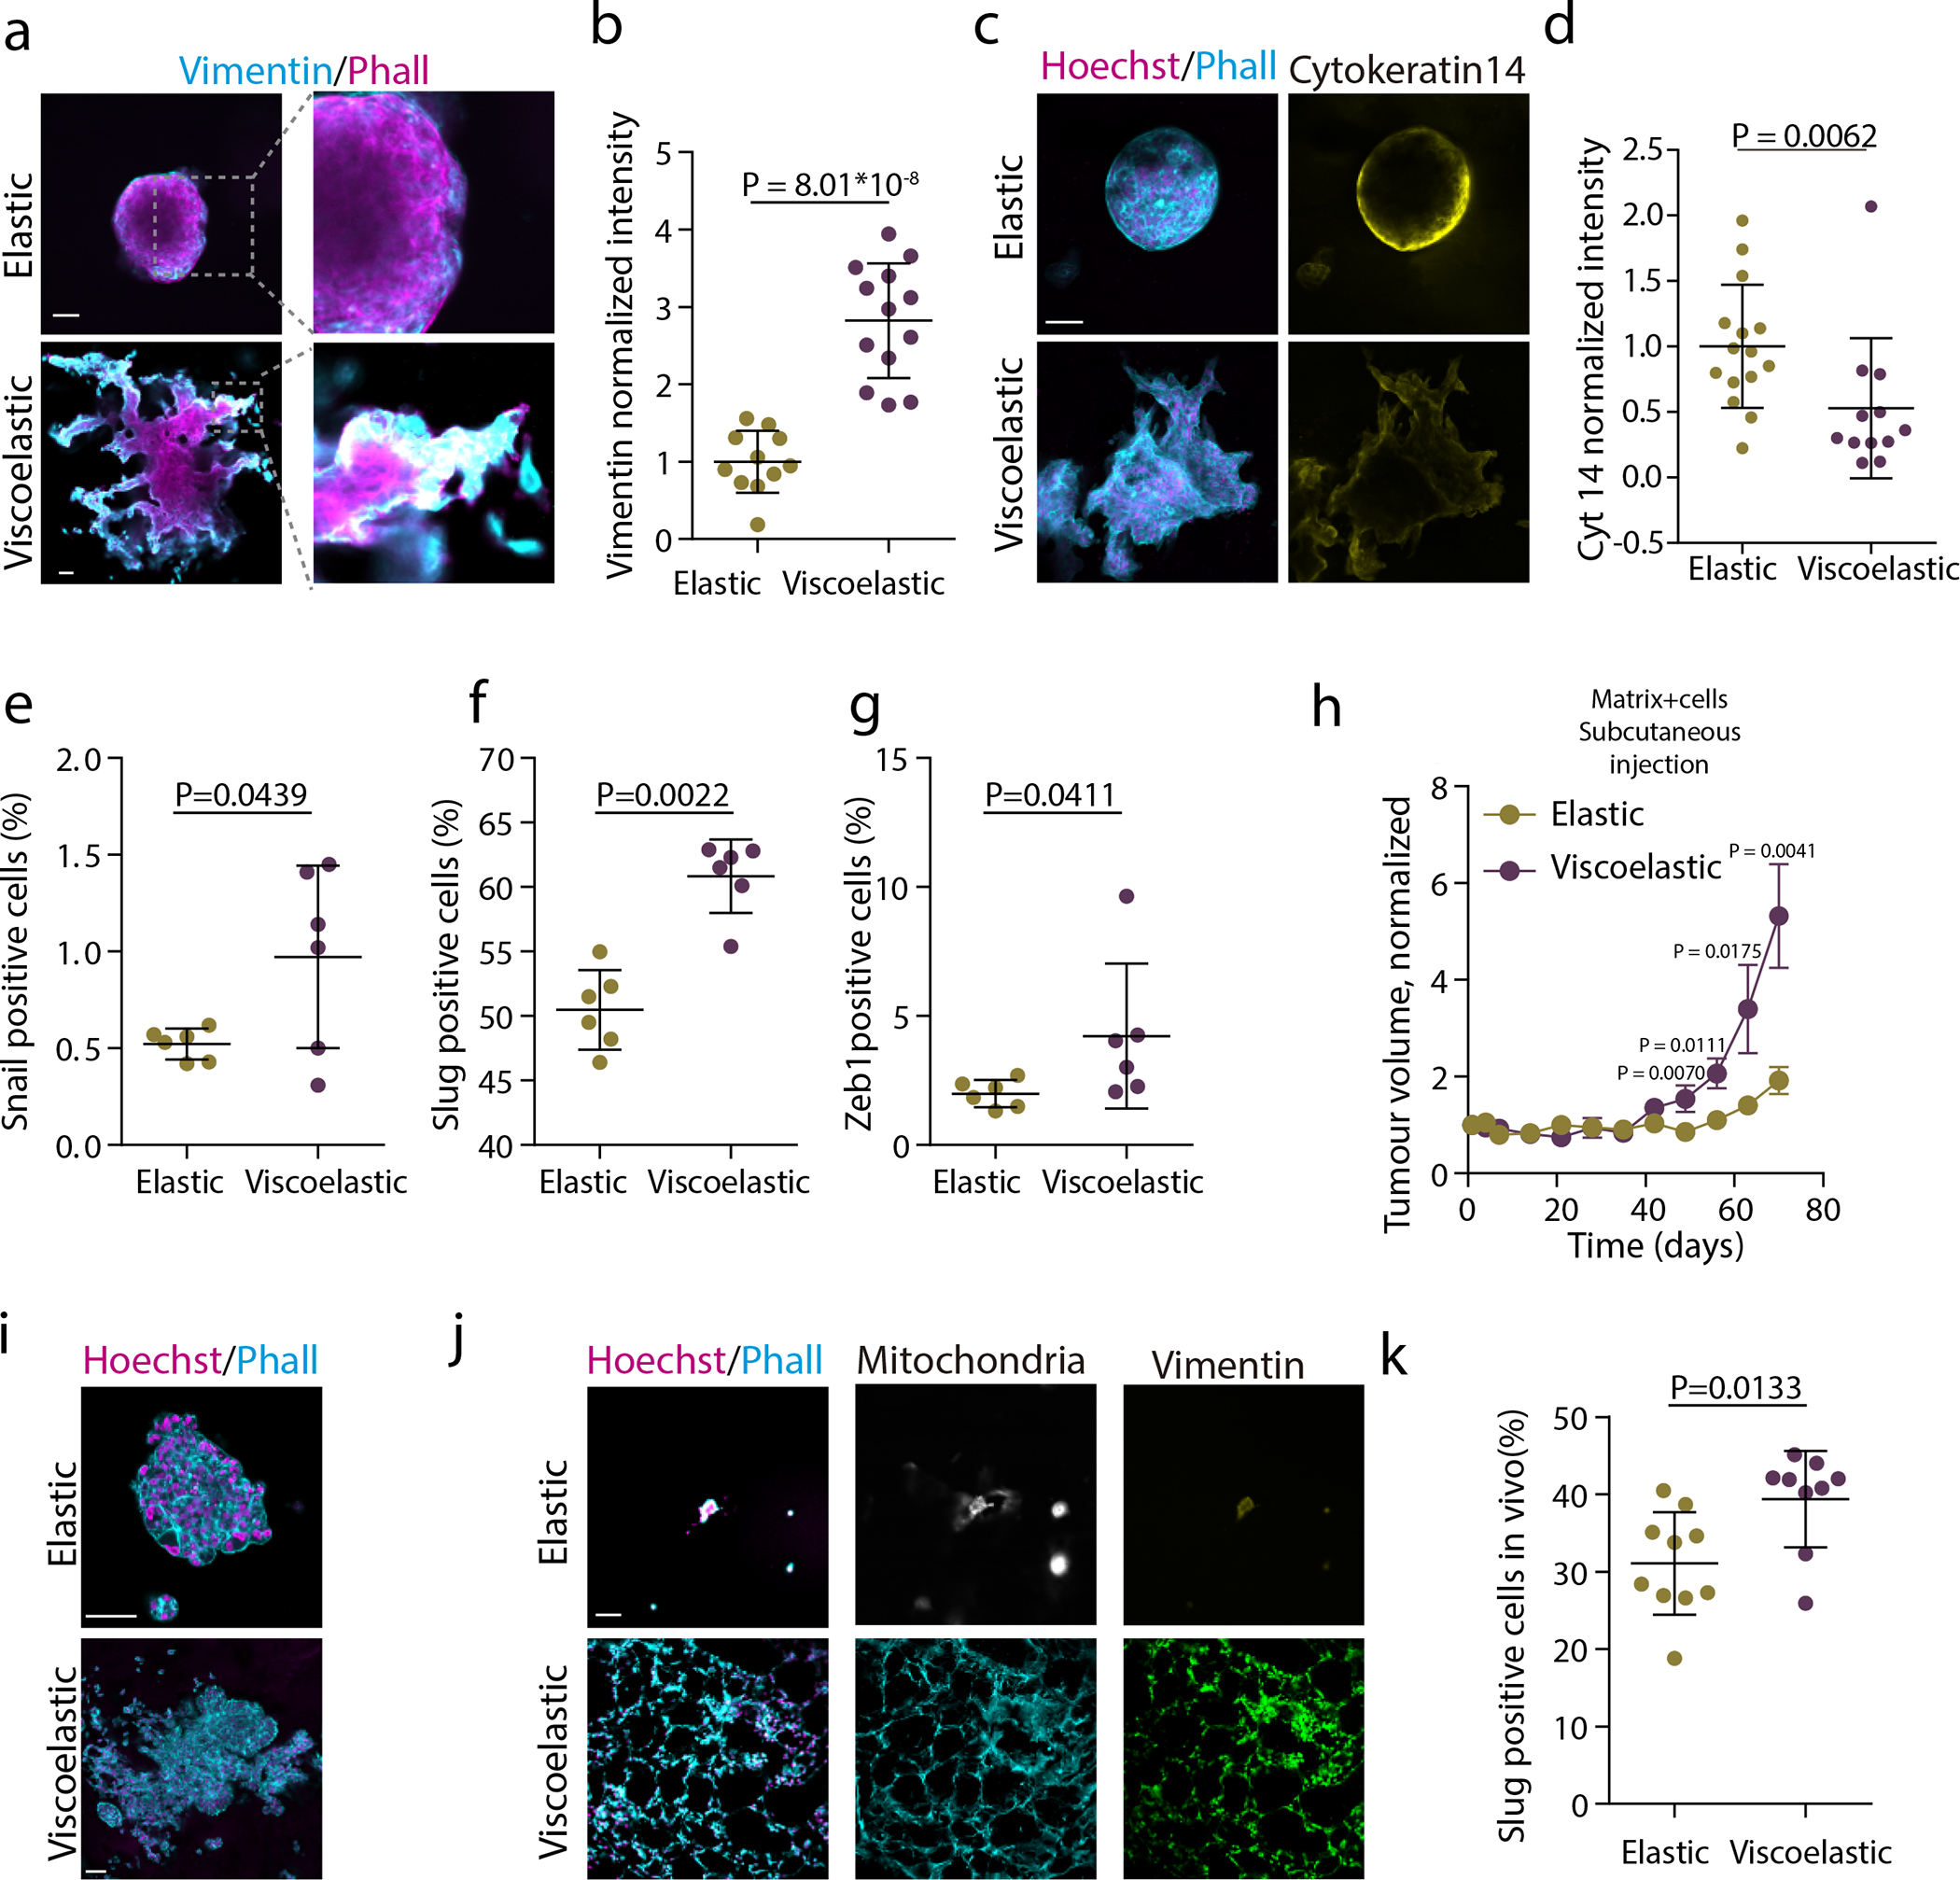
a. Examples of vimentin, phalloidin and hoechst stainings in spheroids growing in viscoelastic gels. Insets shows the high expression of vimentin in the fingering instability arising from the spheroid. b, Quantification of average vimentin intensity in the outer ring of spheroids in elastic hydrogels and in fingers of spheroids in viscoelastic hydrogels. Average intensity of the elastic spheroid is normalized to 1. n=11,13 spheroids per condition. c. Examples of phalloidin, Hoechst (left) and cytokeratin 14 (right) stainings in spheroids in viscoelastic and elastic hydrogels. Phalloidin in cyan, Hoechst in magenta and cytokeratin 14 in yellow. d, Quantification of average cytokeratin 14 intensity of the outer ring of spheroids. Elastic spheroids average intensity is normalized to 1. n=12,15 spheroids per condition. e-g Quantification of percentage of Snail2 (e), Slug (f) or Zeb1(g) positive cells in spheroids in elastic and viscoelastic matrices. n=6,6 gels per condition. h, Quantification of the tumor volume in mice injected in day 0 with viscoelastic and elastic hydrogels containing MDA-MB-231 breast epithelial cells (error bars, s.e.m, n= 7 mice per condition). i, Representative examples of phalloidin and Hoechst stainings of MDA-MB-231 in elastic and viscoelastic hydrogels (n=8,7 images per condition). Phalloidin in cyan, Hoechst in magenta. j, Representative examples of phalloidin, hoechst (left), mitochondria (center), vimentin (right) stainings of MCF10A spheroids in viscoelastic and elastic hydrogels implanted in nude mice, 7 days after implantation (n=5,7 images per condition).k, Quantification of percentage of Slug positive cells in spheroids in elastic and viscoelastic matrices implanted in mice, 7 days after implantation. n=10 gels per condition. Statistical analysis was performed using two-sided Mann-Whitney U-test. All data are mean ± s.d. except where indicated, scale bars are 75 μm.
Our experiments show that more elastic matrices resist tissue invasion, whereas viscoelastic matrices are easily invaded by the motile and proliferating cells. Similarly, our observations show that tissues which are highly proliferative lead to an increase in cell influx and likely generate a mechanical pressure that drives the morphological instability of the tissue-matrix interface. These observations of fingering morphologies in active biological systems have physical analogs that have been studied for decades in simple and complex fluids27, 28. Our experimental observations suggest that the combination of biological activity due to cell migration and/or proliferative pressure at the tissue-matrix interface may lead to a similar symmetry breaking instability exemplified by fingering or branching.
Computational model recapitulates tissue organization
To understand how the conditions for tissue morphological instability emerge, we consider a minimal theoretical model of the system (Figure 3a and Extended Data Figure 3) starting from a two-phase system of active proliferating cells growing inside a confining passive viscoelastic matrix. We model the individual cells in the tissue as overdamped soft elastic spheres of size in a liquid of effective viscosity , which move under the influence of three forces: (i) the interaction between cells, with (a) a short-range repulsion to prevent overlap and (b) mid-range (two cell-length) attraction with the depth in the attractive well (see SI for details) which together lead to an active proliferative pressure driven by cell-division, (ii) the repulsion between the cell and the surrounding viscoelastic matrix (modeled as a set of similar spheres of size in a liquid of effective viscosity interacting with each other via (a) an attractive potential -equivalent to storage modulus - and (b) a short-range repulsion to prevent overlap), and (iii) the activity of cells that are assumed to move randomly relative to each other in the bulk, characterized by a motility parameter (or an effective temperature)29. Additionally, in the model, the cells at the interface are assumed to have the ability to apply forces on the surrounding matrix30. The system evolves as cells proliferate and/or migrate actively and the matrix responds passively to the accompanying forces. In particular, the bonds between the spheres in the matrix as well as those between the cells and the matrix can break when strained beyond a prescribed threshold, allowing new bonds to form; this is most likely to happen at the interface between the tissue and the matrix, and allows the boundary between the two phases to evolve dynamically.
Figure 3: Theoretical model predicts spheroids-material physical interaction regulates tissue geometrical evolution.
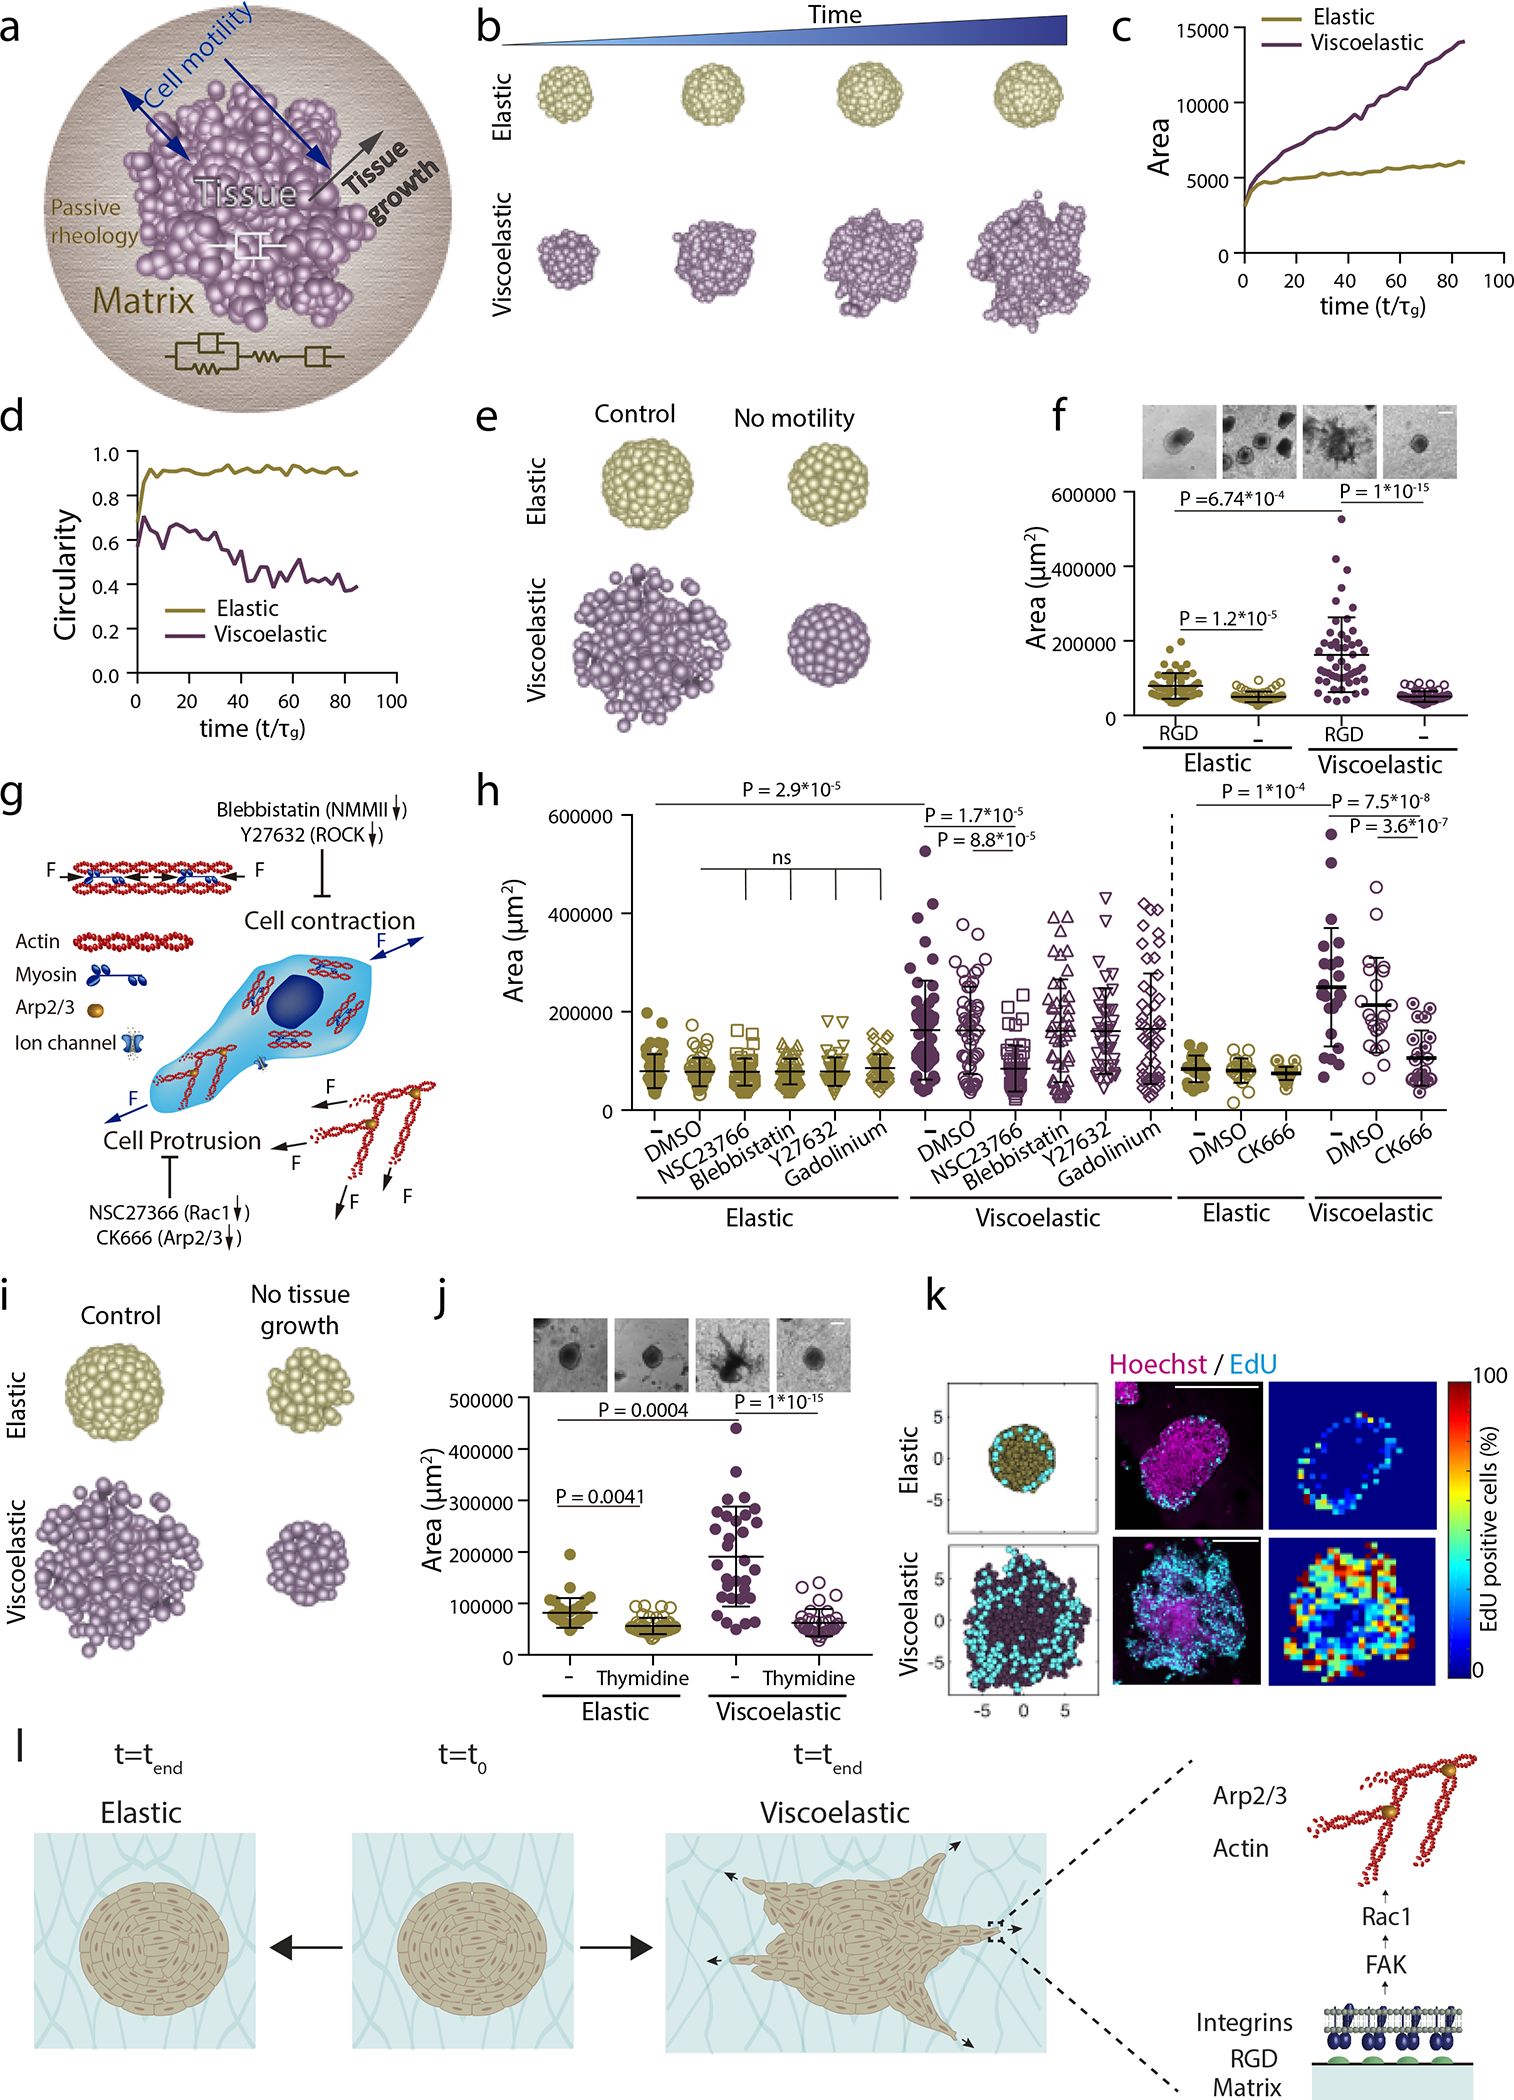
a, Schematic depicting theoretical physical model of tissue growth in passive viscoelastic matrix. The viscosity of the tissue, viscosity of the matrix, and the elasticity of the matrix can be tuned independently. b, Examples of simulated tissue growth in elastic matrices (top row) as versus viscoelastic matrices (lower row). c-d, Quantification from simulations of the projected area and circularity of the spheroids, respectively, over time. e, Model prediction with inhibition of cell motility. f, Representative experimental examples (upper row) and quantification of spheroid’s area (lower row) in hydrogels after 5 days in gels with and without cell adhesive ligand RGD. n=52,52,51,54 spheroids per condition. g, Schematic showing inhibitors used to affect cell motility:1) Blebbistatin and Y27632 affect actomyosin cytoskeleton by affecting non-muscle myosin II and ROCK, respectively; 2) Cell protrusion is affected by NSC23766 and CK666 that affect Rac1 and Arp2/3 complex, respectively; and 3) gadolinium affects ion channels. h, Quantification of spheroid area after 5 days in presence of indicated inhibitors. n=52,50,51,51,51,50,51,50,51,46,41,51,21,21,24,20,21,25 spheroids per condition. i, Model predictions with tissue growth inhibition. j, Representative experimental examples and quantification of spheroid’s area without or with thymidine to inhibit cell proliferation. n=52,53,51,53 spheroids per condition. k, Model predictions and experimental results for the numbers and distributions of proliferating cells across spheroids in elastic (upper row) and viscoelastic gels (lower row): left, model predictions of localization of cell division (cyan) from a section of a spheroid; center, representative examples of experimental spheroids showing EdU positive cells (cyan) and cell nuclei (Hoechst, magenta) for spheroids in elastic and viscoelastic gels; right, colormaps of experimental image (center) showing the local percentage of EdU positive cells across the spheroid. n=3,4 spheroids per condition. l, Altogether, data indicate the ability of growing tissues to break symmetry and exhibit fingering in viscoelastic matrices is dependent on integrin adhesion, FAK phosphorylation, Rac1 activity, and Arp2/3. Inhibiting these elements prevents tissue morphological instability. Statistical analysis performed using Kruskal–Wallis followed by post hoc Dunn’s. All data mean ± s.d., all scale bars 200 μm.
The parameters in the model allow us to define three dimensionless variables to characterize the scaled matrix fluidity, the passive mechanical relaxation time of the matrix and the relative proliferative capacity of the tissue: (i) , the ratio of the tissue viscosity to the matrix viscosity , (ii) the cell flux , the ratio of the constant timescale to add one cell to the tissue in the absence to stress, , and the timescale to add one cell to the confined tissue in the presence of stress, and (iii) the ratio of the cell activity timescale where is the effective motility and is the strength of cell-cell adhesion, and the matrix relaxation timescale, , where is the shear (storage) modulus of the matrix. Each of these dimensionless parameters can be large or small (relative to unity) and plays a role in controlling morphological stability of the growing tissue (See Supplementary Note1).
We start our simulations within this framework with a spherical ball of cells that is loosely packed within a viscoelastic matrix, and then allow the cells to divide and push each other into the matrix, straining it. Depending on the rheology of the matrix, cell division can either cause (i) the matrix to break, flow and be remodeled even as tissue cells form finger-like protrusions, or (ii) the matrix to respond purely elastically by straining, but not breaking, thus preventing the cells from further division and maintaining a spherical boundary with the matrix. Indeed, as we decrease the relaxation time scale making the matrix behave more like a liquid (i.e. making large by decreasing ) we see the appearance of an interfacial morphological instability (Figure 3b–d, Extended Data Figure 3 b–c, Supplementary Figure 4, and Video S2,S4,S5), in accordance with findings of experiments (Figure 1). Additionally, when cell motility was reduced (by changing ), the model predicts that tissues growing in matrices would be unable to grow, break symmetry or form fingers (Figure 3e and Extended Data Figure 4a,b).
To test these predictions, we first carried out experiments using matrices without cell adhesion ligands, as cell adhesion and thus motility would be lost in this condition . Tissues were found to grow slowly, in a morphologically stable manner (Figure 3f, Extended Data Figure 4c and Supplementary Video S3). Next, potential mechanisms driving tissue motility and proliferation at the cellular scale were explored. Contrary to previous studies where the response of single cells to 3D and 2D viscoelasticity was regulated by actomyosin contractility or stretch ion channels31, 32, only the inhibition of Rac1 or, the Rac1 pathway downstream molecule, Arp2/3 by pharmacological inhibitors (NSC23766 and CK666, respectively) inhibited tissue growth (Figure 3h and Extended Data Figure 4d,e), in accordance with our model predictions. Notably, formins inhibition did not affect the tissue response to viscoelasticity (Extended Data Figure 4f,g). Our results show that Arp2/3 complex regulates collective cell response only in viscoelastic matrices, as no effect of CK666 was found in elastic matrices (Figure 3h and Extended Data Figure 4d,e). This finding indicates that cells generate space for division and migration by pushing on the matrix. Consistent with this, when the rate of cell proliferation in the model was inhibited simulations predicted tissue growth and instability would be dramatically diminished (Figure 3i, Extended Data Figure 5a,b and Supplementary Video S6). Experiments confirmed this prediction (Figure 3j and Extended Data Fig. 5c). Further, the model predicts that for cells in an elastic matrix, cell division would be spatially confined to the boundary between the growing tissue and the substrate, but for cells in a viscoelastic matrix, the divisions would be more broadly distributed throughout growing tissues (Fig. 3k and Extended Data Figure 6). Experimental analysis of the spatial distribution of proliferating cells confirmed these predictions as well (Figure 3k and Extended Data Figure 6). Altogether, these results highlight the role of cellular adhesion, FAK, Rac1 and Arp2/3 in allowing for tissue morphological instability in viscoelastic matrices (Figure 3l).
After having considered the role of matrix viscoelasticity and cell proliferation on tissue organization, we now turn to adapt our computational model to include the experimentally known role that links an increase in matrix stiffness with an increase in cell motility33. We assume a minimal model, via the relation (Figure 4a). Simulations with this assumption predicted that tissue morphological instability would be enhanced with an increase in the modulus of the matrix in viscoelastic matrices (making large), but no significant impact in more elastic matrices (Figure 4b–d, Supplementary Figure 4 and Video S5). To validate these simulations experimentally, the previously developed matrices were modified to change their modulus and independently controlling the relaxation time (by changing the molecular weight of alginate) to make the matrix more or less viscoelastic (Figure 4e and Supplementary Figure 6 and 7a and Supplementary Table 1). In low viscosity matrices, i.e., large , the increase in the modulus resulted in greater tissue growth and fingering, as predicted (Figure 4f,g and Extended Data Fig6b,c). Taking into account these results, we can rationalize previous apparently contradictory findings that tissues maintained a stable morphology when encapsulated in synthetic materials25 of increasing stiffness, while becoming unstable in natural matrices as stiffness was raised1 (e.g. Matrigel, collagen, fibrin). From our perspective, the explanation is due to the elastic nature of the synthetics that are covalently crosslinked, in contrast to the intrinsic viscoelasticity of physically cross-linked natural matrices.
Figure 4. Stiffness intersects with matrix viscoelasticity to regulate growth and branching.
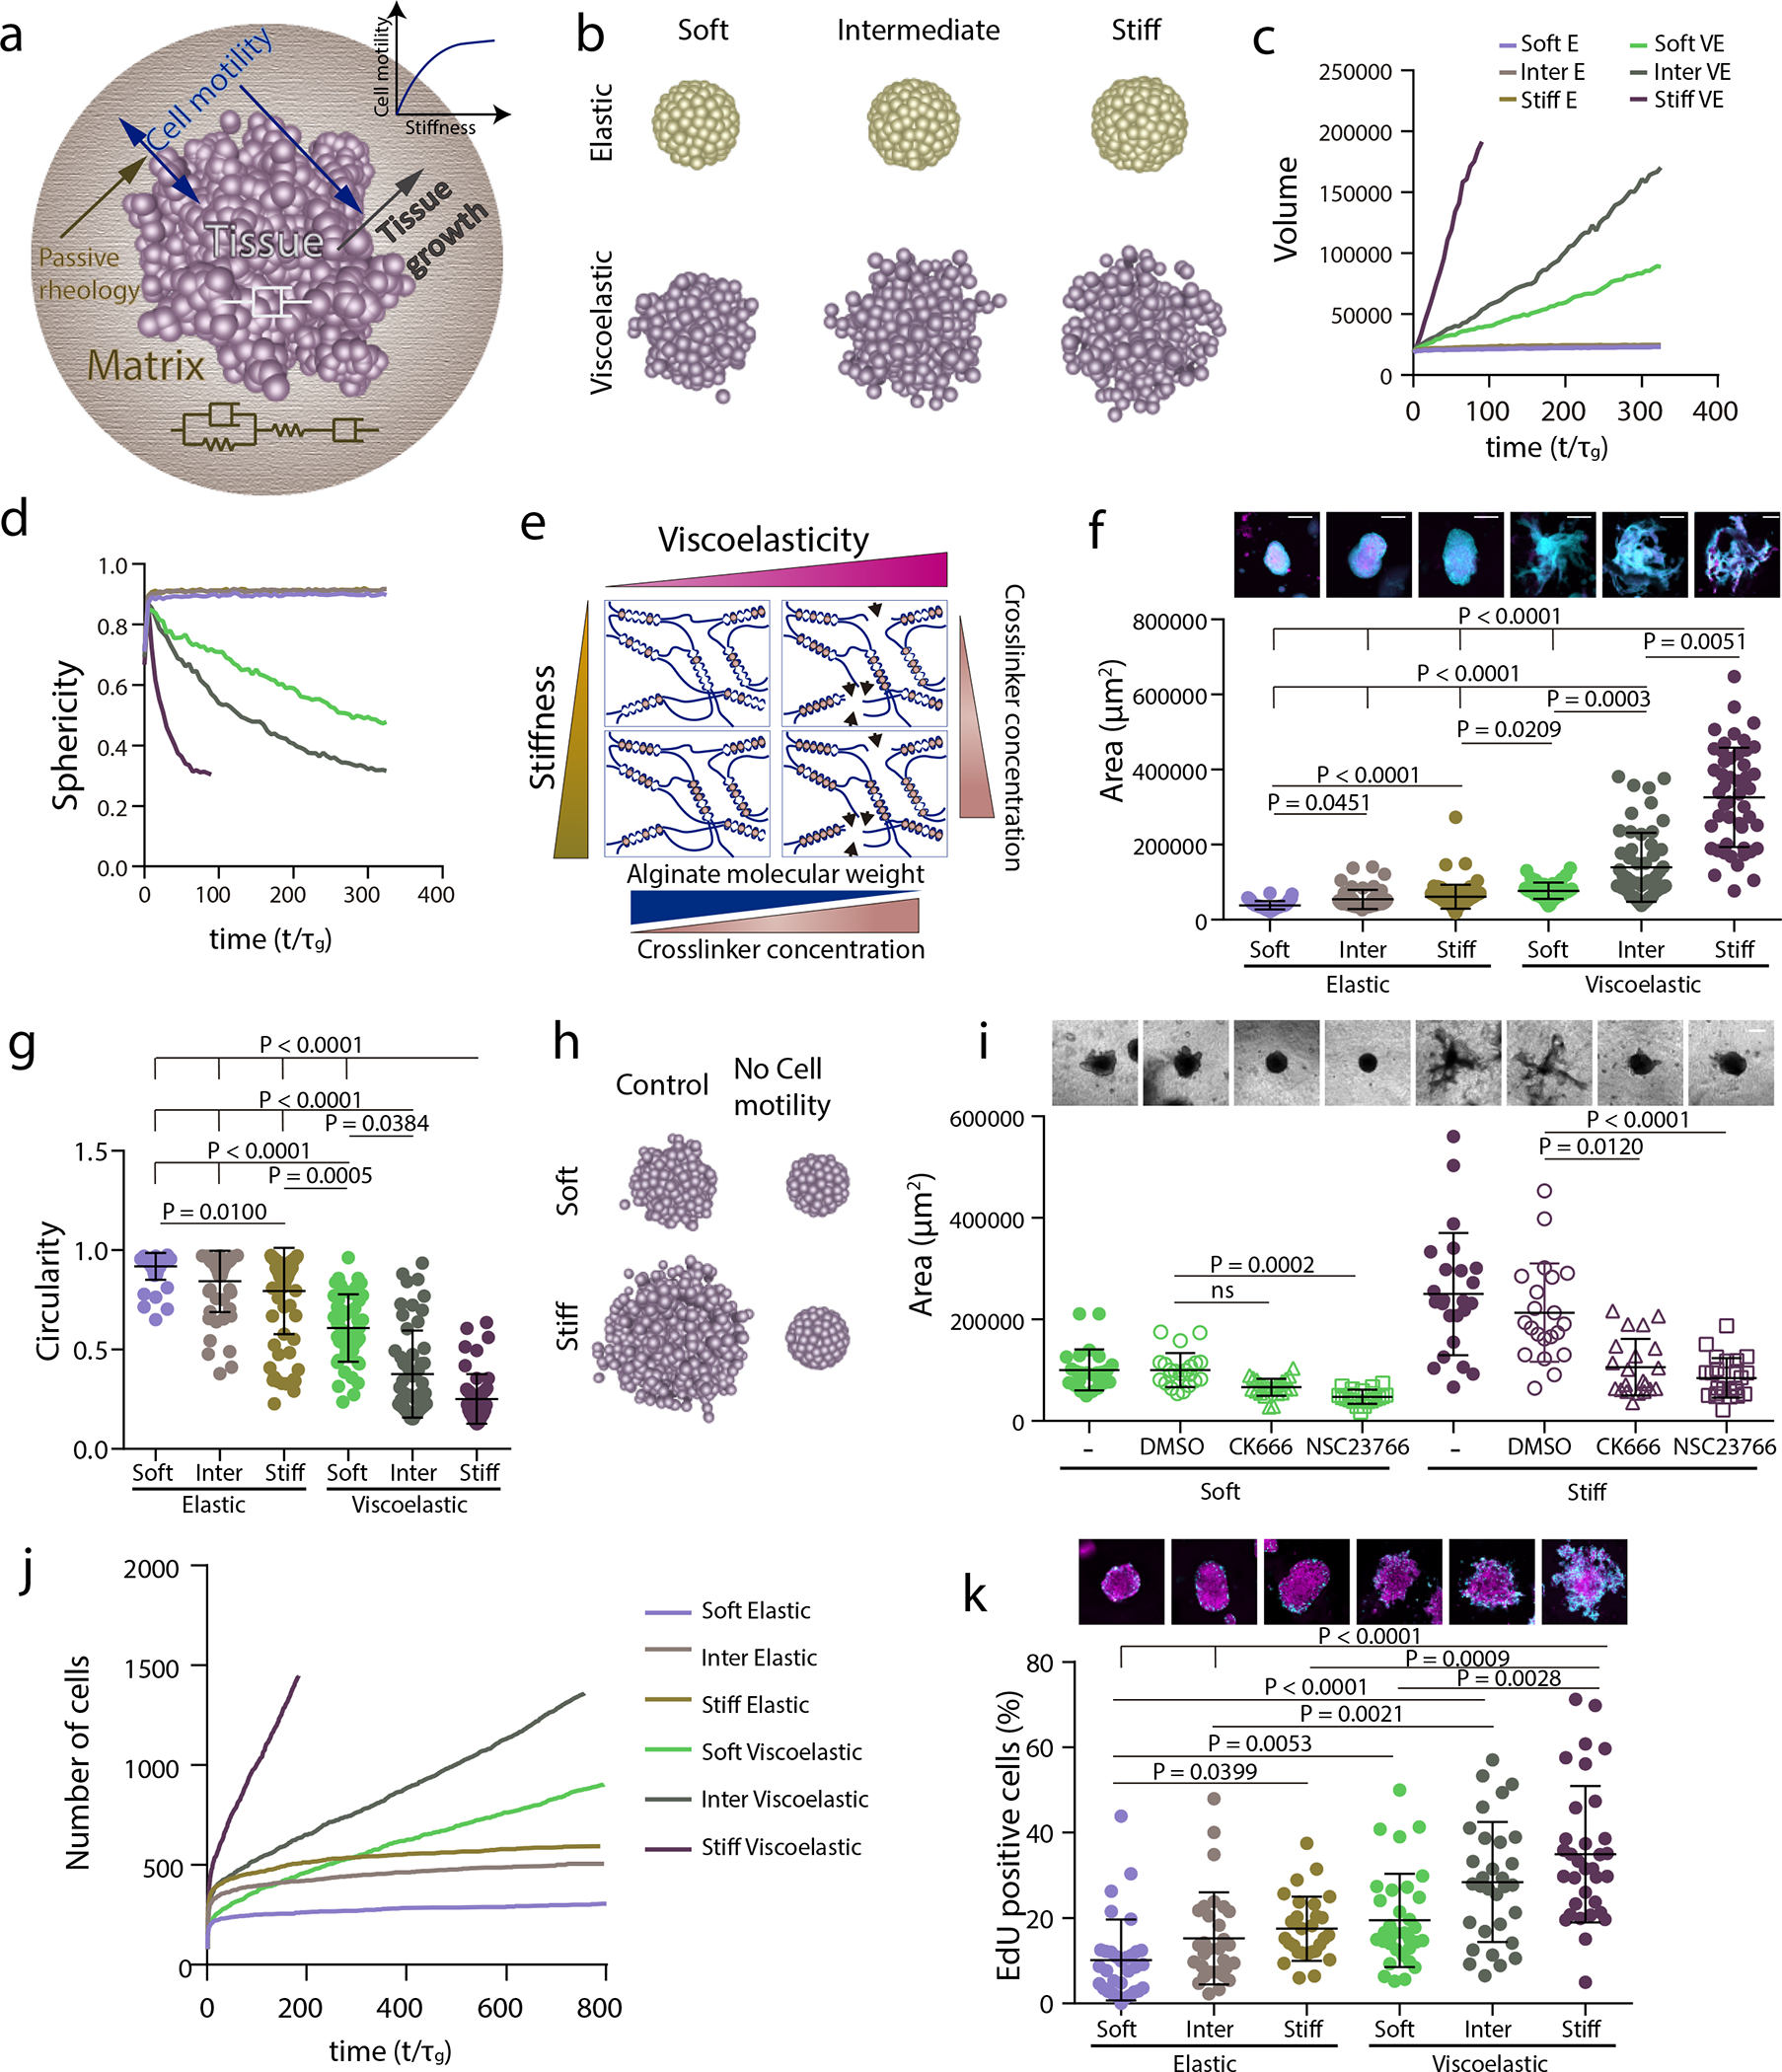
a, To incorporate the matrix stiffness dependence on the tissue property, now the active motility of the tissue is an increasing function of the matrix stiffness. Which makes the active motility a dependent parameter and in turn it also affects the tissue growth. b-d, 3D final timepoint simulation images (b), projected area (c) and circularity (d) evolution over time of spheroids in increasingly stiff elastic and viscoelastic gels. e, Stiffness of experimental matrices was modified by further altering the extent of crosslinking in both elastic and viscoelastic gels. f, Representative experimental examples (upper row) and quantification of spheroid area (lower row) after 5 days in elastic and viscoelastic matrices of increasing stiffness. n=63,55,84,50,55,50 spheroids per condition. Statistical analysis was performed using Kruskal– Wallis test followed by post hoc Dunn’s test. g, Quantification of spheroid circularity after 5 days in elastic and viscoelastic matrices of increasing stiffness. n=63,55,84,50,55,50 spheroids per condition. Statistical analysis was performed using Kruskal–Wallis test followed by post hoc Dunn’s test. h, Representative model simulation results when cell motility is eliminated in stiff viscoelastic matrices compared to soft viscoelastic matrices. i, Representative experimental examples (upper row) and quantification of spheroid’s area (lower row) after 5 days in soft and stiff viscoelastic matrices with Rac1 (NSC23766) and Arp2/3 (CK666) inhibitors. n=25,22,27,21,24,21,21,24 spheroids per condition. Statistical analysis was performed using Kruskal–Wallis test followed by post hoc Dunn’s test. j, Model predictions for cell proliferation in spheroids of increasing stiffness for both elastic and viscoelastic gels. k, Representative experimental examples (upper row) and quantification of the percentage of EdU positive cells in a spheroid (lower row) after 5 days in elastic and viscoelastic gels of increasing stiffness. n=32,30,28,33,31,33 spheroids per condition. Statistical analysis was performed using Kruskal–Wallis test followed by post hoc Dunn’s test. All data are mean ± s.d., all scale bars are 200 μm.
To further determine if these differential responses were again mediated by cell motility and proliferation, in silico predictions were compared to in vitro studies performed under similar conditions. As predicted by the model, inhibition of cell motility by inhibition of Rac1 and Arp2/3 complex led to a greater impact on tissue growth in stiff matrices, i.e. large rather than soft viscoelastic matrices, i.e. small (Figure 4h,i, Supplementary Figure 8 and Video S6). Both simulations and experiments revealed that cell division increased with stiffness both in elastic and viscoelastic matrices although significantly more in viscoelastic matrices (Figure 4j,k and Supplementary Figure 4a). The significant increase in cell flux with modulus in the viscoelastic matrices is large) emerges from the increase in motility 33. When cell proliferation is inhibited, the simulations show that tissues do not grow (Supplementary Figure 9 and Video S7).
Having studied the emergence of an active scaled cell flux from motility (with ), we turn to passively inject a cell flux to the tissue (making ) to examine the role of passive tissue pressure, known to regulate tissue growth12,41, on morphological stability. We developed a microfluidic system where cells were injected at a constant rate into the tissue, displacing the matrix (Extended Data Fig.7). We find that tissues break symmetry and finger out into elastic matrices but are unable to break symmetry when the matrix is viscoelastic, consistent with our simulations that show a similar response (Extended Data Figure 7,8c, Supplementary Figure 10 and Supplementary Video S8). The morphological instability occurring in this cell flux driven situation is similar to the Saffman-Taylor instability27. Altogether, our simulations and experiments show that the tissue-matrix interface becomes morphologically unstable when the matrix is viscoelastic and can easily relax in response to stresses, or when the tissue proliferative pressure is high in more elastic matrices (Supplementary Table 3). We summarize these results in a morphological phase diagram that quantifies the stability of the growing front shown in Figure 5 and Extended Data Fig.8.
Figure 5. Phase diagram predicts tissue morphological stability.
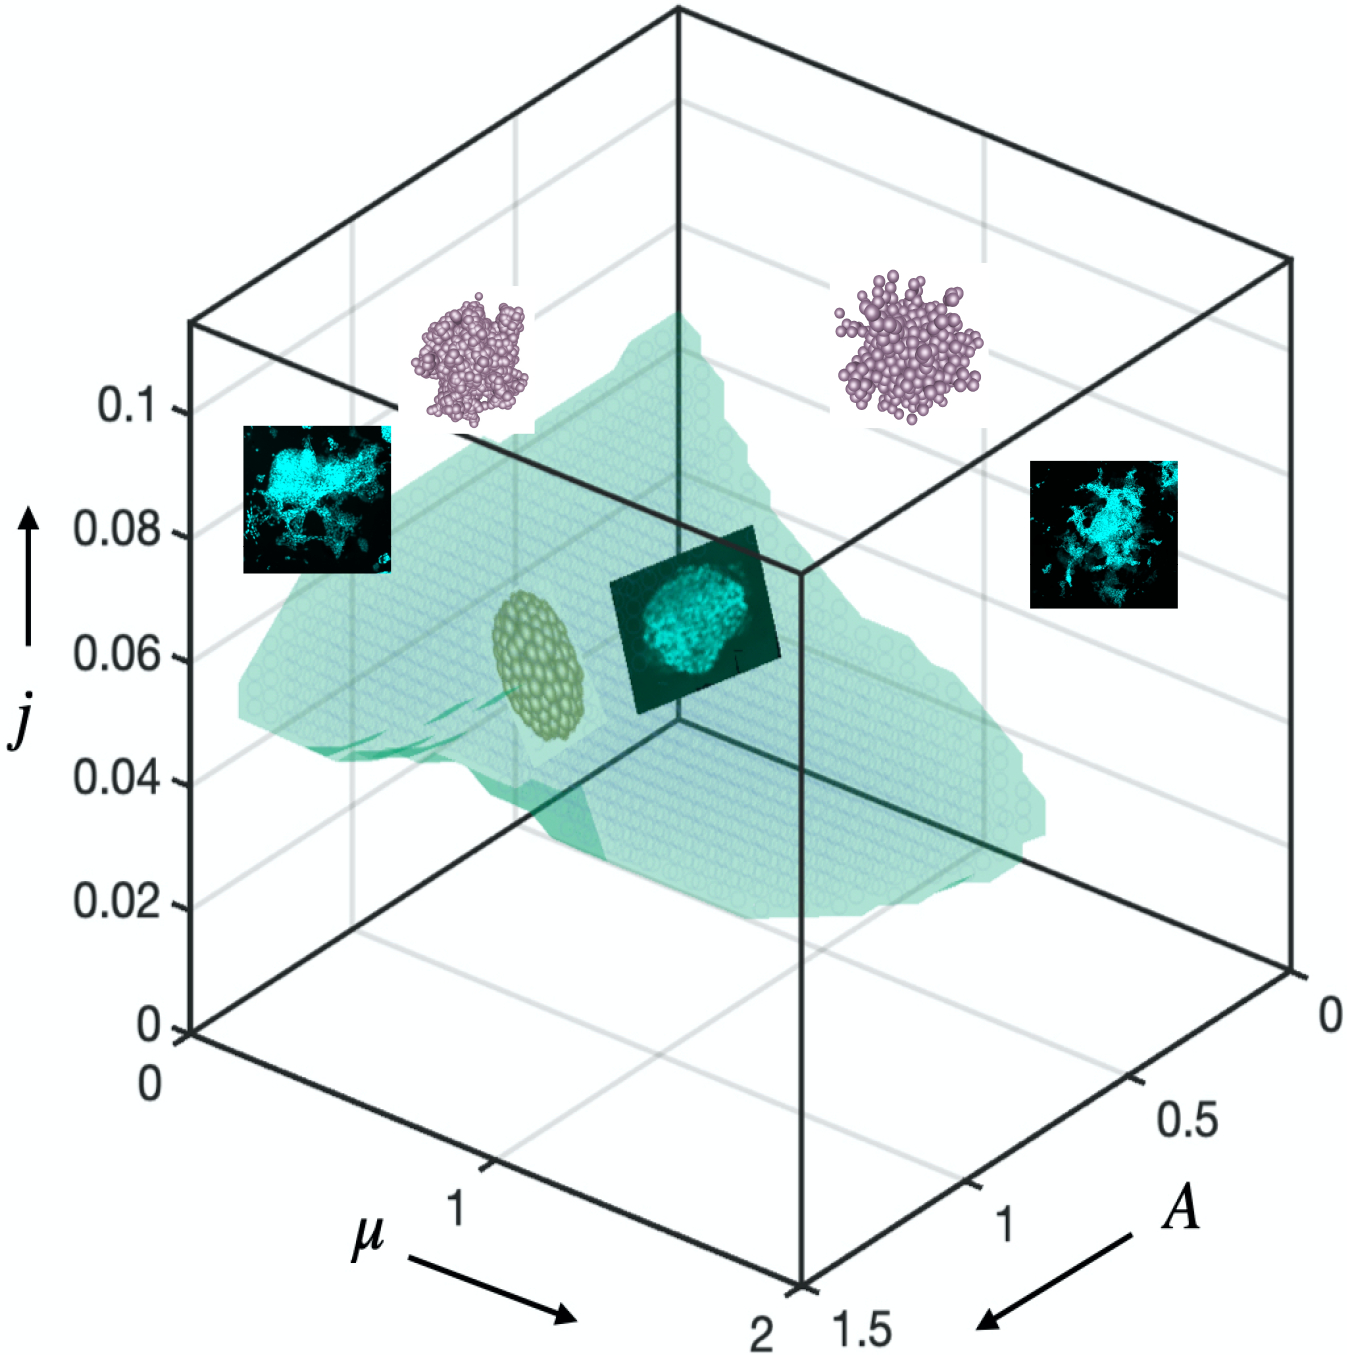
Phase diagram. Simulations predict, and experiments confirm that regions of tissue growth stability and instability can be predicted based on the values of three dimensionless variables. When the scaled proliferation pressure , the tissue grows as a stable spheroid (Fig. 3i,j; Extended Data Fig. 8b; Supplementary Fig. 8,9). Additionally, when the scaled matrix relaxation time , the tissue remains spheroidal and is morphologically stable as long as the scaled proliferation pressure (top panel of Fig.1d, Fig 3b and Fig 4b). When the scaled matrix relaxation time : if the scaled proliferation pressure , the tissue grows as a stable spheroid (bottom right of Fig. 3i and bottom panel of Supplementary Fig. 8b); if the scaled proliferation pressure , the growth is unstable and the tissue breaks symmetry and develops branches (bottom panel of Fig.1d, Fig. 3b and 4b); if the scaled proliferation pressure , the morphological stability of the tissue depends on (see Extended Data Fig7d,e and 8c); for , the tissue remains spheroidal (Extended Data Fig.7d,e, 8c); for , growth is unstable and the tissue breaks symmetry and develops branches (Extended Data Fig.7d,e, 8c). We have shown representative images from the experiments and the simulations in different regimes of the Phase diagram; one set of images from stable tissues in the blue region ; top left is first set of unstable images from a specific point ; and top right is second set of images of another unstable point . The specific locations in the phase diagram from which the representative images are provided are highlighted with stars. Scale bars are 200 μm. p<0.05 *; p<0.01 **; p<0.001 ***.
ECM viscoelasticity drives intestinal organoid morphogenesis
To explore the generality of the findings in the phase diagram, we explored the impact of matrix viscoelasticity in the growth of self-organizing intestinal organoids. When Lgr5+ stem cells are placed in Matrigel, they develop into complex three-dimensional structures that mimic intestinal tissue organization2 To allow for a comparison with the published literature, we modified our alginate matrix system to enable incorporation of Matrigel (Figure 6a and Extended Data Figure 9 and Supplementary Fig 11), while still allowing independent control over gel stiffness and viscoelasticity34. As shown previously34, the alginate-matrigel matrices formed homogeneous interpenetrating networks (Supplementary Figure 12). The interpenetrating networks of three different stiffness ( allowed for both elastic and viscoelastic matrices (Fig. 6b and Supplementary Table 3). As previously described35, organoids, composed of a few cells or single cells, growing in elastic matrices exhibited slow expansion and were morphologically stable. In contrast, intestinal organoids grew rapidly, broke symmetry and formed fingers when within viscoelastic matrices (Figure 6c–e and Extended Data Figure 9 and Supplementary Figure 13). The slow organoid development found in elastic gels is consistent with past studies utilizing purely elastic PEG materials. Organoid growth in the PEG elastic materials required fast matrix degradation, which will alter a number of matrix features, including porosity and mechanical properties, while we demonstrate that matrix viscoelasticity regulates this process. Apart from demonstrating tissue morphological instability, intestinal organoids in viscoelastic substrates exhibited cell patterning and differentiation representative of intestinal development (Figure 6f,g and Extended Data Figure 10c–f). Matrix viscoelasticity favored the generation of high curvature tissue regions that concentrated Lgr5+ stem cells (Extended Data Figure 10a,b), consistent with past reports on the impact of curvature11. No significant differences in organoid morphology or patterning in viscoelastic substrates were noted when internal pressure generated inside organoids was pharmacologically altered (Supplementary Figure 14). To further test the ability of viscoelasticity to control organ growth, organoid development was monitored in matrices of varying stiffness. The percentage of Lgr5+ organoids and number of colonies were higher in viscoelastic matrices rather than elastic matrices, independent of (Figure 6h–,i and Supplementary Figure 15). Increasing of viscoelastic matrices again led to greater growth of intestinal organoids, symmetry breaking and finger formation, but organoids grew more slowly and maintained their spherical symmetry in elastic matrices (Figure 6j–l). Overall, our simulations of organoid growth in six different matrix conditions are consistent with our experimental observations (Supplementary Figure 16). Similarly to mammary epithelial spheroids, when the Arp2/3 complex, FAK or cell proliferation was inhibited, organoid symmetry breaking and budding were impaired (Supplementary Figure 17b,c,18). However, YAP was mainly in the cytoplasm in cells in buds in control organoids in viscoelastic matrices (Supplementary Figure 17a). Simulations in which cell mobility or cell proliferation was inhibited similarly predicted a loss of organoid growth and symmetry breaking (Supplementary Figures 19,20). In the model, we also found that the location of symmetry breaking is directly correlated to the location of the cells with relatively higher proliferation or motility (Supplementary Figures 21,22,23). Overall, these results validate the theoretical model and the generality of the role of matrix viscoelasticity in tissue spatio-temporal organization.
Figure 6: Matrix viscoelasticity controls intestinal organoid growth, symmetry breaking, budding and cell patterning.
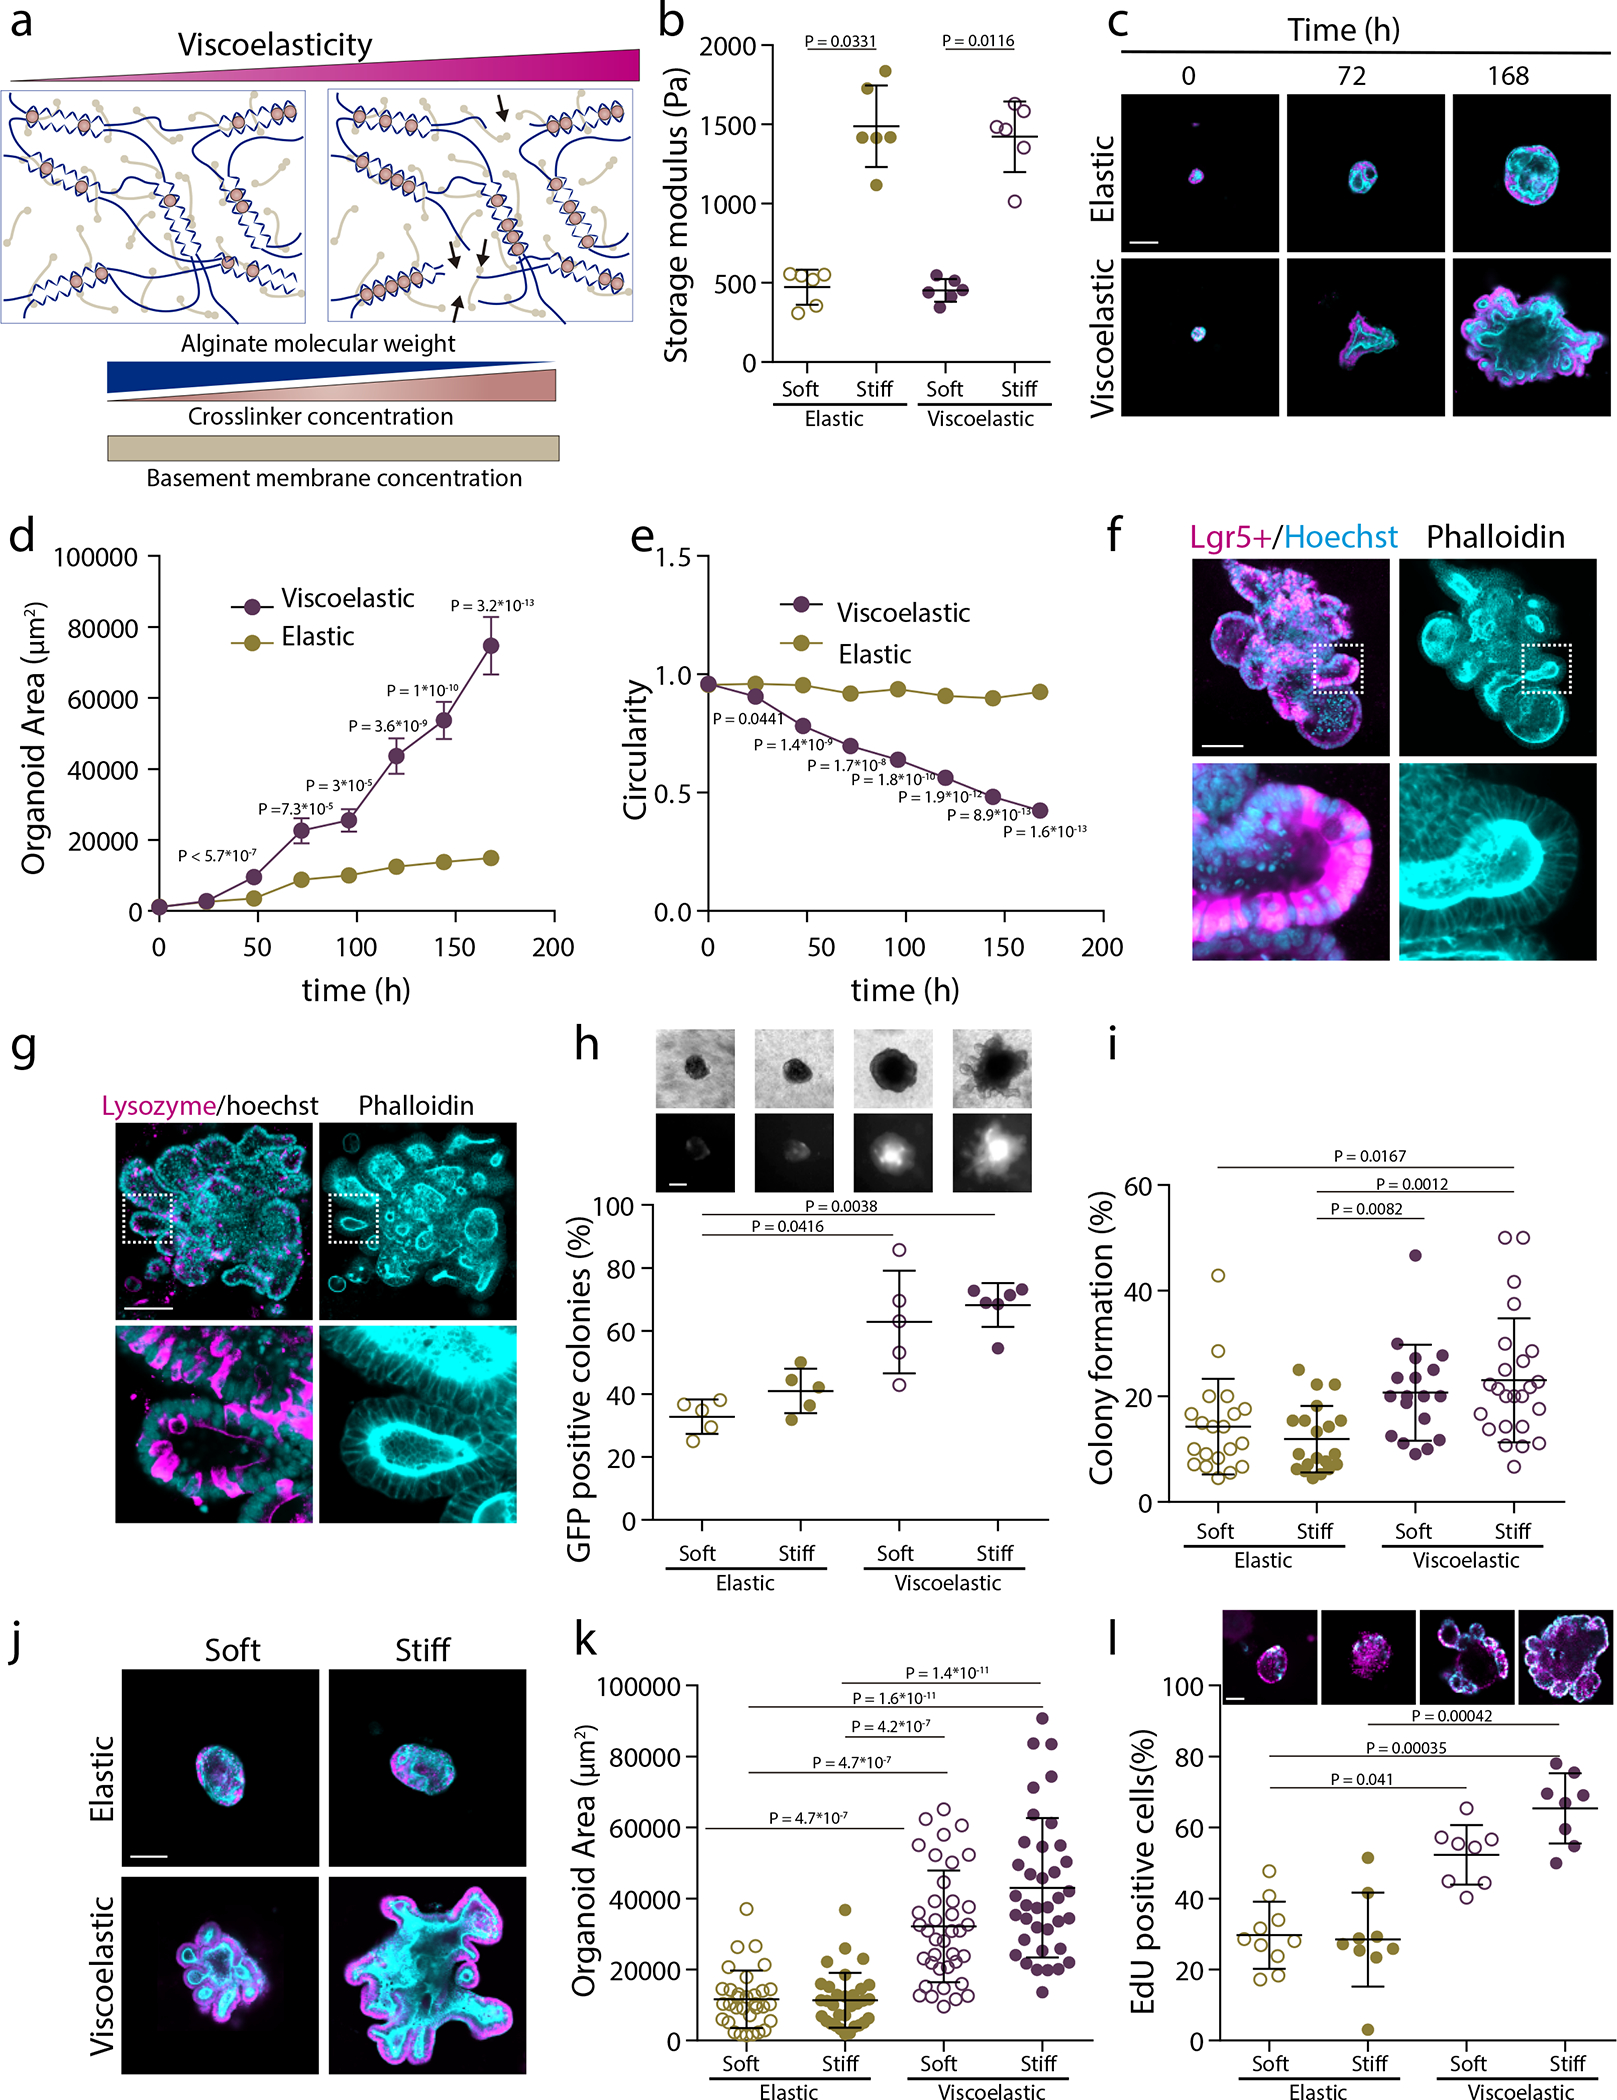
a, Schematic depicting of interpenetrating networks (IPNs) of alginate and Matrigel used in organoid studies. Viscoelasticity is controlled by polymer molecular weight and crosslinker concentration, while the concentration of Matrigel is maintained constant. b, Storage moduli of the elastic and viscoelastic alginate-matrigel IPNs. n=6 gels per condition. Statistical analysis was performed using two-sided Mann-Whitney U-test. c, Representative examples of phalloidin and hoechst stainings of intestinal organoids in elastic and viscoelastic hydrogels over 7 days of culture. Phalloidin in cyan, Hoechst in magenta. d-e, Quantification of the organoids area (d) and circularity (e), respectively, over 7 days in elastic and viscoelastic matrices (error bars, s.e.m). n= 24/26,2/24,27/22,31/21,19/23,22/29,21/26 organoids in Elastic/Viscoelastic gels per day. f, Example of Lgr5+, phalloidin and hoechst staining of intestinal organoids in a stiff viscoelastic gel after 7 days. Left, Lgr5+ (magenta) and hoechst (cyan); right, phalloidin (cyan). g, Example of Lysozyme, phalloidin and hoechst staining of intestinal organoids in a stiff viscoelastic gel after 7 days. n=9 images per condition. Left, lysozyme (magenta) and hoechst (cyan); right, phalloidin (cyan). h, Representative examples of phase contrast and Lgr5+ GFP images (upper row) and quantification of GFP positive Lgr5+ intestinal organoids in the viscoelastic and elastic matrices of different stiffness. n=5,5,5,6 samples per condition. i, Quantification of the percentage of colony formation per condition. n=20,20,18,24 images per condition. j, Examples of phalloidin and Hoechst stainings of intestinal organoids in different stiffness elastic and viscoelastic matrices after 7 days. k, Quantification of the organoids area in different stiffness elastic and viscoelastic matrices. n=32,32,38,37 organoids per condition. m, Example of EdU (cyan) and Hoechst (nuclei) (upper row) and the percentage of EdU positive cells (lower row) of intestinal organoids in different stiffness elastic and viscoelastic matrices. n=10,9,8,8 organoids per condition. Statistical analysis was performed using Kruskal–Wallis test followed by post hoc Dunn’s test except where indicated. All data are mean ± s.d. except where indicated, all scale bars are 100 μm.
Outlook
Our experiments and simulations demonstrate the passive properties of viscoelastic extracellular matrices as regulators of spatio-temporal tissue organization. The resulting morphology is reminiscent of interfacial instabilities in passively driven physical systems but modified fundamentally in living systems by the active processes of cell motility and proliferation that can destabilize the interface and are relevant to a number of processes including embryogenesis9, 36, oncogenesis1, 37, branching morphogenesis4, and angiogenesis38.
More broadly, our results are consistent with observations that the increase in ECM fluidity of mesenchyme drives normal embryonic airway branching39, and an increase in tissue fluidity drives wound healing40, tissue elongation41 or neural crest development42. Furthermore, invasive fingers are characterized by either an increase in matrix fluidity, as observed in glioblastoma43, breast44 and liver cancer45 (compared to benign lesions and healthy ECM), or an increase in tissue fluidity, as tumor single cells are less viscous46 and tumor tissues acquire more liquid-like properties47–49 (e.g. EMT, unjamming). The increased expression of low molecular weight hyaluronic acid in malignant tumors50 can explain the decrease in tumor ECM viscosity. Our results also suggest that when tumors migrate and grow and push the stroma, this may lead to the passive generation of stroma fingers in the healthy tissue, as the stroma has more liquid-like properties than healthy tissue43–45. Furthermore, our studies highlight the synergistic, but different, effect of viscoelasticity and stiffness in tissue spatio-temporal organization. Tissue growth and instability were observed in all of the viscoelastic gels used in these studies, with the stiffness of these gels impacting the extent of these behaviors. In purely elastic gels, however, altering the stiffness had minimal impact as tissue growth remained slow and stable. Finally, in addition to providing a framework to understand tissue morphology and organization in normal and pathological states, our study yields a phase diagram that might provide a strategy to guide tissue morphology in regenerative medicine.
Extended Data
Extended Data Figure1.
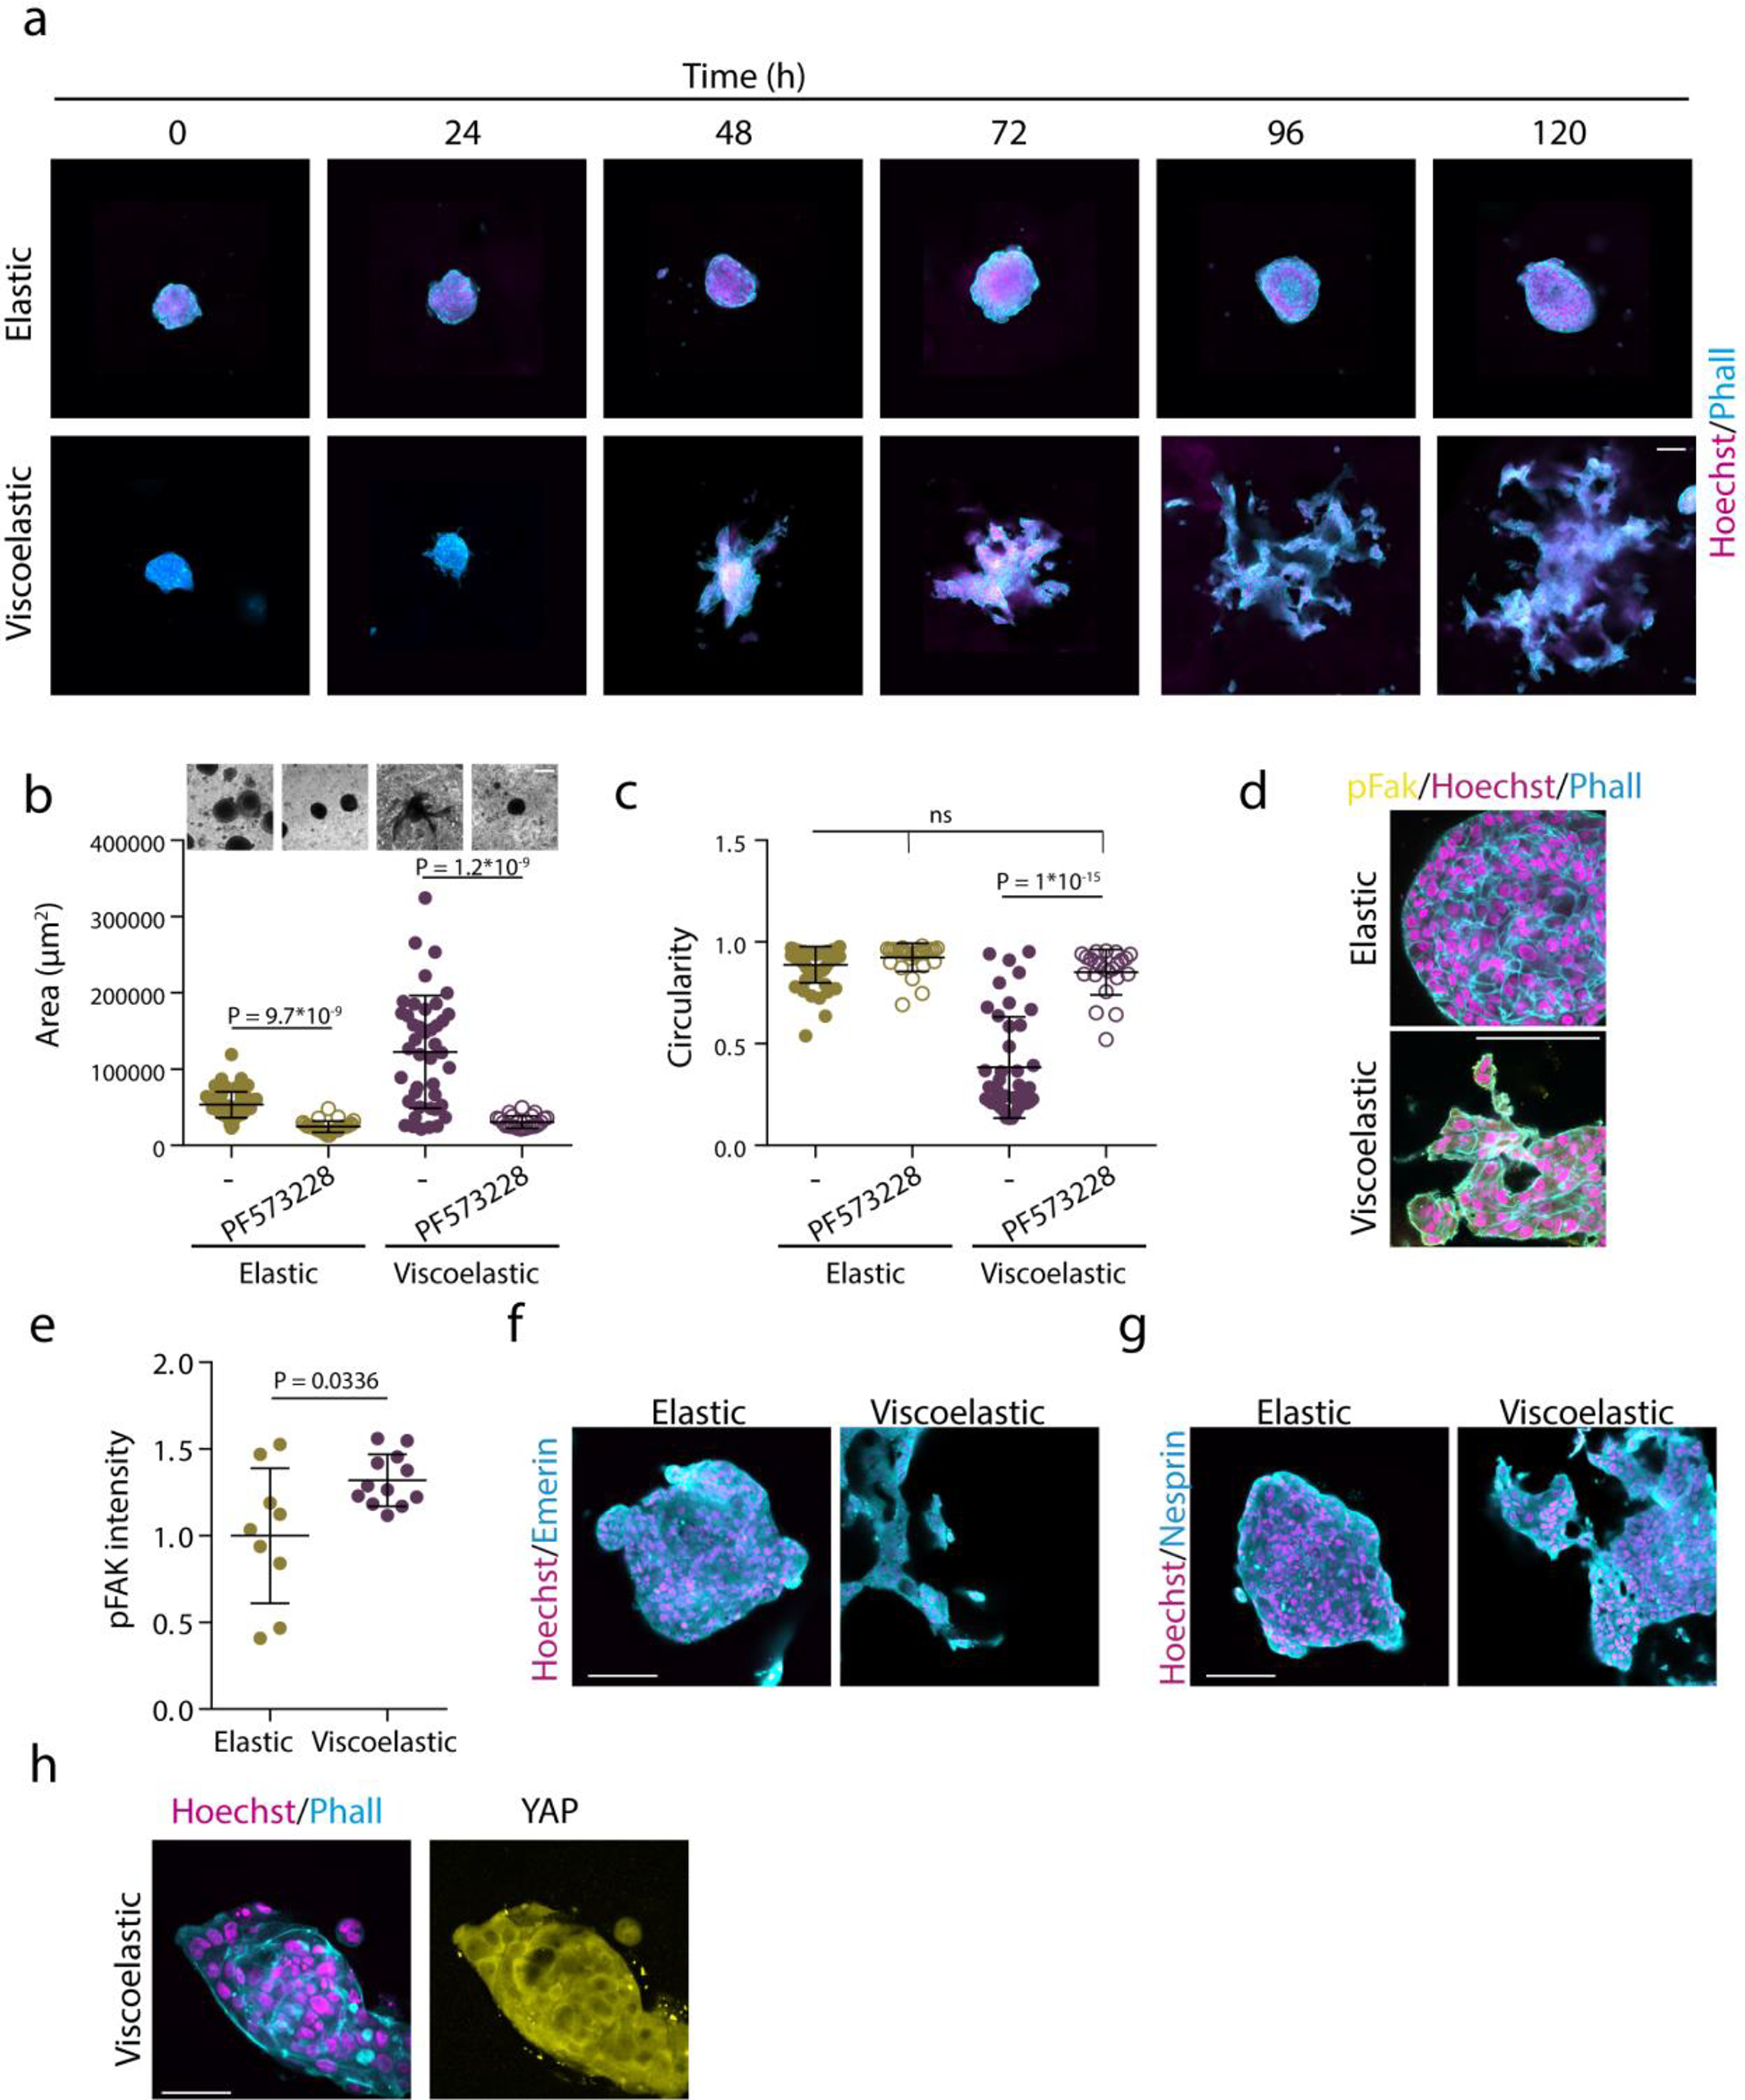
Matrix Viscoelasticity regulates tissue growth and geometry. Examples of growth of MCF10A spheroids in elastic versus viscoelastic hydrogels over 5 days. Phalloidin in cyan, Hoechst in magenta. b-c, Quantification of spheroids area (b) and circularity (c) after 5 days without or with focal adhesion kinase (FAK) inhibitor PF 573228. n=56,27,41,23 spheroids per condition. Statistical analysis was performed using Kruskal–Wallis test followed by post hoc Dunn’s test. d-e, Representative examples (d) and quantification of pFAK (e) in spheroids in elastic and viscoelastic matrices. n=9,12 images per condition. Statistical analysis was performed using two-sided Mann-Whitney U-test. f-g, Representative examples of emerin and nesprin staining in elastic and viscoelastic matrices. n=15,9 (f) and n=14,14 images per condition. No significant differences were observed between cells in elastic and viscoelastic matrices. h, Representative examples of phalloidin, Hoechst (left) and YAP (right) stainings of spheroids with thymidine treatment of cells in viscoelastic gels. n=5,5 images per condition. All data represent mean ± s.d.; all scale bars represent 100 μm.
Extended Data Figure 2.
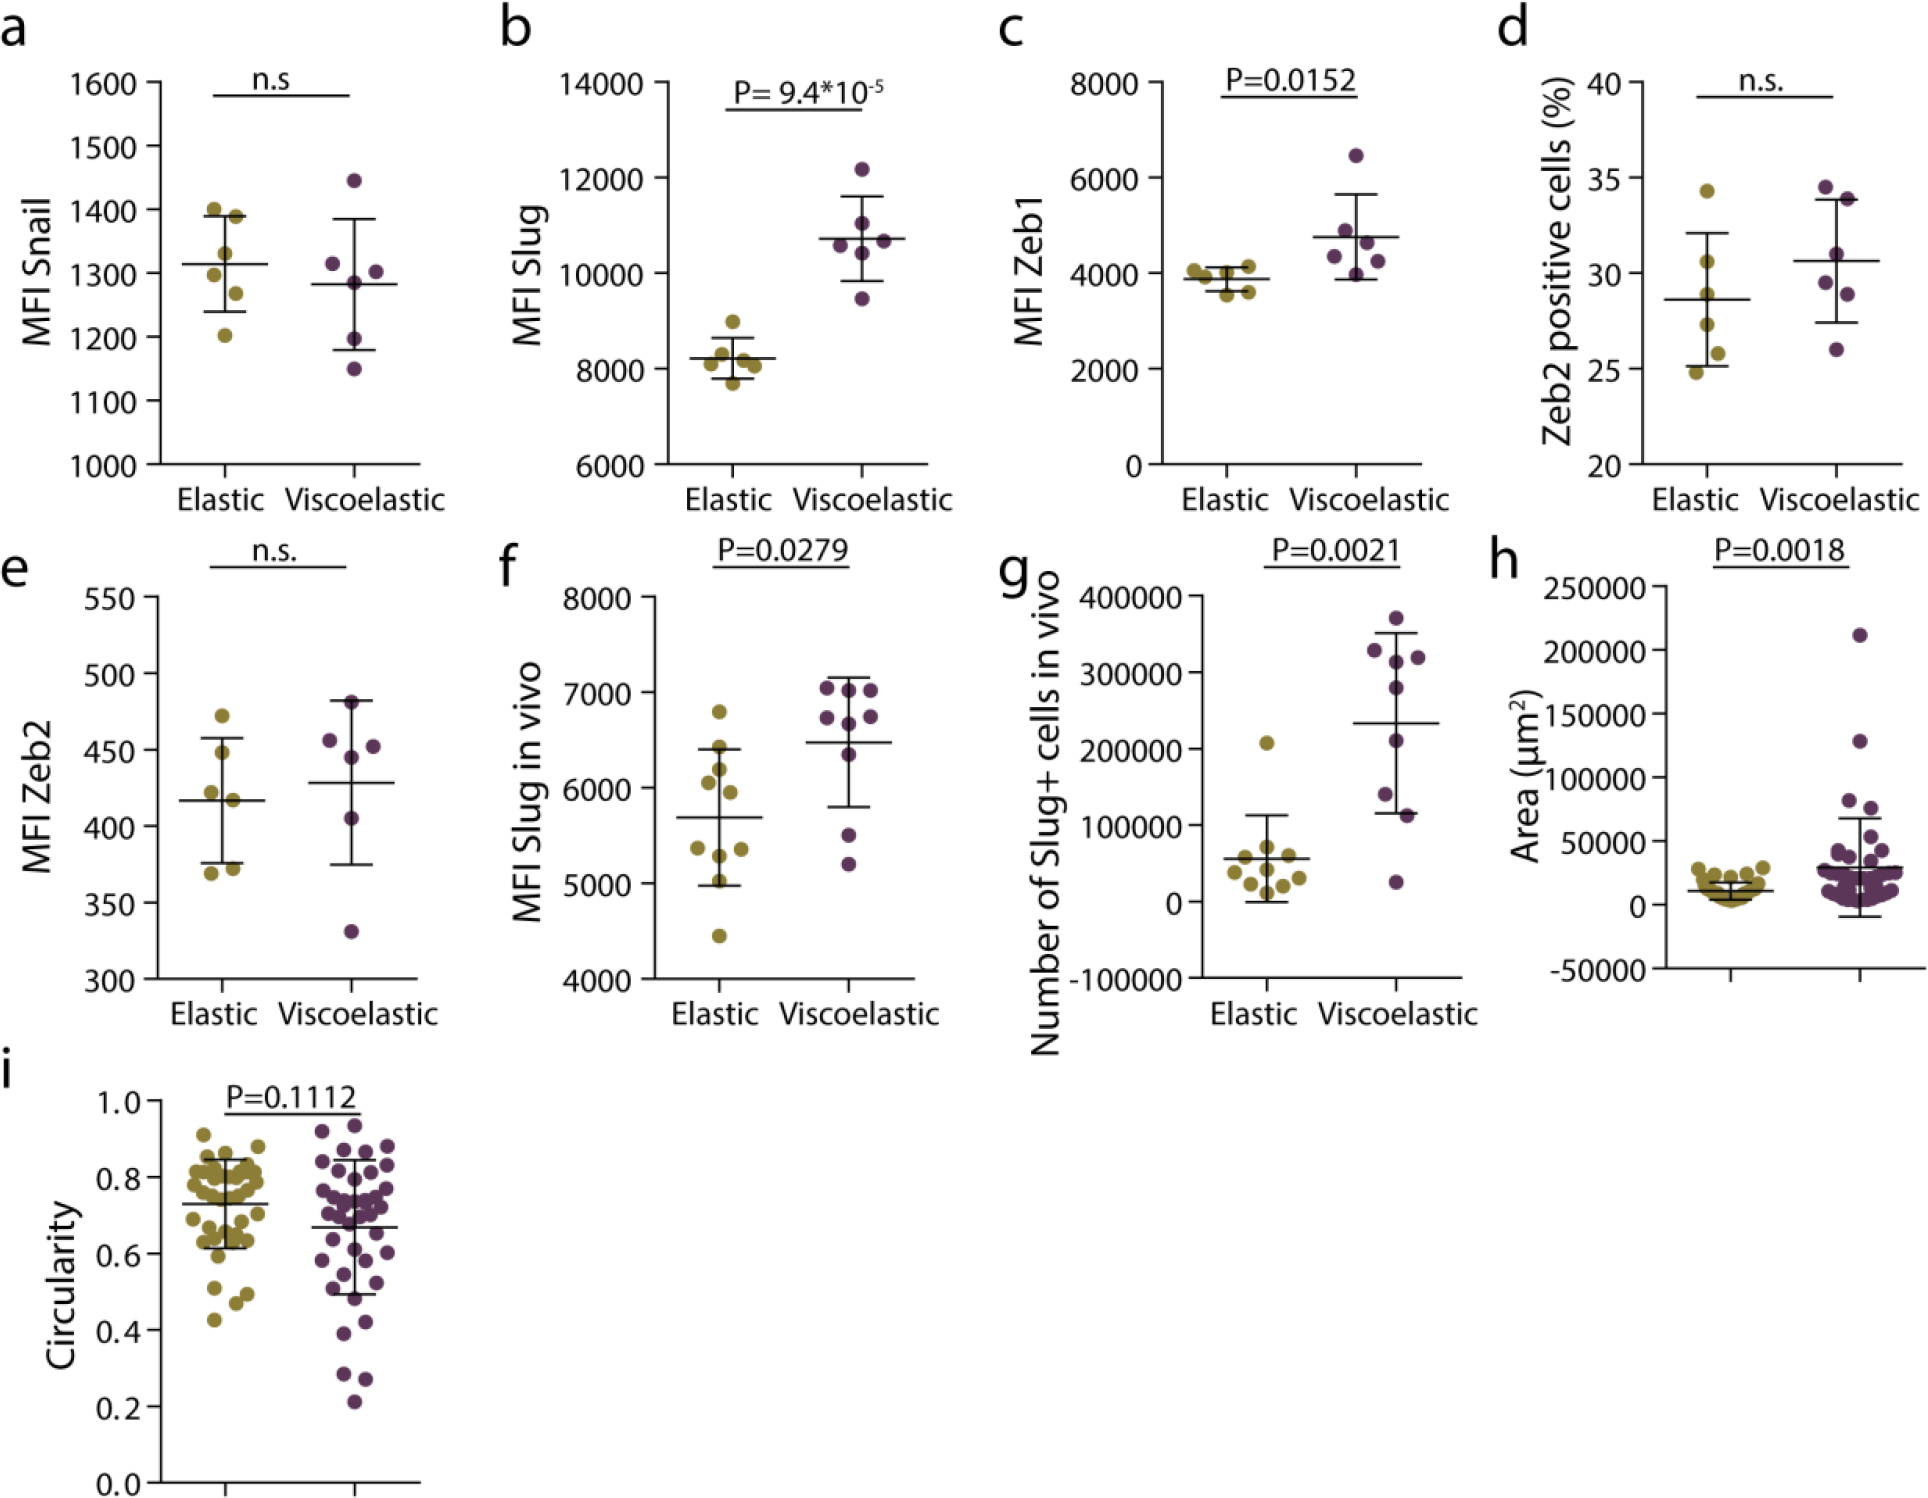
Matrix viscoelasticity promotes epithelial to mesenchymal transition. a-c, quantification of mean fluorescence intensity of Snail, Slug and Zeb1 in spheroids in elastic and viscoelastic matrices. n=6 gels per condition. d-e, quantification of percentage of Zeb2 positive cells (d) and mean Zeb2 fluorescence intensity (e) in spheroids in elastic and viscoelastic matrices. n=6 gels per condition. f, quantification of mean fluorescence intensity of Slug cells in elastic and viscoelastic matrices encapsulated in vivo (n=9,10 gels per condition). g, quantification of number of Slug positive cells in spheroids in elastic and viscoelastic matrices encapsulated in vivo (n=9,10 gels per condition). h-i, quantification of the area (h) and circularity (i) of MDA-MB-231 spheroids encapsulated in elastic and viscoelastic matrices. n=40 spheroids per condition. Statistical analysis was performed using two-sided Mann-Whitney U-test. All data represent mean ± s.d.
Extended Data Figure 3. 3D model for stress dependent cell flux simulations.
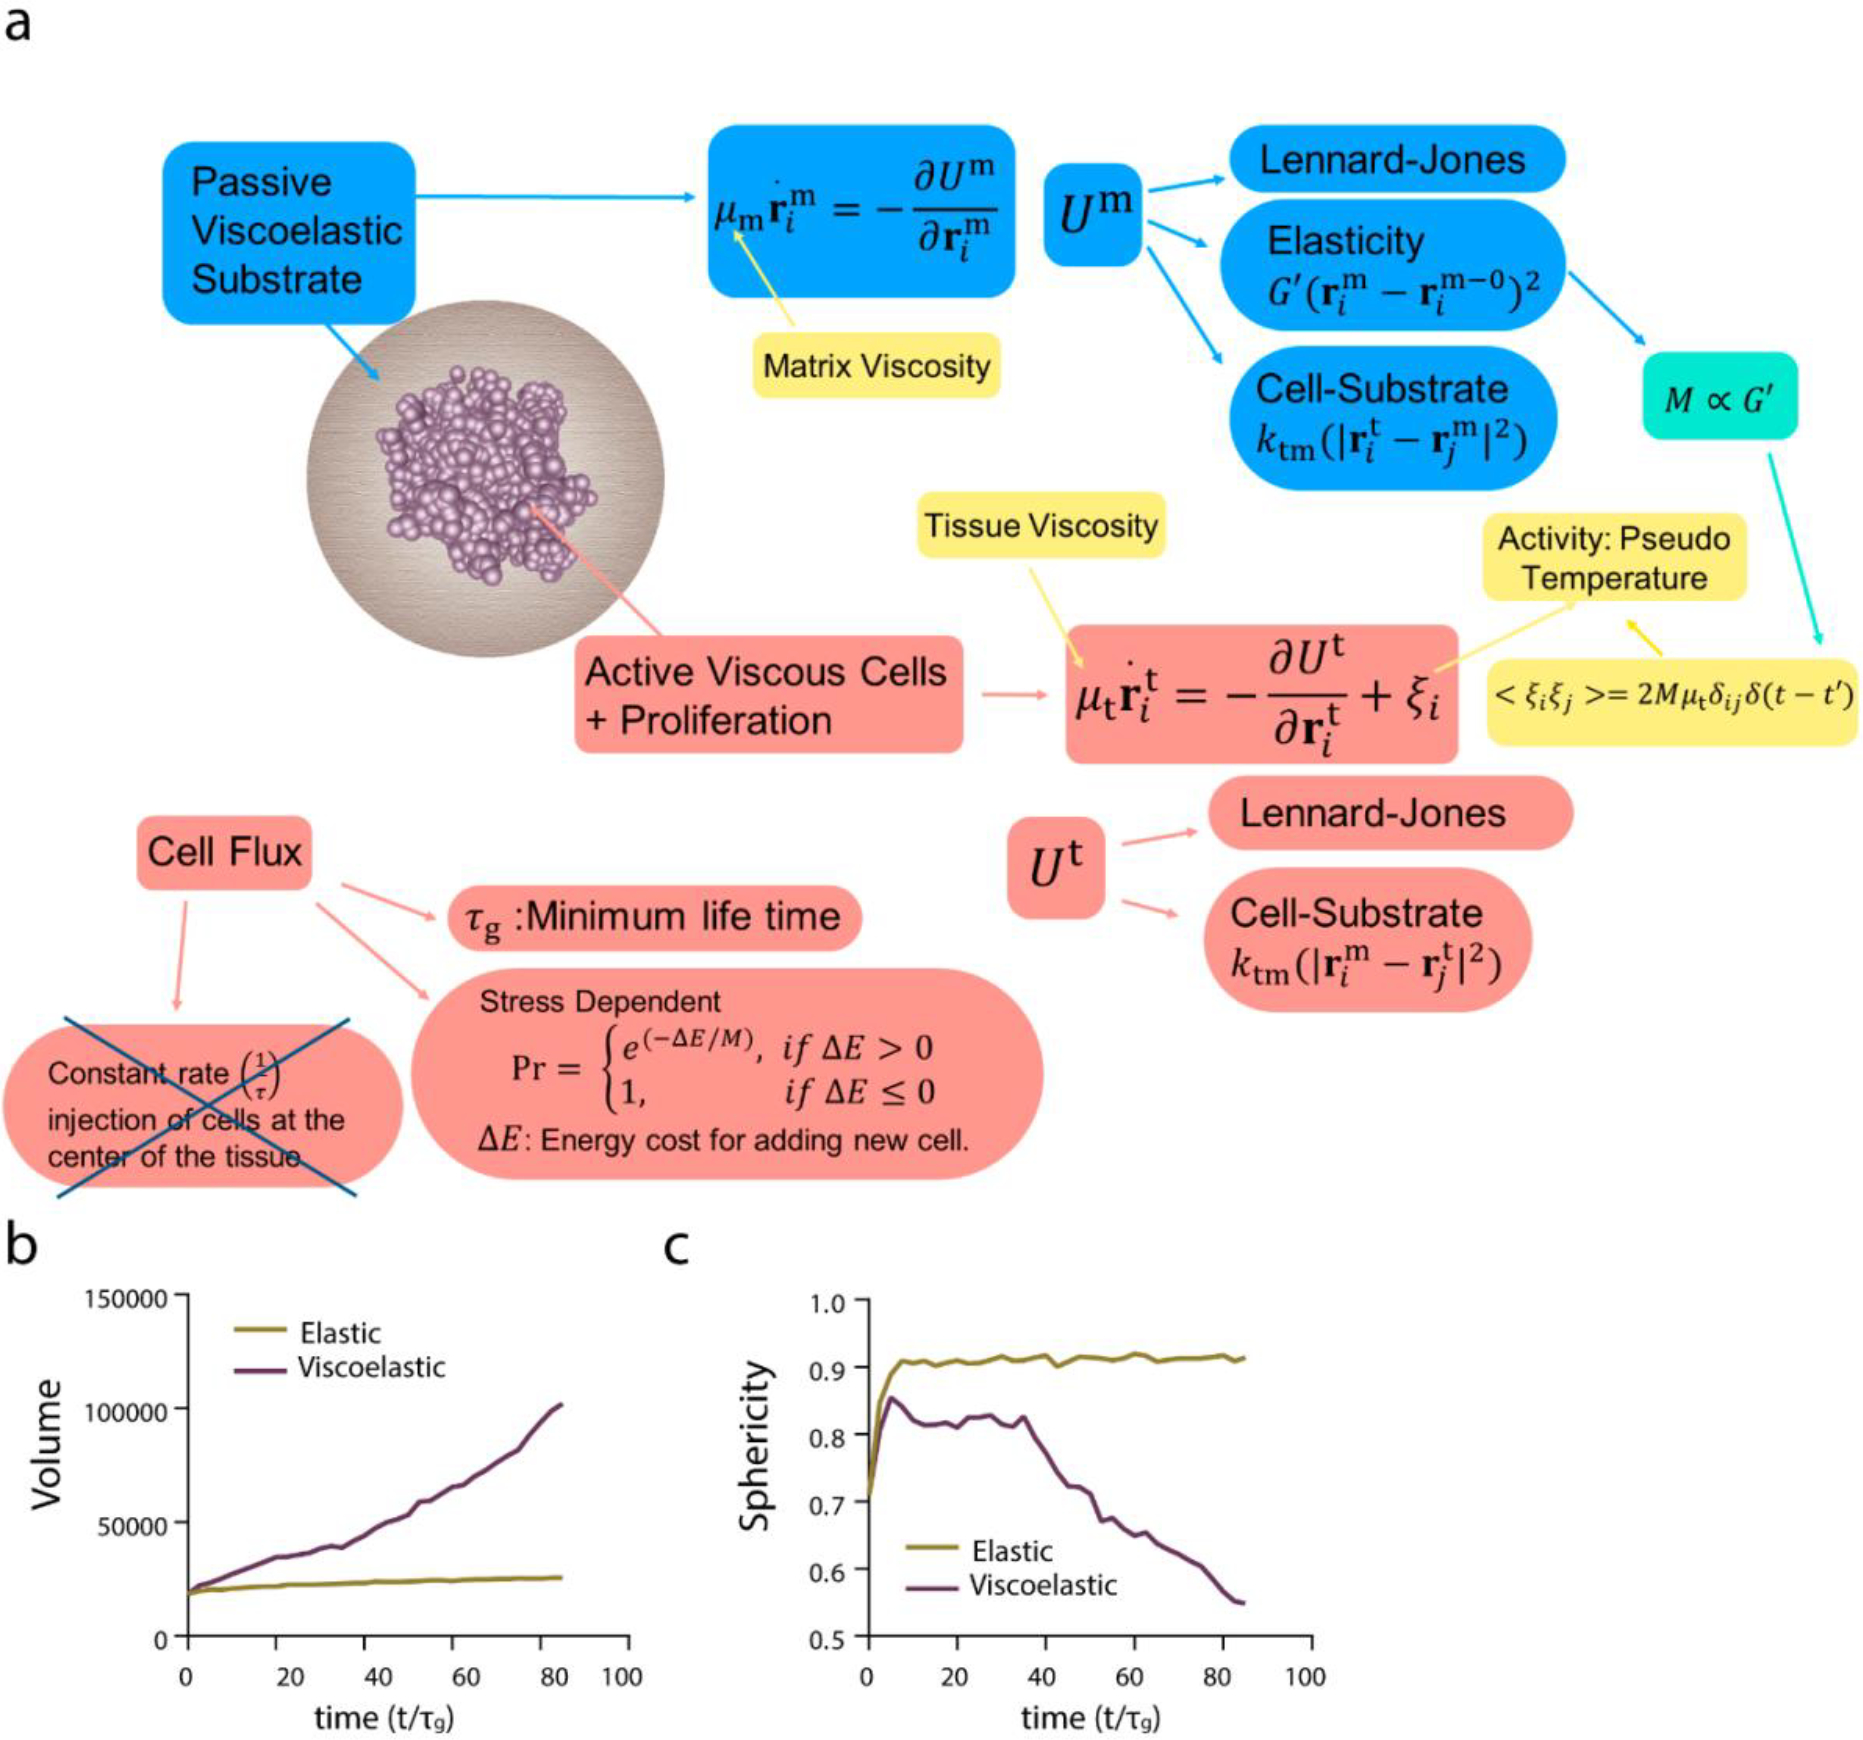
a, The texts in light blue/light red color boxes describe the matrix/cell property and interactions therein. The yellow boxes represent the parameters which we vary to probe the phase space of morphologies. In this case the cell proliferation is stress dependent, hence cell flux is material property dependent. b, Volume of the tissue as a function of time for the elastic and viscoelastic matrices (c) sphericity of the tissue as a function of time for elastic and viscoelastic matrices.
Extended Data Figure 4. Cell motility regulates tissue growth, symmetry breaking and fingering.
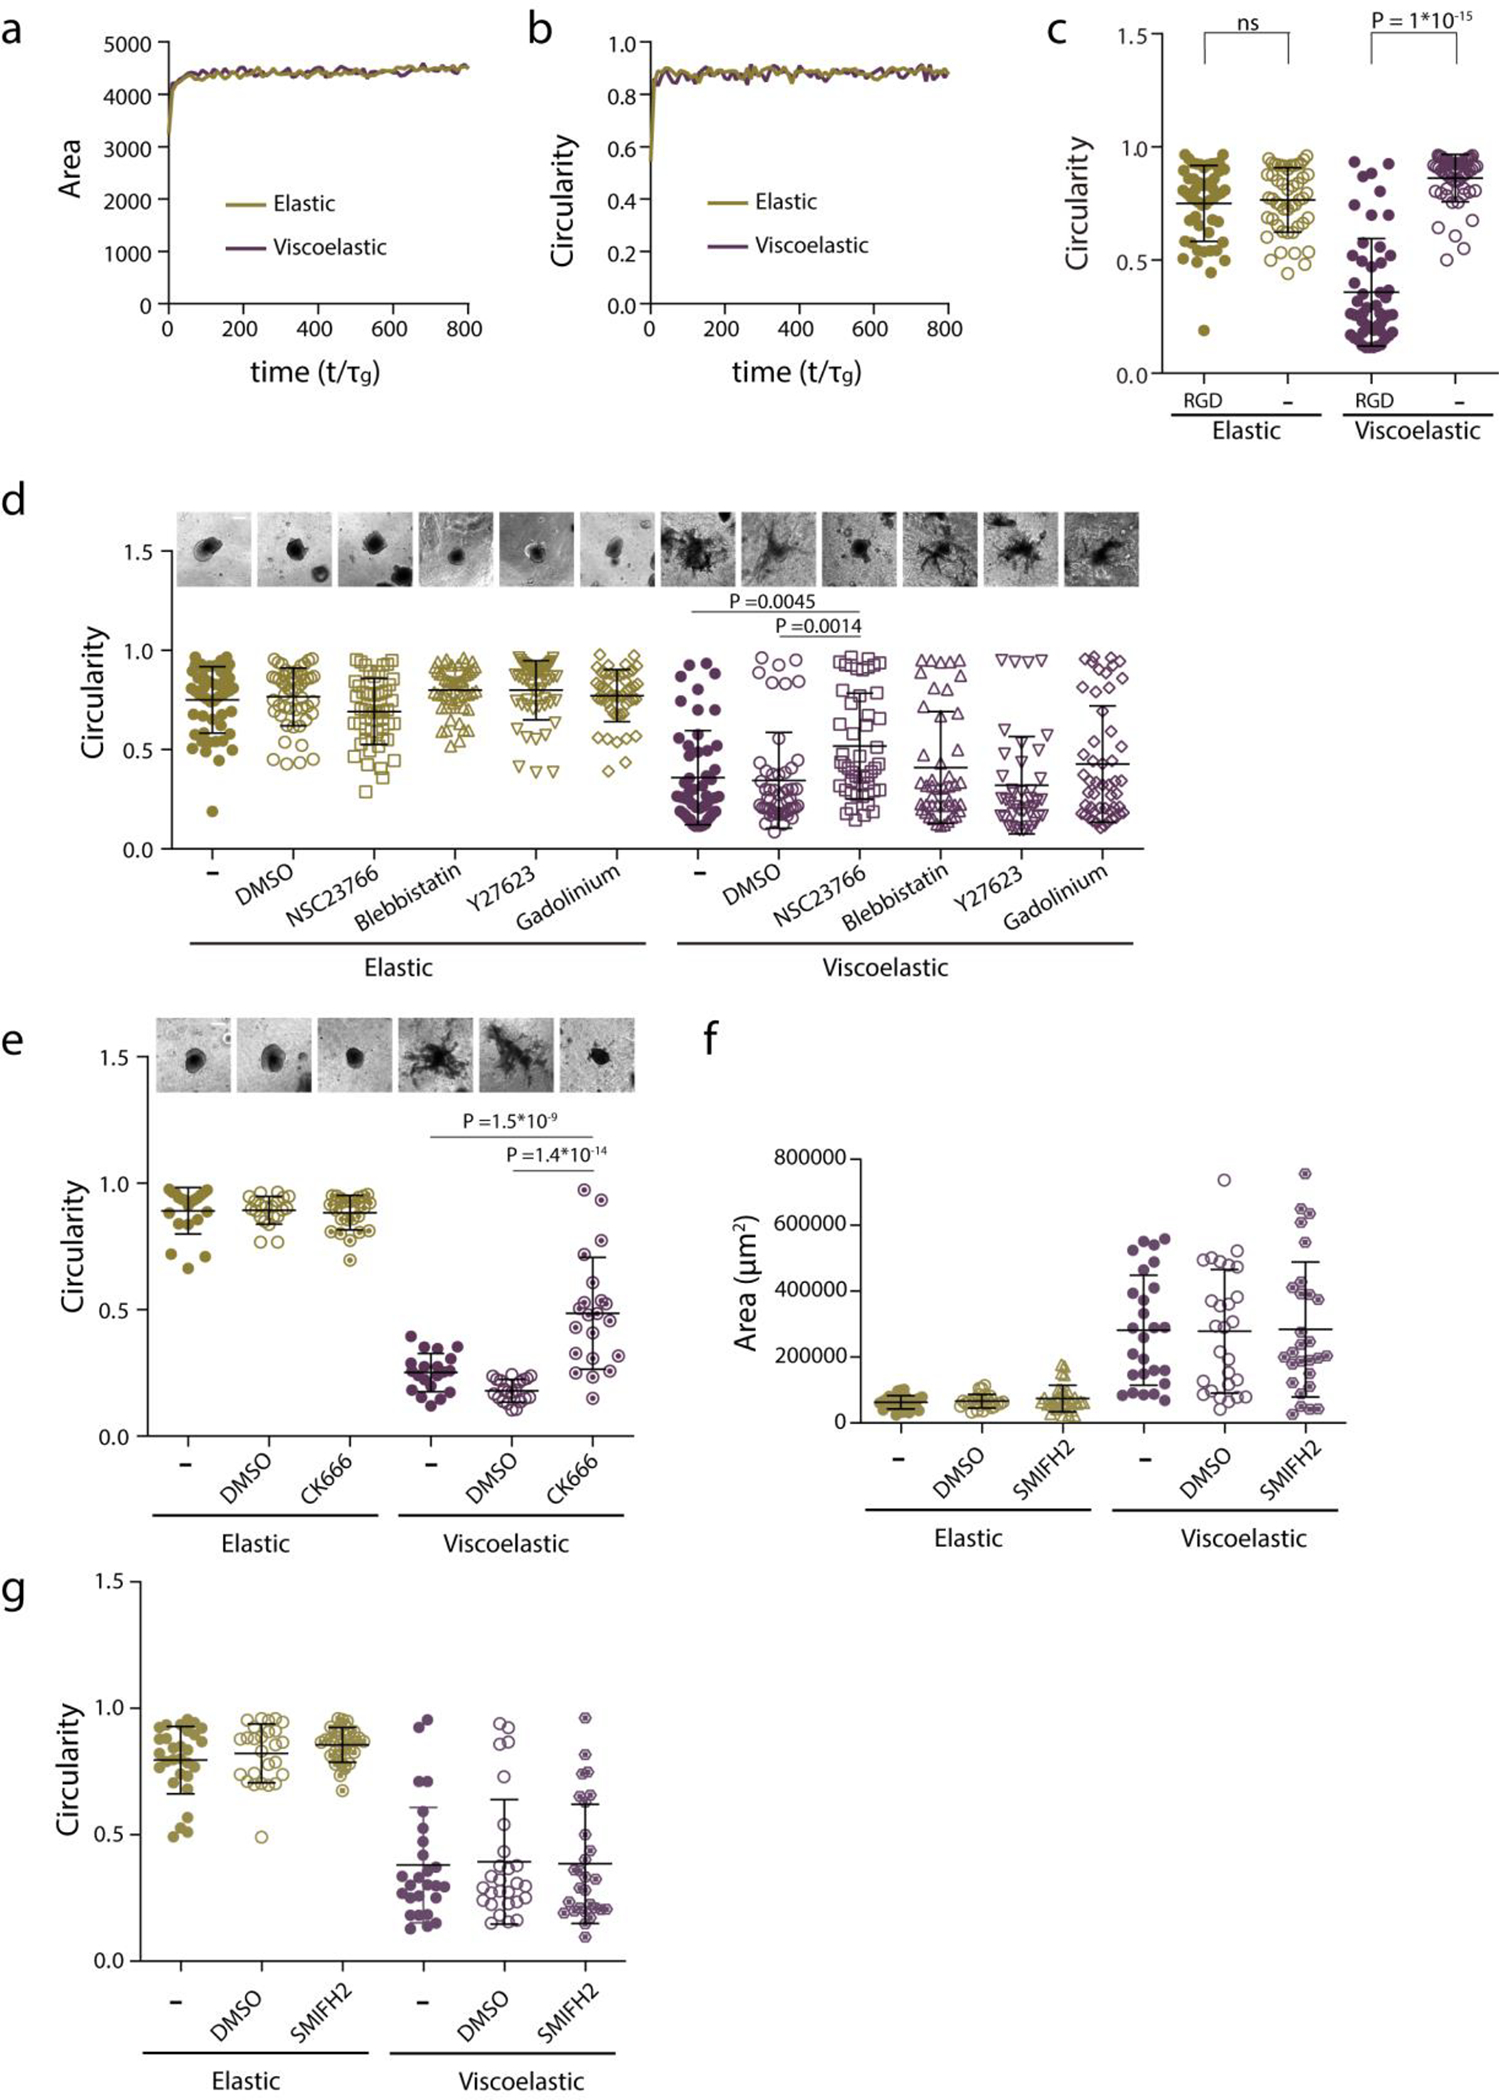
a-b, Model prediction of spheroids projected area (a) and circularity (b) evolution with time when cell motility is suppressed, for stiff elastic and stiff viscoelastic . c, Quantification of spheroids circularity after 5 days in hydrogels with and without cell adhesive ligand RGD. n=52,52,51,54 spheroids per condition. Statistical analysis was performed using Kruskal–Wallis test followed by post hoc Dunn’s test. d, Representative images (upper row) and quantification of spheroids circularity (lower row) after 5 days in hydrogels in the presence of the indicated inhibitors. n=52,50,51,51,51,50,51,50,51,46,41,51 spheroids per condition. Statistical analysis was performed using Kruskal–Wallis test followed by post hoc Dunn’s test. e, Representative images (upper row) and quantification of spheroid’s circularity (lower row) after 5 days hydrogels in the presence of the indicated inhibitor. n=21,21,24,20,21,25 spheroids per condition. Statistical analysis was performed using Kruskal–Wallis test followed by post hoc Dunn’s test. f-g, Quantification of spheroids area (f) and circularity (g) of spheroids after 5 days in hydrogels in the presence of the indicated formins inhibitor. n= 29,26,32,26,27,28 spheroids per condition. No significant differences were observed in the presence of the inhibitor. Statistical analysis was performed using Kruskal–Wallis test followed by post hoc Dunn’s test. All data represent mean ± s.d.; all scale bars represent 200 μm.
Extended Data Figure 5. Cell proliferation is required for tissue growth, symmetry breaking and fingering.

a-b, Quantification from the simulations of the projected area (a) and circularity (b) of the spheroids, respectively, over time when proliferation is inhibited, for stiff elastic and stiff viscoelastic matrices. c, Quantification of the circularity of spheroids without or in the presence of thymidine to inhibit cell proliferation. n=52,53,51,53 spheroids per condition. Statistical analysis was performed using Kruskal–Wallis test followed by post hoc Dunn’s test. All data represent mean ± s.d.
Extended Data Figure 6. Cell proliferation is required for tissue growth, symmetry breaking and fingering.
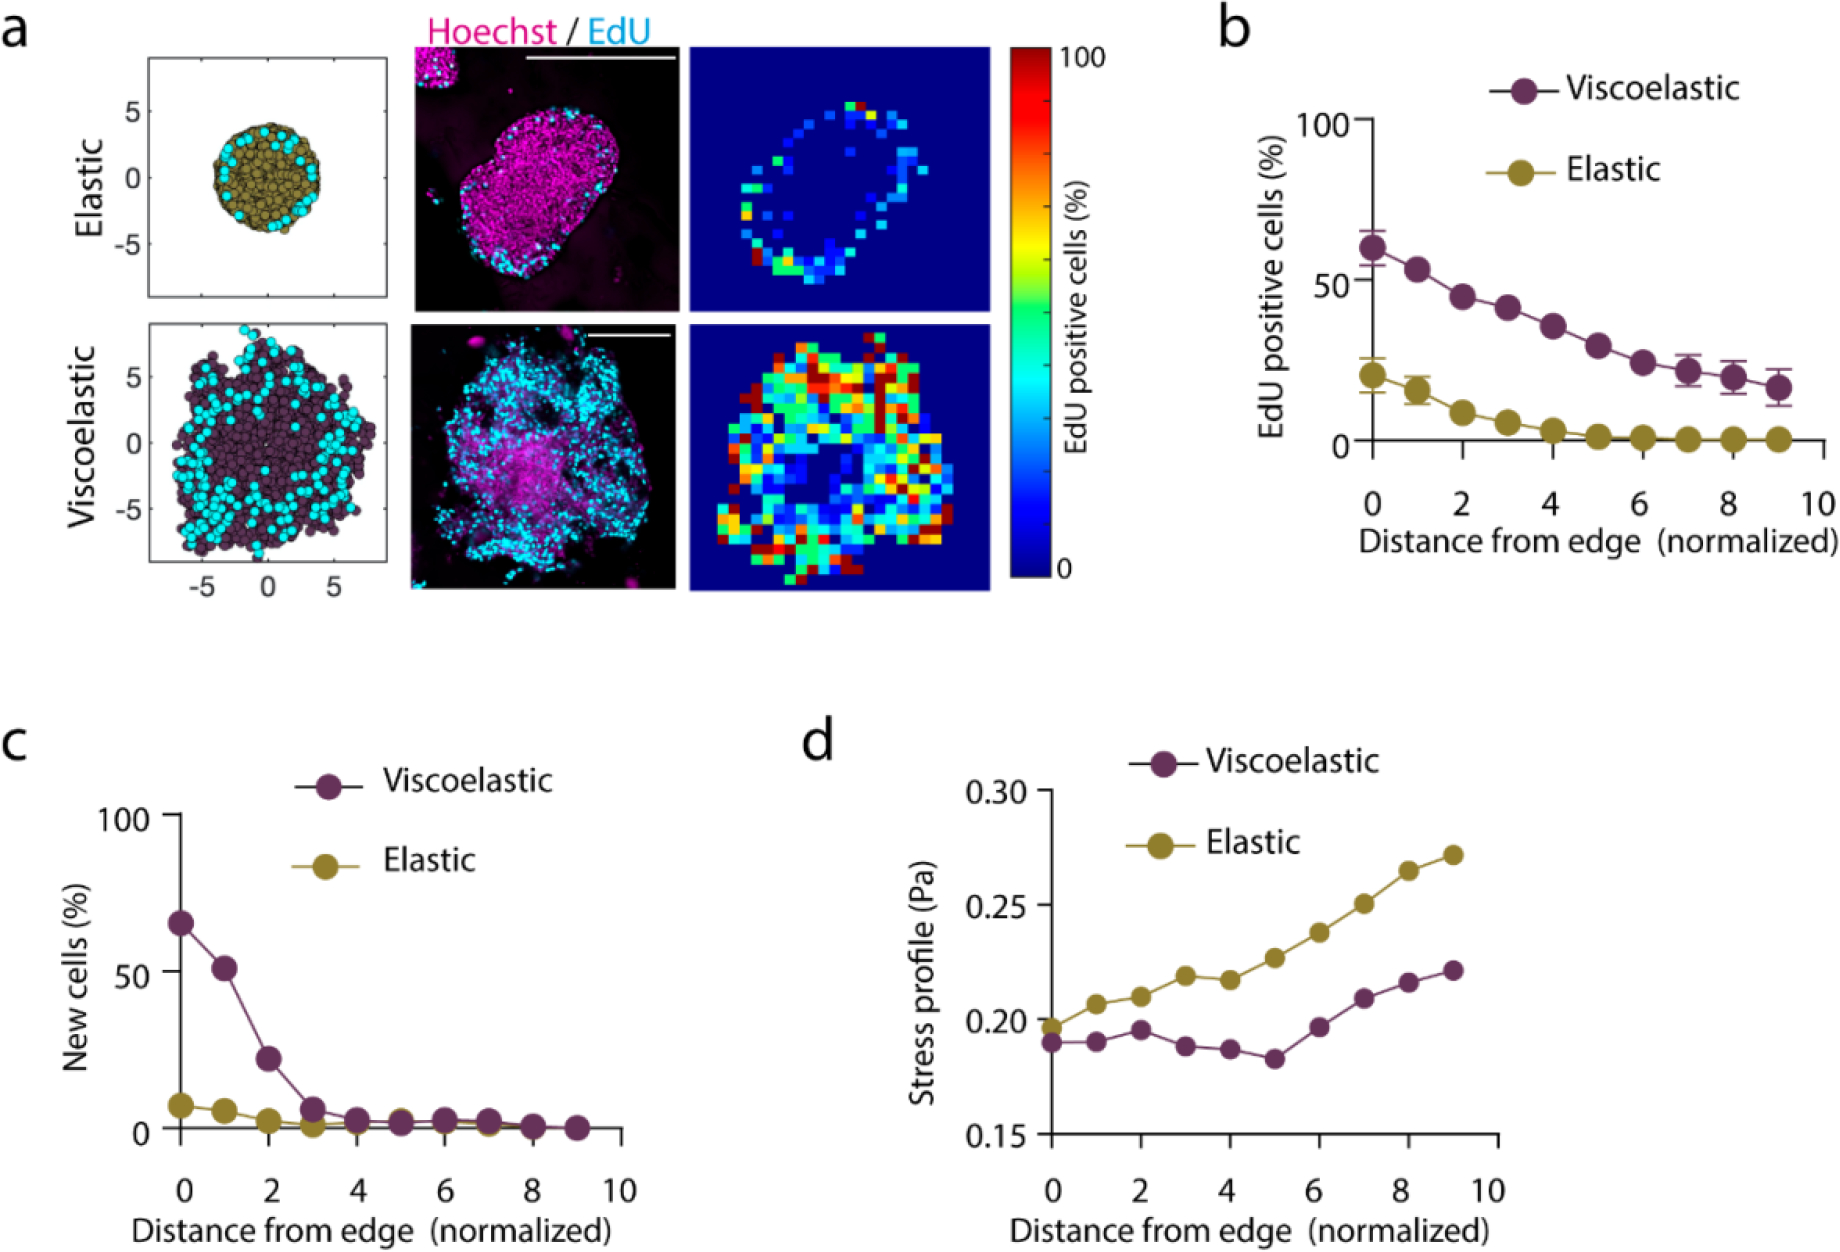
a, Simulation and Experimental results for the distribution of proliferating cells across spheroids in elastic (upper row) and viscoelastic gels (lower row): left, simulation example of the daughter cells (cyan) and the cells in the tissue spheroid (yellow elastic and cyan viscoelastic); center, representative examples of experimental spheroids showing EdU positive cells (cyan) and cell nuclei (Hoechst, magenta) for spheroids; right, colormaps showing the local percentage of Edu positive cells across the spheroid. b-c, Experimental (b) and simulation results (c) showing the density proliferating cells depending of distance from the spheroid edge. n=3,4 spheroids per condition. Error bars are s.e.m. All scale bars are 200 μm. d, The normalized stress energy estimated from the simulations depending on the distance from the spheroid edge. The dimensionless parameter in the model for stiff elastic and stiff viscoelastic matrices.
Extended Data Figure 7. Development of a microfluidic device to study the influence of pressure in tissue morphological stability.
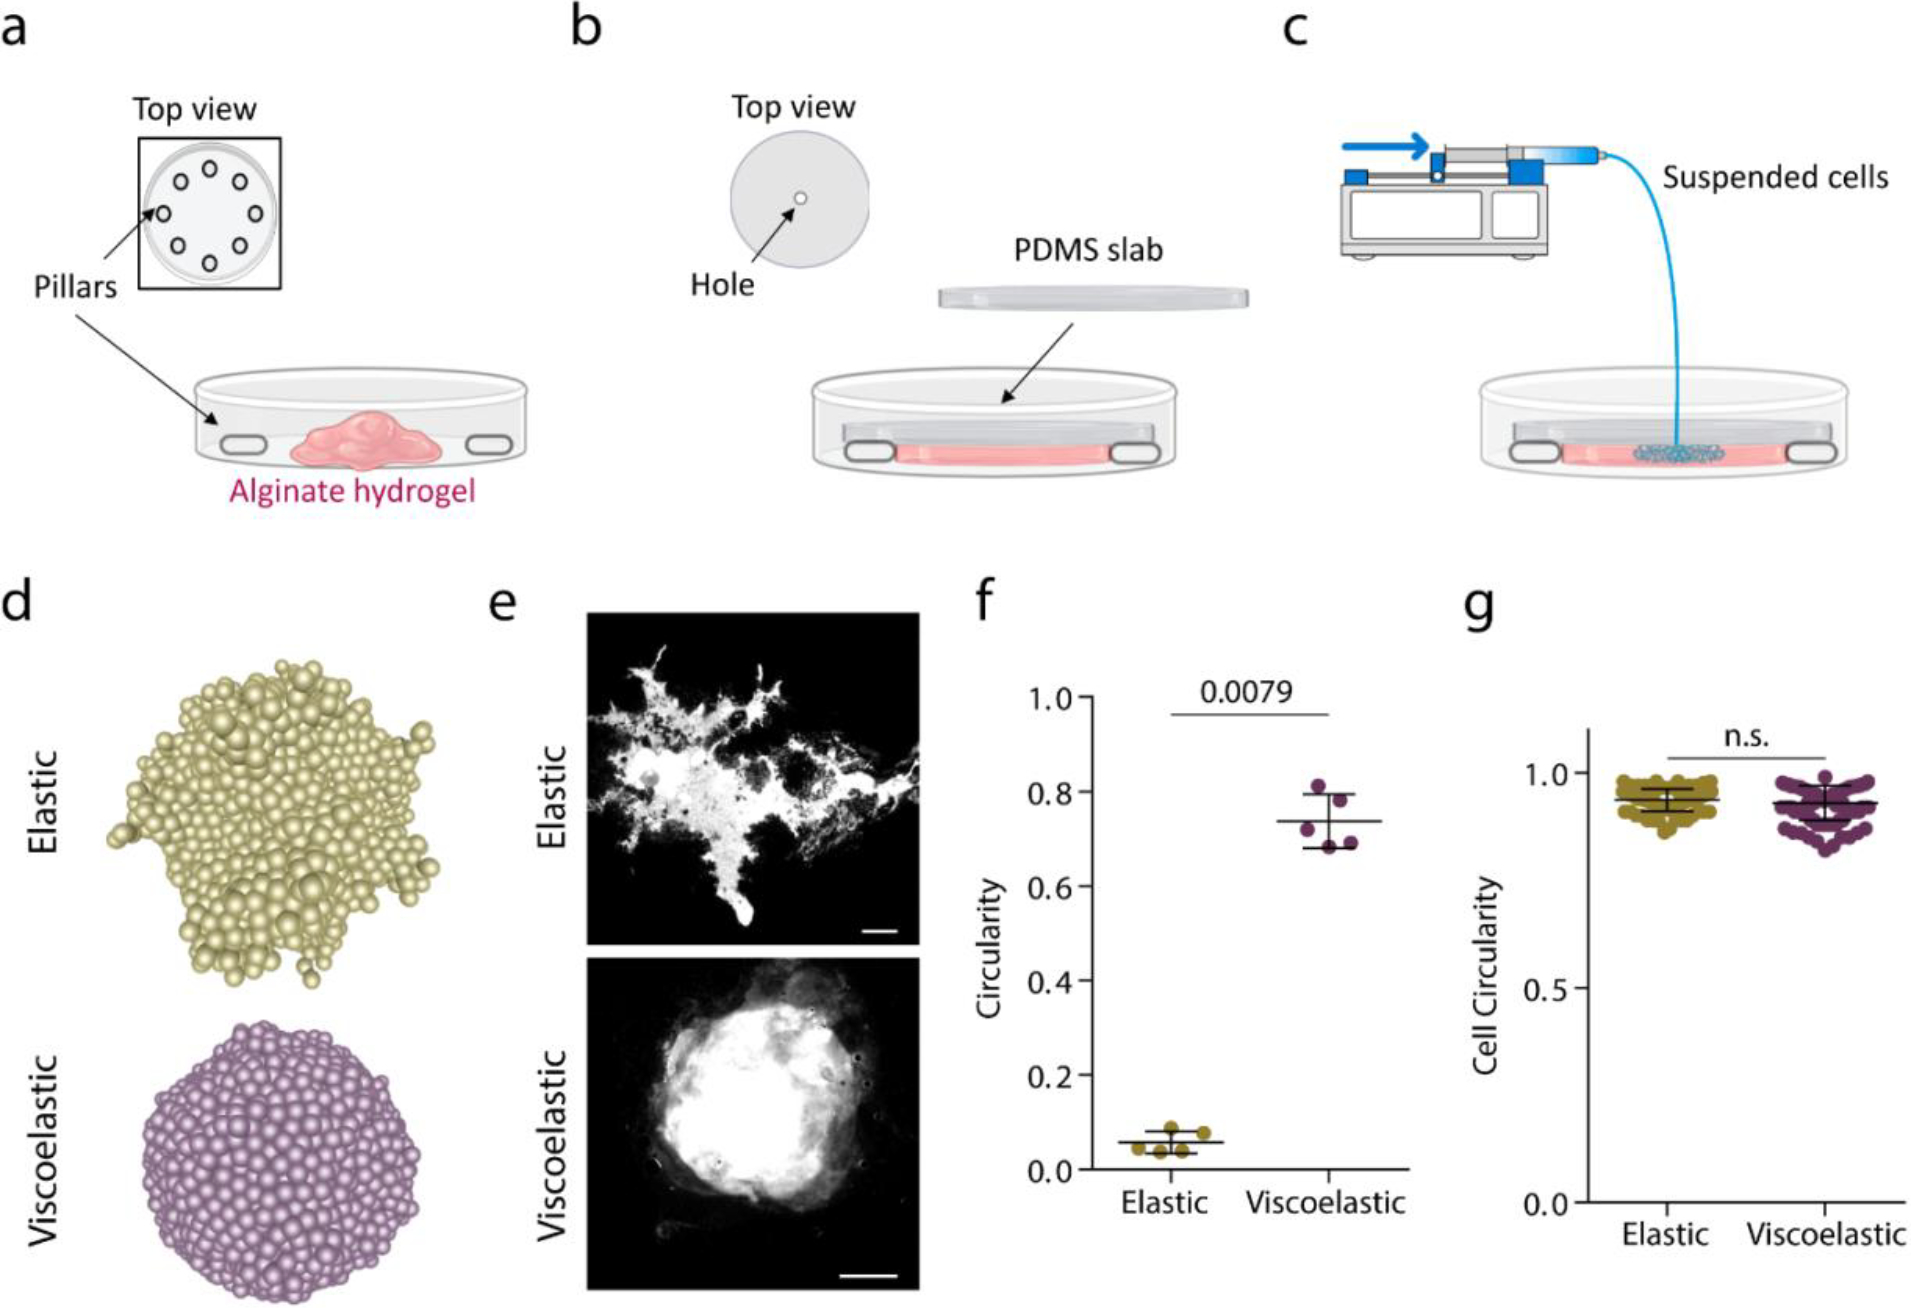
a, Pillars are distributed across the petri dish and an unpolymerized alginate solution is loaded. b, A PDMS slab is placed on top of the pillars and alginate is allowed to polymerize for 45 min. c, cells are loaded at a constant rate (1μl/min) with a syringe pump through a hole in the PDMS slab. Due to the pressure , cells displace the material. d, Model prediction for cell flux driven experiments for elastic and viscoelastic matrices. e, Examples of Hoechst staining of cells in elastic and viscoelastic matrices. Scale bar is 2000 μm. f, Quantification of the circularity in elastic and viscoelastic hydrogels. n=5,5 experiments per condition. g, Quantification of single cells circularity inside tissues in elastic and viscoelastic hydrogels. n=100,100 cells per condition. Statistical analysis was performed using two-sided Mann-Whitney U-test. Data represent mean ± s.d.
Extended Data Figure 8. Phase diagram simulations.
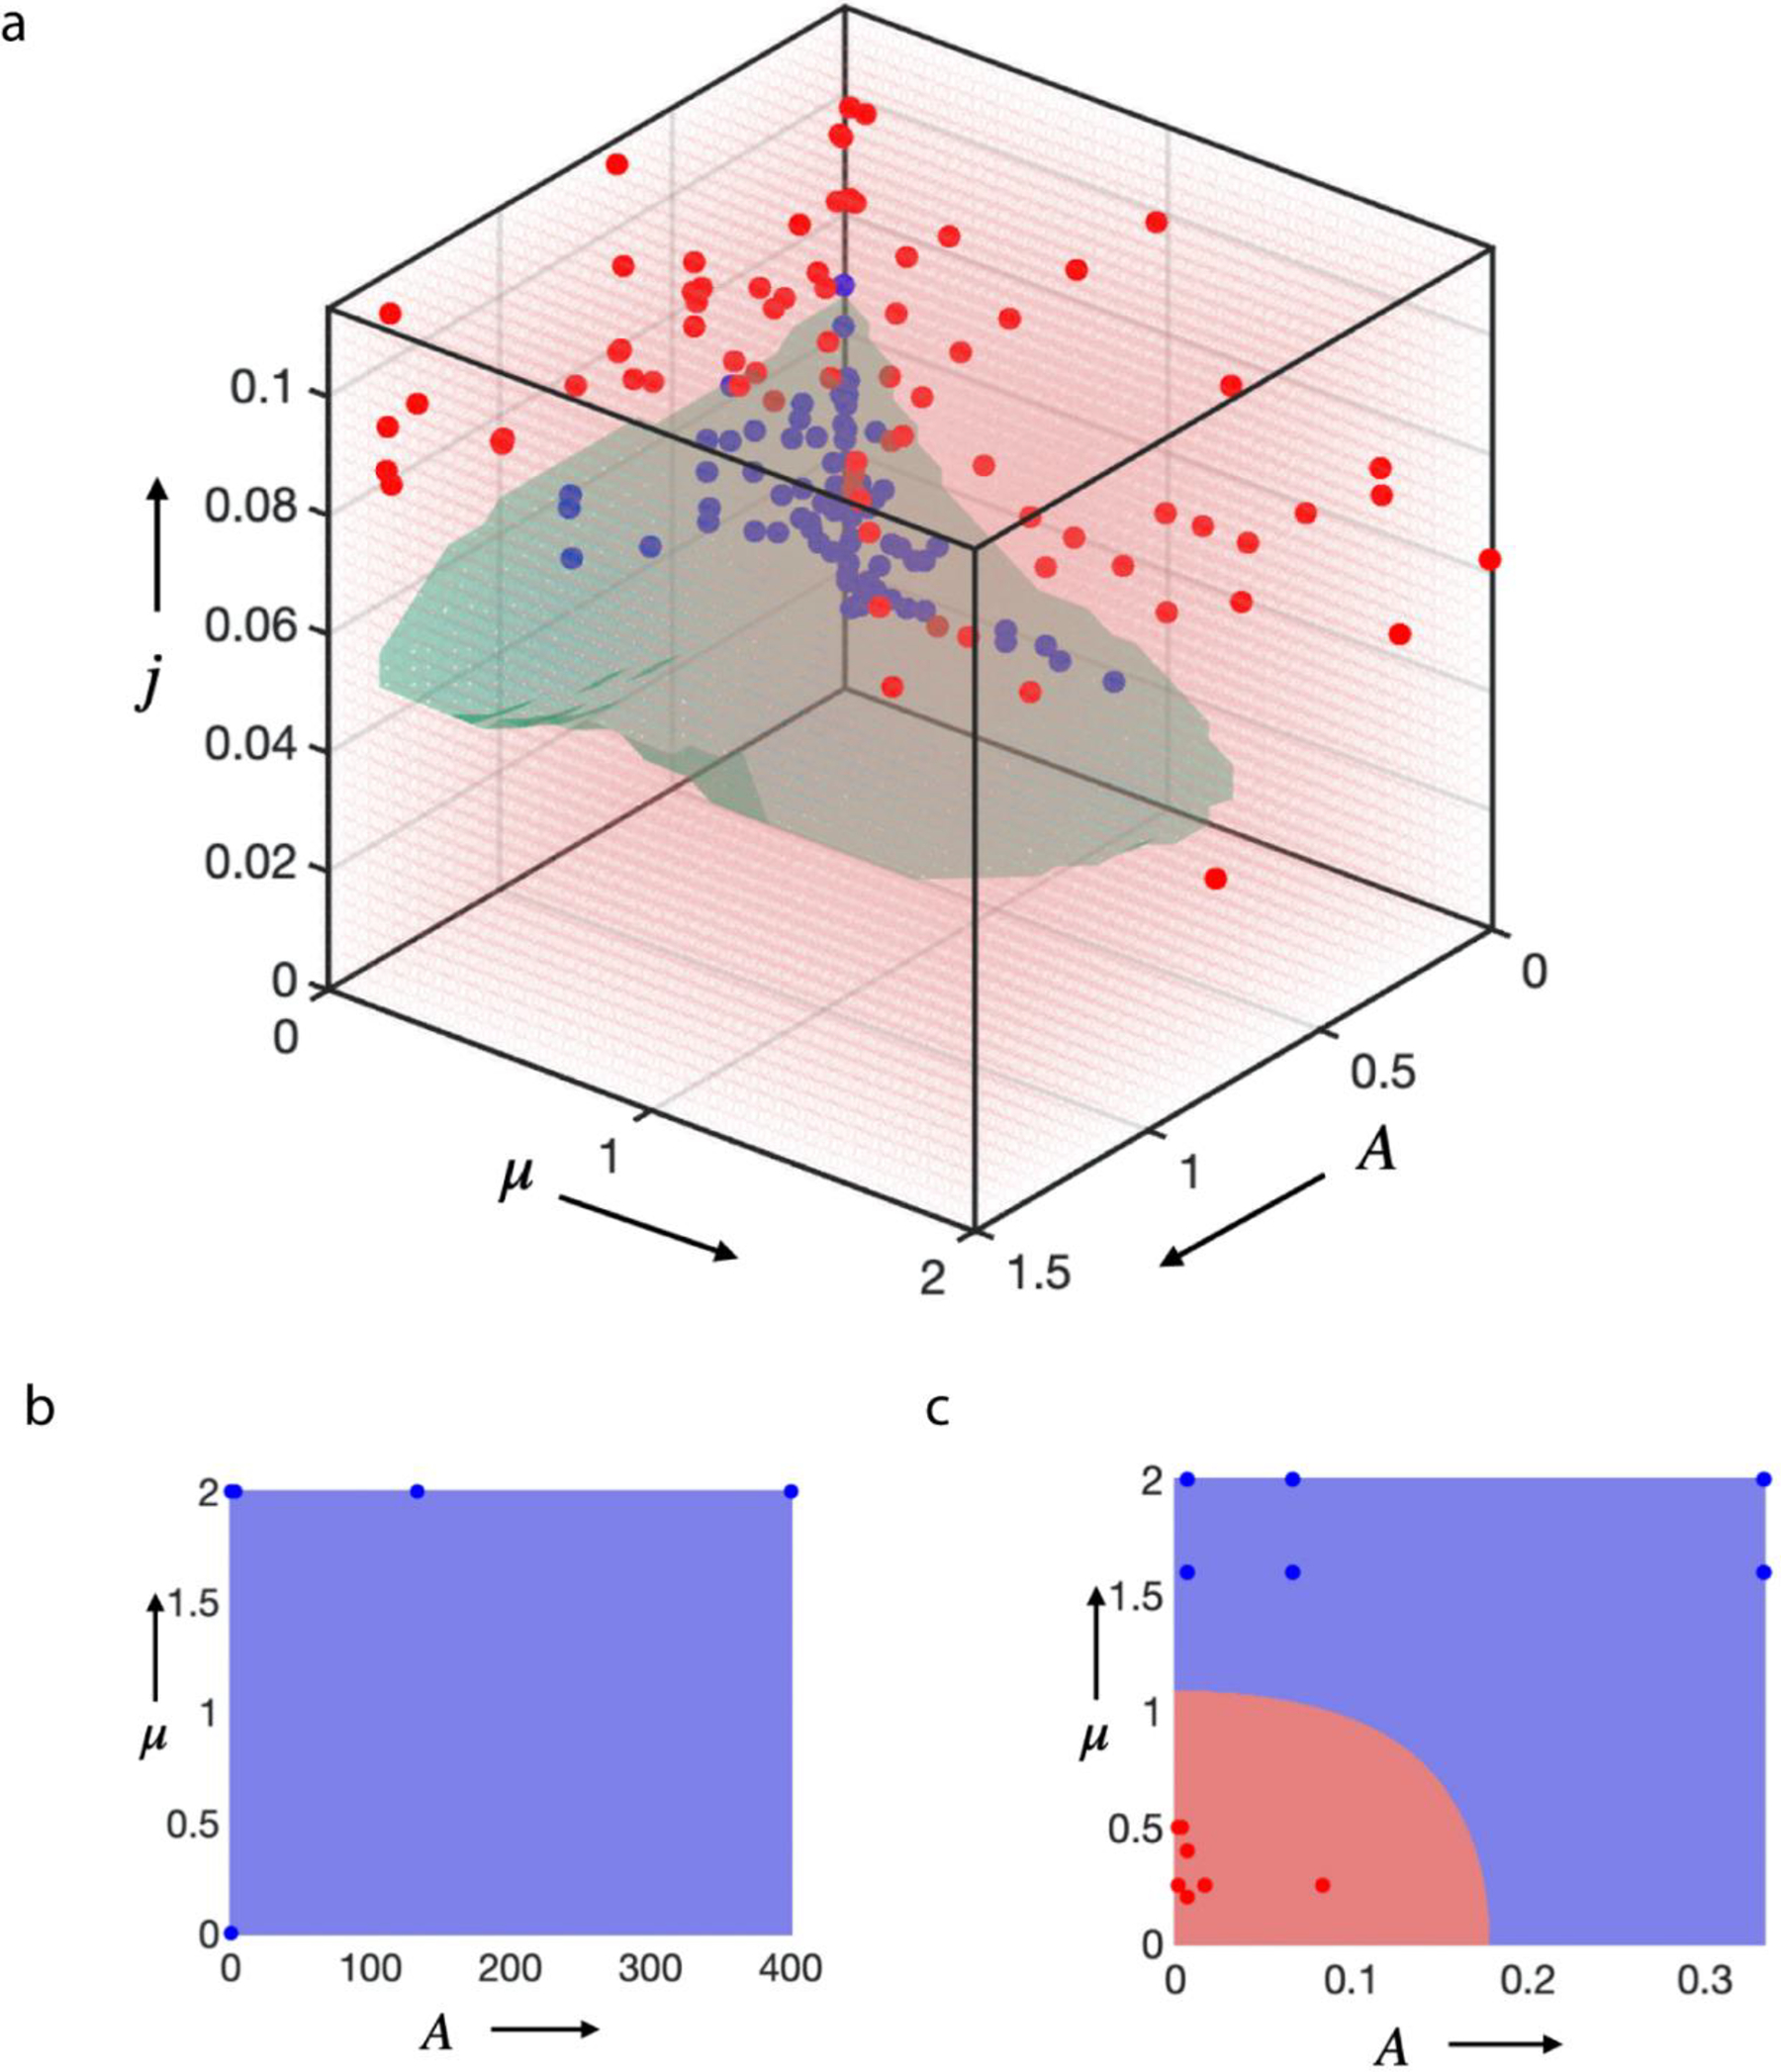
a, 3D phase diagram including the results of multiple simulation runs utilized to determine the phase boundaries. Each dot represents the final result of a single simulation run under specific condition, and they are color coded (blue= stable tissue growth; red=unstable tissue growth). b, A two-dimensional phase diagram for low motility case as a consequence of slow addition of cells, always leading to a stable spheroid (all blue). c, Two-dimensional phase diagram for the controlled cell-flux driven case where the addition of cells is fast. This leads to an inverted behavior, the growth of tissue in elastic matrix (close to origin) is branched (red) and in viscoelastic matrix (away from origin) is a stable (blue). In b and c, the red and blue dots against represent data points extracted from individual simulations. When the scaled proliferation pressure , the tissue grows as a stable spheroid (Fig. 3i,j and Supplementary Fig. 8, 9). Additionally, when the scaled matrix relaxation time , the tissue remains spheroidal and is morphologically stable as long as the scaled proliferation pressure (top panel of Fig.1d, Fig.3b and Fig.4b). When the scaled matrix relaxation time : if the scaled proliferation pressure , the tissue grows as a stable spheroid (bottom right of Fig. 3i and bottom panel of Supplementary Fig. 8b); if the scaled proliferation pressure , the growth is unstable and the tissue breaks symmetry and develops fingers (bottom panel of Fig.1d and bottom panel of Fig. 3b and 4b); if the scaled proliferation pressure , the morphological stability of the tissue depends on (see Extended Data Fig 7d,e and 8c); for , the tissue remains spheroidal (Extended Data Fig.7d,e, 8c); for , growth is unstable and the tissue breaks symmetry and develops fingers (Extended Data Fig.7d,e, 8c).viscoelastic limit are and , respectively.
Extended Data Figure 9. Organoids grow, break symmetry and form buds with time.
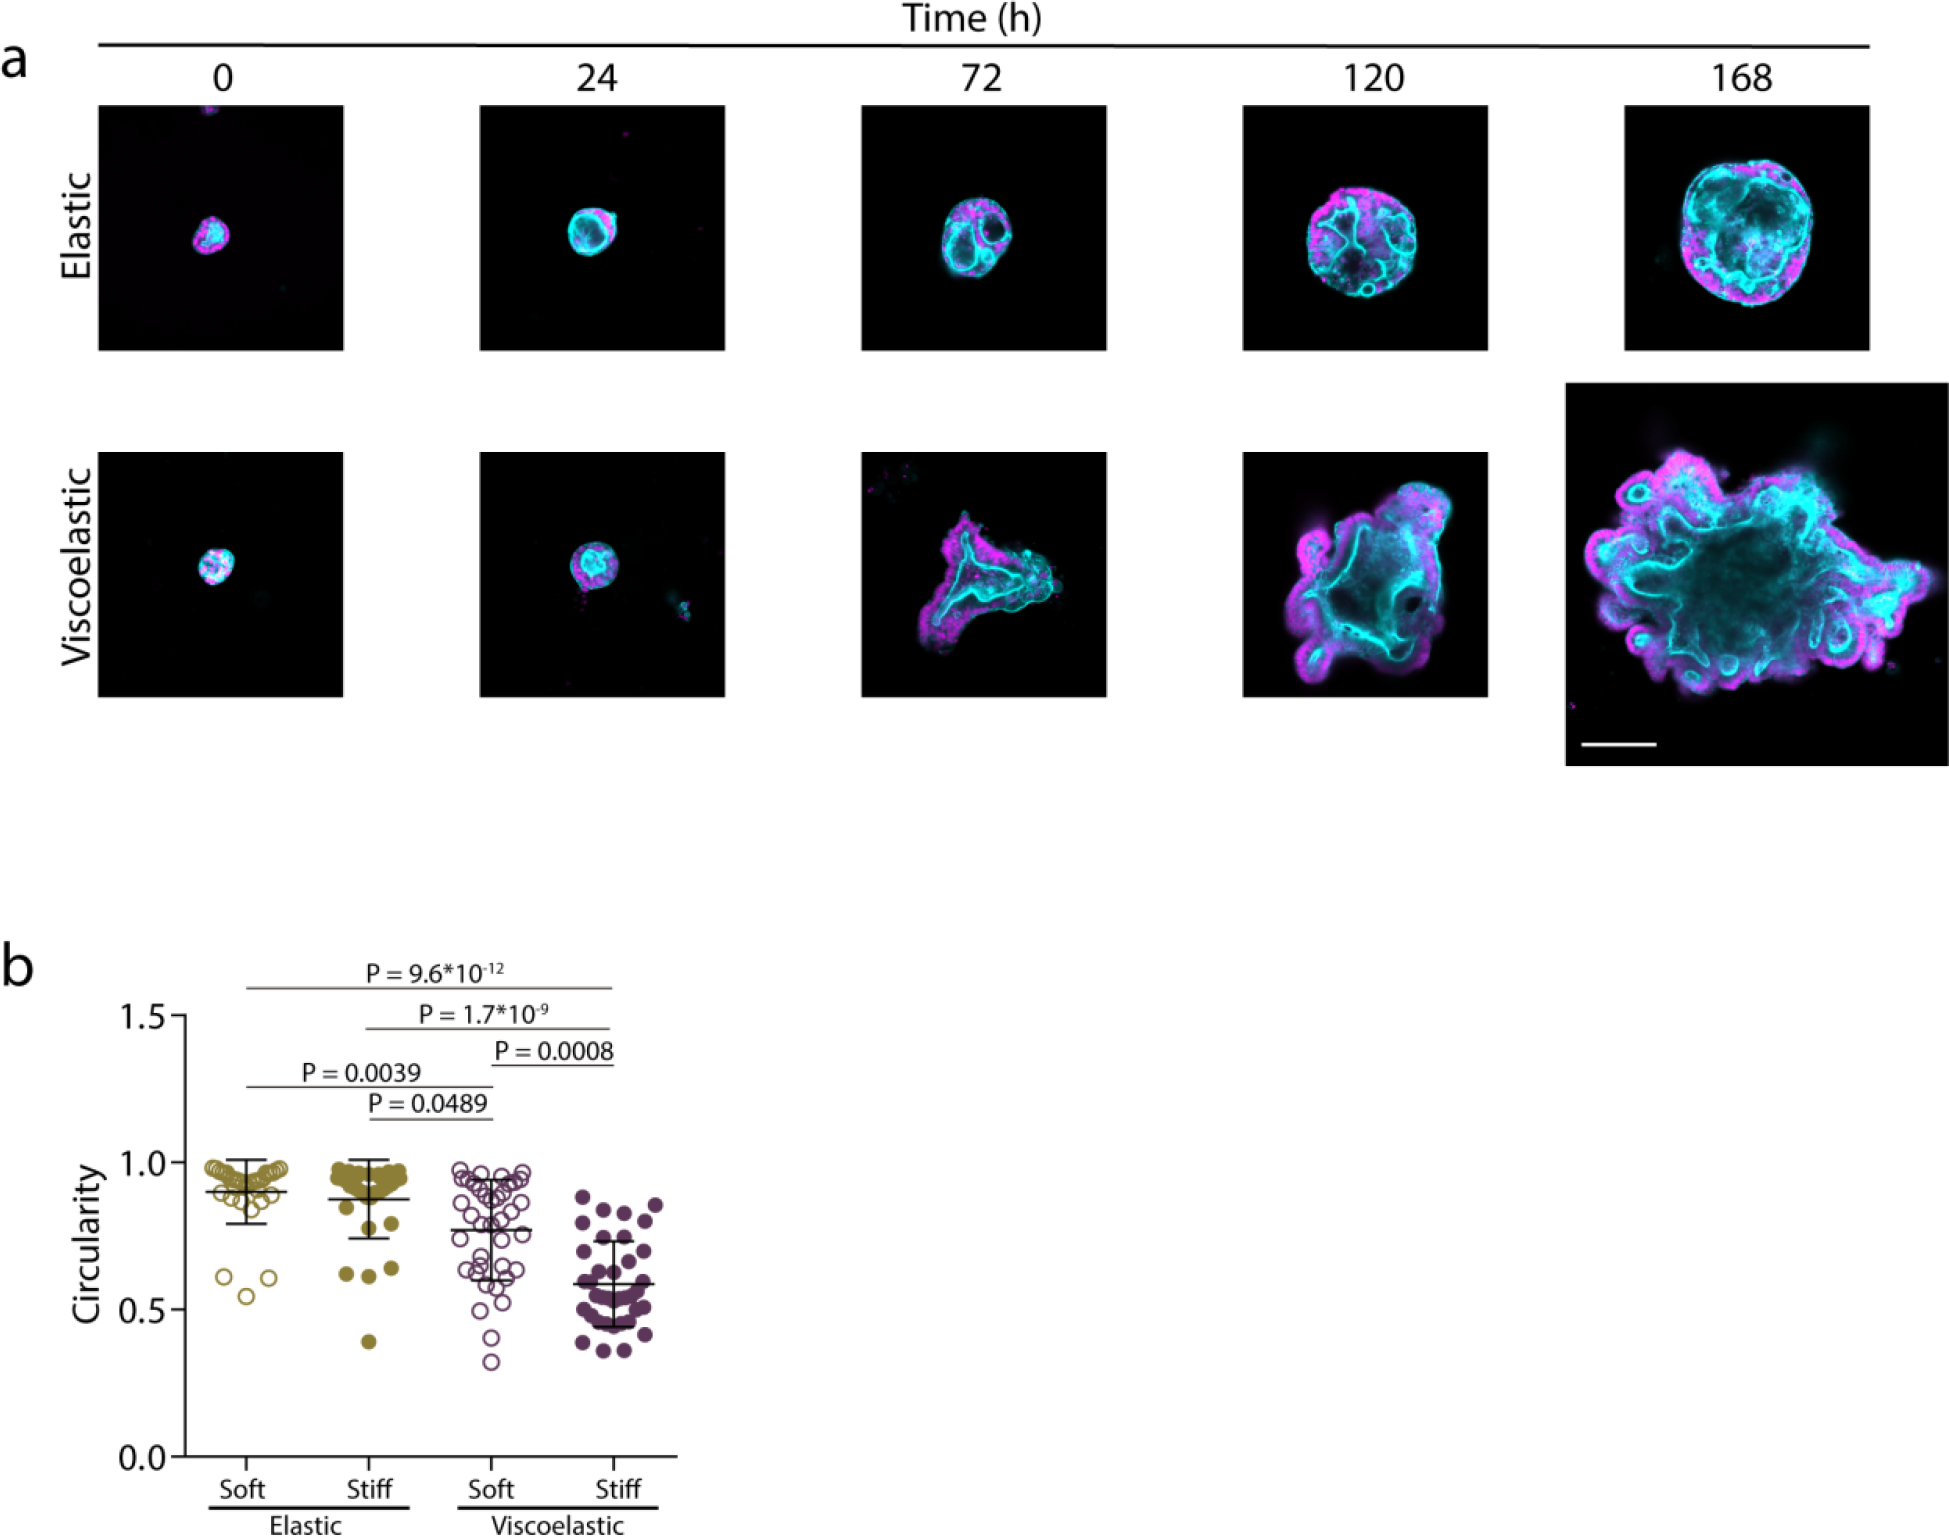
a, Examples of growth of intestinal organoids in elastic versus viscoelastic hydrogels over 7 days. Phalloidin in cyan, Hoechst in magenta. Scale bar is 100 μm. b, Quantification of organoid circularity in different stiffness elastic and viscoelastic hydrogels. n=32,32,38,37 organoids per condition. Statistical analysis was performed using Kruskal–Wallis test followed by post hoc Dunn’s test. Data represent mean ± s.d.
Extended Data Figure 10. Organoids present differentiated cell types.
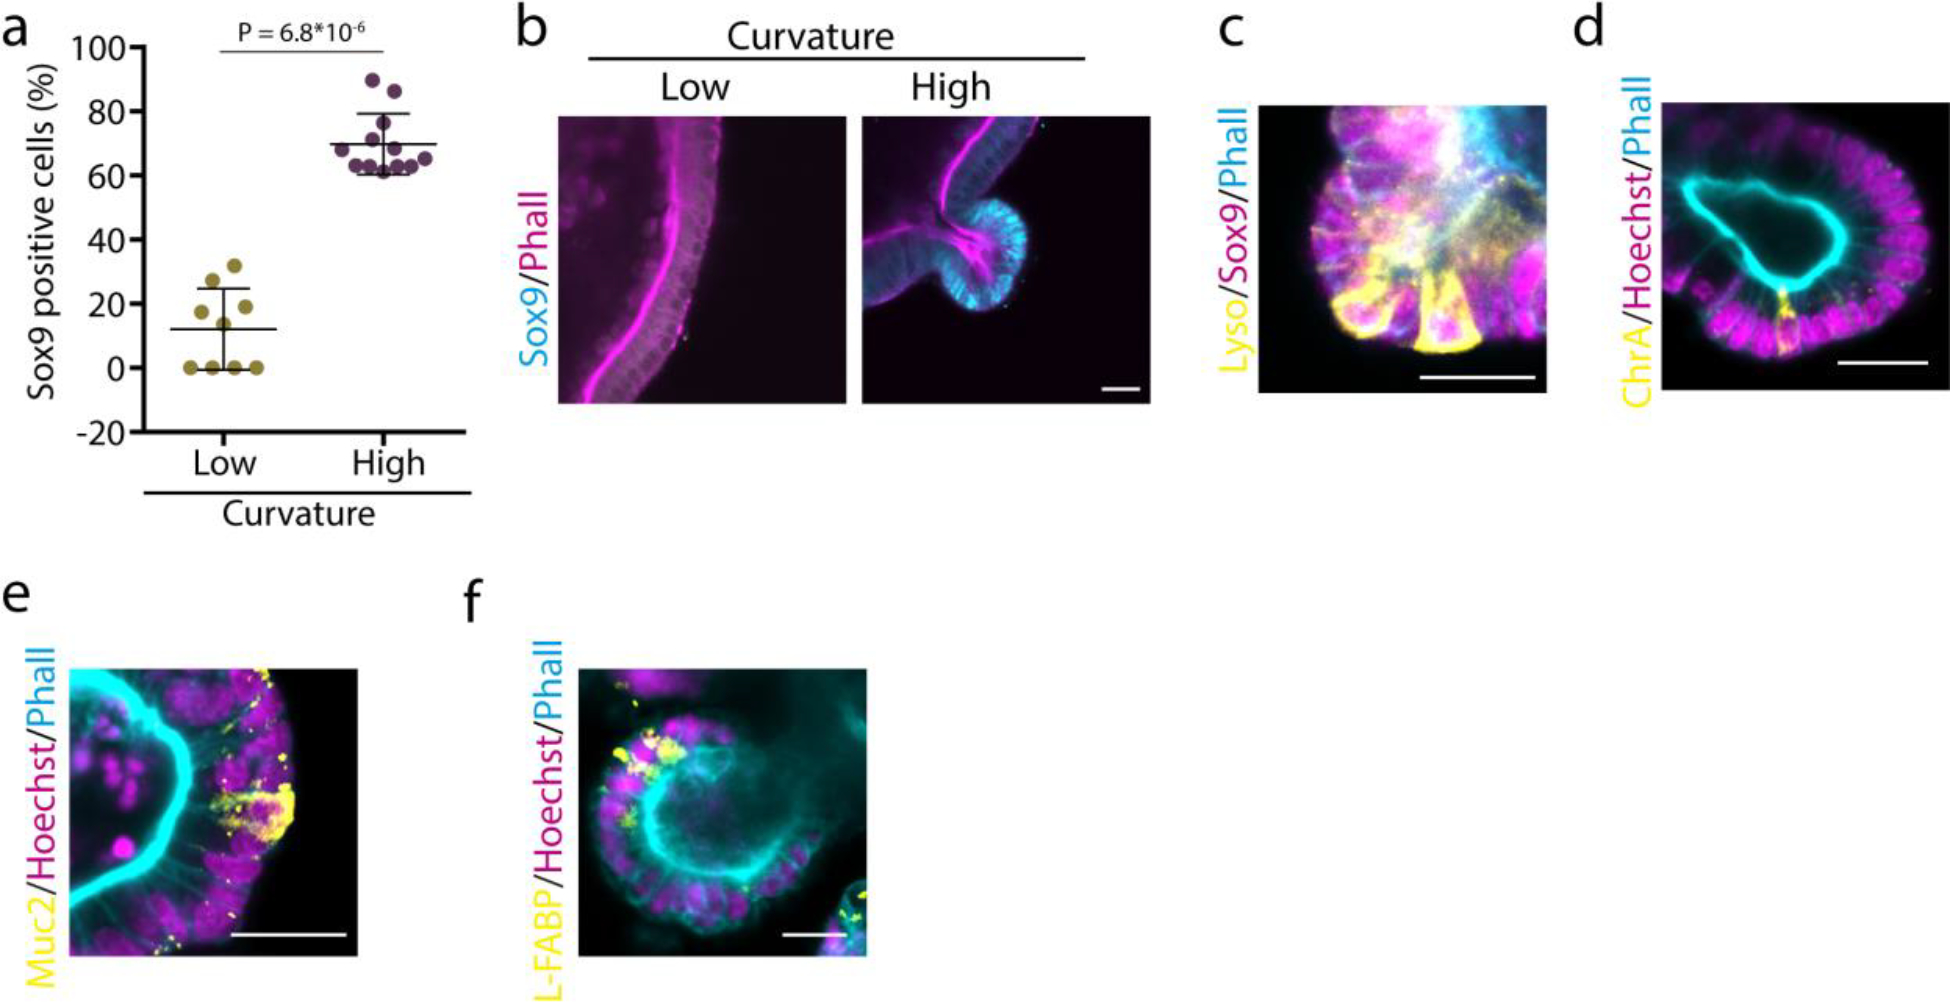
a, Quantification of the percentage of Sox9 positive cells in low and high curvature areas in organoids. n=9,12 images per condition. Statistical analysis was performed using two-sided Mann-Whitney U-test. b, Representative examples. c, Organoid buds have lysozyme positive cells intercalated in between Sox9 positive cells (n= 15 images). d-f, Organoids cultured in interpenetrating networks contain also (d) enteroendocrine (n= 7 images), (e) goblet cells (n=8 images) and (f) enterocytes (n= 5 images). Data represent mean ± s.d. Scale bars are 20 μm.
Supplementary Material
Acknowledgments:
Thanks to Miguel Sobral, Maxence Dellacherie, Junzhe Lou, Marina Uroz and all the members of the Mooney lab for helpful discussions and comments on the manuscript. This work was supported by funding from the Wellcome Leap HOPE Program (D.J.M). This project has received funding from the European Research Council (ERC) under the European Union’s Horizon 2020 research and innovation programme (grant agreement No 851055) (A.E.-A.). A.E.-A. received funding for this work from the European Union’s Horizon 2020 research and innovation programme through a Marie Sklodowska-Curie grant agreement no. 798504 (MECHANOSITY). A.J.N. acknowledges a Graduate Research Fellowship from the National Science Foundation. This work was partly supported by funding (R01 DK125817 and Tri-SCI grant) to QZ. I.d.L. was supported by the National Cancer Institute of the National Institutes of Health under award no. U01CA214369. The content is solely the responsibility of the authors and does not necessarily represent the official views of the National Institutes of Health.
Footnotes
Competing Interests Statement
There are no conflicts to declare. The views and opinions expressed in this article are those of the authors and do not necessarily reflect the position of the Wyss Institute for Biologically Inspired Engineering at Harvard University.
References
- 1.Paszek MJ et al. Tensional homeostasis and the malignant phenotype. Cancer cell 8, 241–254 (2005). [DOI] [PubMed] [Google Scholar]
- 2.Sato T et al. Single Lgr5 stem cells build crypt-villus structures in vitro without a mesenchymal niche. Nature 459, 262–265 (2009). [DOI] [PubMed] [Google Scholar]
- 3.Moris N et al. An in vitro model of early anteroposterior organization during human development. Nature 582, 410–415 (2020). [DOI] [PubMed] [Google Scholar]
- 4.Hannezo E & Simons BD Multiscale dynamics of branching morphogenesis. Current opinion in cell biology 60, 99–105 (2019). [DOI] [PubMed] [Google Scholar]
- 5.Nelson CM On Buckling Morphogenesis. Journal of Biomechanical Engineering 138 (2016). [DOI] [PMC free article] [PubMed] [Google Scholar]
- 6.Briggs JA et al. The dynamics of gene expression in vertebrate embryogenesis at single-cell resolution. Science 360 (2018). [DOI] [PMC free article] [PubMed] [Google Scholar]
- 7.Hannezo E & Heisenberg CP Mechanochemical Feedback Loops in Development and Disease. Cell 178, 12–25 (2019). [DOI] [PubMed] [Google Scholar]
- 8.Green JB & Sharpe J Positional information and reaction-diffusion: two big ideas in developmental biology combine. Development 142, 1203–1211 (2015). [DOI] [PubMed] [Google Scholar]
- 9.Chan CJ et al. Hydraulic control of mammalian embryo size and cell fate. Nature 571, 112–116 (2019). [DOI] [PubMed] [Google Scholar]
- 10.Nelson CM et al. Microfluidic chest cavities reveal that transmural pressure controls the rate of lung development. Development 144, 4328–4335 (2017). [DOI] [PMC free article] [PubMed] [Google Scholar]
- 11.Shyer AE, Huycke TR, Lee C, Mahadevan L & Tabin CJ Bending gradients: how the intestinal stem cell gets its home. Cell 161, 569–580 (2015). [DOI] [PMC free article] [PubMed] [Google Scholar]
- 12.Harris AR et al. Characterizing the mechanics of cultured cell monolayers. Proceedings of the National Academy of Sciences of the United States of America 109, 16449–16454 (2012). [DOI] [PMC free article] [PubMed] [Google Scholar]
- 13.Barriga EH, Franze K, Charras G & Mayor R Tissue stiffening coordinates morphogenesis by triggering collective cell migration in vivo. Nature 554, 523–527 (2018). [DOI] [PMC free article] [PubMed] [Google Scholar]
- 14.Thompson AJ et al. Rapid changes in tissue mechanics regulate cell behaviour in the developing embryonic brain. Elife 8 (2019). [DOI] [PMC free article] [PubMed] [Google Scholar]
- 15.Chaudhuri O, Cooper-White J, Janmey PA, Mooney DJ & Shenoy VB Effects of extracellular matrix viscoelasticity on cellular behaviour. Nature 584, 535–546 (2020). [DOI] [PMC free article] [PubMed] [Google Scholar]
- 16.Elosegui-Artola A The extracellular matrix viscoelasticity as a regulator of cell and tissue dynamics. Current opinion in cell biology 72, 10–18 (2021). [DOI] [PubMed] [Google Scholar]
- 17.Heisenberg CP & Bellaiche Y Forces in tissue morphogenesis and patterning. Cell 153, 948–962 (2013). [DOI] [PubMed] [Google Scholar]
- 18.Debnath J, Muthuswamy SK & Brugge JS Morphogenesis and oncogenesis of MCF-10A mammary epithelial acini grown in three-dimensional basement membrane cultures. Methods 30, 256–268 (2003). [DOI] [PubMed] [Google Scholar]
- 19.Lee KY & Mooney DJ Alginate: properties and biomedical applications. Progress in polymer science 37, 106–126 (2012). [DOI] [PMC free article] [PubMed] [Google Scholar]
- 20.Chaudhuri O et al. Hydrogels with tunable stress relaxation regulate stem cell fate and activity. Nature materials 15, 326–334 (2016). [DOI] [PMC free article] [PubMed] [Google Scholar]
- 21.Rowley JA, Madlambayan G & Mooney DJ Alginate hydrogels as synthetic extracellular matrix materials. Biomaterials 20, 45–53 (1999). [DOI] [PubMed] [Google Scholar]
- 22.Elosegui-Artola A et al. Mechanical regulation of a molecular clutch defines force transmission and transduction in response to matrix rigidity. Nature cell biology 18, 540–548 (2016). [DOI] [PubMed] [Google Scholar]
- 23.Lee JY et al. YAP-independent mechanotransduction drives breast cancer progression. Nature communications 10, 1848 (2019). [DOI] [PMC free article] [PubMed] [Google Scholar]
- 24.Yang J et al. Guidelines and definitions for research on epithelial-mesenchymal transition. Nature reviews. Molecular cell biology (2020). [DOI] [PMC free article] [PubMed] [Google Scholar]
- 25.Taubenberger AV et al. 3D Microenvironment Stiffness Regulates Tumor Spheroid Growth and Mechanics via p21 and ROCK. Advanced Biosystems 3, 1900128 (2019). [DOI] [PubMed] [Google Scholar]
- 26.Wang C, Tong X & Yang F Bioengineered 3D brain tumor model to elucidate the effects of matrix stiffness on glioblastoma cell behavior using PEG-based hydrogels. Mol Pharm 11, 2115–2125 (2014). [DOI] [PubMed] [Google Scholar]
- 27.Saffman PG & Taylor GI The penetration of a fluid into a porous medium or Hele-Shaw cell containing a more viscous liquid. Proceedings of the Royal Society of London. Series A. Mathematical and Physical Sciences 245, 312–329 (1958). [Google Scholar]
- 28.Biggins JS, Saintyves B, Wei Z, Bouchaud E & Mahadevan L Digital instability of a confined elastic meniscus. Proceedings of the National Academy of Sciences of the United States of America 110, 12545–12548 (2013). [DOI] [PMC free article] [PubMed] [Google Scholar]
- 29.Shaebani MR, Wysocki A, Winkler RG, Gompper G & Rieger H Computational models for active matter. Nature Reviews Physics 2, 181–199 (2020). [Google Scholar]
- 30.Berthier L & Kurchan J Non-equilibrium glass transitions in driven and active matter. Nature Physics 9, 310–314 (2013). [Google Scholar]
- 31.Lee H. p. et al. The nuclear piston activates mechanosensitive ion channels to generate cell migration paths in confining microenvironments. Science Advances 7, eabd4058 (2021). [DOI] [PMC free article] [PubMed] [Google Scholar]
- 32.Nam S et al. Cell cycle progression in confining microenvironments is regulated by a growth-responsive TRPV4-PI3K/Akt-p27(Kip1) signaling axis. Sci Adv 5, eaaw6171 (2019). [DOI] [PMC free article] [PubMed] [Google Scholar]
- 33.Ulrich TA, de Juan Pardo EM & Kumar S The mechanical rigidity of the extracellular matrix regulates the structure, motility, and proliferation of glioma cells. Cancer research 69, 4167–4174 (2009). [DOI] [PMC free article] [PubMed] [Google Scholar]
- 34.Chaudhuri O et al. Extracellular matrix stiffness and composition jointly regulate the induction of malignant phenotypes in mammary epithelium. Nature materials 13, 970–978 (2014). [DOI] [PubMed] [Google Scholar]
- 35.Gjorevski N et al. Designer matrices for intestinal stem cell and organoid culture. Nature 539, 560–564 (2016). [DOI] [PubMed] [Google Scholar]
- 36.Deglincerti A et al. Self-organization of the in vitro attached human embryo. Nature 533, 251–254 (2016). [DOI] [PubMed] [Google Scholar]
- 37.Friedl P, Locker J, Sahai E & Segall JE Classifying collective cancer cell invasion. Nature cell biology 14, 777–783 (2012). [DOI] [PubMed] [Google Scholar]
- 38.Lamalice L, Le Boeuf F & Huot J Endothelial cell migration during angiogenesis. Circ Res 100, 782–794 (2007). [DOI] [PubMed] [Google Scholar]
- 39.Spurlin JW et al. Mesenchymal proteases and tissue fluidity remodel the extracellular matrix during airway epithelial branching in the embryonic avian lung. Development 146 (2019). [DOI] [PMC free article] [PubMed] [Google Scholar]
- 40.Tetley RJ et al. Tissue fluidity promotes epithelial wound healing. Nature Physics 15, 1195–1203 (2019). [DOI] [PMC free article] [PubMed] [Google Scholar]
- 41.Mongera A et al. A fluid-to-solid jamming transition underlies vertebrate body axis elongation. Nature 561, 401–405 (2018). [DOI] [PMC free article] [PubMed] [Google Scholar]
- 42.Kuriyama S et al. In vivo collective cell migration requires an LPAR2-dependent increase in tissue fluidity. The Journal of cell biology 206, 113–127 (2014). [DOI] [PMC free article] [PubMed] [Google Scholar]
- 43.Streitberger KJ et al. How tissue fluidity influences brain tumor progression. Proceedings of the National Academy of Sciences of the United States of America 117, 128–134 (2020). [DOI] [PMC free article] [PubMed] [Google Scholar]
- 44.Sinkus R et al. Viscoelastic shear properties of in vivo breast lesions measured by MR elastography. Magnetic resonance imaging 23, 159–165 (2005). [DOI] [PubMed] [Google Scholar]
- 45.Shahryari M et al. Tomoelastography distinguishes non-invasively between benign and malignant liver lesions. Cancer research, canres.2150.2019 (2019). [DOI] [PubMed] [Google Scholar]
- 46.Nematbakhsh Y, Pang KT & Lim CT Correlating the viscoelasticity of breast cancer cells with their malignancy. Convergent Science Physical Oncology 3, 034003 (2017). [Google Scholar]
- 47.Palamidessi A et al. Unjamming overcomes kinetic and proliferation arrest in terminally differentiated cells and promotes collective motility of carcinoma. Nature materials 18, 1252–1263 (2019). [DOI] [PubMed] [Google Scholar]
- 48.Han YL et al. Cell swelling, softening and invasion in a three-dimensional breast cancer model. Nature Physics 16, 101–108 (2020). [DOI] [PMC free article] [PubMed] [Google Scholar]
- 49.Staneva R et al. Cancer cells in the tumor core exhibit spatially coordinated migration patterns. Journal of cell science 132 (2019). [DOI] [PubMed] [Google Scholar]
- 50.Monslow J, Govindaraju P & Puré E Hyaluronan – A Functional and Structural Sweet Spot in the Tissue Microenvironment. Frontiers in immunology 6 (2015). [DOI] [PMC free article] [PubMed] [Google Scholar]
Associated Data
This section collects any data citations, data availability statements, or supplementary materials included in this article.


