Background:
A new approach to showcasing author publications on a website involves using a visual representation instead of the conventional paper list. The creation of an impact beam plot (IBP) as a research profile for individuals is crucial, especially when incorporating collection edges that include self-cited articles through a rare cluster analysis technique not commonly found in the literature. This study presents the application of a unique method called the following-leading clustering algorithm (FLCA) to generate IBPs for 3 highly productive authors.
Methods:
For the 3 highly productive authors, Sung-Ho Jang from South Korea, Chia-Hung Kao from Taiwan, and Chin-Hsiao Tseng from Taiwan, all their published articles indexed in the Web of Science Core Collection were downloaded. Sung-Ho Jang published 593 articles, Chia-Hung Kao published 732 articles, and Chin-Hsiao Tseng published 160 articles. To analyze and showcase their publications, the FLCA was utilized. This algorithm helped cluster their articles and identify representative publications for each author. To assess the effectiveness and validity of the FLCA algorithm, both network charts and heatmaps with dendrograms were employed. IBPs were then created and compared for each of the 3 authors, taking into consideration their h-index, x-index, and self-citation rate. This allowed for a comprehensive visual representation of their research impact and citation patterns.
Results:
The results show that these authors’ h-index, x-index, and self-citation rates were (37, 44.01, 1.66%), (42, 61.47, 0.23%), and (37, 40.3, 6.62%), respectively. A higher value in these metrics indicates a more remarkable research achievement. A higher self-citation rate with a lower cluster number indicates that manuscripts are more likely to have been self-drafted. Using the FLCA algorithm, IBPs were successfully generated for each author.
Conclusion:
The FLCA algorithm allows for the easy generation of visual IBPs based on authors’ publication profiles. These IBPs incorporate 3 important bibliometric metrics: h-index, x-index, and self-citations. These metrics are highly recommended for use by researchers globally, particularly with the self-citation rate, as they offer valuable insights into the scholarly impact and citation patterns of individual researchers.
Keywords: bibliometric analysis, follower-leading clustering algorithm, h-index, impact beam plot, research profile, x-index. self-citation rate
Key Points:
A novel approach to showcasing author publications on impact beam plots (IBPs) is introduced. This is different from conventional paper lists, providing more information to readers, particularly with the self-citation rate to represent manuscripts that are more likely to have been self-drafted.
The study presents the application of the FLCA to generate IBPs for 3 highly productive authors. The cluster number represents more author collaborations but few manuscripts that were self-drafted.
The research highlights the importance of 3 key bibliometric metrics—the h-index, x-index, and self-citation rate—within IBPs. These metrics provide valuable insights into the researchers’ scholarly achievements, with higher values indicating greater research impact.
1. Introduction
A researcher profile refers to a comprehensive representation of a researcher professional background, achievements, and contributions within their respective field of study.[1] It typically includes information such as their educational qualifications, research interests, publications (i.e., researcher profile), collaborations, grants received, and professional affiliations.[2]
A researcher profile serves as a summary or snapshot of a researcher career and provides insights into their expertise, areas of specialization, and impact within the academic community.[3] These profiles are commonly used for networking, collaboration opportunities, evaluating scholarly contributions, and establishing a researcher credibility and reputation.[4] To date, however, manuscripts that are more likely to be self-drafted have not been detected and analyzed.
1.1. Author impact beam plots (IBPs) should be enhanced
While the introduction of author IBPs in Web of Science author records[5] has allowed for the visualization of individual authors’ research profiles, there is still room for further improvements. Specifically, researchers who wish to showcase their own publications should have a more streamlined and user-friendly approach.[6] This would involve providing direct links and options for researchers to easily present their work without overwhelming readers with unnecessary details.[7,8] The ideal aim is to keep the process as simple and accessible as possible for researchers seeking to share their publications effectively. However, in recent years (i.e., IBP launched in 2021[9]), there has been a scarcity of research focused specifically on the enhancement of IBPs.
The conventional IBPs possess distinct characteristics,[5–9] which include each article is represented by a dot on the plot, the rows correspond to publication years, while the columns represent normalized citations, ranging from 0% to 100% based on the research discipline, and by clicking on a dot, the associated article can be accessed and read online. The improved version of IBPs is anticipated to offer a more comprehensive research profile by incorporating additional information such as h-index and x-index,[10–13] self-citation rate,[14] citation network along with article clusters (e.g., timezone view on cooccurrence status of the keywords in the elite controller field[15] and landscape view of cocited reference cluster analysis[16] produced by CiteSpace software[17]), and the representative article denoted by the weighted centrality degree (WCD)[18] among citing and cited articles (e.g., dual-map overlay of journals[19] using CiteSpace software[17]). These enhancements aim to provide readers with important and meaningful insights into the researcher impact, self-citation patterns, and thematic clusters of their publications at a glance.
1.2. A more comprehensive IBP is anticipated
Bibliometric indices play a crucial role in assessing authors’ individual research achievements (IRAs) in modern research evaluation.[14] These metrics, such as publication count, citation count, h-index, m-quotient, hc-index, e-index, g-index, and i-10 [i-n] index, are employed to evaluate authors, along with journal-based metrics such as impact factor, Eigenfactor, article influence score, SCImago journal rank, and source-normalized impact per article.[20] Among these metrics, the widely recognized h-index, proposed in 2005,[10] has gained prominence as a simple and convenient measure to describe the IRA of a researcher, denoting the maximum number h of publications with at least h citations throughout their career.
In contrast, the x-index introduced in 2018[11] utilizes the maximum area under the curve to interpret authors’ IRAs. Therefore, we assume that both the h-index and x-index are suitable for evaluating IRAs.
The self-citation rate[14] has been discussed in numerous articles,[21] yet studies investigating the capability of authors to self-cite in their own manuscripts remain scarce. The lack of research can be attributed to the unwillingness of renowned (or, say, honored) authors to actively participate in manuscript drafting (resulting in no possibility to cite their own work). Additionally, esteemed authors tend to engage in diverse and extensive collaborations within their research endeavors. It is worth exploring whether the self-citation rate can provide readers with additional insights into these collaborative patterns (e.g., more clusters in their articles). This study aims to examine the potential of the self-citation rate as a metric to uncover such information. The premise is to develop a clustering algorithm that can identify articles in diverse and extensive collaborations within their research endeavors.
1.3. Ideas from the time zone view and landscape view in CiteSpace
Citation networks have been instrumental in identifying article clusters, as demonstrated by the time zone view on the co-occurrence status of keywords in the elite controller field[15] and the landscape view of cocited reference cluster analysis[16] generated using CiteSpace software.[17] By incorporating citation links between articles, similar to those observed in the time zone and landscape views, the enhanced IBP can showcase representative articles based on WCD,[18] along with the computation of self-citation rates. This study is motivated by the desire to conceive an improved IBP that integrates citation networks, providing a more comprehensive and informative visual representation of research impact.
1.4. Study aims
This study presents the application of the innovative following-leading clustering algorithm (FLCA) to generate IBPs for highly productive authors. Three main objectives are outlined for this research: the development of the FLCA method, the demonstration of enhanced IBP visualization, and the investigation of the relationship between higher self-citation rates and a lower cluster number in manuscripts that are more likely to have been self-drafted.
2. Methods
We downloaded 1485 abstracts from the Web of Science core collection authored by 3 productive authors.[22] One author, Chin-Hsiao Tseng (Taiwan), published 114 sole-author articles.[23,24] Another productive author was Chia-Hung Kao (Taiwan), who published 149 papers in 2015.[24,25] The third was Sung-Ho Jang (South Korea), who published 61 articles in Medicine (Baltimore).[22]
In total, Sung-Ho Jang published 593 articles, Chia-Hung Kao published 732 articles, and Chin-Hsiao Tseng published 160 articles.
As all data deposited in Supplemental Digital Content 1, http://links.lww.com/MD/J253 were obtained from a publicly available database (Web of Science Core Collection), this study did not require ethical approval.
2.1. Goal 1: To develop the FLCA algorithm
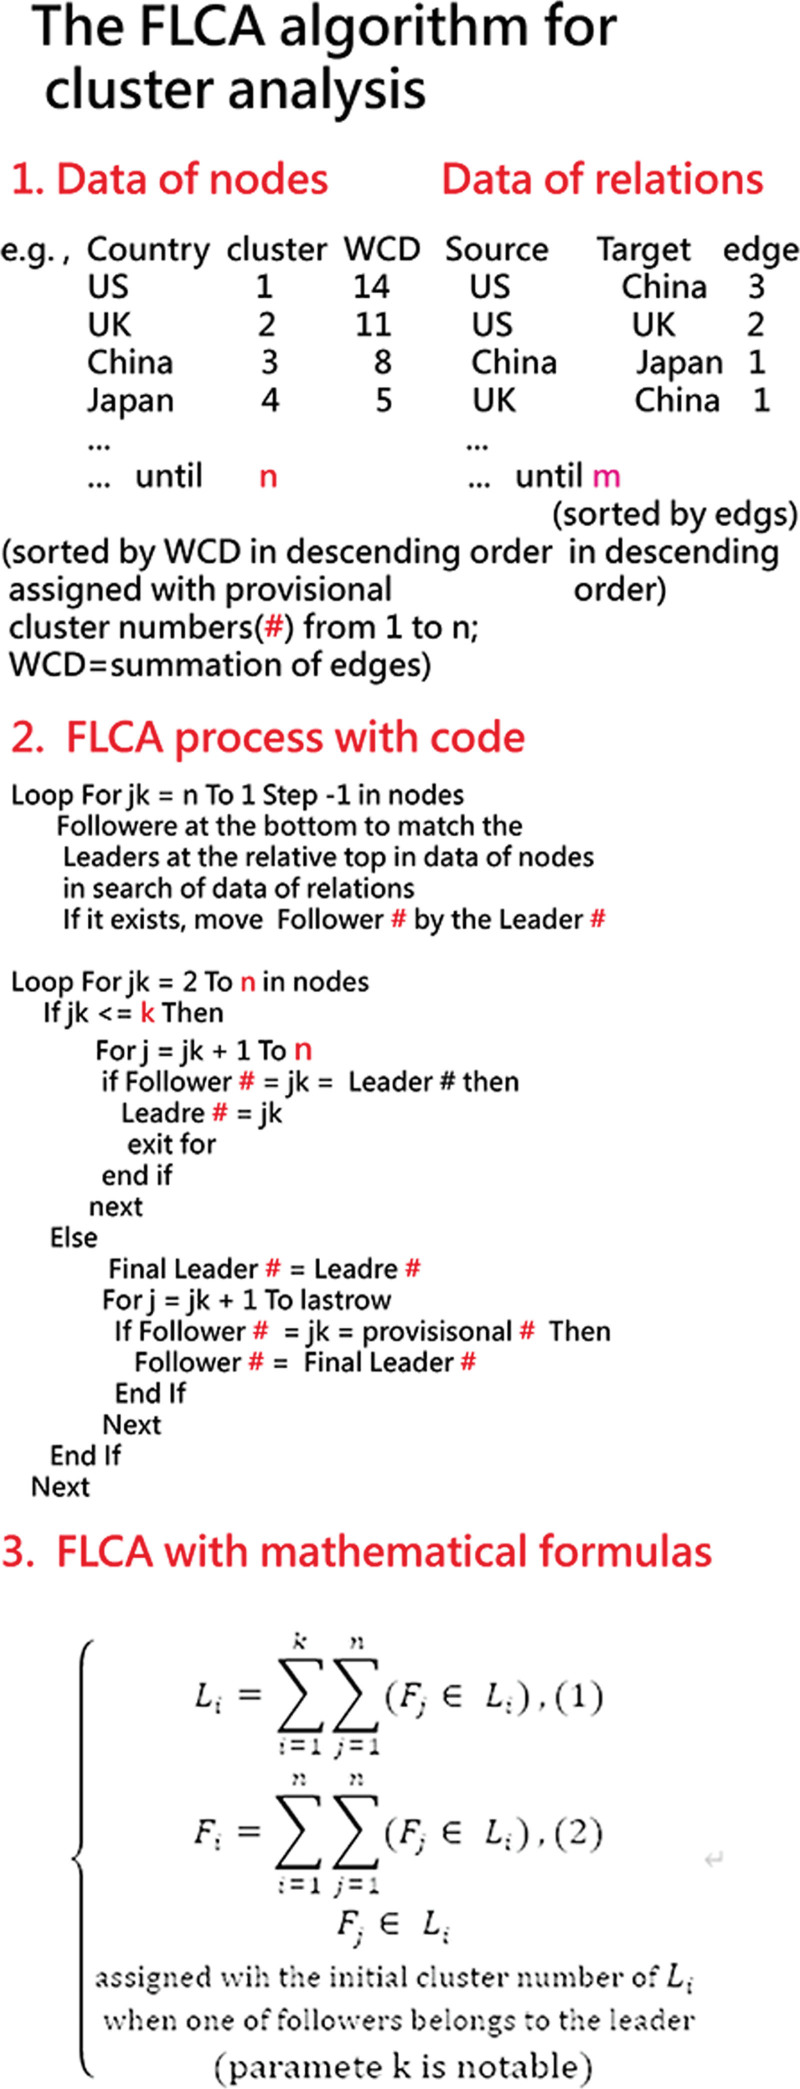
Bibliometric datasets consist of 2 main components: vertex features and edges representing connections between vertices. In this study, a WCD score is calculated for each vertex based on the summation of its edges. The 2 datasets are separately sorted by WCD and edges.[18] Each vertex is assigned a number from 1 to n, where n is the number of vertices, as depicted in the top panel of Figure 1.
Figure 1.
Interpreting the FLCA algorithm by visual displays. FLCA = following-leading clustering algorithm.
Next, starting from vertex n, each follower (with lower WCD than its leader) is assigned a cluster number (#) based on its maximum edge connection with a potential leader who has a higher WCD. Then, starting from vertex 1 to n, each vertex includes its members into the cluster# determined in the previous step, as illustrated in the middle panel of Figure 1.
It is important to determine the parameter k, which indicates the tendency toward more cluster numbers in the network, as shown in the bottom panel of Figure 1. This clustering process can be compared to a child leaving their parents for a new family with a girlfriend or boyfriend after reaching the age of 20.
It is important to highlight that varying the value of k can result in different cluster patterns, and the presence of self-connections in the network (where a vertex is connected to itself) can also affect the order of vertices from 1 to n.
Nonetheless, the parameter k can be known by simulating the absolute advantage coefficient (ACC shown in Eqs. 3–5)[26,27] as low as possible, based on the rule that equal cluster members are appropriate at large.
AAC = (R12/R23)/(1 + (R12/R23)), (3)
R12 = A1/A2, (4)
R23 = A2/A3, (5)
where the AAC ratio is determined by the 3 consecutive numbers of values (e.g., the member number in each cluster in descending order denoted by A1, A2, and A3 in Eqs. 4 and 5). The ACC ranged from 0 to 1.0, representing the strength of dominance for the top member when compared to the next 2 members. For simplification in computation of AAC, A2 and a3 are assigned to 1.0 if the cluster number is 1. A3 is assigned to 1.0 if the cluster number is 2.
2.2. Goal 2: To enhance IBP visualization
Two parts are involved in this section, including how to verify the feasibility of the FLCA algorithm[28] and how to draw the IBP.[29] When the user selects which graph to draw and inputs the data in the appropriate format, the platform generates R code.[30] Simply pasting the R code into R will create the desired graph. If adjustments are needed for font size and color, they can be easily made by modifying the parameters (see video tutorial[28]).
Next, the IBP can be drawn with an appropriate data format. The details are presented in the video tutorial.[29] The 3 metrics of h-/x-indices and self-citation rates were compared for the 3 prolific authors using a scatter plot with 95% control lines.[31]
2.3. Goal 3: To investigate the phenomenon of self-citation rates
Verification is needed to determine whether the self-citation rate can offer readers additional insights into citation analysis, such as the presence of more clusters in their articles and lower self-citation rates, indicating a potential likelihood that the manuscripts were not self-drafted.
2.4. Drawing software and packages
This study incorporates various graphical representations, including network charts, heatmaps with dendrograms, IBPs, box charts, and a scatter plot with 95% control lines.[31] These visuals were generated using custom online modules developed by the authors.[30] Additionally, 2 videos have been made available for readers, accessible through the provided links.[28,29]
3. Results
3.1. To verify the feasibility of the FLCA algorithm
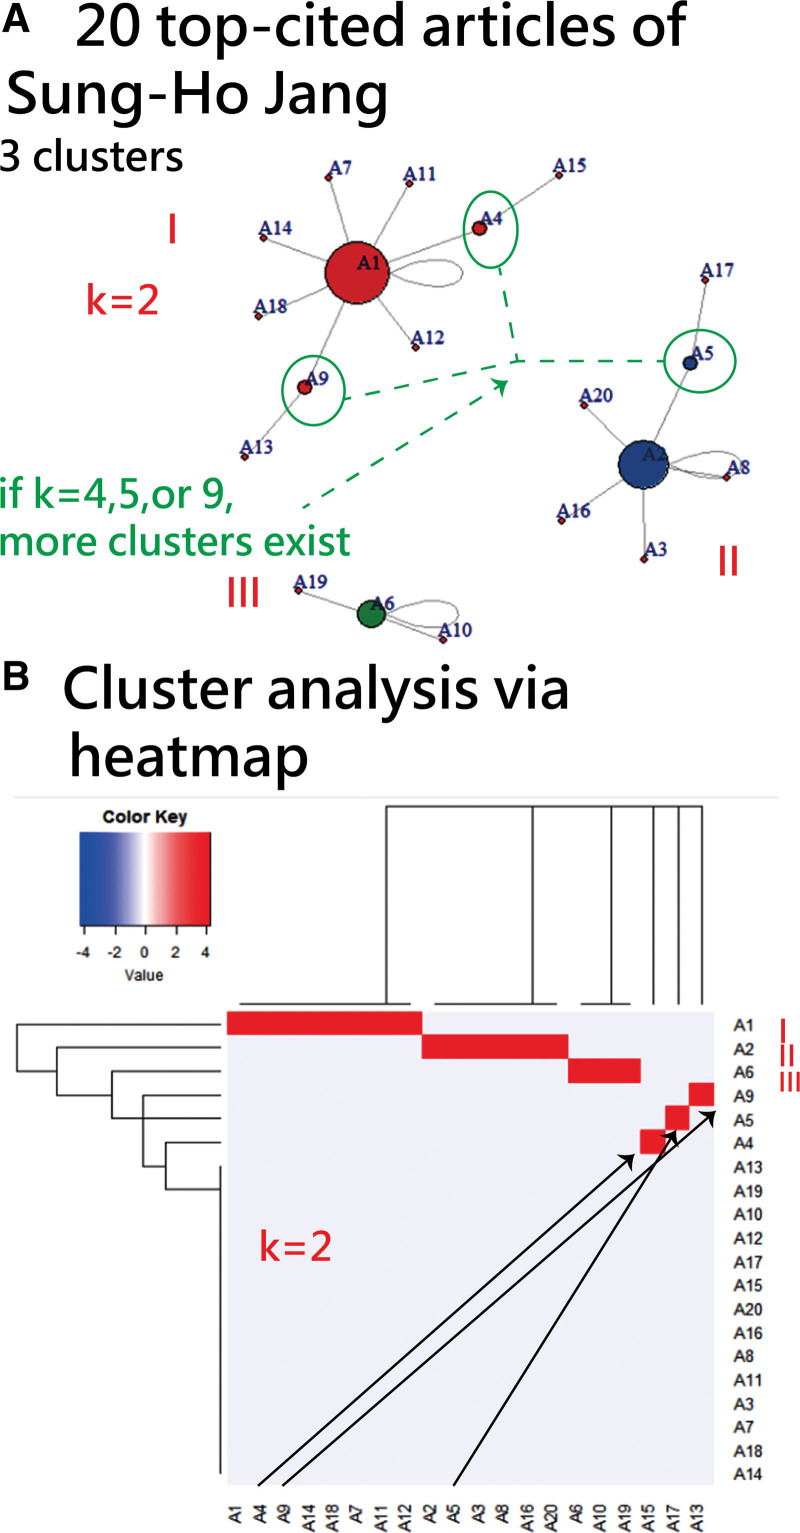
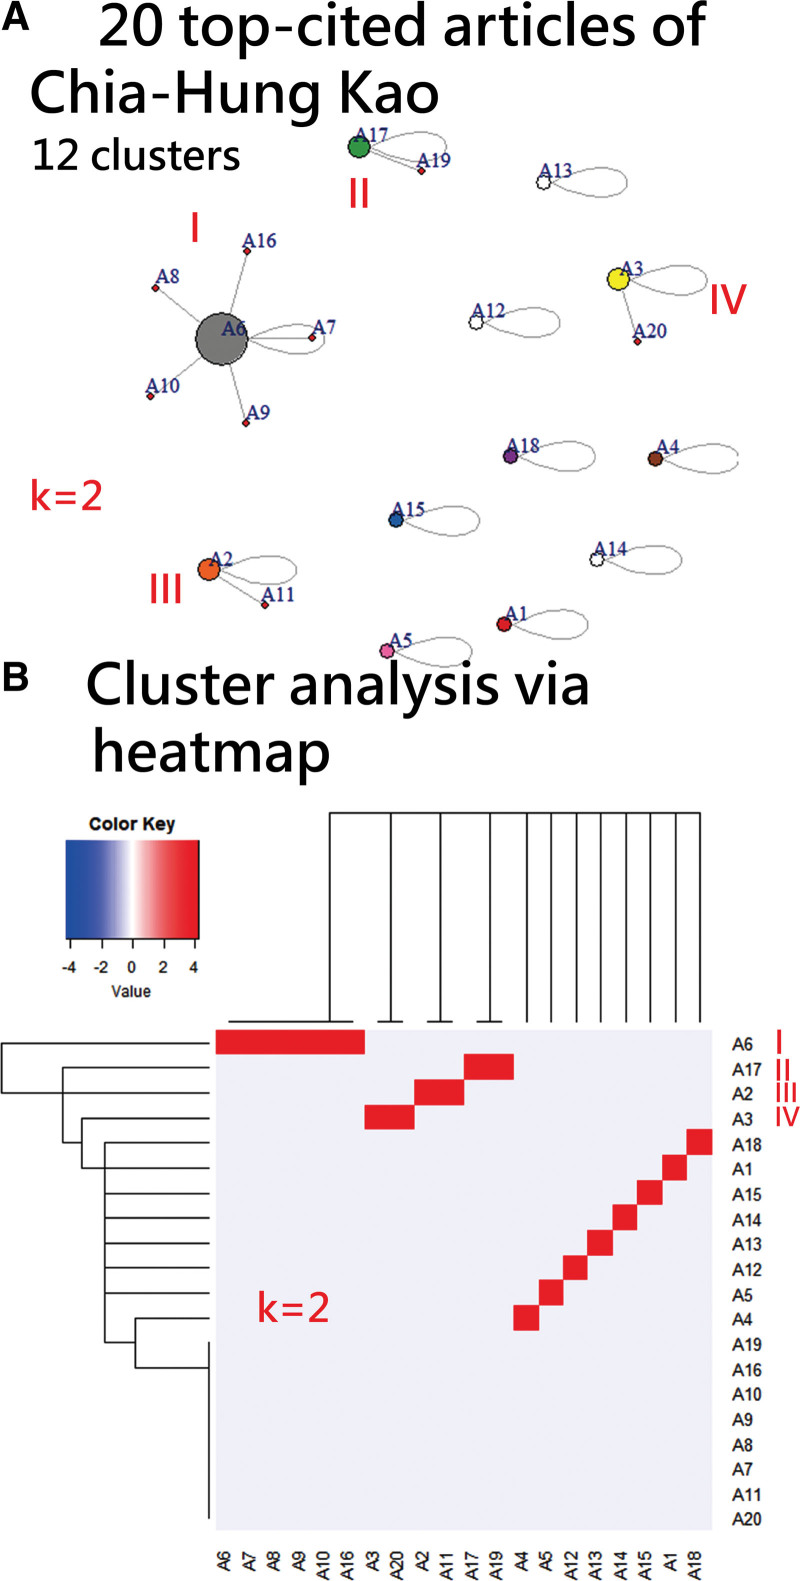
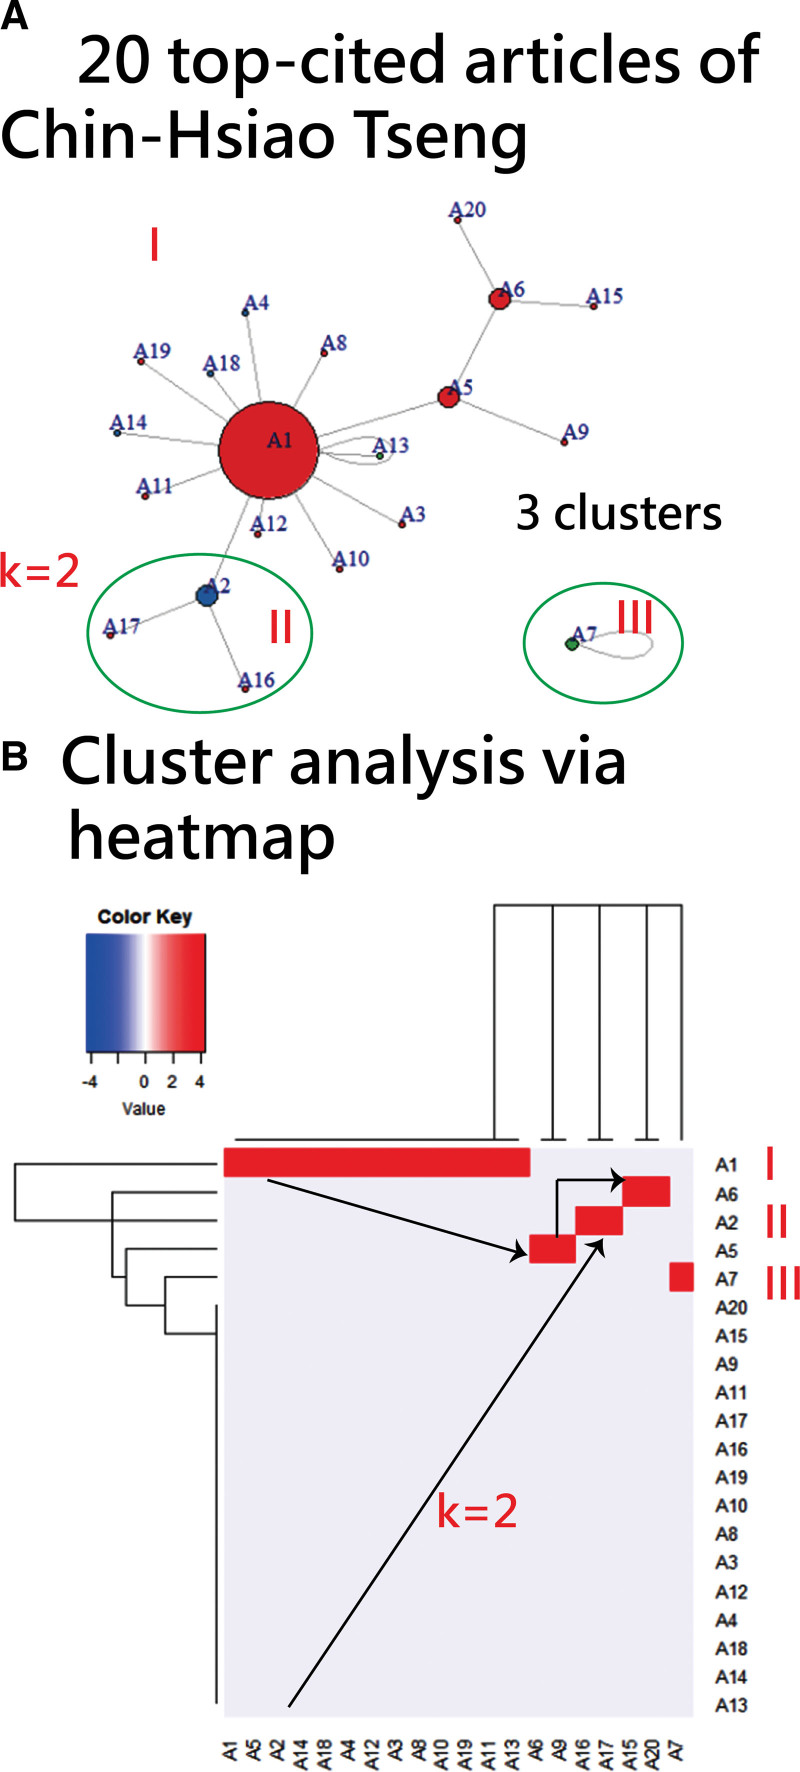
The effectiveness of the FLCA algorithm was assessed by examining the top-cited articles for each author, with 20 articles considered for each and parameter k set at 2. The results revealed the presence of 3 clusters in the articles authored by Dr Jang and Dr Tseng, while Dr Kao articles exhibited twelve clusters (as depicted in the top panels of Figs. 2, 3, and 4). Further analysis utilizing the heatmaps combined with dendrograms in the bottom panels of Figures 2, 3, and 4 indicated that certain associations could not be merged together when compared to the outcomes obtained through the FLCA algorithm.
Figure 2.
20 top-cited articles authored by Sung-Ho Jang using cluster analysis.
Figure 3.
20 top-cited articles authored by Chia-Hung Kao using cluster analysis.
Figure 4.
20 top-cited articles authored by Chin-Hsiao Tseng using cluster analysis.
3.2. To demonstrate the application of the FLCA algorithm
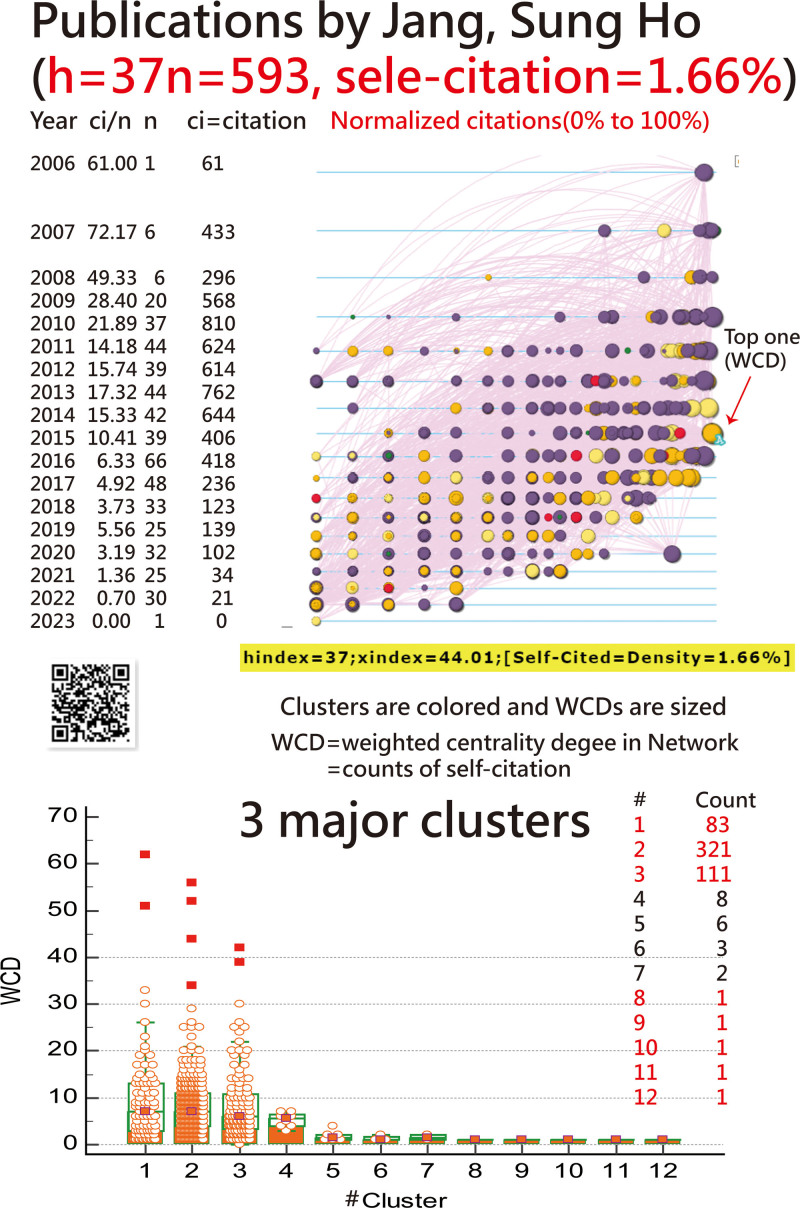
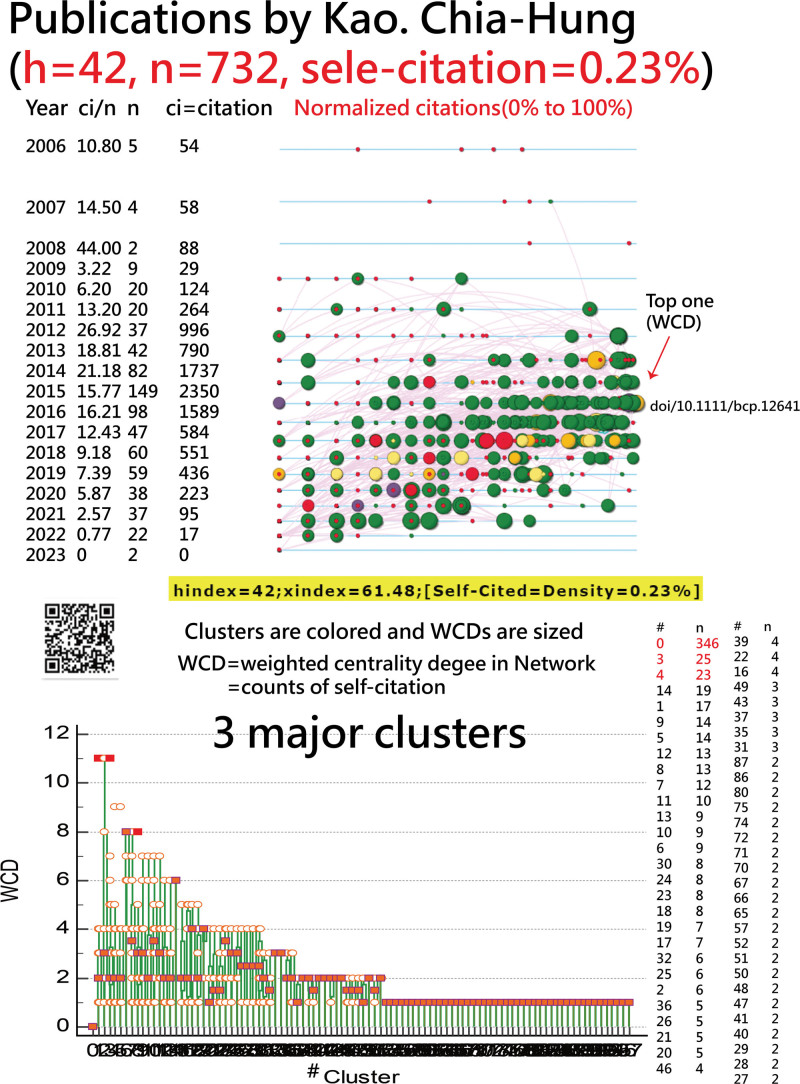
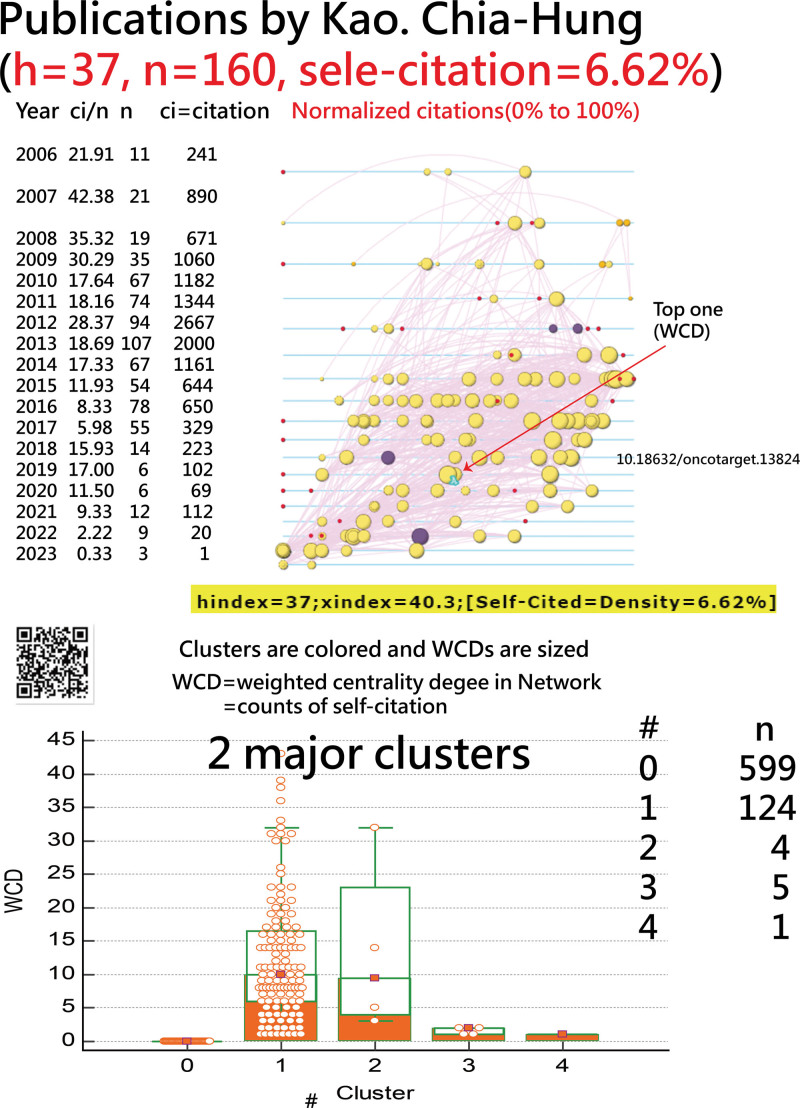
The findings reveal that the authors’ h-index, x-index, and self-citation rates are as follows: {37, 44.01, 1.66%} for Dr Jang, {42, 61.47, 0.23%} for Dr Kao, and {37, 40.3, 6.62%} for Dr Tseng; see Figures 5, 6, and 7.
Figure 5.
Publication authored by Sung-Ho Jang on IBP. IBP = impact beam plot.
Figure 6.
Publication authored by Chia-Hung Kao on IBP. IBP = impact beam plot.
Figure 7.
Publication authored by Chin-Hsiao Tseng on IBP. IBP = impact beam plot.
Three representative articles,[32–35] with the highest WCD in the network, have been highlighted in each author IBP. These articles are denoted by signal A in the IBPs. Readers are encouraged to scan the provided QR codes and access the articles online for further reading.
3.3. To investigate the phenomenon of self-citation rates
A higher self-citation rate coupled with a lower cluster number suggests a higher likelihood of self-drafted manuscripts. Conversely, a lower self-citation rate combined with a higher cluster number indicates a lower possibility of self-drafted manuscripts. This pattern is observed in the case of the 2 other authors mentioned in the provided links,[35,36] who exhibit self-citation rates of 1.47% and 9.51%, respectively.
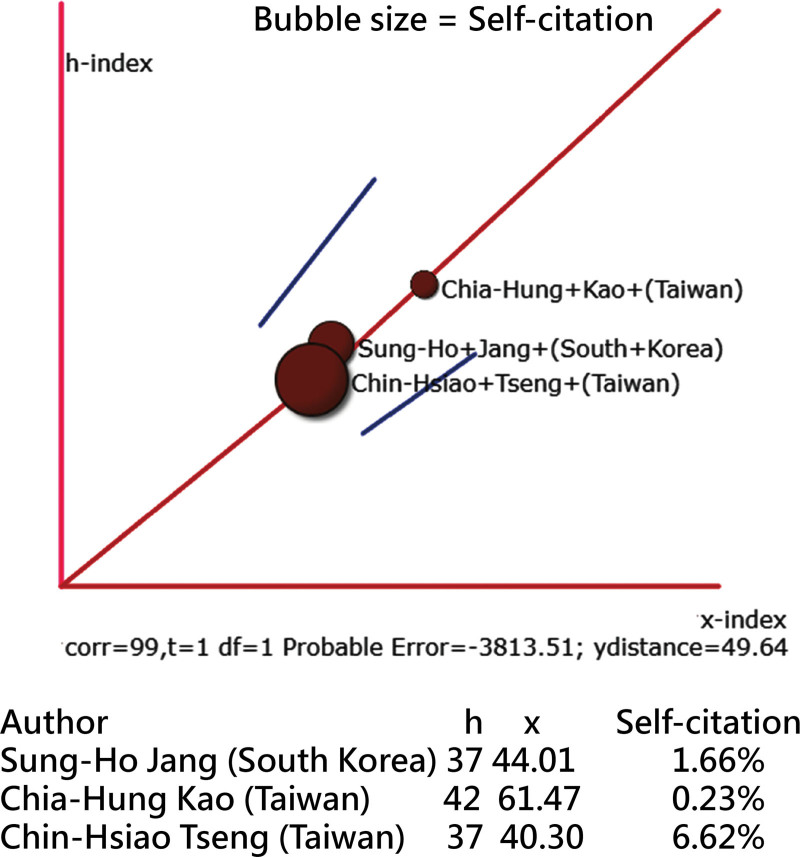
The 3 metrics of the h-index, x-index, and self-citation rates are represented on the scatter plot with 95% control lines.[31] It is evident from the plot that there is a strong correlation between the h-index and x-index (Fig. 8). Dr Kao has the highest h-index (=42), followed by Dr Jang (=37) and Dr Tseng (=37). In terms of the self-citation rate, Dr Kao has the lowest rate (=0.23%), while Dr Jang has a slightly higher rate (=1.66%). Notably, Dr Tseng, who has a significant number of single-author articles, exhibits the highest self-citation rate (=6.62%).
Figure 8.
Comparison of research achievements among the 3 prolific authors.
4. Discussion
4.1. Principal findings
The findings reveal that the authors’ h-index, x-index, and self-citation rates are as follows: {37, 44.01, 1.66%} for the first author, {42, 61.47, 0.23%} for the second author, and {37, 40.3, 6.62%} for the third author. Higher values in these metrics signify significant research achievements. Moreover, a higher self-citation rate coupled with a lower cluster number suggests a higher likelihood of self-drafted manuscripts. Notably, the application of the FLCA algorithm successfully generated IBPs for each author, providing a visual representation of their research profiles.
The study successfully achieved its 3 objectives: the development of the FLCA method, the demonstration of enhanced IBP visualization, and the investigation of the relationship between higher self-citation rates and a lower cluster number in manuscripts that are more likely to have been self-drafted.
4.2. Additional information
In this study, we employed the FLCA algorithm to cluster the articles of each author based on their citing and cited articles. The resulting enhanced IBPs for each author can be seen in Figures 5 to 6.[37–39] We would like to acknowledge the valuable insights provided by the timezone and landscape views[15,16] in CiteSpace software.[17] The citations between the citing and cited articles were incorporated into the enhanced IBPs, further enriching the visual representation.
The h-index and x-index[10,11] were calculated and incorporated into the IBP to assess authors’ IRAs. The IBP provides a visual representation of the authors’ IRAs. Additionally, the self-citation rate[14] was analyzed within the IBP, offering insights into the potential presence of self-drafted manuscripts by the respective author. While we cannot definitively conclude that the self-citation rate and cluster number are always indicative of self-drafted manuscripts, we have observed a higher likelihood when considering these criteria (e.g., Dr Tseng has many single author articles to have a highest self-citation rate [=6.62%] when compared to other 2 authors). This pattern is also observed in other 2 authors mentioned in the provided links,[35,36] who exhibit self-citation rates of 1.47% and 9.51%, respectively. Further studies in bibliometrics are needed to explore this issue in greater depth.
Significantly, the tutorial material for creating the IBP was made available in Supplemental Digital Content 2, http://links.lww.com/MD/J254, along with the corresponding links[28,29] to MP4 videos. This innovative approach in the literature provides readers with the necessary resources to replicate IBP independently.
We devised the FLCA algorithm and showcased its efficacy in Figures 2 to 4. Additionally, we developed a novel visualization platform[30] using the R language to generate graphical representations, as depicted in Figures 2 to 4. A video demonstration can be found in.[28] The contributions of this study are noteworthy, as the literature lacks comprehensive explanations of classification methods and procedures employed by various software tools such as CiteSpace,[17] VOSviewer,[40] and Bibexcel[41] for conducting cluster analysis on author collaborations and cowork analysis in bibliometrics.
4.3. Three worthy reading articles
The first article[32] was authored by Dr Jang and his colleagues in 2013. The authors addressed that diffusion tensor imaging was used to reconstruct the lower single component of the ascending reticular activating system in the normal human brain. Twenty-six normal healthy subjects were scanned using a 1.5-T scanner. Two ROIs were used for reconstruction of the lower single component of the Action of the ascending reticular activating system.
The second article[33] was authored by Dr Kao and his colleagues in 2015. The authors stated that cholangiocarcinoma is the second most common primary liver cancer in the world, but no effective treatments have been developed. They used nationwide insurance data to perform a case–control study on cholangiocarcinoma (CCA) and statin use. Patients with CCA were slightly younger than controls and had fewer users of statins. The overall adjusted OR of statin use-associated CCA was 0.80 (95% CI: 0.71, 90).
The third article[34] was authored by Dr Tseng alone in 2017. This study investigated whether rosiglitazone may affect breast cancer risk in female patients with type 2 diabetes mellitus in Taiwan. The study found that the third tertile of cumulative duration and cumulative dose had the lowest risk of breast cancer compared to never users. Rosiglitazone reduces breast cancer risk in female patients with type 2 diabetes mellitus and shows a significant interaction with metformin.
4.4. Implications and possible changes
There are 3 features in this study as follows:
A novel approach is introduced for showcasing author publications using IBPs. Unlike conventional paper lists, IBPs provide additional information to readers, particularly through the inclusion of the self-citation rate, which offers insights into manuscripts that are more likely to have been self-drafted.
The study demonstrates the application of the FLCA algorithm in generating IBPs for 3 highly productive authors. The cluster number within the IBPs reflects author collaborations while also indicating a lower presence of self-drafted manuscripts.
The research emphasizes the significance of 3 key bibliometric metrics, namely, the h-index, x-index, and self-citation rate, within IBPs. These metrics offer valuable insights into the scholarly achievements of researchers, with higher values indicating greater research impact.
The web page for drawing the IBP can be found at the following link.[42] It is recommended that users watch MP4 videos[28,29] to replicate their own IBP in the future.
4.5. Limitations and suggestions
The generalizability of the findings in this study is constrained by the limited examples of the 3 authors’ research profiles presented. Further research is needed to verify the applicability of the enhanced IBP to authors across different disciplines.
To enhance the interpretability of IBPs, it is important to provide readers with additional information. This includes coloring the bubbles based on clusters, sizing them according to WCD, and providing direct links to online articles. These details were not explicitly described in the context but are crucial for improving the understanding of IBPs.
While the primary focus of this study is on clustering the top 20 articles using the FLCA algorithm, it is important to consider 3 key aspects: followers, leader ranking, and the parameter k, as depicted in the bottom panel of Figure 1. It is worth noting that the number of articles is not limited to 20, as demonstrated in this study.
The optimal value for the k parameter in the FLCA algorithm has not been clearly addressed, and simulations may be required to determine the minimum AAC for appropriate clustering of co-words based on citing and cited articles in bibliometrics, as shown in Equations 3 to 5. In this study, all of those parameter k values were set at 2.
While this study presents heatmaps, box charts, network charts, IBPs, and scatter plots, it may be worthwhile to explore whether other graphical representations can provide additional insights for readers.
R is a useful tool for creating visual diagrams, and this study offers several R plots (e.g., network chart and heatmap with dendrogram[28]) as references for interested readers in the future.
5. Conclusion
This study provides a practical demonstration of how the FLCA algorithm can be applied to cluster an author publications using citing and cited articles and how the resulting clusters can be visualized using IBPs. These IBPs offer a valuable tool for researchers in the field of bibliometrics who wish to visually represent their research profiles. Furthermore, the incorporation of 3 key bibliometric metrics, namely, the h-index, x-index, and self-citations, enhances the usefulness of IBPs. These metrics are highly recommended for researchers worldwide, as they provide valuable insights into individual researchers’ scholarly impact and citation patterns, with the enhanced IBPs proposed in this study.
Acknowledgments
We thank Enago (www.enago.tw) for the English language review of this manuscript.
Author contributions
Conceptualization: Yung-Ze Cheng, Sam Yu-Chieh Ho, Willy Chou.
Funding acquisition: Tsair-Wei Chien.
Supplementary Material
Abbreviations:
- FLCA
- following-leading clustering algorithm
- IBP
- impact beam plot
- IRA
- individual research achievements,
- WCD
- weighted centrality degree
Supplemental Digital Content is available for this article.
All data are publicly available in the WoSCC.
The authors have no funding and conflicts of interest to disclose.
The datasets generated during and/or analyzed during the current study are publicly available.
How to cite this article: Cheng Y-Z, Chien T-W, Ho SY-C, Chou W. Visual impact beam plots: Analyzing research profiles and bibliometric metrics using the following-leading clustering algorithm (FLCA). Medicine 2023;102:28(e34301).
Contributor Information
Yung-Ze Cheng, Email: asaliea.cheng@gmail.com.
Tsair-Wei Chien, Email: smile@mail.chimei.org.tw.
Sam Yu-Chieh Ho, Email: t20317@hotmail.com.
References
- [1].Wilson TD. Review of: cronin, blaise and sugimoto. In: Cassidy R. (eds). Beyond Bibliometrics: Harnessing Multidimensional Indicators at Scholarly Impact. Cambridge, MA: MIT Press. 2014. Information Research, 19(3), review no. R512 Available at: http://informationr.net/ir/reviews/revs512.html. [Google Scholar]
- [2].Haustein S, Bowman TD, Costas R. Interpreting “Altmetrics”: viewing acts on social media through the lens of citation and social theories. In: Cassidy R. (eds). Theories of Informetrics and Scholarly Communication. Sugimoto, Berlin, Boston: De Gruyter Saur. 2016:372–406. [Google Scholar]
- [3].Judit BI. Informetrics at the beginning of the 21st century–a review. J Informetr. 2008;2:1–52. [Google Scholar]
- [4].Elsevier. How to Write and Improve your Researcher Profile. URL: Available at: https://scientific-publishing.webshop.elsevier.com/publication-recognition/how-to-write-and-improve-your-researcher-profile/ [Access date March 20, 2023].
- [5].Author impact beam plots in Web of Science author records. Available at: https://www.youtube.com/watch?v=dcXgx5wxUp4 [Access date March 20, 2023].
- [6].Ho SY, Chien TW, Tsai KT, et al. Analysis of citation trends to identify articles on delirium worth reading using DDPP model with temporal heatmaps (THM): a bibliometric analysis. Medicine (Baltim). 2023;102:e32955. [DOI] [PMC free article] [PubMed] [Google Scholar]
- [7].Tan KK, Chien TW, Kan WC, et al. Research features between urology and nephrology authors in articles regarding UTI related to CKD, HD, PD, and renal transplantation. Medicine (Baltim). 2022;101:e31052. [DOI] [PMC free article] [PubMed] [Google Scholar]
- [8].Wang HY, Chien TW, Kan WC, et al. Authors who contributed most to the fields of hemodialysis and peritoneal dialysis since 2011 using the hT-index: bibliometric analysis. Medicine (Baltim). 2022;101:e30375. [DOI] [PMC free article] [PubMed] [Google Scholar]
- [9].Szomszor M. The web of science author impact beamplots: a new tool for responsible research evaluation. URL: Available at: https://clarivate.com/blog/the-web-of-science-author-impact-beamplots-a-new-tool-for-responsible-research-evaluation/ [Access date April 15, 2023].
- [10].Hirsch JE. An index to quantify an individual’s scientific research output. Proc Natl Acad Sci USA. 2005;102:16569–72. [DOI] [PMC free article] [PubMed] [Google Scholar]
- [11].Fenner T, Harris M, Levene M, et al. A novel bibliometric index with a simple geometric interpretation. PLoS One. 2018;13:e0200098. [DOI] [PMC free article] [PubMed] [Google Scholar]
- [12].Jacso P. Scientometric indicators from Google Scholar with the Publish or Perish software. Online Inf Rev. 2009;33:1189–200. [Google Scholar]
- [13].Yie KY, Chien TW, Chen CH, et al. Suitability of h- and x-indices for evaluating authors’ individual research achievements in a given short period of years: a bibliometric analysis. Medicine (Baltim). 2021;100:e25016. [DOI] [PMC free article] [PubMed] [Google Scholar]
- [14].Liu MY, Chien TW, Chou W. The Hirsch-index in self-citation rates with articles in Medicine (Baltimore): bibliometric analysis of publications in two stages from 2018 to 2021. Medicine (Baltim). 2022;101:e31609. [DOI] [PMC free article] [PubMed] [Google Scholar]
- [15].Yuan X, Lai Y. Bibliometric and visualized analysis of elite controllers based on CiteSpace: landscapes, hotspots, and frontiers. Front Cell Infect Microbiol. 2023;13:1147265. Published 2023 Apr 12. [DOI] [PMC free article] [PubMed] [Google Scholar]
- [16].Liu Y, Wen H, Wang Q, et al. Research trends in endoscopic applications in early gastric cancer: a bibliometric analysis of studies published from 2012 to 2022. Front Oncol. 2023;13:1124498. Published 2023 Apr 11. [DOI] [PMC free article] [PubMed] [Google Scholar]
- [17].Chen C. CiteSpace II: detecting and visualizing emerging trends and transient patterns in scientific literature. J Am Soc Inf Sci Technol. 2006;57:359–77. [Google Scholar]
- [18].Wu JW, Yan YH, Chien TW, et al. Trend and prediction of citations on the topic of neuromuscular junctions in 100 top-cited articles since 2001 using a temporal bar graph: a bibliometric analysis. Medicine (Baltim). 2022;101:e30674. [DOI] [PMC free article] [PubMed] [Google Scholar]
- [19].Liu Z, Liu Q, Guo H, et al. Bibliometric and visual analysis of trends in tenosynovitis research from 1999 to 2021. Am J Transl Res. 2023;15:2329–44. [PMC free article] [PubMed] [Google Scholar]
- [20].Choudhri AF, Siddiqui A, Khan NR, et al. Understanding bibliometric parameters and analysis. Radiographics. 2015;35:736–46. [DOI] [PubMed] [Google Scholar]
- [21].Pubmed. Self-citations have been mentioned in many articles. URL: Available at: https://pubmed.ncbi.nlm.nih.gov/?term=%22self-citation+rate%22&sort=date [Access date April 15, 2023].
- [22].Ho SY, Chien TW, Huang CC, et al. A comparison of 3 productive authors’ research domains based on sources from articles, cited references and citing articles using social network analysis. Medicine (Baltim). 2022;101:e31335. [DOI] [PMC free article] [PubMed] [Google Scholar]
- [23].Liu MY, Chou W, Chien TW, et al. Evaluating the research domain and achievement for a productive researcher who published 114 sole-author articles: a bibliometric analysis. Medicine (Baltim). 2020;99:e20334. [DOI] [PMC free article] [PubMed] [Google Scholar]
- [24].Hsieh WT, Chien TW, Kuo SC, et al. Whether productive authors using the national health insurance database also achieve higher individual research metrics: a bibliometric study. Medicine (Baltim). 2020;99:e18631. [DOI] [PMC free article] [PubMed] [Google Scholar]
- [25].Chien TW, Chang Y, Wang HY. Understanding the productive author who published papers in medicine using National Health Insurance Database: a systematic review and meta-analysis. Medicine (Baltim). 2018;97:e9967. [DOI] [PMC free article] [PubMed] [Google Scholar]
- [26].Yang DH, Chien TW, Yeh YT, et al. Using the absolute advantage coefficient (AAC) to measure the strength of damage hit by COVID-19 in India on a growth-share matrix. Eur J Med Res. 2021;26:61. Published 2021 Jun 24. [DOI] [PMC free article] [PubMed] [Google Scholar]
- [27].Yang TY, Chien TW, Lai FJ. Citation analysis of the 100 top-cited articles on the topic of hidradenitis suppurativa since 2013 using Sankey diagrams: bibliometric analysis. Medicine (Baltim). 2022;101:e31144. [DOI] [PMC free article] [PubMed] [Google Scholar]
- [28].Chien TW. How to verify the FLCA algorithm. URL: Available at: https://youtu.be/MjLR_jZ3Rek [Access date April 15, 2023].
- [29].Chien TW. How to draw the impact beam plot. URL: URL: Available at: https://youtu.be/Hp3yUUGny2M [Access date April 15, 2023].
- [30].Chien TW. To generate R language for visualizations. URL: Available at: https://www.healthup.org.tw/raschonline/cbp.asp [Access date March 3, 2023].
- [31].Chuang H-Y, Kan W-C, Chien T-W, et al. The 95% control lines on both confirmed cases and days of infection with COVID-19 were applied to compare the impact on public health between 2020 and 2021 using the hT-index. Medicine (Baltim). 2023;102:e33570. [DOI] [PMC free article] [PubMed] [Google Scholar]
- [32].Yeo SS, Chang PH, Jang SH. The ascending reticular activating system from pontine reticular formation to the thalamus in the human brain. Front Hum Neurosci. 2013;7:416. Published 2013 Jul 25. [DOI] [PMC free article] [PubMed] [Google Scholar]
- [33].Peng YC, Lin CL, Hsu WY, et al. Statins are associated with a reduced risk of cholangiocarcinoma: a population-based case–control study. Br J Clin Pharmacol. 2015;80:755–61. [DOI] [PMC free article] [PubMed] [Google Scholar]
- [34].Tseng CH. Rosiglitazone reduces breast cancer risk in Taiwanese female patients with type 2 diabetes mellitus. Oncotarget. 2017;8:3042–8. [DOI] [PMC free article] [PubMed] [Google Scholar]
- [35].Chien TW. The author has a lower self-citation rate(=1.47%). URL: Available at: https://www.healthup.org.tw/gps/WangJJ.htm [Access date March 22, 2023].
- [36].Chien TW. The author has a higher self-citation rate (=9.51%). URL: Available at: https://www.healthup.org.tw/gps/smilechiencv.htm [Access date March 22, 2023].
- [37].Chien TW. Figure 5 in this study. URL: Available at: https://www.healthup.org.tw/gps/Jangkorea.htm [Access date March 22, 2023].
- [38].Chien TW. Figure 6 in this study. URL: Available at: https://www.healthup.org.tw/gps/KaoChia-Hung.htm [Access date March 22, 2023].
- [39].Chien TW. Figure 7 in this study. URL: Available at: https://www.healthup.org.tw/gps/TsengDR.htm [Access date March 22, 2023].
- [40].van Eck NJ, Waltman L. “Software survey: VOSviewer, a computer program for bibliometric mapping”. Scientometrics. 2010;84/2:523–38. [DOI] [PMC free article] [PubMed] [Google Scholar]
- [41].Persson O. Analyzing bibliographic data to visualize representations. Available at: https://homepage.univie.ac.at/juan.gorraiz/bibexcel/ [Access date March 3, 2023].
- [42].Chien TW. The website for drawing the impact beam plot. URL: Available at: https://www.healthup.org.tw/kpiall/Qimpactbeamspot2link.asp [Access date March. 3, 2023].
Associated Data
This section collects any data citations, data availability statements, or supplementary materials included in this article.


