

Summary
Stimulus-coupled insulin secretion from the pancreatic islet β-cells involves the fusion of insulin granules to the plasma membrane (PM) via SNARE complex formation––a cellular process key for maintaining whole-body glucose homeostasis. Less is known about the role of endogenous inhibitors of SNARE complexes in insulin secretion. We show that an insulin granule protein synaptotagmin-9 (Syt9) deletion in mice increased glucose clearance and plasma insulin levels without affecting insulin action compared to the control mice. Upon glucose stimulation, increased biphasic and static insulin secretion were observed from ex vivo islets to Syt9 loss. Syt9 colocalizes and binds with tomosyn-1 and the PM syntaxin-1A (Stx1A); Stx1A is required for forming SNARE complexes. Syt9 knockdown reduced tomosyn-1 protein abundance via proteasomal degradation and binding of tomosyn-1 to Stx1A. Furthermore, Stx1A-SNARE complex formation is increased, implicating Syt9-tomosyn-1-Stx1A complex is inhibitory in insulin secretion. Rescuing tomosyn-1 blocked the Syt9-knockdown-mediated increases in insulin secretion. This shows that the inhibitory effects of Syt9 on insulin secretion are mediated by tomosyn-1. We report a molecular mechanism by which β-cells modulate their secretory capacity rendering insulin granules non-fusogenic by forming the Syt9-tomosyn-1-Stx1A complex. Altogether, Syt9 loss in β-cells decreases tomosyn-1 protein abundance, increasing the formation of Stx1A-SNARE complexes, insulin secretion, and glucose clearance. These outcomes differ from the previously published work that identified Syt9 has either a positive or no effect of Syt9 on insulin secretion. Future work using β-cell-specific deletion of Syt9 mice is key for establishing the role of Syt9 in insulin secretion.
Keywords: Synaptotagmin-9, Insulin Secretion, Tomosyn-1, SNARE, Syntaxin-1A, Exocytosis, Beta-cells, Islets, Insulin Granules, Biphasic Insulin Secretion
Graphical Abstract
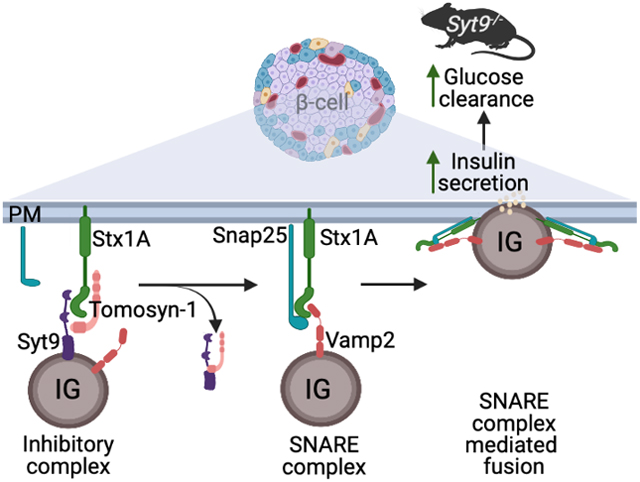
A schematic diagram shows that an insulin granule (IG) protein synaptotagmin-9 (Syt9), soluble tomosyn-1, and plasma membrane syntaxin-1A (Stx1A) proteins form a molecular complex inhibiting insulin fusion. Loss of Syt9 relieves the tomosyn-1-mediated inhibition of syntaxin-1A, forming the syntaxin-1A-SNARE complexes, which leads to an increase in insulin secretion from beta-cells, causing improvement in glucose clearance in mice.
Teaser
Syt9-tomosyn-1-Stx1A inhibitory complex renders insulin granules non-fusogenic, decreasing insulin secretion to affect whole-body glucose homeostasis.
Introduction
Glucose elicits a biphasic insulin secretion response from pancreatic β-cells to maintain whole-body glucose homeostasis1,2. Increases in the cellular ATP to ADP ratio, which results from glucose metabolism, cause the closure of the ATP-sensitive potassium channels (KATP), leading to the depolarization of plasma membrane (PM)3–5. Consequently, increases in the Ca2+ influx through voltage-gated Ca2+ channels6 facilitate the fusion of insulin granules to the PM, causing an early phase insulin secretion6–8. Additionally, glucose-generated amplifying pathways contribute to a more sustained release of insulin9. The molecular mechanisms underlying biphasic insulin secretion are not completely understood. Especially those that contribute to β-cell dysfunction in insulin-resistant obese and Type 2 diabetic individuals10–22.
The soluble N-ethylmaleimide-sensitive factor attachment receptor protein (SNARE) complex formation is required for insulin granules to undergo fusion with the PM in both phases of glucose-stimulated insulin secretion (GSIS)23–25. Biochemical and structural studies have demonstrated that the SNARE core complex assembly occurs between a vesicle (v)-SNARE protein Vamp2 (vesicle-associated protein), which is present on the insulin granules with the PM-bound target (t)-SNARE proteins syntaxin (Stx) and Snap25 (synaptosome-associated protein of 25 kDa)26. Aided by the accessory proteins, the SNARE core proteins assemble into a complex that is only partially zipped up and clamped27,28. Upon stimulation, increases in [Ca2+]i cause complete zippering of the SNAREs by engaging enhancer proteins, causing membrane fusion and insulin exocytosis29. It is accepted that only a fraction of insulin granules undergo fusion to the PM upon stimulation. Thus, understanding how β-cells regulate the availability of Stx to form SNARE complexes is key for the fusion of insulin granules in insulin secretion.
Stx1A is a well-characterized t-SNARE that forms a cognate SNARE core complex with Vamp2 and Snap25 to regulate the fusion of insulin granules in the early and sustained phases of insulin secretion30–34. Clusters of Stx1A are present in the PM with proximity to insulin granules35. Moreover, mice with β-cell-specific Stx1A deletion exhibit impaired early and sustained phase insulin secretion30,36,37. In the islets of individuals with T2D, reduction in biphasic insulin secretion is correlated with decreases in the abundance of islet Stx1A38, implicating a clinically relevant role of Stx1A in β-cell function. Therefore, factors modulating the essential function of Stx1A have a major effect in regulating biphasic insulin secretion. Proteins such as Munc13–139 and Munc18a31 facilitate the availability of Stx1A forming SNAREs. In contrast, a relatively less characterized syntaxin binding protein 5 (Stxbp5) or tomosyn-1 functions to inhibit Stx1A, decreasing Stx1A-SNAREs (Stx1A-Snap25-Vamp2) formation and causing the inhibition of insulin secretion40. Interestingly, the role of factors facilitating the formation of the Stx1A-SNARE complex is well characterized. However, less is known about factors that decrease the ability of Stx1A to facilitate SNARE-mediated fusion of insulin granules in insulin secretion.
Synaptotagmin (Syt) isoforms have diverse roles in different cell types41. The primary structure of Syt comprises an N-terminal intra-vesicular transmembrane region, a linker domain, and two Ca2+-binding cytoplasmic domains (C2A and C2B) at the C-terminal42,43. In the presence of Ca2+, Syt isoforms such as Syt1 and Syt7, via C2A and C2B, bind SNAREs and PM anionic phospholipids, accelerating SNARE complexes-mediated fusion of granules with the PM in exocytosis44–47. Conversely, Syt1 also functions to inhibit SNARE fusion complexes48. The ablation of Syt1 was found to increase the spontaneous release of granules from neurons in mice and drosophila49–53. These studies show that Ca2+-binding Syt1 can positively and negatively affect vesicle exocytosis. In β-cells, Syt7 is a major Ca2+ sensor that facilitates insulin exocytosis54–56. Mice with the Syt7 deletion exhibited impaired insulin secretion and glucose intolerance57. However, the characterization of other Syt isoforms in regulating the fusion of insulin granules is not completely elucidated. Syt9 (NCBI accession # NP_001347350, also referred to as Syt558) is abundantly expressed in β-cells59, and herein, we used the Syt9 gene deletion mouse model and clonal INS1(832/13) β-cells combined with metabolic phenotyping, confocal imaging, and biochemical approaches to determine the molecular mechanism by which Syt9 regulates insulin secretion and whole-body glucose homeostasis.
Materials and Methods
Antibodies and chemicals
For the in-house insulin ELISA, the coating monoclonal anti-insulin antibody (clone D6C4) was from Fitzgerald (Cat# 10R-I136A), insulin standard from EMD-Millipore (Cat# 8013-K), detecting biotinylated anti-insulin antibody (clone D3E7) from Fitzgerald (Cat#61R-I136bBT), and streptavidin-HRP from Pierce (cat#21126). Primary antibodies β-actin (DSHB, Cat# 224-236-1), Stx1A (Sigma, Cat#S0664), Syt5/9 (SYSY, Cat#105053), tomosyn-1 (SYSY, Cat#183103), Vamp2 (SYSY, Cat# 104008) and Snap25 (Biolegend, Cat#836304) were used in Western blotting, co-immunoprecipitation, and confocal imaging. The secondary antibodies used are from goat anti-mouse (Cell Signaling, Cat#7076) and goat anti-rabbit (Jackson ImmunoResearch, Cat#111-035-003) for Western blotting, and mouse Alexa Fluor 488 (Jackson ImmunoResearch, Cat#115-545-166) and rabbit Alexa Fluor 647 (Jackson ImmunoResearch, Cat#111-605-003) for confocal imaging (Supplementary Table S1).
Expression construct
The pcDNA3-m-tomosyn-1 construct was generously provided by Dr. Alexander Groffen, Virije Universiteit, Netherlands. Moloney murine leukemia virus-based retroviral vector (RVV, 3051) was a gift from Dr. Bill Sugden, University of Wisconsin, Madison. The m-tomosyn-1 cDNA was subcloned to generate an m-tomosyn-1-V5 tagged RVV mammalian expression plasmid. The hGH mammalian expression plasmid was a gift from Dr. Edwin Chapman, University of Wisconsin-Madison.
Animals
The Syt9−/− mice were generously given to us by Dr. Edwin Chapman, University of Wisconsin-Madison. These mice were generated as described in previous studies60–62. All pups were weaned between 3–4 weeks of age. Male and female mice had free access to water and a chow diet and were housed in a temperature-controlled room with a 12 h light-dark cycle (6 AM-6 PM). All mice were kept following the University of Alabama at Birmingham Animal Research Program and NIH guidelines for the care and use of laboratory animals.
Metabolic phenotyping
Body weight (BW), blood glucose, and plasma insulin were measured in Syt9−/− and Syt+/+ (littermate) mice. Additionally, oral glucose tolerance test and plasma insulin levels assessment were performed in response to oral glucose gavage (2 g glucose/kg BW of mice) after a 12 h fast. Tail vein blood was collected at different times to determine blood glucose and plasma insulin levels. An insulin tolerance test was performed in response to an insulin dose (0.5U human insulin/kg BW of mice, Humulin R, Lilly, USA, Cat#002 8215–01) administered intraperitoneally to mice after a 6 h fast. Blood glucose levels were determined using the Contour Next blood glucose meter (Ascensia Diabetes Care, Switzerland). The plasma insulin concentration was measured by Ultra-Sensitive Mouse Insulin ELISA Kit (Crystal Chem, USA, Cat# 90080).
Islet isolation and cell culture
Mouse islets were isolated from 8 to 10-week-old Syt9−/− and Syt9+/+ mice using a collagenase digestion method and ficoll gradient procedure described previously63,64. Briefly, the pancreas was inflated by injecting collagenase (0.6 mg/ml) solution through the common bile duct, followed by removal, digestion steps, and ficoll gradient to obtain isolated islets. Handpicked islets were cultured overnight in supplemented RPMI 1640 culture medium containing 8 mM glucose for perifusion and static insulin secretion experiments. INS1(832/13) β-cells, a gift from Dr. Christopher Newgard, Duke University, NC, were cultured in RPMI 1640 media supplemented with 10% heat-inactivated fetal bovine serum, 1 mM sodium pyruvate, 20 mM HEPES, 2 mM L-glutamine, and 100 units/ml of antimycotic-antibiotic along with 50 μM β-mercaptoethanol.
Hormone secretion
Insulin secretion from mouse islets was performed as described previously65 63. Briefly, six size-matched islets from Syt9+/+ and Syt9−/− mice were handpicked into each well of a 96-well plate. The insulin secretion assay was performed in a KRB-based buffer (Krebs-Henseleit Ringer bicarbonate buffer; KRB: 118.41 mM NaCl, 4.69 mM KCl, 1.18 mM MgSO4, 1.18 mM KH2PO4, 25 mM NaHCO3, 5 mM HEPES, 2.52 mM CaCl2, pH 7.4, and 0.5 % BSA). Islets were preincubated in 100 μl/well of KRB buffer containing 2.8 mM glucose. After 45 min, the preincubation buffer was replaced with the KRB incubation buffer containing insulin secretagogues. After 45 min, the incubation buffer was collected to estimate secreted insulin. Furthermore, islets were lysed in acid ethanol to determine cellular insulin content.
Insulin or human growth hormone (hGH) secretion from INS1(832/13) β-cells was performed as described previously66. Cells were seeded at a density of 100,000 cells/well in a 96-well plate at ~ 80% confluency. Forty-two-hours post-transfection, cells were washed and preincubated with 100 μl of the KRB-based buffer (118.41 mM NaCl, 4.69 mM KCl, 1.18 mM MgSO4, 1.18 mM KH2PO4, 25 mM NaHCO3, 20 mM HEPES, 2.52 mM CaCl2, pH 7.4, and 0.2% BSA) containing 1.5 mM glucose. After 2h, the preincubation buffer was replaced with the KRB incubation buffer containing insulin secretagogues. After 2h, an incubation buffer was collected to determine secreted insulin or hGH. Furthermore, cells were lysed in acid ethanol and lysis buffer (100 mM Tris-HCl, 300mM NaCl, 10mM NaF, 2 mM Na3VO4, 2% NP-40, and protease inhibitor cocktail) to determine cellular insulin and hGH content, respectively. Quantification of insulin was performed using in-house ELISA. The percent fractional insulin secretion was calculated as the amount of insulin secreted divided by the total insulin content. HGH was quantified using ELISA (Roche, Cat# 11585878001) following instructions provided in the kit.
Islet perifusion
For the perifusion insulin secretion assay (as described63), a high capacity perifusion system from Bio Rep® Perifusion was utilized. Approximately 75 islets were sandwiched in a chamber between two layers of Bio-Gel P-2 (Bio-Rad, Cat#1504118) bead solution (200 mg beads/ml in KRB buffer). Throughout the experiment, chambers containing islets and buffers were maintained at 37°C. Islets were perfused at a flow rate of 1 ml/min, and the flow-through containing secreted insulin was collected in a 96-well plate using an automatic fraction collector. The in-house ELISA was used to quantify cellular and secreted insulin.
siRNA Transfection
Approximately 75–80% confluent INS1(832/13) cells were transfected with 0.2 μM of short interfering (si) RNAs, si-scramble (universal negative control, Sigma, Cat#SIC001, siSyt9 (sense-CAUUGUCCUGGAAGCUAAA, antisense-UUUAGCUUCCAGGACAAUG), si-tomosyn-1 set 1(sense- GACCCAAAGCAGAAAGUUU, antisense- AAACUUUCUGCUUUGGGUC), and si-tomosyn-1 set2 (sense-GAAAUUAAGCUUGCCAACU, antisense-AGUUGGCAAG CUUAAU UUC) using Lipofectamine 2000 (Invitrogen) at 1:2 ratio in Opti-MEM. After 6 h, RPMI 1640 supplemented medium without antibiotics was added to cells. After 42 h, cells were harvested for insulin secretion, Western blotting, or qPCR.
Immunoprecipitation
INS1(832/13) cells were seeded in a 100 mm tissue culture dish at 60% confluency. Transient transfection was performed using 0.2 μM siRNA or 10 μg tomosyn-1-V5-RVV or GFP-V5-RVV and Lipofectamine 2000 (Invitrogen) at a 1:2 ratio in Opti-MEM. Forty-eight-hour post-transfection, cells were pre-incubated for 2 h in KRB containing 1.5 mM glucose before 40 mM KCl treatment for 15 min.
Immunoprecipitation of overexpressed tomosyn-1 –
Cell lysates were prepared using 1ml IP lysis buffer (25 mM Tris-HCl, pH 7.5, 50 mM NaCl, 2 mM MgCl2, 1 mM Na2EDTA, 1 mM EGTA, 1 mM CaCl2, 0.5% Triton X-100, 2.5 mM sodium pyrophosphate, 1 mM β-glycerophosphate, 1 mM Na3VO4, 1 mM PMSF and protease inhibitor cocktail tablet). Protein concentration was estimated using BCA (Pierce BCA protein assay kit, Cat#PI23227). Immunoprecipitation was performed in IP lysis buffer supplemented with an additional 1 mM CaCl2 and 0.2% BSA using 50 μl of equilibrated magnetic bead suspension (anti-V5-tag mAb-Magnetic Beads; MBL life sciences M167–11). The immunoprecipitated complex was washed thrice with 1ml IP lysis buffer with 0.2% BSA. The protein complex was eluted in 80 ml 2.5X Laemmli buffer with 1 mM DTT followed by heating at 95°C for 5 min. Proteins were separated by 10% SDS-PAGE gel.
Immunoprecipitation of endogenous proteins –
INS1(832/13) cells combined from two 10 cm dishes or human islets (RRID: SAMN12500521, 2,000 IEQ) were lysed in 700 μl lysis buffer (25 mM Tris-HCl, pH 7.5, 50 mM NaCl, 2 mM MgCl2, 1 mM Na2EDTA, 1 mM EGTA, 1mM CaCl2, 0.5% NP-40, 0.1% SDS, 2.5 mM sodium pyrophosphate, 1 mM Na3VO4, 1 mM PMSF, and protease inhibitor cocktail tablet) by placing on a rotating shaker for 1 hour at 4°C followed by centrifugation at 13000 rpm for 10 min. The precleared lysates were supplemented with 0.2% BSA and 1 mM CaCl2 and incubated overnight with Stx1A antibody (2 mg/ml) or IgG isotype control. The next day, 50 ml of equilibrated magnetic beads were added to the reaction mixture and incubated at 4°C for 1 h. The immunoprecipitated complex was washed three times with 1 ml lysis buffer supplemented with 0.2% BSA and 1mM CaCl2 and eluted in 80 ml 2.5X Laemmli buffer with1 mM DTT, followed by heating at 95°C for 5 min. Proteins were separated by 10% and 12% SDS-PAGE gels and transferred to a PVDF membrane, followed by blotting and detection with Clarity Western ECL substrate (Bio-Rad, Cat# 1705061).
Quantification of Ca2+ in IP buffer
Effective calcium concentration in IP buffer was measured using a colorimetric calcium assay kit (Abcam, Cat# ab102505). Briefly, 50 μL of samples (IP buffer supplemented with/without 2 mM CaCl2), controls, and calcium standard dilutions were pipetted in a 96-well plate. Then, 90 μL of the chromogenic reagent was added to each well-containing standard, sample, or control. Next, 60 μL of calcium assay buffer was added into each well and mixed properly. Absorbance was taken at OD 575 nM immediately after incubation at room temperature for 10 minutes. The concentration of calcium was calculated as calcium concentration= (Sa/Sv) × D, Where: Sa = Sample Amount (in μg) from the standard curve; Sv = Sample Volume (μL) added into the wells; D = Sample Dilution factor.
Western blot
Approximately 100 mg of brain tissue from 6–8-week-old Syt9+/+ and Syt9−/− mice were pulverized using a mortal pestle on dry ice and added to ice-cold 1 ml lysis buffer (20 mM Tris-HCl pH 7.5, 150 mM NaCl, 1 mM Na2EDTA, 1 mM EGTA, 1% Triton X-100, 2.5 mM sodium pyrophosphate, 1 mM β-glyceraldehyde, 1 mM Na3VO4, 1 mM NaF, 1 mM PMSF, and protease inhibitor cocktail). Samples were homogenized, sonicated, subjected to high-speed spin, quantified by BCA assay, and 50 μg of cell lysates were subjected to Western blotting (described above). Similarly, islets (400 per biological replicate) isolated from 6–8-week-old Syt9+/+ and Syt9−/− mice and INS1(832/13) cells were harvested using 200 μl lysis buffer. Cell lysates were sonicated and subjected to a high-speed spin, and the BCA quantified soluble fractions were used for Western blotting. The following primary antibodies were used: anti-actin (1:5,000), antStx1A (1:10,000), anti-Syt5/9 (1:3,000), and anti-tomosyn-1 (1:5,000). Secondary antibodies used were goat anti-mouse (1:10,000) and donkey anti-rabbit (1:10,00).
Immunohistochemical analysis
INS1(832/13) cells cultured on poly-D-lysine (50 mg/ml) coated coverslips were fixed with 4% paraformaldehyde (2 ml/well) in 37°C for 20 min, washed five times at 5 min intervals with 1X PBS, blocked with 10% normal donkey serum for 1 h, and permeabilized (1X PBS, 2.5% normal goat serum, 2.5% normal donkey serum, 1% BSA, 0.15% Triton X-100) for 30 minutes. After washing (1X PBS, 3 times at 5 min intervals), primary antibody labeling was performed for 3 h by placing the coverslips in a humidity chamber. After 1XPBS washes, secondary antibody labeling was performed in the dark for one hour. Finally, the coverslip was mounted on a microscope slide with a mounting buffer containing DAPI. Confocal imaging was performed using LSM750 Zeiss at 60X magnification. The primary antibodies used were anti-Stx1A (1:500), anti-tomosyn-1 (1:500), and anti-Syt5/9 (1:500). The secondary antibodies were mouse Alexa fluor 488 (1:1,000) and rabbit Alexa fluor 647 (1:1,000).
Quantitative real-time PCR
Total RNA was harvested from mouse islets and INS1(832/13) cells by using a QIAGEN RNeasy Plus Kit (Cat#74034) and a TRIzol™ reagent (Invitrogen, Cat#15596018), respectively. Following RNA extraction, cDNA was synthesized using a high-capacity cDNA reverse transcription Kit (Applied Biosystems, Cat# 4368814). The mRNA abundance for the genes (Supplementary Table S2) of interest was determined by quantitative PCR using Fast Start SYBR Green (Roche, Cat#4673484001). The relative mRNA abundance was estimated by the comparative ΔCT method. β-actin mRNA was used as a housekeeping control.
Protein degradation assay
INS1(832/13) cells at 75–80% confluency were transfected with 0.2 μM of si-Syt9 or si-scramble using Lipofectamine 2000 (Invitrogen) at 1:2 ratio in Opti-MEM. After 6 h, the transfection solution was replaced with RPMI 1640 supplemented medium without antibiotics. After 42 h, cells were treated with proteasome inhibitor MG-132 (5 μM) or DMSO for 5 h. To observe the effect of MG-132, tomosyn-1 protein abundance was analyzed with Western blotting.
Statistical Analysis
Data are represented as means ± SEM. Statistical significance was performed using Student’s two-tailed unpaired t-test for independent data. The significance limit was set at p < 0.05.
Results
Loss of Syt9 improves glucose clearance associated with hyperinsulinemia.
The deletion of Syt9 in Syt9−/− vs. Syt9+/+ littermate control mice was confirmed by Western blotting. The protein abundance of Syt9 was undetectable in islets and the brain of Syt9−/− mice (Figure 1A). Metabolic phenotyping was performed using male Syt9−/− and Syt9+/+ mice. No effect on the body weight was observed regardless of the genotypes (Figure 1B). We then determined random-fed and fasting plasma insulin and glucose levels in Syt9−/− and Syt9+/+ control mice on the standard chow diet. No significant difference in the random-fed (measured at 8 AM) (Figure 1C) and fasting (after 6 h) (Figure S1A) blood glucose levels were observed at 6 and 10 weeks in Syt9−/− mice compared to the Syt9+/+ mice. Interestingly, the random-fed plasma insulin levels were increased 2-fold (P < 0.001) (Figure 1D) at 6 and 10 weeks in Syt9−/− mice. A small yet significant (1.3-fold, P < 0.01) increase in fasting plasma insulin levels was observed at 6 weeks in Syt9−/− mice, but no change was observed at 10 weeks. (Figure S1B). These data show that the primary effect of Syt9 loss is in increasing plasma insulin levels in the fed state. To evaluate the effect of Syt9 on insulin-stimulated glucose clearance, an oral glucose tolerance test was performed in Syt9−/− and Syt9+/+ mice. The loss of Syt9 led to accelerated glucose clearance (Figure 1E), reflected by the reduction in the glucose area under the curve (AUC) by 20% (P < 0.0001) that was observed in Syt9−/−, compared to the Syt9+/+ mice (Figure 1F). An insulin tolerance test was performed to evaluate the effect of Syt9 loss on insulin-stimulated glucose clearance in Syt9−/− vs. Syt9+/+ control mice (Figure 1G). Neither the glucose excursions nor the AUCs for Syt9−/− and Syt9+/+ mice after insulin injection significantly differed (Figures 1G and 1H). Moreover, the slope measured as Kg30 assessing the percent glucose clearance per min for the first 30 min after insulin administration was not significantly different compared to Syt9+/+ mice (Figure 1I). Together, these data implicate the role of Syt9 in modulating pancreatic β-cells function. We also performed metabolic phenotyping in Syt9−/− and Syt9+/+ female mice. No pronounced effects on glucose homeostasis were observed; fasting and fed plasma insulin and glucose levels, glucose clearance, insulin-stimulated glucose clearance, and glucose-stimulated plasma insulin levels (Figures S1C–S1I) remained unaffected by Syt9-deletion, suggesting a sex-specific role of Syt9 in regulating pancreatic β-cell function.
Figure 1. Mice lacking Syt9 have improved glucose clearance and increased plasma insulin levels.

(A) Representative image of Western blots showing Syt9 and β-actin relative protein abundance in the brain (left) and islets (right) isolated from Syt9−/− and Syt9+/+ mice (n > 4). (B) The body weight in Syt9−/− and Syt9−/− male mice at 6 and 10 weeks (n > 10). The random-fed blood glucose (C) and plasma insulin (D) levels in Syt9−/− and Syt9+/+ male mice at 6 and 10 weeks (n > 10). (E) Oral glucose tolerance test (OGTT) and (F) quantitation of the glucose area under the curve (AUC) encompassing 120 min in OGTT were performed in Syt9−/− and Syt9+/+ male mice after 12 h fasting (n > 20). (G) Insulin tolerance test (ITT) was performed by intraperitoneal administration of human insulin (0.5U per Kg BW) in Syt9+/+ and Syt9−/− male mice after 6 h fasting (n > 6). (H) Quantitation of the glucose AUCs in ITT. (I) The slope for the first 30 min in ITT was calculated as Kg30, representing insulin sensitivity. Data are presented as mean ± SEMs. *P < 0.05, **P < 0.01, ***P < 0.001
Loss of Syt9 increases stimulus-coupled insulin secretion.
Increases in plasma insulin levels were observed in random-fed Syt9−/− mice. Thus, we investigated the effect of Syt9 loss on insulin secretion. The Syt9−/− and Syt9+/+ mice were subjected to an oral glucose challenge, and plasma insulin levels were determined at different time points (Figure 2A). Glucose increased plasma insulin levels at 5 and 15 min compared to the baseline (t = 0 min) in both groups; however, further increases by ~30% (P < 0.04) and ~65% (P < 0.03) were observed in Syt9−/− mice compared to Syt9+/+ mice (Figure 2A). These data suggest that increases in insulin secretion contribute to improved glucose clearance in Syt9-deficient mice.
Figure 2. The loss of Syt9 increases biphasic insulin secretion from β-cells.
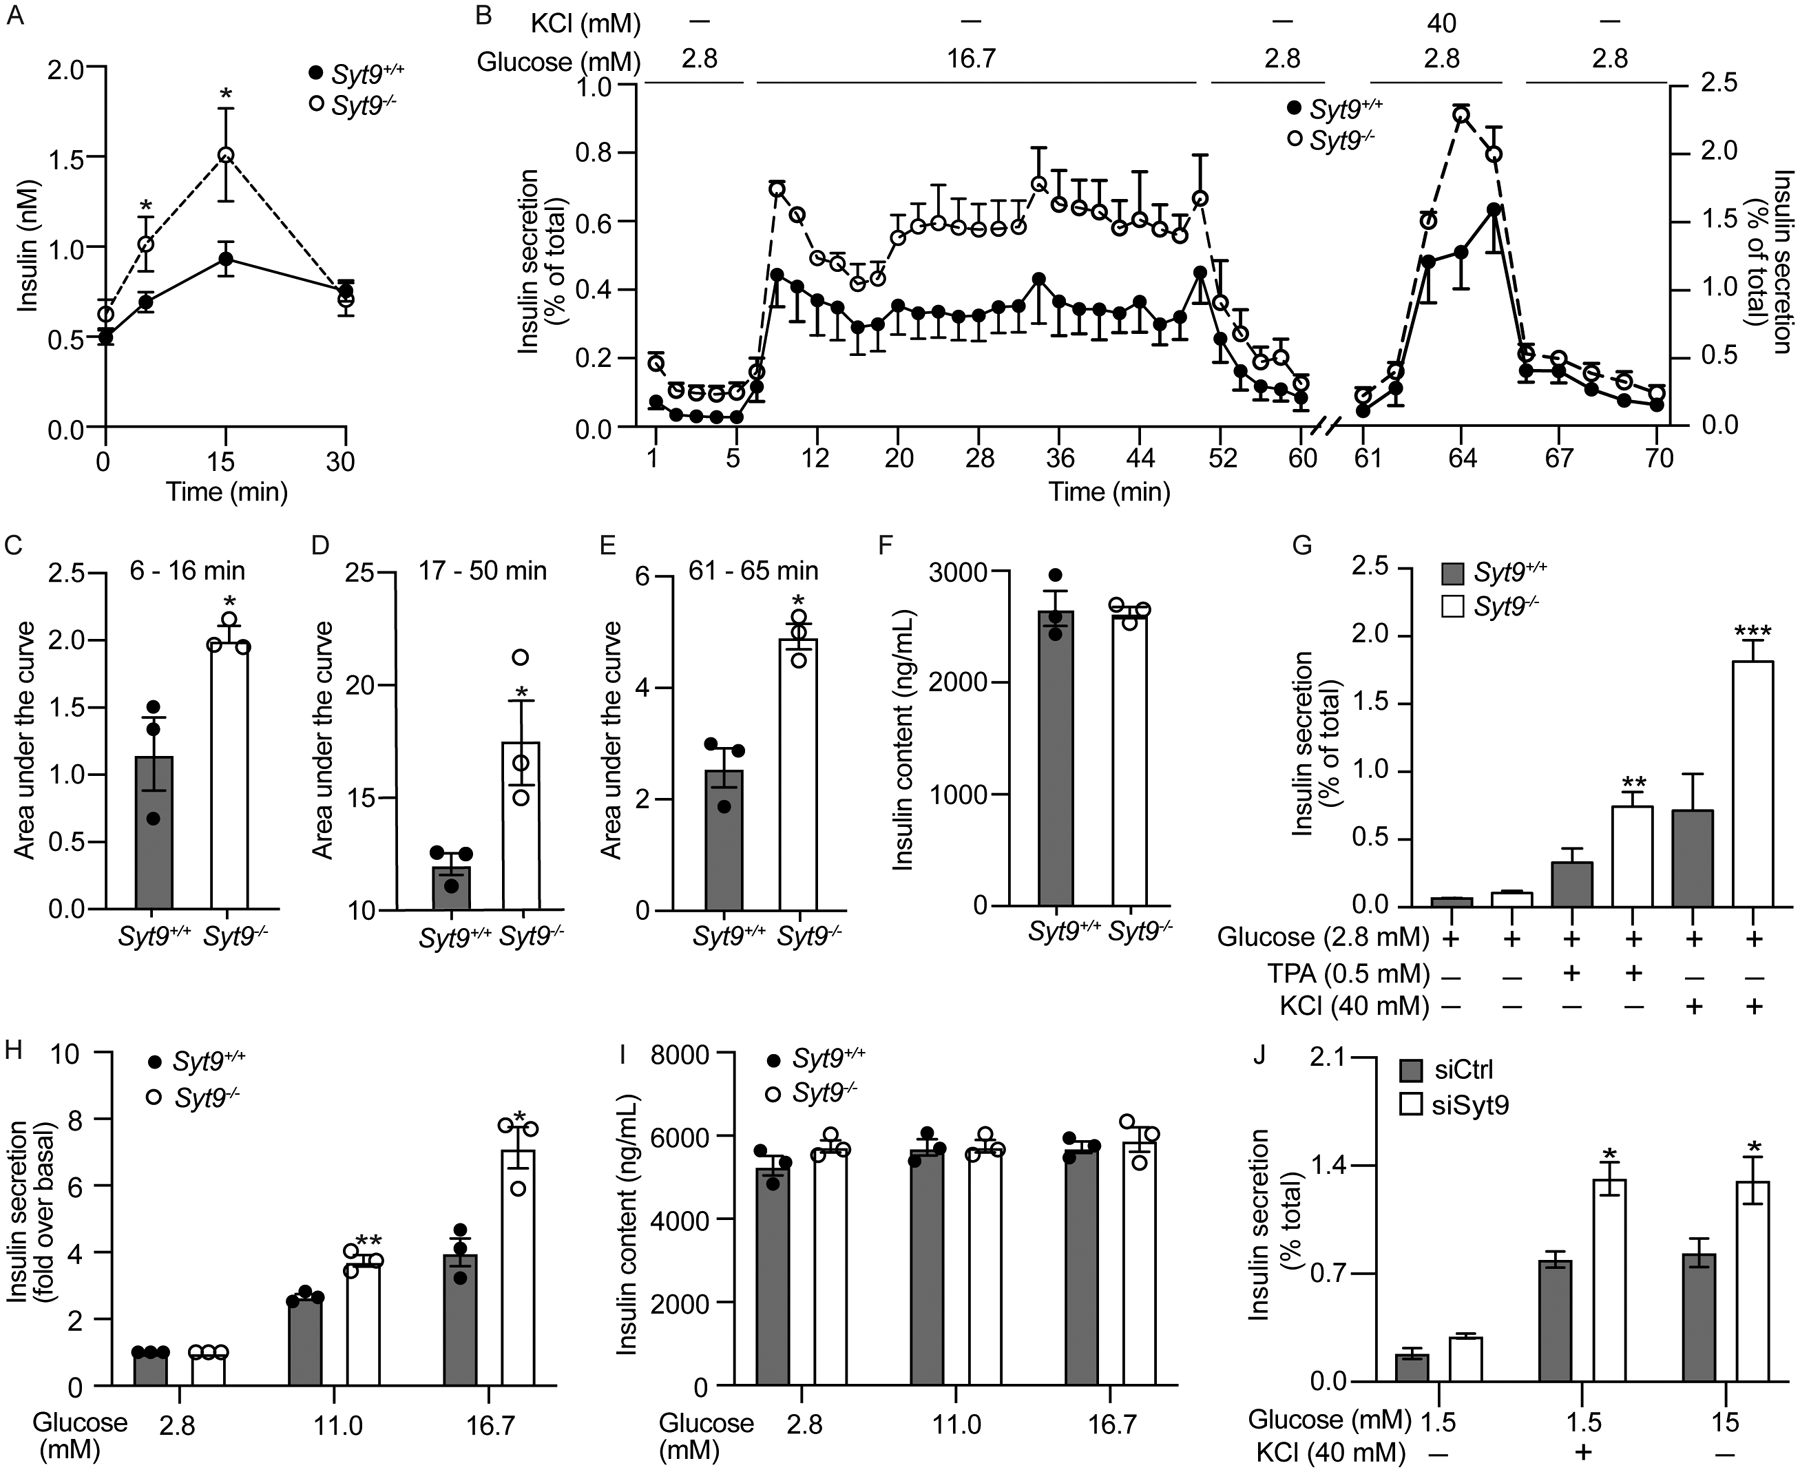
(A) Plasma insulin levels in response to the oral glucose challenge in Syt9+/+ and Syt9−/− mice after 12 h fasting (n > 20). (B) The dynamic insulin secretion was assessed in islets isolated from Syt9+/+ and Syt9−/− mice (n = 3) by perfusing with 2.8 mM glucose followed by 16.7 mM. After equilibration with 2.8 mM glucose, islets were again perifused with 40 mM KCl at 2.8 mM glucose. (C) Insulin secretion AUC for the early phase (6–16 min) in response to 16.7 mM glucose (n = 3). (D) Insulin secretion AUC for the sustained phase (17–50 min) in response to 16.7 mM glucose (n = 3). (E) Insulin secretion AUC in response to 40 mM KCl (n = 3). (F) Insulin content of islets subjected to perifusion. (G) Static insulin secretion from islets isolated from Syt9+/+ and Syt9−/− mice (n = 4) in response to the stimulation by KCl and TPA (12-O-tetradecanoylphorbol-13-acetate). (H) Static insulin secretion from islets isolated from Syt9+/+ and Syt9−/− mice in response to submaximal glucose (11.0 mM) and high glucose (16.7 mM) and (I) corresponding insulin content (n = 3). (J) Static insulin secretion from INS1(832/13) clonal β-cells transfected with si-scramble or si-Syt9 in response to stimulation by glucose or KCl for 15 min (n = 3). Data are presented as mean ± SEMs. *P < 0.05, **P < 0.01, ***P < 0.001
To gain insights into how Syt9 regulates insulin secretion, we performed dynamic insulin secretion measurements by perifusion63 using islets isolated from Syt9−/− and Syt9+/+ mice (Figures 2B–2I). As expected, high glucose (16.7 mM) elicited increases in early (6 – 16 min) and sustained (17 – 50 min) phases of insulin secretion compared to low glucose (2.8 mM) in both groups of mouse islets (Figure 2B). However, the Syt9−/− mouse islets exhibited higher increases in early and sustained phase insulin secretion compared to Syt9+/+ mouse islets (Figure 2B). These are reflected by the AUCs, which revealed a two-fold increase in the early (Figure 2C, P < 0.04) and a 50% increase in the sustained phase (Figure 2E, P < 0.04) insulin secretion from Syt9−/− vs. Syt9+/+ mouse islets in response to high glucose. KCl is known to cause PM depolarization and facilitates insulin release in the early phase. Consistently, KCl (40 mM at 1.5 mM glucose)-induced early-phase insulin secretion was observed from both Syt9−/− vs. Syt9+/+ mouse islets (Figure 2B). However, islets from Syt9−/− mice exhibited significantly increased insulin secretion compared to Syt9+/+ mouse islets (Figure 2B), as reflected by the 2-fold increase in the AUC for KCl-stimulated insulin secretion profile (Figure 2E, P < 0.004). These outcomes show that Syt9 functions as an inhibitor of biphasic insulin secretion.
Static insulin secretion was performed using islets isolated from Syt9−/− vs. Syt9+/+ mice to gain insights into Syt9-regulated insulin secretion. The 0.5 mM phorbol ester and 40 mM KCl treatment significantly increased insulin secretion compared to basal glucose (2.8 mM) in Syt9+/+ mouse islets. Moreover, higher increases in insulin secretion in response to TPA (2-fold, P < 0.001) and 40 mM KCl (3-fold, P < 0.0007) were observed in Syt9−/− mouse islets (Figure 2G). Similar to islet perfusion outcomes, significant increases in the 11 mM glucose (1.5-fold, P < 0.005) and 16.7 mM glucose (1.8-fold, P < 0.01) stimulated insulin secretion were observed in Syt9−/− vs. Syt9+/+ mouse islets (Figures 2G–2H). Moreover, Syt9 deletion did not affect basal insulin secretion at 2.8 mM glucose (Figures 2B, 2F, 2G, 2H), suggesting that Syt9 regulates stimulus-coupled insulin secretion. Also, islet insulin content remained unchanged upon Syt9 deletion (Figures 2F, 2I), implicating that Syt9 inhibits insulin secretion by modulating the insulin secretory pathway or exocytosis. Since Syt9 deletion increased insulin secretion in response to metabolizable (glucose) and non-metabolizable (TPA and KCl) insulin secretagogues, it indicates that Syt9 functions by regulating distal or late steps in the insulin exocytosis.
To confirm that Syt9 directly affects insulin secretion from β-cells, a small inhibitory (si) RNA approach was used to achieve the knockdown of Syt9 in clonal INS1(832/13) β-cells. Greater than 90 % reduction in Syt9 mRNA (Figure S2A) and protein levels (Figure 5G) were achieved upon Syt9 knockdown in INS1(832/13) cells. As in islets, basal insulin secretion and β-cell insulin content were unaffected in INS1(832/13) cells (Figures S2B–S2C). However, increases in insulin secretion in response to the stimulation by KCl (40 mM at 1.5 mM glucose) and high glucose (15 mM) were observed upon Syt9-knockdown compared to si-scramble INS1(832/13) cells (Figure 2J). Similarly, the hGH reporter was transfected in INS1(832/13) cells expressing siSyt9 and si-Scr; hGH secretion was used to measure insulin secretion. High glucose and KCl treatment caused increases in GH secretion compared to 1.5 mM glucose in INS1(8321/3) cells transfected with siScr (Figures S3A–S3C). Further increases in the GH secretion were observed upon Syt9 knockdown in response to 15 mM glucose and 40 mM KCl, without affecting insulin secretion at 1.5 mM glucose. In this experiment, hGH alone caused increases in glucose and KCl stimulated insulin secretion without affecting basal insulin secretion (Figures S3D–S3E). The following outcomes: increases in plasma insulin levels, biphasic and static ex vivo islets insulin secretion, and insulin secretion from clonal β-cells upon glucose stimulation in response to the loss/knockdown of Syt9 demonstrate that Syt9 inhibitory function is directly attributed to the inhibiting insulin secretion from β-cells.
Figure 5. Syt9 regulates tomosyn-1 protein abundance via the proteasomal degradation pathway.

(A) Representative Western blots showing protein expression in islets isolated from Syt9+/+ and Syt9−/− mice (B-F) Relative protein abundance normalized to β-actin was determined by analyzing protein band intensities of Western blots shown in A by the ImageJ (n=5). (G) Representative Western blots showing protein expression in INS1(832/13) cells transfected with si-Scr and si-Syt9. (H-L) Relative protein abundance normalized to β-actin was determined by analyzing protein band intensities of Western blots shown in G by the ImageJ (n=5). (M) Co-IP was performed by anti-Stx1A and isotype control anti-IgG antibodies using lysates prepared from INS1(832/13) cells transfected with si-Scr and si-Syt9 after stimulation by KCl (40 mM at 1.5 mM glucose) for 15 min. Quantified protein bands in (M) by the ImageJ assessing the relative binding of tomosyn-1 to Stx1A (n=5) (N) and Syt9 to Stx1A (n = 5) (O). (P) Representative Western blot (top) and graph (bottom) generated from three independent experiments. INS1(832/13) cells transfected with si-Scr and si-Syt9 for 48 h were treated with proteasome inhibitor MG132 (5μM) or DMSO for 5 h before cell lysate preparation. The intensity of protein bands was determined using ImageJ, and the data were normalized with β-actin (n=3). Data are presented as mean ± SEMs. *P < 0.05, **P < 0.01, ***P < 0.001.
Syt9 colocalizes and binds with Stx1A, a key protein that forms the SNARE complex required for the fusion of insulin granules.
Stx1A forms SNARE complexes (Stx1A-Snap25-Vamp2) in insulin exocytosis67. Thus, we used confocal imaging to evaluate whether endogenous Syt9 colocalizes with Stx1A. Immunostaining was performed in fixed INS1(832/13) cells. The colocalization of Syt9 (red) with Stx1A (green) is shown as a merge (yellow) (Figure 3A). Tomosyn-1 is an endogenous inhibitor of insulin exocytosis that inhibits Stx1A from forming Stx1A-SNARE complexes68,69. We also observed a colocalization between tomosyn-1 (red) and Stx1A (green) (Figure 3B). The colocalization of Syt9 and tomosyn-1 with Stx1A suggests that these proteins potentially form a molecular complex. Next, we determined whether Syt9, Stx1A, and tomosyn-1 form a protein complex. The INS1(832/13) cell lysates expressing V5-tomosyn-1 were prepared and subjected to co-immunoprecipitation (Co-IP) in lysis buffer containing 0.8 mM Ca2+ (Figure S7). A 4-fold increase in tomosyn-1 protein abundance was observed upon overexpression compared to endogenous levels (Figure 3C, input blot of tomosyn-1). Tomosyn-1 was immunoprecipitated using an anti-V5 antibody, and consequently, the protein complex was subjected to Western blotting. Subsequent analysis showed that Syt9, Stx1A, and tomosyn-1 exist in a molecular complex (Figure 3C). This interaction is specific, as no bands for tomosyn-1, Stx1A, and Syt9 were observed in a protein complex immunoprecipitated by anti-V5 antibody using control INS1(832/13) cell lysates. To further establish this observation, IP was performed to assess the endogenous interaction between Syt9, Stx1A, and tomosyn-1 in INS1(832/13) cells upon KCl (40 mM at 1.5 mM glucose) stimulation. Total cell extracts were prepared to IP Stx1A-protein complex and were subjected to Western blotting for Stx1A, tomosyn-1, and Syt9 proteins. We observed that Syt9 formed a complex with Stx1A and tomosyn-1 in INS1(832/13) cells (Figure 3D). Moreover, the KCl stimulation did not alter the interactions between these proteins compared to basal glucose (1.5 mM glucose), suggesting the formation of the Syt9-Stx1A-tomosyn-1 molecular complex endogenously. Furthermore, Syt9-Stx1A-tomosyn-1 molecular complex formation was observed in human islets (Figure 3E). These results show that Syt9, Stx1A, and tomosyn-1 form a novel molecular complex in INS1(832/13) β-cells and human islets.
Figure 3. Syt9 colocalizes and binds with Stx 1A and tomosyn-1 in β-cells.
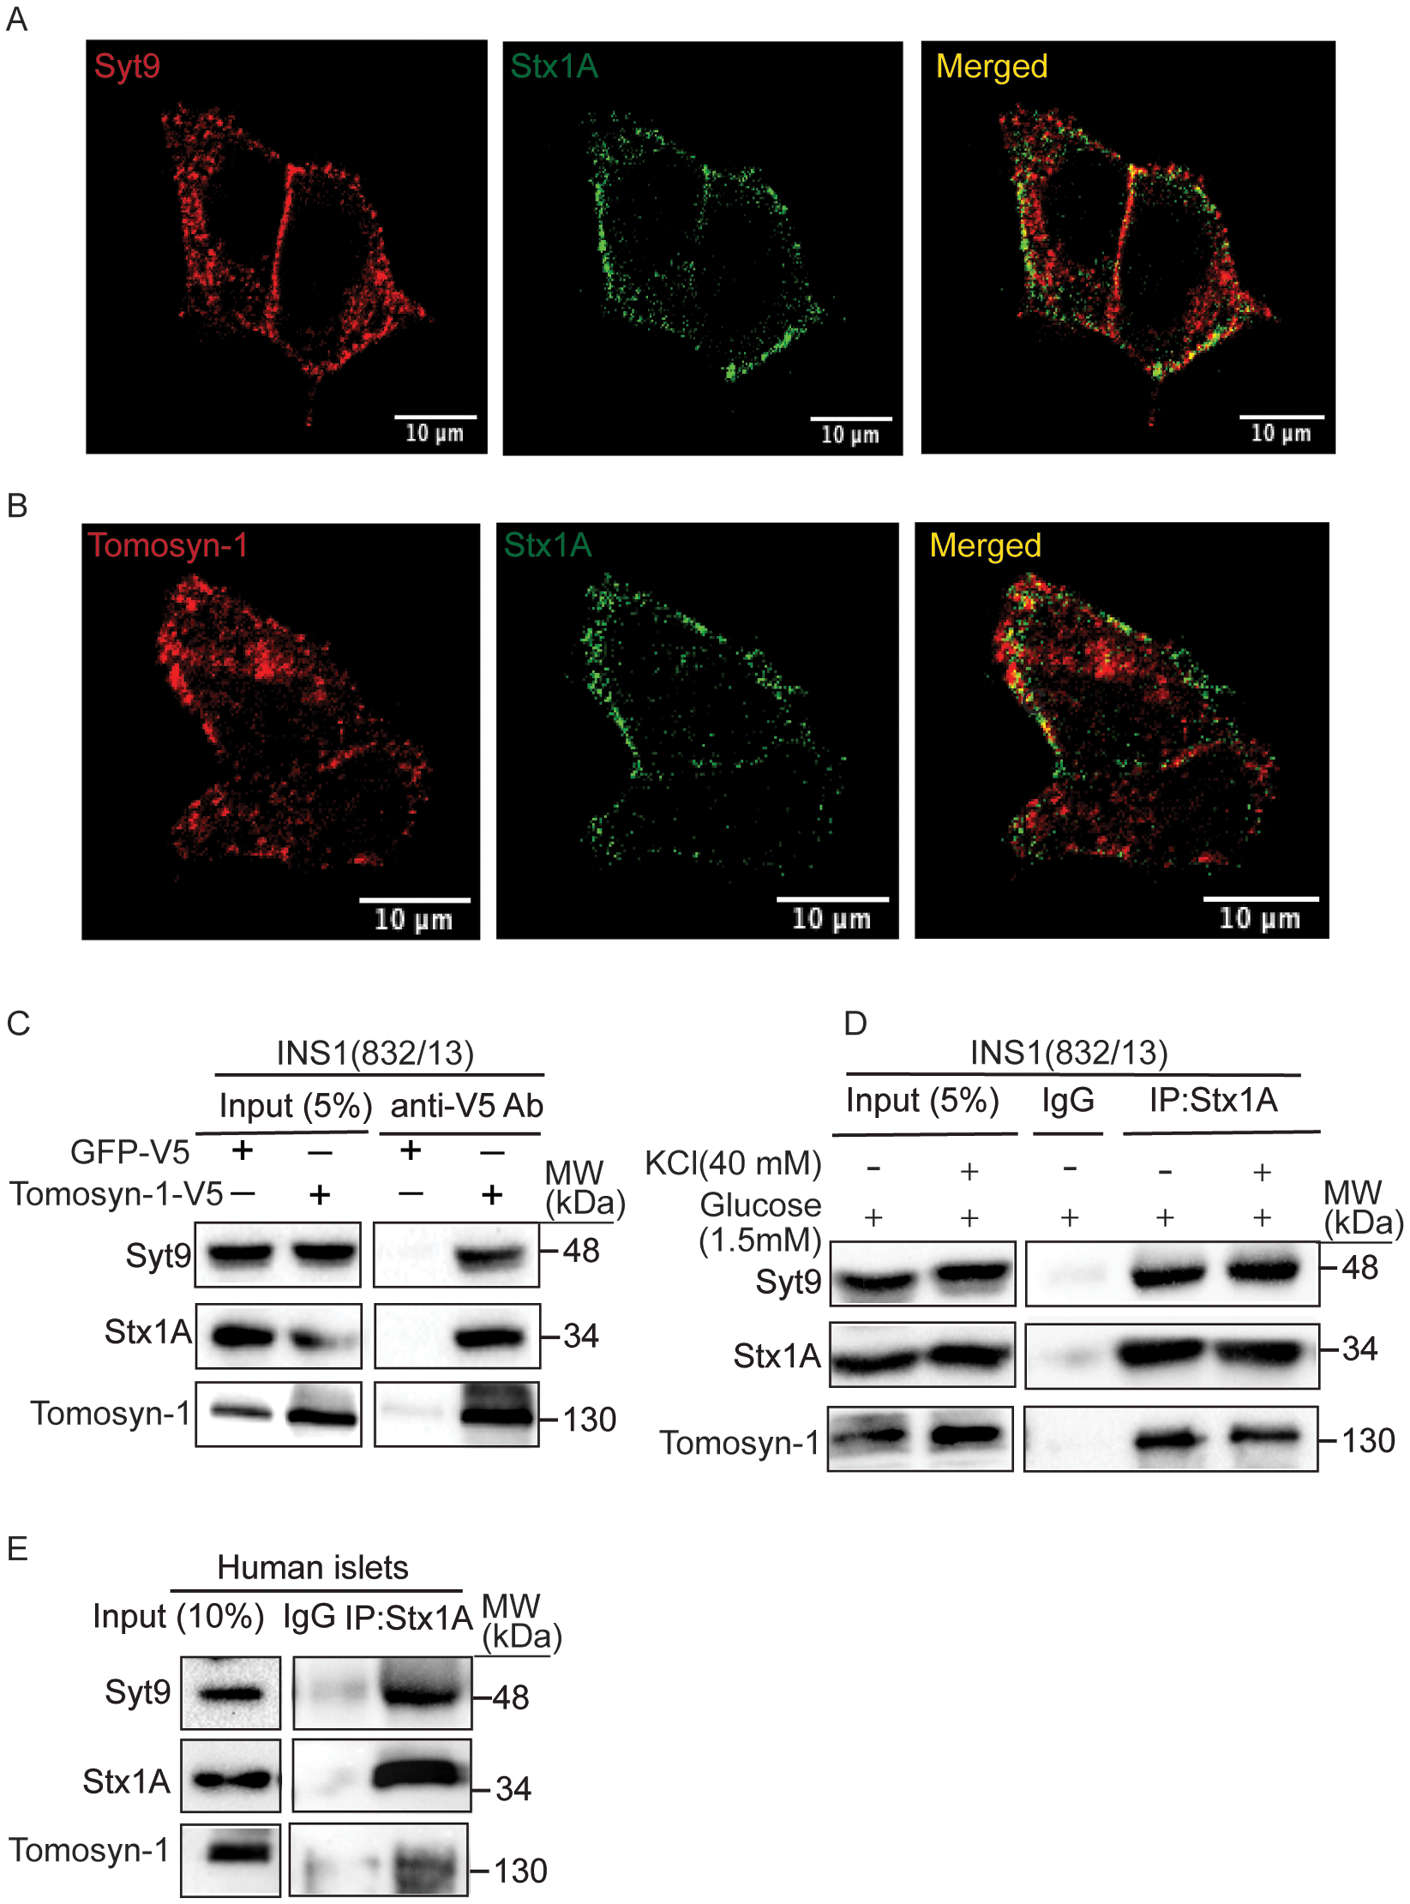
(A) Colocalization of Syt9 (red) and Stx1A (green) and (B) Tomosyn-1 (red) and Stx1A (green) in INS1 (832/13) cells was observed using immunofluorescence. Images were captured using confocal (scale bar = 10 μm) at 60X. (C) Representative Western blot showing outcomes of tomosyn-1 immunoprecipitation (IP). Briefly, INS1(832/13) cells were transfected with either tomosyn-1-V5-RVV or GFP-V5-RVV plasmid, and IP was performed using an anti-V5 antibody (n = 3). (D) Co-IP by anti-Stx1A and isotype control anti-IgG antibodies using lysates prepared from INS1(832/13) cells stimulated with low glucose (1.5 mM) or KCl (40 mM at 1.5 mM glucose). (E) Co-IP by anti-Stx1A and isotype control anti-IgG antibodies using lysates prepared from non-diabetic human islets.
Loss of Syt9 or tomosyn-1 increases the formation of the Stx1A-SNARE complexes.
To assess the inhibitory role of the Stx1A-tomosyn-1-Syt9 protein complex in insulin secretion, we determined whether the knockdown of Syt9 or tomosyn-1 would increase the formation of Stx1A-SNARE complexes (Stx1A-Snap25-Vamp2)-required for the fusion of insulin granules to the PM in insulin exocytosis. INS1(832/13) cells, transfected with si-Syt9, si-tomosyn-1, and si-scramble, were treated with KCl (40 mM at 1.5 mM glucose) for 15 min before the preparation of cell lysates. The protein abundance of Syt9 and tomosyn-1 was reduced by 90% (Figure 4A, input) and >75% (Figure 4D, input), respectively. Anti-Stx1A antibody was used to Co-IP Stx1A protein complex for Western blotting. Binding between Stx1A, Vamp2, and Snap25 was observed in si-scramble cell lysates, confirming Stx1A-SNARE complex formation (Figure 4A). However, increases in the binding of Vamp2 and Snap25 with Stx1A were observed in si-Syt9 or si-tomosyn-1 cell lysates compared to si-scramble control cell lysates (Figures 4A, 4D). Quantification showed significant enrichment of Vamp2/Stx1A (si-Syt9/si-scramble = 3-fold, P < 0.02; si-tomosyn-1/si-scramble = 3-fold, P < 0.01) (Figures 4B, 4E) and Snap25/Stx1A (si-syt9/si-scramble = 2-fold, P < 0.04; si-tomosyn-1/si-scramble = 2-fold, P < 0.01) (Figures 4C, 4F) upon knockdown of Syt9 or tomosyn-1. The absence of Stx1A, Vamp2, and Snap25 in IP performed using isotype control IgG antibody showed specificity in IP of Stx1A-SNARE proteins using anti-Stx1A antibody. These outcomes suggest that Syt9 and tomosyn-1 bind and reduce Stx1A’s ability to form Stx1A-SNARE complexes for the fusion of insulin granules to the PM in exocytosis. These outcomes show that the increases in insulin secretion observed due to the knockdown/loss of Syt9 are due to the enhanced formation of Stx1A-SNARE complexes.
Figure 4. Loss of Syt9 or tomosyn-1 increases the formation of the Stx1A-SNARE complexes.

(A) Co-IP by anti-Stx1A and isotype control anti-IgG antibodies using lysates prepared from INS1(832/13) cells transfected with si-Scramble (Scr) and si-Syt9 after stimulation by KCl for 15 min. Quantified protein bands in (A) by the ImageJ assessing the relative binding of Vamp2 protein to Stx1A (n=5) (B) and Snap25 to Stx1A (n = 5) (C). (D) Co-IP by anti-Stx1A and anti-IgG antibodies using lysates prepared from INS1(832/13) cells transfected with si-Scr and si-tomosyn-1 after stimulation by KCl for 15 min. Quantified protein bands in (D) by the ImageJ assessing the relative binding of Vamp2 protein to Stx1A (n=5) (E) and Snap25 to Stx1A (n = 5) (F). Data are presented as mean ± SEMs. *P < 0.05, **P < 0.01, ***P < 0.001
Knockdown of Syt9 decreases tomosyn-1 protein abundance via the proteasomal pathway.
Findings reported here implicate that Syt9 is an inhibitor of insulin secretion from β-cells (Figures 2–4). Moreover, since it exists in a complex with tomosyn-1, a known endogenous exocytosis inhibitor57,58, we evaluated whether Syt9 modulates tomosyn-1 protein abundance. Alterations in tomosyn-1 protein abundance directly affect exocytosis60. Thus, we determined whether the Syt9 loss/knockdown affects tomosyn-1 protein abundance. Cell lysates were prepared from a) islets isolated from Syt9−/− and Syt9+/+ mice and b) INS1(832/13) cells transfected with si-scramble and si-Syt9. A greater than 75% (P < 0.01) reduction in tomosyn-1 protein abundance (Figures 5A, 5C, 5G, 5I) was observed without alterations in mRNA levels (Figures S4A, 4B) upon Syt9 loss/knockdown. Additionally, Stx1A, Snap25, or Vamp2 protein levels were not affected by Syt9 loss in mouse islets or knockdown of Syt9 in INS1(832/13) cells (Figures 5D–5F, 5J–5L).
Tomosyn-1 is a known binding partner of Stx1A33, and its inhibitory function on exocytosis is attributed to Stx1A binding58,60. Therefore, we posit that reducing tomosyn-1 binding to Stx1A will enhance Stx1A-mediated increases in insulin secretion. Thus, we evaluated whether the reduced protein abundance of tomosyn-1 observed in response to the Syt9 knockdown alters the ability of tomosyn-1 to bind with Stx1A. INS1(832/13) cells transfected with si-Syt9, si-tomosyn-1, and si-scramble were subjected to KCl (40 mM at 1.5 mM glucose) stimulation for 15 min before the preparation of cell lysates. Subsequently, immunoprecipitation with anti-Stx1A antibody was performed to assess the binding of tomosyn-1 and Syt9 with Stx1A in response to tomosyn-1 or Syt9 knockdown. As expected, significantly reduced binding between tomosyn-1 and Stx1A was observed due to the reduction of tomosyn-1 protein levels (by > 75%), achieved by siRNA-mediated tomosyn-1 knockdown (2.4-fold, P < 0.0008) (Figures S5A, S5B). Similarly, a significant reduction in binding between tomosyn-1 with Stx1A was observed upon Syt9 knockdown (1.4-fold decrease, P < 0.04) (Figures 5M, 5N), suggesting that the reduction in tomosyn-1 protein abundance observed due to Syt9 knockdown leads to reduced binding between tomosyn-1 and Stx1A. Moreover, binding between Stx1A and Syt9 upon Syt9 knockdown was reduced significantly (7-fold, P < 0.0009) (Figures 5M, 5O). No enrichment of the Stx1A-tomosyn-1-Syt9 protein complex was observed using an isotype control IgG antibody, showing specificity in immunoprecipitating the Stx1A protein complex using an anti-Stx1A antibody. These outcomes suggest that Syt9-mediated reduction of tomosyn-1 protein levels leads to reduced binding of tomosyn-1 with Stx1A. Increased availability of Stx1A could potentially lead to enhanced Stx1A-SNARE complexes-mediated insulin secretion.
To gain insights into what caused the reduction of tomosyn-1 protein upon Syt9 knockdown, we assessed whether Syt9 regulates tomosyn-1 protein turnover by the proteasomal pathway. INS1(832/13) cells transfected with si-Syt9/si-scramble were treated with 5.0 μM of the proteasomal inhibitor MG132 or DMSO for 5 h. No significant change in tomosyn-1 protein abundance was observed between si-scramble transfected cells treated with MG132 vs. DMSO. However, the reduction in tomosyn-1 protein levels due to si-Syt9-mediated knockdown of Syt9 was rescued by MG132 treatment (Figure 5P), suggesting that the loss of Syt9 subjects tomosyn-1 protein to degradation by proteasomal pathway. These outcomes suggest that Syt9 in a Stx1A-tomosyn-1-Syt9 molecular complex potentially regulates tomosyn-1’s protein stability.
Increased insulin secretion upon Syt9 knockdown is blocked by tomosyn-1.
We assessed whether the effect of Syt9 on insulin secretion is mediated by tomosyn-1. Insulin secretion was performed by overexpressing tomosyn-1 in si-Syt9 or si-scramble INS1(832/13) cells treated with low glucose (1.5 mM), high glucose (15 mM), and KCl (40 mM at 1.5 mM glucose). KCl (Figure 6B) and high glucose (Figure 6C) treatments increased insulin secretion compared to low glucose (Figure 6A) (9-fold increase, P < 0.0001). Moreover, the knockdown of Syt9 caused further increases in insulin secretion in response to the stimulation by KCl and glucose (by ~2-fold, P < 0.05, 4th vs. 1st bar and 5th vs. 2nd bar in Figures 6B and 6C). Overexpression of tomosyn-1 inhibited insulin secretion in response to the stimulation by KCl (3rd vs. 2nd/1st bar, Figure 6B) and high glucose (3rd vs. 2nd/1st bar, Figure 6C) by ~40% (P <0.001). Interestingly, no increase in the KCl- or high glucose-stimulated insulin secretion was observed upon Syt9 knockdown and the overexpression of tomosyn-1 (6th vs. 3rd bar in Figures 6B, 6C). The basal insulin secretion and cellular insulin content were not altered (Figures 6A, S6). These outcomes demonstrate that the increase in insulin secretion observed upon Syt9 loss/knockdown is mediated by tomosyn-1.
Figure 6. Overexpression of tomosyn-1 reverses the increased insulin secretion caused by the loss of Syt9 in β-cells.

(A) Insulin secretion (% of total) in response to low glucose (1.5 mM) stimulation from INS1(832/13) cells overexpressing tomosyn-1 with si-Scr or si-Syt9 (n = 3). (B) Insulin secretion (% of total) in response to KCl (40 mM) stimulation from INS1(832/13) cells overexpressing tomosyn-1 with si-Scr or si-Syt9 (n = 3). (C) Insulin secretion (% of total) in response to high glucose (15 mM) stimulation from INS1(832/13) cells overexpressing tomosyn-1 with si-Scr or si-Syt9 (n = 3). (D) Schematic mechanism showing that upon stimulation of β-cells, SNARE complex (top panel) is formed by the interaction between insulin granule (IG) localized Vamp2 with the plasma membrane (PM) localized Stx1A and Snap25 proteins leading to increased insulin secretion. However, an inhibitory complex is formed between IG containing Syt9, cytosolic tomosyn-1, and Stx1A, reducing the formation of the SNARE complex and resulting in decreased insulin secretion.
Discussion
Stx1A is a well-characterized t-SNARE required for SNARE complex-mediated fusion of insulin granules in the early and sustained phases of insulin secretion25–27. Less is known about how β-cells clamp or inhibit Stx1A to regulate the formation of SNARE complexes in exocytosis. This study shows that increased plasma insulin levels (fed or in response to the oral glucose challenge) and glucose clearance without affecting insulin action (Figures 1–2) were observed in male Syt9−/− mice but not in the Syt9−/− female mice. The sex-dependent differences could be attributed to estrous cyclicity in female mice. Increases in glucose-stimulated insulin secretion (dynamic and static) were observed from ex vivo Syt9−/− islets (Figures 2B–2H). Furthermore, the knockdown of Syt9 in clonal β-cells increased the formation of the Stx1A-SNARE complexes and glucose-stimulated insulin secretion (Figures 2J, 4A–4C). Multiple approaches involving clonal INS1(832/13) β-cells, ex vivo Syt9−/− islets, and Syt9−/− mice were used in this study to show that the loss/knockdown of Syt9 increased glucose-stimulated insulin secretion from β-cells (Figures 1–4) enabled us to conclude that Syt9 has an inhibitory role in insulin secretion. The outcomes of this study identify and characterize the role of Syt9-tomosyn-1-Stx1A inhibitory complex that renders insulin granules nonfusogenic. Investigating how β-cells overcome the inhibition/clamp to modulate SNARE-complexes-mediated fusion of insulin granules in insulin secretion could provide insights into several unresolved facets of insulin exocytosis. Such as: why only a fraction of cellular insulin granules undergo PM fusion upon stimulation70, aged-insulin-containing granules are not preferred for fusion71–74, a mechanism for the loss of early-phase insulin secretion with the onset of impaired glucose tolerance when insulin granule content is not altered74–78, and an increase in fusion-incompetent docked granules and reduced fusion competency of granules in T2D25,26,79–85.
Insulin granules from different cellular pools contribute to biphasic GSIS86. Pre-docked granules are juxtaposed with the PM. They immediately undergo fusion upon stimulation and account for fifty percent of insulin released in the early phase87. In comparison, newcomer granules are present in the cytoplasm away from the PM28. Upon stimulation, they undergo fusion by two plausible modes, short-dock or no-dock, contributing to insulin released in both phases. Our results show that Syt9 deletion increased early and sustained phases of GSIS from islets (Figures 2B, 2F, 2G), implicating that Syt9 potentially regulates the fusion of pre-docked and newcomer insulin granules.
The docking of the insulin granules to the PM is a temporal constraint on granules88. Moreover, mechanisms underlying long- and short-duration docking of pre-docked and newcomer granules still need to be understood entirely. Newcomer granules are trafficked from within the cells to the PM. Thus, it has been postulated that an inhibitor that functions at the insulin granule–PM interface could regulate the fusion of pre-docked and newcomer with short-dock modes of fusion of insulin granules in insulin exocytosis. Stx1A is required for biphasic insulin secretion and facilitates the fusion of pre-docked and newcomer with short-dock insulin granules30. Syt9 (an insulin granule protein) colocalizes and binds with the PM Stx1A (Figures 3, 4). These outcomes, combined with Syt9’s inhibitory function on insulin secretion (Figure 2), suggest that Syt9 potentially functions as an inhibitor (or potentially clamps) of Stx1A, decreasing its availability to form Stx1A-SNARE (Figure 4) complexes-mediated fusion of pre-docked and newcomer (short-dock) insulin granules. How Syt9 modulates fusion modes of insulin granules involving distinct cognate SNARE complexes is part of the future directions.
Syt isoforms have a role in the clamping of SNARE complexes in exocytosis. It has been proposed that the clamping action is achieved by either imposing a significant separation between plasma and granule membranes to form SNARE complexes89 or locking the SNARE complexes in a fusion-incompetent state90–92. Insights into Syt functioning are predominately derived from studies elucidating the role of Syt1 in neurotransmitter release. However, little is known about Syt isoforms that regulate SNARE-mediated insulin exocytosis from β-cells. Our data provide a mechanism by which Syt9 via tomosyn-1 inhibits Stx1A-SNARE complexes in insulin exocytosis. Tomosyn-1 is a soluble cytoplasmic protein that inhibits SNARE complex formation93. It interacts with Stx1A via a short C-terminal domain, clamping Stx1A and Snap25 in a non-fusogenic complex, blocking the stimulatory effects of Munc13–1 and Munc18–1 in facilitating Stx1A-SNARE assembly94,95. Also, tomosyn-1 is known to interact with insulin granules via its N-terminal domains96–100. Present within its N-terminal region, the two unstructured loops are required for tomosyn-1 inhibitory function; it has been reported that deleting both N-terminal unstructured loops blocked tomosyn-1’s ability to inhibit exocytosis while retaining Stx1A binding69. Concurrently, the N-terminal region of tomosyn-1 is essential for binding to Syt isoforms. The interaction between tomosyn-1 and granule protein Syt1 was reported in neurons101. Our data identify that an insulin granule protein Syt9 forms a molecular complex with a soluble cytoplasmic protein tomosyn-1 and a PM protein Stx1A in β-cells (Figures 4B, 5). In addition, the knockdown of Syt9 or tomosyn-1 increased the formation of Stx1A-SNARE complexes and insulin secretion (Figures 4C, 4F). These outcomes support the possibility that the Stx1A-tomosyn-1-Syt9 complex is formed at the PM-insulin granules interface, functioning to attenuate the formation of SNARE complexes for the fusion of insulin granules to the PM in insulin exocytosis. Identifying that Syt9 isoform functions in the clamping of the Stx1A-SNARE complexes via tomosyn-1. Furthermore, supporting that the clamping action of Syt can be achieved by locking the SNARE in a fusion incompetent state. Whether the ability of the Syt9-tomosyn-1-Stx1A complex to decrease the availability of Stx1A to form SNAREs renders insulin granules transiently or completely non-fusogenic remains to be determined.
The availability of Stx1A to form SNARE complexes increases insulin secretion. The data presented here provide a mechanism by which Syt9 inhibits insulin secretion. Syt9 ablation decreased tomosyn-1 protein (not mRNA) levels and the binding of tomosyn-1 with Stx1A (Figures 4B, 4C). Alterations in tomosyn-1 protein abundance affect Stx(s) function proportionally60. Similarly, increases in Stx1A-Snap25-Vamp2 SNARE complexes were observed upon tomosyn-1 knockdown (Figures 4E, 4F). Rescuing tomosyn-1 protein levels blocked increases in insulin secretion due to Syt9 knockdown from β-cells (Figures 6B, 6C). Altogether these outcomes suggest that the loss of Syt9 via post-transcriptional mechanism decreases tomosyn-1 inhibitory function to increase Stx1A-SNARE-mediated insulin secretion. It has been shown that tomosyn-1 is modified post-translationally. Hrd1 E3-polyubiquitin ligase66,102 and protein kinase A103 in neurons, and mono-ubiquitination in β-cells93, regulates the function of tomosyn-1 to modulate exocytosis. Based on these observations and our data, we propose that Syt9 stabilizes tomosyn-1 in the Syt9-tomosyn-1-Stx1A to form a non-fusogenic complex attenuating the fusion of insulin granules to the PM. Whether Syt9 has tomosyn-1-independent effects on insulin secretion requires further investigation. Moreover, how nutritional and hormonal signaling pathways regulate Syt9 and tomosyn-1 inhibitory functions in affecting Stx1A-SNARE complexes formation remains part of future studies.
The important question that needs to be addressed is the identification of the Syt isoform in β-cells involved that facilitate the formation of Stx1A-SNARE complexes upon Syt9 loss. It is known that multiple Syt isoforms can be present on the same granules. Syt1 is present on granules containing Syt7 and Syt9104 in PC12 cells. However, in β-cells, insulin granules harbor distinct isoforms of Syts, conferring different functional roles in exocytosis104. A recent study reported that Syt7 and Syt9 are present on distinct granules in β-cells105. Our data show that tomosyn-1 inhibits the Syt9 insulin granules from forming Stx1A-SNARE complexes. Thus, the Syt isoform that functions as a Ca2+ sensor in facilitating the fusion of Syt9-insulin granules in insulin exocytosis remains to be determined. A possible role of a calcium sensor other than Syt9 that increases insulin secretion from the islets of Syt9 knockout mice remains to be identified. Moreover, further studies are required to assess whether Syt9 insulin granules are fusogenic and how these granules undergo fusion to the plasma membrane.
The limitation of this work is the use of a constitutive Syt9 deletion mouse model. However, it also enabled the identification of Syt9-tomosyn-1-Stx1A as an inhibitory complex that modulates the fusion of insulin granules. A previous study reported that mice with the pancreas wide Syt9 deletion exhibited no difference in the plasma insulin levels and glucose clearance to intraperitoneal glucose injection compared to the control mice106. However, whether male or female mice were used in this study is unclear. If female mice were used, the reported phenotypes in this study are consistent with our data obtained using Syt9−/− female mice (Figure S1). However, if male mice were used, there exists a divergence in the reported phenotypes between the two studies. Differences in the reported phenotypes could be due to using different Syt9 deletion mouse models used between the two studies (pancreas vs. constitutive). Moreover, differences in the genetic background, microbiome, and choice of glucose clearance (oral GTT vs. IPGTT) could potentially have contributed to differential outcomes. The oral GTT invokes a response from the gut incretins to release insulin secretion from β-cells. Glucagon-like peptide-1 (GLP-1) is known to potentiate glucose stimulated insulin release by inducing the PKA-mediated phosphorylation of Syt7 in pancreatic β-cells54. Another study reported that the reduction of Syt9 by RNA interference reduced GH released from INS1E cells co-transfected with hGH reporter in response to the glucose stimulation107,108; secretion of hGH was used as a surrogate for insulin secretion. We repeated this experiment in INS1(832/13) cells. Syt9 knockdown increased hGH secretion from INS1(832/13) cells (Figures S3A–S3C). In this experiment, we also observed that hGH increased insulin secretion (Figures S3D, S3E). This observation was consistent with the published studies showing that GH directly increases insulin secretion from β-cells (reviewed109). Collectively, suggesting that using an hGH reporter as a surrogate for insulin secretion is not ideal. However, hGH as a reporter may still be useful for measuring secretion from other cell types. Our data implicate that Syt9 has an inhibitory role in regulating insulin secretion that is mediated by regulating tomosyn-1 protein abundance. The divergence of reported phenotypes between the published studies and this work suggests that a future study is warranted using β-cell-specific Syt9 mice, which will be the next step in further clarifying the role of Syt9 in β-cell function during the physiology and obesity pathophysiology.
In conclusion, this work has identified Syt9 as an endogenous inhibitor of Stx1A-SNARE complexes-mediate insulin secretion, consequently improving glucose clearance. Insights into the mechanism demonstrate that Syt9 forms a non-fusogenic molecular complex with tomosyn-1 and Stx1A between the PM and insulin granules, limiting the Stx1A-SNARE complex-mediated fusion of insulin granules to the PM. Further, the inhibitory effects of Syt9 on Stx1A-SNARE complex formation and insulin secretion are mediated by modulating the tomosyn-1 protein abundance and binding ability to Stx1A.
Supplementary Material
Acknowledgments:
We thank Drs. Sasanka Ramanadham and Jeonga-a Kim for critical feedback on the project and manuscript. We also thank Dr. Edwin Chapman for giving us Syt9 gene deletion mice. We especially thank the human islet donors for contributing to this study.
Funding:
This work was also supported by National Institutes of Health NIDDK Grants 4 R00 DK95975-03, R01DK120684, 1R21DK129968-01, and Diabetes Research Center (DRC) Grant P30DK079626-10 (to S.B). The authors declare that they have no conflicts of interest with the contents of this article. The content is solely the responsibility of the authors and does not necessarily represent the official views of the National Institutes of Health.
Footnotes
Competing interests: The authors declare no competing interests.
Data availability statement:
The data that supports the findings of this study are available in the methods and/or supplementary material of this article. The raw data supporting the conclusions of this article will be made available by the authors without undue reservation.
References
- 1.Grodsky GM A threshold distribution hypothesis for packet storage of insulin and its mathematical modeling. J Clin Invest 51, 2047–2059 (1972). 10.1172/JCI107011 [DOI] [PMC free article] [PubMed] [Google Scholar]
- 2.Barbosa RM et al. Control of pulsatile 5-HT/insulin secretion from single mouse pancreatic islets by intracellular calcium dynamics. J Physiol 510 (Pt 1), 135–143 (1998). 10.1111/j.1469-7793.1998.135bz.x [DOI] [PMC free article] [PubMed] [Google Scholar]
- 3.Ashcroft FM, Harrison DE & Ashcroft SJ Glucose induces closure of single potassium channels in isolated rat pancreatic beta-cells. Nature 312, 446–448 (1984). 10.1038/312446a0 [DOI] [PubMed] [Google Scholar]
- 4.Kennedy HJ et al. Glucose generates sub-plasma membrane ATP microdomains in single islet beta-cells. Potential role for strategically located mitochondria. J Biol Chem 274, 13281–13291 (1999). 10.1074/jbc.274.19.13281 [DOI] [PubMed] [Google Scholar]
- 5.Rutter GA Nutrient-secretion coupling in the pancreatic islet beta-cell: recent advances. Mol Aspects Med 22, 247–284 (2001). 10.1016/s0098-2997(01)00013-9 [DOI] [PubMed] [Google Scholar]
- 6.Rorsman P & Ashcroft FM Pancreatic beta-Cell Electrical Activity and Insulin Secretion: Of Mice and Men. Physiol Rev 98, 117–214 (2018). 10.1152/physrev.00008.2017 [DOI] [PMC free article] [PubMed] [Google Scholar]
- 7.Gandasi NR et al. Ca2+ channel clustering with insulin-containing granules is disturbed in type 2 diabetes. J Clin Invest 127, 2353–2364 (2017). 10.1172/JCI88491 [DOI] [PMC free article] [PubMed] [Google Scholar]
- 8.Barg S, Eliasson L, Renstrom E & Rorsman P A subset of 50 secretory granules in close contact with L-type Ca2+ channels accounts for first-phase insulin secretion in mouse beta-cells. Diabetes 51 Suppl 1, S74–82 (2002). 10.2337/diabetes.51.2007.s74 [DOI] [PubMed] [Google Scholar]
- 9.Henquin JC The dual control of insulin secretion by glucose involves triggering and amplifying pathways in beta-cells. Diabetes Res Clin Pract 93 Suppl 1, S27–31 (2011). 10.1016/S0168-8227(11)70010-9 [DOI] [PubMed] [Google Scholar]
- 10.Mitrakou A et al. Role of reduced suppression of glucose production and diminished early insulin release in impaired glucose tolerance. N Engl J Med 326, 22–29 (1992). 10.1056/NEJM199201023260104 [DOI] [PubMed] [Google Scholar]
- 11.Esser N, Utzschneider KM & Kahn SE Early beta cell dysfunction vs insulin hypersecretion as the primary event in the pathogenesis of dysglycaemia. Diabetologia 63, 2007–2021 (2020). 10.1007/s00125-020-05245-x [DOI] [PubMed] [Google Scholar]
- 12.Staimez LR et al. Evidence of reduced beta-cell function in Asian Indians with mild dysglycemia. Diabetes Care 36, 2772–2778 (2013). 10.2337/dc12-2290 [DOI] [PMC free article] [PubMed] [Google Scholar]
- 13.Utzschneider KM et al. Oral disposition index predicts the development of future diabetes above and beyond fasting and 2-h glucose levels. Diabetes Care 32, 335–341 (2009). 10.2337/dc08-1478 [DOI] [PMC free article] [PubMed] [Google Scholar]
- 14.Festa A, Williams K, D’Agostino R Jr., Wagenknecht LE & Haffner SM The natural course of beta-cell function in nondiabetic and diabetic individuals: the Insulin Resistance Atherosclerosis Study. Diabetes 55, 1114–1120 (2006). 10.2337/diabetes.55.04.06.db05-1100 [DOI] [PubMed] [Google Scholar]
- 15.Jensen CC et al. Beta-cell function is a major contributor to oral glucose tolerance in high-risk relatives of four ethnic groups in the U.S. Diabetes 51, 2170–2178 (2002). 10.2337/diabetes.51.7.2170 [DOI] [PubMed] [Google Scholar]
- 16.Weyer C, Bogardus C, Mott DM & Pratley RE The natural history of insulin secretory dysfunction and insulin resistance in the pathogenesis of type 2 diabetes mellitus. J Clin Invest 104, 787–794 (1999). 10.1172/JCI7231 [DOI] [PMC free article] [PubMed] [Google Scholar]
- 17.Abdul-Ghani MA, Jenkinson CP, Richardson DK, Tripathy D & DeFronzo RA Insulin secretion and action in subjects with impaired fasting glucose and impaired glucose tolerance: results from the Veterans Administration Genetic Epidemiology Study. Diabetes 55, 1430–1435 (2006). 10.2337/db05-1200 [DOI] [PubMed] [Google Scholar]
- 18.Abdul-Ghani MA, Tripathy D & DeFronzo RA Contributions of beta-cell dysfunction and insulin resistance to the pathogenesis of impaired glucose tolerance and impaired fasting glucose. Diabetes Care 29, 1130–1139 (2006). 10.2337/diacare.2951130 [DOI] [PubMed] [Google Scholar]
- 19.Defronzo RA Banting Lecture. From the triumvirate to the ominous octet: a new paradigm for the treatment of type 2 diabetes mellitus. Diabetes 58, 773–795 (2009). 10.2337/db09-9028 [DOI] [PMC free article] [PubMed] [Google Scholar]
- 20.Ferrannini E et al. beta-Cell function in subjects spanning the range from normal glucose tolerance to overt diabetes: a new analysis. J Clin Endocrinol Metab 90, 493–500 (2005). 10.1210/jc.2004-1133 [DOI] [PubMed] [Google Scholar]
- 21.Hull RL et al. Dietary-fat-induced obesity in mice results in beta cell hyperplasia but not increased insulin release: evidence for specificity of impaired beta cell adaptation. Diabetologia 48, 1350–1358 (2005). 10.1007/s00125-005-1772-9 [DOI] [PubMed] [Google Scholar]
- 22.Peyot ML et al. Beta-cell failure in diet-induced obese mice stratified according to body weight gain: secretory dysfunction and altered islet lipid metabolism without steatosis or reduced beta-cell mass. Diabetes 59, 2178–2187 (2010). 10.2337/db09-1452 [DOI] [PMC free article] [PubMed] [Google Scholar]
- 23.Eliasson L et al. Novel aspects of the molecular mechanisms controlling insulin secretion. J Physiol 586, 3313–3324 (2008). 10.1113/jphysiol.2008.155317 [DOI] [PMC free article] [PubMed] [Google Scholar]
- 24.Leung YM, Kwan EP, Ng B, Kang Y & Gaisano HY SNAREing voltage-gated K+ and ATP-sensitive K+ channels: tuning beta-cell excitability with syntaxin-1A and other exocytotic proteins. Endocr Rev 28, 653–663 (2007). 10.1210/er.2007-0010 [DOI] [PubMed] [Google Scholar]
- 25.Wang Z & Thurmond DC Mechanisms of biphasic insulin-granule exocytosis - roles of the cytoskeleton, small GTPases and SNARE proteins. J Cell Sci 122, 893–903 (2009). 10.1242/jcs.034355 [DOI] [PMC free article] [PubMed] [Google Scholar]
- 26.Kwan EP & Gaisano HY Rescuing the subprime meltdown in insulin exocytosis in diabetes. Ann N Y Acad Sci 1152, 154–164 (2009). 10.1111/j.1749-6632.2008.03990.x [DOI] [PubMed] [Google Scholar]
- 27.Sudhof TC & Rothman JE Membrane fusion: grappling with SNARE and SM proteins. Science 323, 474–477 (2009). 10.1126/science.1161748 [DOI] [PMC free article] [PubMed] [Google Scholar]
- 28.Gaisano HY Here come the newcomer granules, better late than never. Trends Endocrinol Metab 25, 381–388 (2014). 10.1016/j.tem.2014.03.005 [DOI] [PubMed] [Google Scholar]
- 29.Lai Y, Lou X, Wang C, Xia T & Tong J Synaptotagmin 1 and Ca2+ drive trans SNARE zippering. Sci Rep 4, 4575 (2014). 10.1038/srep04575 [DOI] [PMC free article] [PubMed] [Google Scholar]
- 30.Liang T et al. New Roles of Syntaxin-1A in Insulin Granule Exocytosis and Replenishment. J Biol Chem 292, 2203–2216 (2017). 10.1074/jbc.M116.769885 [DOI] [PMC free article] [PubMed] [Google Scholar]
- 31.Oh E, Kalwat MA, Kim MJ, Verhage M & Thurmond DC Munc18–1 regulates first-phase insulin release by promoting granule docking to multiple syntaxin isoforms. J Biol Chem 287, 25821–25833 (2012). 10.1074/jbc.M112.361501 [DOI] [PMC free article] [PubMed] [Google Scholar]
- 32.Ohara-Imaizumi M et al. Imaging analysis reveals mechanistic differences between first- and second-phase insulin exocytosis. J Cell Biol 177, 695–705 (2007). 10.1083/jcb.200608132 [DOI] [PMC free article] [PubMed] [Google Scholar]
- 33.Barg S, Knowles MK, Chen X, Midorikawa M & Almers W Syntaxin clusters assemble reversibly at sites of secretory granules in live cells. Proc Natl Acad Sci U S A 107, 20804–20809 (2010). 10.1073/pnas.1014823107 [DOI] [PMC free article] [PubMed] [Google Scholar]
- 34.Knowles MK et al. Single secretory granules of live cells recruit syntaxin-1 and synaptosomal associated protein 25 (SNAP-25) in large copy numbers. Proc Natl Acad Sci U S A 107, 20810–20815 (2010). 10.1073/pnas.1014840107 [DOI] [PMC free article] [PubMed] [Google Scholar]
- 35.Ohara-Imaizumi M et al. Correlation of syntaxin-1 and SNAP-25 clusters with docking and fusion of insulin granules analysed by total internal reflection fluorescence microscopy. Diabetologia 47, 2200–2207 (2004). 10.1007/s00125-004-1579-0 [DOI] [PubMed] [Google Scholar]
- 36.Martin F, Moya F, Gutierrez LM, Reig JA & Soria B Role of syntaxin in mouse pancreatic beta cells. Diabetologia 38, 860–863 (1995). 10.1007/s001250050364 [DOI] [PubMed] [Google Scholar]
- 37.Vikman J, Ma X, Hockerman GH, Rorsman P & Eliasson L Antibody inhibition of synaptosomal protein of 25 kDa (SNAP-25) and syntaxin 1 reduces rapid exocytosis in insulin-secreting cells. J Mol Endocrinol 36, 503–515 (2006). 10.1677/jme.1.01978 [DOI] [PubMed] [Google Scholar]
- 38.Ostenson CG, Gaisano H, Sheu L, Tibell A & Bartfai T Impaired gene and protein expression of exocytotic soluble N-ethylmaleimide attachment protein receptor complex proteins in pancreatic islets of type 2 diabetic patients. Diabetes 55, 435–440 (2006). 10.2337/diabetes.55.02.06.db04-1575 [DOI] [PubMed] [Google Scholar]
- 39.Sheu L et al. Regulation of insulin exocytosis by Munc13–1. J Biol Chem 278, 27556–27563 (2003). 10.1074/jbc.M303203200 [DOI] [PubMed] [Google Scholar]
- 40.Bielopolski N et al. Differential interaction of tomosyn with syntaxin and SNAP25 depends on domains in the WD40 beta-propeller core and determines its inhibitory activity. J Biol Chem 289, 17087–17099 (2014). 10.1074/jbc.M113.515296 [DOI] [PMC free article] [PubMed] [Google Scholar]
- 41.Li C et al. Ca(2+)-dependent and -independent activities of neural and non-neural synaptotagmins. Nature 375, 594–599 (1995). 10.1038/375594a0 [DOI] [PubMed] [Google Scholar]
- 42.Rizo J & Sudhof TC C2-domains, structure and function of a universal Ca2+-binding domain. J Biol Chem 273, 15879–15882 (1998). 10.1074/jbc.273.26.15879 [DOI] [PubMed] [Google Scholar]
- 43.Perin MS, Fried VA, Mignery GA, Jahn R & Sudhof TC Phospholipid binding by a synaptic vesicle protein homologous to the regulatory region of protein kinase C. Nature 345, 260–263 (1990). 10.1038/345260a0 [DOI] [PubMed] [Google Scholar]
- 44.Takamori S et al. Molecular anatomy of a trafficking organelle. Cell 127, 831–846 (2006). 10.1016/j.cell.2006.10.030 [DOI] [PubMed] [Google Scholar]
- 45.Wilhelm BG et al. Composition of isolated synaptic boutons reveals the amounts of vesicle trafficking proteins. Science 344, 1023–1028 (2014). 10.1126/science.1252884 [DOI] [PubMed] [Google Scholar]
- 46.Chapman ER How does synaptotagmin trigger neurotransmitter release? Annu Rev Biochem 77, 615–641 (2008). 10.1146/annurev.biochem.77.062005.101135 [DOI] [PubMed] [Google Scholar]
- 47.Kuo W, Herrick DZ, Ellena JF & Cafiso DS The calcium-dependent and calcium-independent membrane binding of synaptotagmin 1: two modes of C2B binding. J Mol Biol 387, 284–294 (2009). 10.1016/j.jmb.2009.01.064 [DOI] [PMC free article] [PubMed] [Google Scholar]
- 48.Courtney NA, Bao H, Briguglio JS & Chapman ER Synaptotagmin 1 clamps synaptic vesicle fusion in mammalian neurons independent of complexin. Nat Commun 10, 4076 (2019). 10.1038/s41467-019-12015-w [DOI] [PMC free article] [PubMed] [Google Scholar]
- 49.Xu J, Pang ZP, Shin OH & Sudhof TC Synaptotagmin-1 functions as a Ca2+ sensor for spontaneous release. Nat Neurosci 12, 759–766 (2009). 10.1038/nn.2320 [DOI] [PMC free article] [PubMed] [Google Scholar]
- 50.Geppert M et al. Synaptotagmin I: a major Ca2+ sensor for transmitter release at a central synapse. Cell 79, 717–727 (1994). 10.1016/0092-8674(94)90556-8 [DOI] [PubMed] [Google Scholar]
- 51.Broadie K, Bellen HJ, DiAntonio A, Littleton JT & Schwarz TL Absence of synaptotagmin disrupts excitation-secretion coupling during synaptic transmission. Proc Natl Acad Sci U S A 91, 10727–10731 (1994). 10.1073/pnas.91.22.10727 [DOI] [PMC free article] [PubMed] [Google Scholar]
- 52.Littleton JT, Stern M, Perin M & Bellen HJ Calcium dependence of neurotransmitter release and rate of spontaneous vesicle fusions are altered in Drosophila synaptotagmin mutants. Proc Natl Acad Sci U S A 91, 10888–10892 (1994). 10.1073/pnas.91.23.10888 [DOI] [PMC free article] [PubMed] [Google Scholar]
- 53.Lee J, Guan Z, Akbergenova Y & Littleton JT Genetic analysis of synaptotagmin C2 domain specificity in regulating spontaneous and evoked neurotransmitter release. J Neurosci 33, 187–200 (2013). 10.1523/JNEUROSCI.3214-12.2013 [DOI] [PMC free article] [PubMed] [Google Scholar]
- 54.Wu B et al. Synaptotagmin-7 phosphorylation mediates GLP-1-dependent potentiation of insulin secretion from beta-cells. Proc Natl Acad Sci U S A 112, 9996–10001 (2015). 10.1073/pnas.1513004112 [DOI] [PMC free article] [PubMed] [Google Scholar]
- 55.Gao Z, Reavey-Cantwell J, Young RA, Jegier P & Wolf BA Synaptotagmin III/VII isoforms mediate Ca2+-induced insulin secretion in pancreatic islet beta -cells. J Biol Chem 275, 36079–36085 (2000). 10.1074/jbc.M004284200 [DOI] [PubMed] [Google Scholar]
- 56.Gauthier BR et al. Synaptotagmin VII splice variants alpha, beta, and delta are expressed in pancreatic beta-cells and regulate insulin exocytosis. FASEB J 22, 194–206 (2008). 10.1096/fj.07-8333com [DOI] [PubMed] [Google Scholar]
- 57.Gustavsson N et al. Impaired insulin secretion and glucose intolerance in synaptotagmin-7 null mutant mice. Proc Natl Acad Sci U S A 105, 3992–3997 (2008). 10.1073/pnas.0711700105 [DOI] [PMC free article] [PubMed] [Google Scholar]
- 58.Craxton M, Olsen A & Goedert M Human synaptotagmin V (SYT5): sequence, genomic structure, and chromosomal location. Genomics 42, 165–169 (1997). 10.1006/geno.1997.4722 [DOI] [PubMed] [Google Scholar]
- 59.Gauthier BR & Wollheim CB Synaptotagmins bind calcium to release insulin. Am J Physiol Endocrinol Metab 295, E1279–1286 (2008). 10.1152/ajpendo.90568.2008 [DOI] [PubMed] [Google Scholar]
- 60.Seibert MJ, Evans CS, Stanley KS, Wu Z & Chapman ER Synaptotagmin 9 Modulates Spontaneous Neurotransmitter Release in Striatal Neurons by Regulating Substance P Secretion. J Neurosci 43, 1475–1491 (2023). 10.1523/JNEUROSCI.1857-22.2023 [DOI] [PMC free article] [PubMed] [Google Scholar]
- 61.Roper LK, Briguglio JS, Evans CS, Jackson MB & Chapman ER Sex-specific regulation of follicle-stimulating hormone secretion by synaptotagmin 9. Nat Commun 6, 8645 (2015). 10.1038/ncomms9645 [DOI] [PMC free article] [PubMed] [Google Scholar]
- 62.Xu J, Mashimo T & Sudhof TC Synaptotagmin-1, −2, and −9: Ca(2+) sensors for fast release that specify distinct presynaptic properties in subsets of neurons. Neuron 54, 567–581 (2007). 10.1016/j.neuron.2007.05.004 [DOI] [PubMed] [Google Scholar]
- 63.Bhatnagar S et al. Positional cloning of a type 2 diabetes quantitative trait locus; tomosyn-2, a negative regulator of insulin secretion. PLoS Genet 7, e1002323 (2011). 10.1371/journal.pgen.1002323 [DOI] [PMC free article] [PubMed] [Google Scholar]
- 64.Gupta R et al. Complement 1q-like-3 protein inhibits insulin secretion from pancreatic beta-cells via the cell adhesion G protein-coupled receptor BAI3. J Biol Chem 293, 18086–18098 (2018). 10.1074/jbc.RA118.005403 [DOI] [PMC free article] [PubMed] [Google Scholar]
- 65.Rabaglia ME et al. Alpha-Ketoisocaproate-induced hypersecretion of insulin by islets from diabetes-susceptible mice. Am J Physiol Endocrinol Metab 289, E218–224 (2005). 10.1152/ajpendo.00573.2004 [DOI] [PubMed] [Google Scholar]
- 66.Bhatnagar S et al. Phosphorylation and degradation of tomosyn-2 de-represses insulin secretion. J Biol Chem 289, 25276–25286 (2014). 10.1074/jbc.M114.575985 [DOI] [PMC free article] [PubMed] [Google Scholar]
- 67.Thurmond DC & Gaisano HY Recent Insights into Beta-cell Exocytosis in Type 2 Diabetes. J Mol Biol 432, 1310–1325 (2020). 10.1016/j.jmb.2019.12.012 [DOI] [PMC free article] [PubMed] [Google Scholar]
- 68.Cheviet S et al. Tomosyn-1 is involved in a post-docking event required for pancreatic beta-cell exocytosis. J Cell Sci 119, 2912–2920 (2006). 10.1242/jcs.03037 [DOI] [PubMed] [Google Scholar]
- 69.Williams AL et al. Structural and functional analysis of tomosyn identifies domains important in exocytotic regulation. J Biol Chem 286, 14542–14553 (2011). 10.1074/jbc.M110.215624 [DOI] [PMC free article] [PubMed] [Google Scholar]
- 70.Rorsman P & Renstrom E Insulin granule dynamics in pancreatic beta cells. Diabetologia 46, 1029–1045 (2003). 10.1007/s00125-003-1153-1 [DOI] [PubMed] [Google Scholar]
- 71.Duncan RR et al. Functional and spatial segregation of secretory vesicle pools according to vesicle age. Nature 422, 176–180 (2003). 10.1038/nature01389 [DOI] [PubMed] [Google Scholar]
- 72.Ivanova A et al. Age-dependent labeling and imaging of insulin secretory granules. Diabetes 62, 3687–3696 (2013). 10.2337/db12-1819 [DOI] [PMC free article] [PubMed] [Google Scholar]
- 73.Gold G, Gishizky ML & Grodsky GM Evidence that glucose “marks” beta cells resulting in preferential release of newly synthesized insulin. Science 218, 56–58 (1982). [DOI] [PubMed] [Google Scholar]
- 74.Gerich JE Is reduced first-phase insulin release the earliest detectable abnormality in individuals destined to develop type 2 diabetes? Diabetes 51 Suppl 1, S117–121 (2002). [DOI] [PubMed] [Google Scholar]
- 75.Davies MJ et al. Loss of the first phase insulin response to intravenous glucose in subjects with persistent impaired glucose tolerance. Diabet Med 11, 432–436 (1994). [DOI] [PubMed] [Google Scholar]
- 76.Del Prato S & Tiengo A The importance of first-phase insulin secretion: implications for the therapy of type 2 diabetes mellitus. Diabetes Metab Res Rev 17, 164–174 (2001). 10.1002/dmrr.198 [DOI] [PubMed] [Google Scholar]
- 77.Kaihara KA et al. beta-Cell-specific protein kinase A activation enhances the efficiency of glucose control by increasing acute-phase insulin secretion. Diabetes 62, 1527–1536 (2013). 10.2337/db12-1013 [DOI] [PMC free article] [PubMed] [Google Scholar]
- 78.Thiebaud D et al. The effect of graded doses of insulin on total glucose uptake, glucose oxidation, and glucose storage in man. Diabetes 31, 957–963 (1982). [DOI] [PubMed] [Google Scholar]
- 79.Ohara-Imaizumi M et al. TIRF imaging of docking and fusion of single insulin granule motion in primary rat pancreatic beta-cells: different behaviour of granule motion between normal and Goto-Kakizaki diabetic rat beta-cells. Biochem J 381, 13–18 (2004). 10.1042/BJ20040434 [DOI] [PMC free article] [PubMed] [Google Scholar]
- 80.Gandasi NR et al. Glucose-Dependent Granule Docking Limits Insulin Secretion and Is Decreased in Human Type 2 Diabetes. Cell Metab 27, 470–478 e474 (2018). 10.1016/j.cmet.2017.12.017 [DOI] [PubMed] [Google Scholar]
- 81.Aslamy A & Thurmond DC Exocytosis proteins as novel targets for diabetes prevention and/or remediation? Am J Physiol Regul Integr Comp Physiol 312, R739–R752 (2017). 10.1152/ajpregu.00002.2017 [DOI] [PMC free article] [PubMed] [Google Scholar]
- 82.Seino S, Shibasaki T & Minami K Dynamics of insulin secretion and the clinical implications for obesity and diabetes. J Clin Invest 121, 2118–2125 (2011). 10.1172/JCI45680 [DOI] [PMC free article] [PubMed] [Google Scholar]
- 83.Oh E & Thurmond DC Munc18c depletion selectively impairs the sustained phase of insulin release. Diabetes 58, 1165–1174 (2009). 10.2337/db08-1059 [DOI] [PMC free article] [PubMed] [Google Scholar]
- 84.Jewell JL, Oh E & Thurmond DC Exocytosis mechanisms underlying insulin release and glucose uptake: conserved roles for Munc18c and syntaxin 4. Am J Physiol Regul Integr Comp Physiol 298, R517–531 (2010). https://doi.org:00597.2009 [pii] 10.1152/ajpregu.00597.2009 [DOI] [PMC free article] [PubMed] [Google Scholar]
- 85.Nevins AK & Thurmond DC Glucose regulates the cortical actin network through modulation of Cdc42 cycling to stimulate insulin secretion. American journal of physiology. Cell physiology 285, C698–710 (2003). 10.1152/ajpcell.00093.2003 [DOI] [PubMed] [Google Scholar]
- 86.Gerhard DS et al. Evidence against Ha-ras-1 involvement in sporadic and familial melanoma. Nature 325, 73–75 (1987). 10.1038/325073a0 [DOI] [PubMed] [Google Scholar]
- 87.Gaus B, Bruning D, Gross S, Muller M & Rustenbeck I The changing view of insulin granule mobility: From conveyor belt to signaling hub. Front Endocrinol (Lausanne) 13, 983152 (2022). 10.3389/fendo.2022.983152 [DOI] [PMC free article] [PubMed] [Google Scholar]
- 88.Kasai K, Fujita T, Gomi H & Izumi T Docking is not a prerequisite but a temporal constraint for fusion of secretory granules. Traffic 9, 1191–1203 (2008). 10.1111/j.1600-0854.2008.00744.x [DOI] [PubMed] [Google Scholar]
- 89.van den Bogaart G et al. Synaptotagmin-1 may be a distance regulator acting upstream of SNARE nucleation. Nat Struct Mol Biol 18, 805–812 (2011). 10.1038/nsmb.2061 [DOI] [PMC free article] [PubMed] [Google Scholar]
- 90.Chicka MC, Hui E, Liu H & Chapman ER Synaptotagmin arrests the SNARE complex before triggering fast, efficient membrane fusion in response to Ca2+. Nat Struct Mol Biol 15, 827–835 (2008). 10.1038/nsmb.1463 [DOI] [PMC free article] [PubMed] [Google Scholar]
- 91.Voleti R, Jaczynska K & Rizo J Ca(2+)-dependent release of synaptotagmin-1 from the SNARE complex on phosphatidylinositol 4,5-bisphosphate-containing membranes. Elife 9 (2020). 10.7554/eLife.57154 [DOI] [PMC free article] [PubMed] [Google Scholar]
- 92.Grushin K et al. Structural basis for the clamping and Ca(2+) activation of SNARE-mediated fusion by synaptotagmin. Nat Commun 10, 2413 (2019). 10.1038/s41467-019-10391-x [DOI] [PMC free article] [PubMed] [Google Scholar]
- 93.Ferdaoussi M et al. SUMOylation and calcium control syntaxin-1A and secretagogin sequestration by tomosyn to regulate insulin exocytosis in human ss cells. Sci Rep 7, 248 (2017). 10.1038/s41598-017-00344-z [DOI] [PMC free article] [PubMed] [Google Scholar]
- 94.Li Y, Wang S, Li T, Zhu L & Ma C Tomosyn guides SNARE complex formation in coordination with Munc18 and Munc13. FEBS Lett 592, 1161–1172 (2018). 10.1002/1873-3468.13018 [DOI] [PubMed] [Google Scholar]
- 95.Geerts CJ et al. Tomosyn associates with secretory vesicles in neurons through its N- and C-terminal domains. PLoS One 12, e0180912 (2017). 10.1371/journal.pone.0180912 [DOI] [PMC free article] [PubMed] [Google Scholar]
- 96.Yu H, Rathore SS, Gulbranson DR & Shen J The N- and C-terminal domains of tomosyn play distinct roles in soluble N-ethylmaleimide-sensitive factor attachment protein receptor binding and fusion regulation. J Biol Chem 289, 25571–25580 (2014). 10.1074/jbc.M114.591487 [DOI] [PMC free article] [PubMed] [Google Scholar]
- 97.Lehman K, Rossi G, Adamo JE & Brennwald P Yeast homologues of tomosyn and lethal giant larvae function in exocytosis and are associated with the plasma membrane SNARE, Sec9. The Journal of cell biology 146, 125–140 (1999). [DOI] [PMC free article] [PubMed] [Google Scholar]
- 98.Yamamoto Y et al. Tomosyn inhibits synaptotagmin-1-mediated step of Ca2+-dependent neurotransmitter release through its N-terminal WD40 repeats. Journal of Biological Chemistry 285, 40943–40955 (2010). [DOI] [PMC free article] [PubMed] [Google Scholar]
- 99.Fujita Y et al. Tomosyn: a syntaxin-1–binding protein that forms a novel complex in the neurotransmitter release process. Neuron 20, 905–915 (1998). [DOI] [PubMed] [Google Scholar]
- 100.Sakisaka T et al. Dual inhibition of SNARE complex formation by tomosyn ensures controlled neurotransmitter release. J Cell Biol 183, 323–337 (2008). 10.1083/jcb.200805150 [DOI] [PMC free article] [PubMed] [Google Scholar]
- 101.Yamamoto Y et al. Tomosyn inhibits synaptotagmin-1-mediated step of Ca2+-dependent neurotransmitter release through its N-terminal WD40 repeats. J Biol Chem 285, 40943–40955 (2010). 10.1074/jbc.M110.156893 [DOI] [PMC free article] [PubMed] [Google Scholar]
- 102.Saldate JJ, Shiau J, Cazares VA & Stuenkel EL The ubiquitin-proteasome system functionally links neuronal Tomosyn-1 to dendritic morphology. J Biol Chem 293, 2232–2246 (2018). 10.1074/jbc.M117.815514 [DOI] [PMC free article] [PubMed] [Google Scholar]
- 103.Baba T, Sakisaka T, Mochida S & Takai Y PKA-catalyzed phosphorylation of tomosyn and its implication in Ca2+-dependent exocytosis of neurotransmitter. J Cell Biol 170, 1113–1125 (2005). 10.1083/jcb.200504055 [DOI] [PMC free article] [PubMed] [Google Scholar]
- 104.Zhang Z et al. Release mode of large and small dense-core vesicles specified by different synaptotagmin isoforms in PC12 cells. Mol Biol Cell 22, 2324–2336 (2011). 10.1091/mbc.E11-02-0159 [DOI] [PMC free article] [PubMed] [Google Scholar]
- 105.Kreutzberger AJB et al. Distinct insulin granule subpopulations implicated in the secretory pathology of diabetes types 1 and 2. Elife 9 (2020). 10.7554/eLife.62506 [DOI] [PMC free article] [PubMed] [Google Scholar]
- 106.Gustavsson N et al. Neuronal calcium sensor synaptotagmin-9 is not involved in the regulation of glucose homeostasis or insulin secretion. PLoS One 5, e15414 (2010). 10.1371/journal.pone.0015414 [DOI] [PMC free article] [PubMed] [Google Scholar]
- 107.Iezzi M, Eliasson L, Fukuda M & Wollheim CB Adenovirus-mediated silencing of synaptotagmin 9 inhibits Ca2+-dependent insulin secretion in islets. FEBS Lett 579, 5241–5246 (2005). 10.1016/j.febslet.2005.08.047 [DOI] [PubMed] [Google Scholar]
- 108.Iezzi M, Kouri G, Fukuda M & Wollheim CB Synaptotagmin V and IX isoforms control Ca2+ -dependent insulin exocytosis. J Cell Sci 117, 3119–3127 (2004). 10.1242/jcs.01179 [DOI] [PubMed] [Google Scholar]
- 109.Wang S, Wu J, Wang N, Zeng L & Wu Y The role of growth hormone receptor in beta cell function. Growth Horm IGF Res 36, 30–35 (2017). 10.1016/j.ghir.2017.08.002 [DOI] [PubMed] [Google Scholar]
Associated Data
This section collects any data citations, data availability statements, or supplementary materials included in this article.
Supplementary Materials
Data Availability Statement
The data that supports the findings of this study are available in the methods and/or supplementary material of this article. The raw data supporting the conclusions of this article will be made available by the authors without undue reservation.