

Abstract
Tumor‐initiating cells are major drivers of chemoresistance and attractive targets for cancer therapy, however, their identity in human pancreatic ductal adenocarcinoma (PDAC) and the key molecules underlying their traits remain poorly understood. Here, we show that a cellular subpopulation with partial epithelial‐mesenchymal transition (EMT)‐like signature marked by high expression of receptor tyrosine kinase‐like orphan receptor 1 (ROR1) is the origin of heterogeneous tumor cells in PDAC. We demonstrate that ROR1 depletion suppresses tumor growth, recurrence after chemotherapy, and metastasis. Mechanistically, ROR1 induces the expression of Aurora kinase B (AURKB) by activating E2F through c‐Myc to enhance PDAC proliferation. Furthermore, epigenomic analyses reveal that ROR1 is transcriptionally dependent on YAP/BRD4 binding at the enhancer region, and targeting this pathway reduces ROR1 expression and prevents PDAC growth. Collectively, our findings reveal a critical role for ROR1high cells as tumor‐initiating cells and the functional importance of ROR1 in PDAC progression, thereby highlighting its therapeutic targetability.
Keywords: AURKB, BRD4, pancreatic adenocarcinoma, ROR1, tumor‐initiating cells
Subject Categories: Cancer
ROR1 marks an aggressive partial EMT cell cluster and enhances PDAC proliferation via c‐Myc/E2F/AURKB signaling.
Introduction
Pancreatic ductal adenocarcinoma (PDAC) is a malignant neoplasm with a poor prognosis. PDAC is highly aggressive, with a propensity for both local invasion and distant metastasis in the early stage, and is resistant to most treatments (Kleeff et al, 2016; Mizrahi et al, 2020), resulting in a 5‐year overall survival rate of approximately 10% (National Cancer Institute. Cancer Stat Facts: Pancreatic Cancer. https://seer.cancer.gov/statfacts/html/pancreas.html). Deep whole‐exome sequencing identified a high frequency of somatic DNA mutations in KRAS (> 90%), TP53 (> 70%), CDKN2A, and SMAD4 (both at approximately 30%; Raphael et al, 2017). Moreover, 60% of the tumors with wild‐type KRAS harbored an alternative RAS‐MAPK activating pathway, which highlights the importance of the RAS pathway in PDAC. Recently, inhibitors against mutant KRASG12D or KRASG12C have been developed and have provided hope for breakthrough therapies in malignancies with KRAS mutations, including PDAC (Canon et al, 2019; Mao et al, 2022; Wang et al, 2022). However, resistance mechanisms have become uncovered, and thus, other therapeutic strategies have also been explored (Xue et al, 2020; Awad et al, 2021).
Intratumor heterogeneity contributes substantially to the characteristics of aggressive tumors, such as a high frequency of metastasis and resistance to treatment (Shibue & Weinberg, 2017). In particular, tumor‐initiating cells (also referred to as cancer stem cells: CSCs) have been considered the source of cellular heterogeneity (Clarke et al, 2006; Shackleton et al, 2009; Magee et al, 2012). Their highly plastic nature allows tumor‐initiating cells to generate a cellular hierarchy similar to that of normal tissue (Marusyk et al, 2020). The existence and importance of tumor‐initiating cells are evidenced by their capabilities for tumorigenesis, metastasis, and recurrence in multiple malignancies (Bonnet & Dick, 1997; Al‐Hajj et al, 2003; Singh et al, 2003; Dalerba et al, 2007; O'Brien et al, 2007; Ricci‐Vitiani et al, 2007; Barker et al, 2009; Batlle & Clevers, 2017; De Sousa et al, 2017; Shimokawa et al, 2017). Thus, tumor‐initiating cells play a central role in tumor progression. In PDAC, previous studies of intratumor heterogeneity have shown that subpopulations of cells marked by CD44+/CD24+/ESA+ (Li et al, 2007), CD133 (Hermann et al, 2007), DCLK1 (Bailey et al, 2014), and Musashi (Fox et al, 2016; Lytle et al, 2019) are functionally distinct tumor‐initiating cells. However, at single‐cell resolution, it is poorly understood how intratumor heterogeneity is involved in disease progression. In addition, the therapeutic benefit of eradicating tumor‐initiating cells in PDAC remains unclear. Here, we conducted single‐cell RNA sequencing and functional approaches using human PDAC xenografts to identify targetable tumor‐initiating cells. We found that a partial epithelial‐mesenchymal transition (EMT)‐like subpopulation with high expression of receptor tyrosine kinase‐like orphan receptor 1 (ROR1) serves as a source of intratumor heterogeneity. We demonstrated that ROR1high cells have high tumorigenicity and that ROR1 is functionally crucial for tumor growth, relapse, and metastasis. Moreover, ROR1 activates the E2F transcriptional network through c‐Myc, which accelerates tumor proliferation by inducing Aurora kinase B (AURKB). Epigenomic analyses identified the enhancer that supports high expression of ROR1 through the YAP/BRD4 axis. In addition, a BET inhibitor downregulated ROR1 and suppressed the proliferation of PDAC organoids. Our current findings indicate that intratumor ROR1high cells are tumor‐initiating cells in PDAC, emphasizing the potential of strategies targeting ROR1 in PDAC therapy.
Results
Single‐cell RNA sequencing reveals intratumor heterogeneity in a pancreatic cancer xenograft
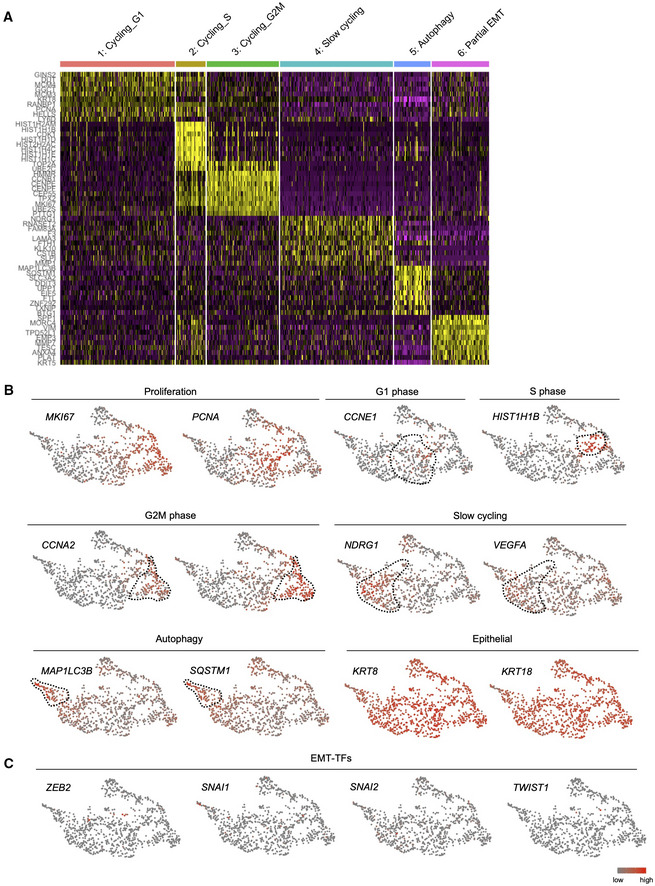
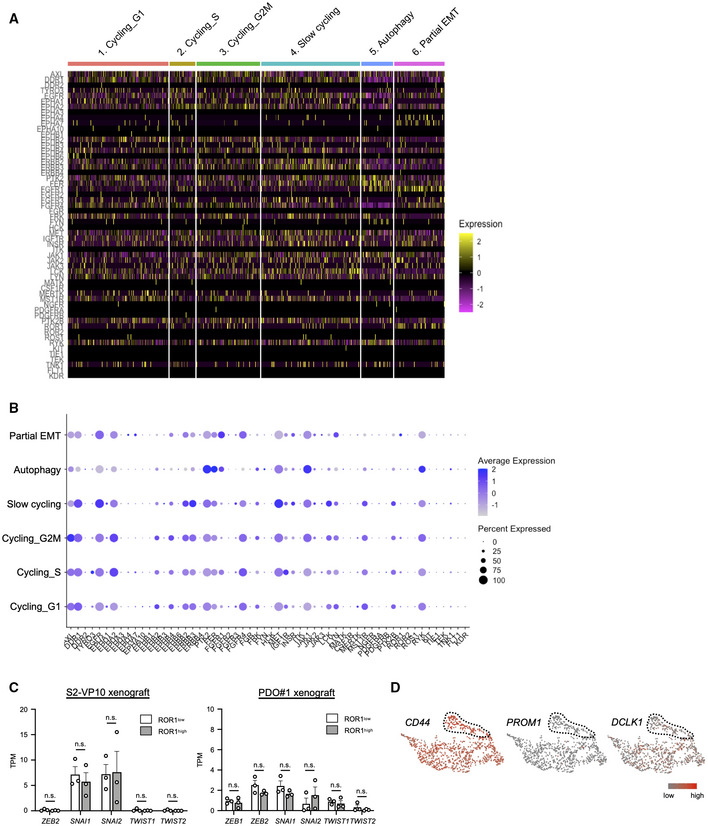
To identify cellular diversity in PDAC, we first performed single‐cell RNA sequencing (scRNA‐seq) in a subcutaneous xenograft generated from the S2‐VP10 PDAC cell line using the 10× Genomics platform (Fig 1A and Appendix Fig S1). A total of 993 human PDAC cells were carried forward for downstream analysis after filtering low‐quality and mitochondria‐enriched cells from 2,655 cells (see Materials and Methods for details). We then performed clustering analysis and visualized the results using uniform manifold approximation and projection (UMAP) implemented in the Seurat package (Stuart et al, 2019). This analysis identified six major clusters with distinct gene expression profiles (Figs 1B–E, and EV1A and B): cluster 1 (cycling_G1 cells, 27.1%); cluster 2 (cycling_S cells, 17.0%); cluster 3 (cycling_G2M cells, 7.0%); cluster 4 (slow cycling cells, 26.7%); cluster 5 (autophagy cells, 8.6%); and cluster 6 (partial EMT cells, 13.6%). Cluster 4 exhibited higher expression levels of HIF‐1‐regulated genes such as NDRG1 and VEGFA (Ellen et al, 2008; Fig EV1B), suggesting that these cells were located in hypoxic areas away from blood vessels in the tumor. In cluster 6, EMT‐related markers (ZEB1, MSRB3, and VIM) were highly expressed, while the expression of epithelial cell adhesion markers (CDH1, EPCAM, and OCLN) was reduced (Fig 1F). However, classical EMT‐activating transcription factors (EMT‐TFs), such as ZEB2, SNAI1, SNAI2, and TWIST1, were barely detectable (Fig EV1C). In addition, this cluster retained the expression of epithelial origin markers, such as KRT8 and KRT18 (Dominguez et al, 2020; Fig EV1B). Puram et al (2017) defined partial EMT as a status characterized by the expression of EMT‐associated extracellular matrix genes without classical EMT‐TFs in head and neck cancer. Furthermore, Dongre & Weinberg (2019) recently re‐defined the partial EMT state as a hybrid of epithelial and mesenchymal phenotypes. In our study, the transcriptional profile of cluster 6 cells closely resembled that of a previously reported partial EMT malignancy.
Figure 1. Single‐cell transcriptomic analysis in pancreatic tumor xenografts and patient PDAC.
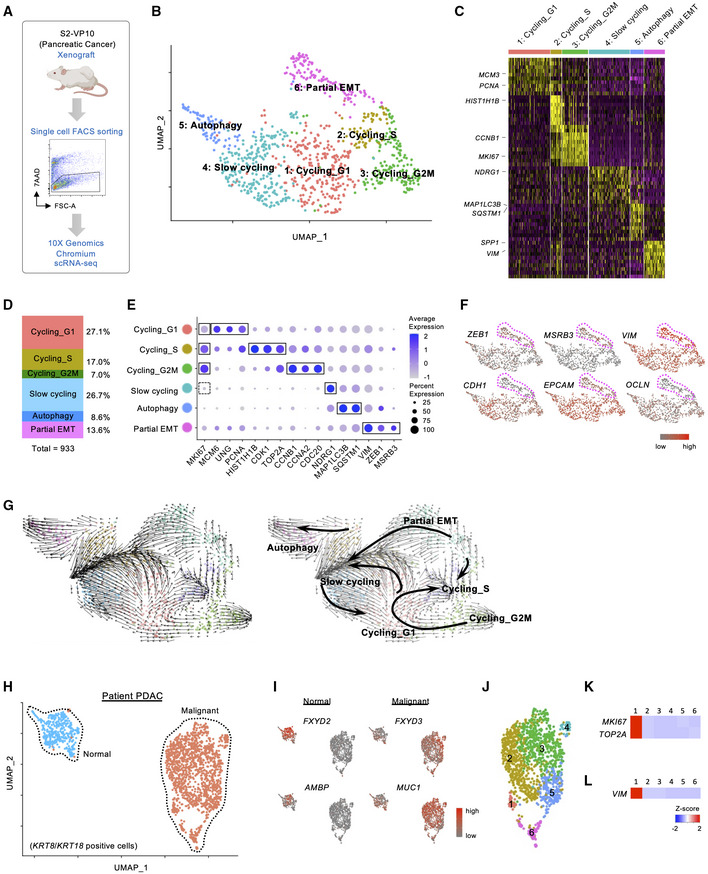
- Schematic workflow for single‐cell RNA sequencing analysis using the S2‐VP10 pancreatic tumor xenograft
- UMAP plot of scRNA‐seq data in the S2‐VP10 xenograft. Six clusters of cell populations are indicated by different colors.
- Heatmap showing the expression of cluster‐specific genes. Representative marker genes for each cluster are indicated.
- Relative proportions of each cluster.
- Dot plot showing the expression levels and frequencies of marker genes in six subpopulations. The solid (high expression) and dotted (low expression) lines indicate representative markers for each cluster.
- UMAP plot showing the expression levels of EMT markers. The magenta dotted lines indicate cluster 6 (partial EMT).
- RNA velocity field projected onto the UMAP plot.
- UMAP plot of the patient PDAC scRNA‐seq data. Normal ductal cells and malignant cells are intermingled.
- UMAP plots showing the expression levels of normal ductal cell markers (FXYD2 and AMBP) or malignant cell markers (FXYD3 and MUC1).
- UMAP plot of malignant cells in the patient PDAC. Different colors represent six clusters of cell populations.
- Heatmap visualizing the expression levels of proliferation markers.
- Heatmap showing the expression level of VIM.
Figure EV1. scRNA‐seq data in S2‐VP10 xenografts.
-
AHeatmap showing the expression of cluster‐specific genes.
-
B, CUMAP plots displaying selected marker gene expression.
To estimate the cell lineages and potential cells of origin in the heterogeneous xenograft, we next performed RNA velocity analysis using velocyto (La Manno et al, 2018), a tool for predicting the future state of individual cells based on a balance between unspliced and spliced mRNAs. We found two distinct velocity flows originating from the partial EMT cluster: (i) to the cycling state, including cycling G1, cycling S, and cycling G2M, and (ii) to the slow‐cycling state (Fig 1G). These data suggest that the partial EMT population serves as the source of heterogeneous subpopulations in the xenograft and thus contains tumor‐initiating cells.
To investigate the relevance of our findings in the S2‐VP10 xenograft to patient PDAC, we analyzed publicly available scRNA‐seq data (Peng et al, 2019). This analysis revealed two KRT8/KRT18 populations (Figs 1H and EV2A), and one of the clusters was a tumor cell population expressing malignant markers such as FXYD3 and MUC1 (Fig 1I; Peng et al, 2019). Based on gene expression characteristics, we identified six distinct cell clusters in malignant cells (Figs 1J, and EV2B and C). In cluster 1, proliferation‐related genes such as MKI67 and TOP2A were highly expressed (Fig 1K), suggesting that this population may be a potential origin of tumor growth. In addition, this cluster exhibited higher expression of VIM (Fig 1L) but lacked expression of EMT‐TFs (Fig EV2D). These data indicate that similar cells with a partial EMT signature exist not only in our xenograft model but also in patient PDAC.
Figure EV2. scRNA‐seq data in patient PDAC.
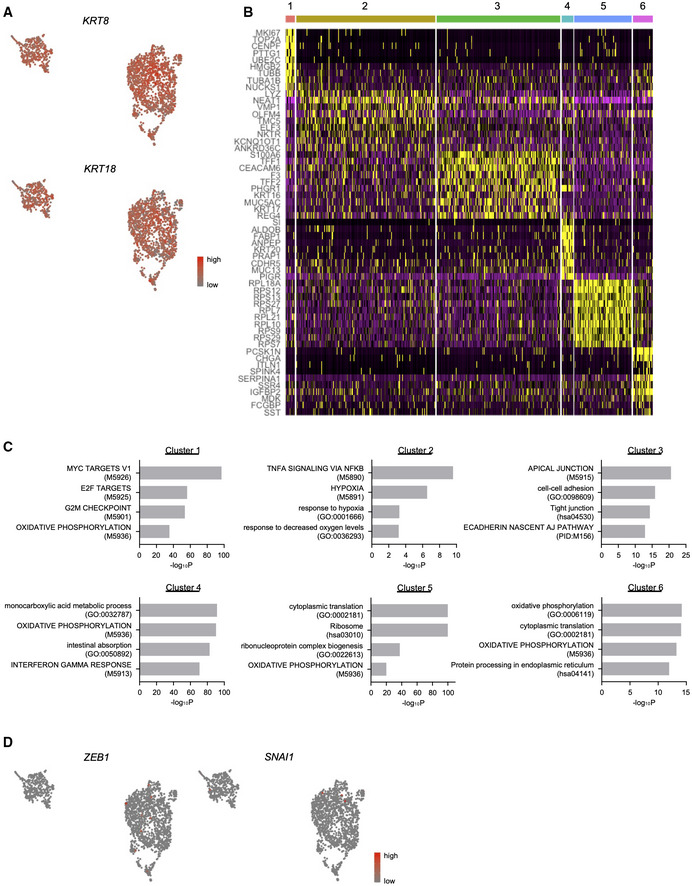
- UMAP plot showing the expression levels of epithelial markers.
- Heatmap showing the expression of cluster‐specific genes.
- Gene set enrichment analysis of six subpopulations using Metascape.
- UMAP plot displaying the expression levels of EMT‐TFs.
ROR1 marks the partial EMT population
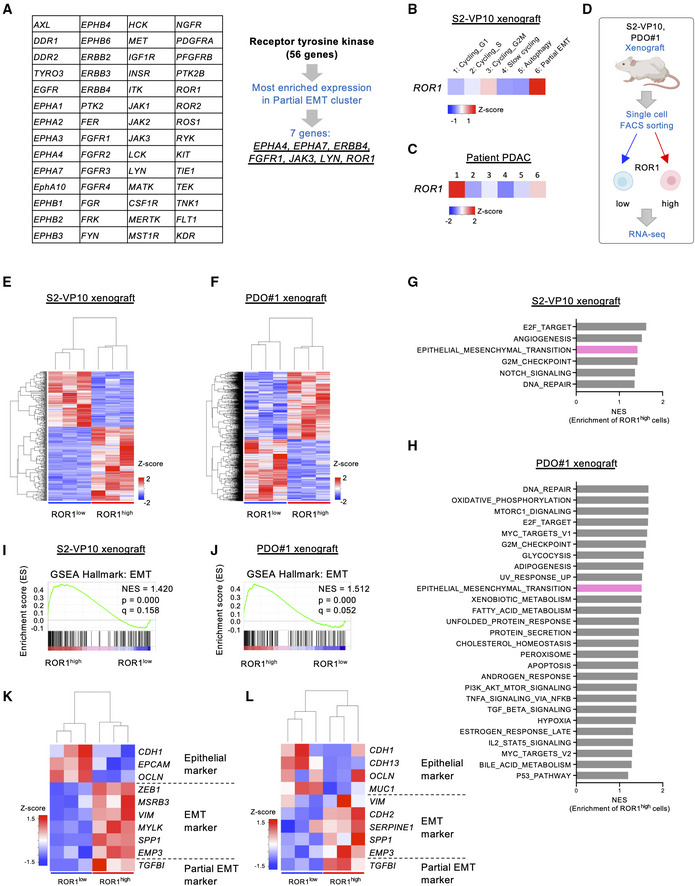
To isolate potential tumor‐initiating cells and validate their properties, we investigated the specific cell surface markers of partial EMT cells. We focused on receptor tyrosine kinases (RTKs) because the aberrant activation of RTKs plays a critical role in the development and progression of cancer (Lemmon & Schlessinger, 2010). From 56 RTK genes, seven candidate genes were selected with the most enriched expression in the partial EMT cluster compared to other clusters: EPHA4, EPHA7, ERBB4, FGFR1, JAK3, LYN, and ROR1 (Figs 2A, and EV3A and B, and Table EV1). ROR1 is reported as an oncofetal antigen and is widely expressed in multiple human cancers (Zhang et al, 2012b). In addition, high expression of ROR1 is associated with shorter metastasis‐free survival in breast cancer (Cui et al, 2013). In addition, we found that ROR1 is highly expressed in the partial EMT subpopulation of patient PDAC as well as S2‐VP10 xenografts (Fig 2B and C). Therefore, we focused on ROR1 as a marker for isolating partial EMT cells.
Figure 2. ROR1 is a surface marker for partial EMT cells in PDAC.
-
AStrategy to identify surface markers for partial EMT cells in the S2‐VP10 xenograft.
-
B, CHeatmap visualizing the expression of ROR1 in the S2‐VP10 xenograft (B) and patient PDAC (C).
-
DOutline of the experimental strategy for transcriptome analysis of cells isolated from the S2‐VP10 xenograft and PDO#1 xenograft (n = 3).
-
E, FHeatmap of DEGs in ROR1high and ROR1low cells in the S2‐VP10 xenograft (E) or PDO#1 xenograft (F).
- G, H
-
I, JGSEA plot showing significant upregulation of the EMT‐related gene set in ROR1high cells in the S2‐VP10 xenograft (I) or PDO#1 xenograft (J).
-
K, LHeatmap showing epithelial, EMT, and partial EMT marker genes that are differentially expressed in ROR1high versus ROR1low cells in S2‐VP10 xenografts (K) or PDO#1 xenografts (L).
Figure EV3. Identification of the markers for partial EMT populations in PDAC.
- Heatmap showing the expression of RTK genes within individual cells.
- Dot plot displaying the expression of RTK genes in subpopulations.
- Expression levels of classical EMT TF genes in ROR1high cells and ROR1low cells from S2‐VP10 and PDO#1 xenografts (n = 3).
- UMAP plots displaying known CSC marker gene expression. Dotted lines indicate the ROR1high subpopulation.
Data information: Data are presented as mean ± s.e.m., two‐sided t‐test. n.s., not significant.
Source data are available online for this figure.
To confirm whether ROR1 is a reliable marker of the partial EMT population, we isolated ROR1high and ROR1low cells by FACS from xenografts derived from S2‐VP10 cells or patient‐derived organoid (PDO) #1, and then performed RNA sequencing (Fig 2D–F, and Table EV2 and Dataset EV1). Gene set enrichment analysis (GSEA; Subramanian et al, 2005) revealed that intratumor ROR1high cells showed upregulation of EMT pathway genes compared with ROR1low cells (Fig 2G–J, and Tables EV3 and EV4), consistent with the scRNA‐seq data. ROR1high cells had higher expression of EMT‐related genes but lower expression of epithelial markers than ROR1low cells (Fig 2K and L). The partial EMT marker TGFBI (Puram et al, 2017) was also highly expressed in ROR1high cells (Fig 2K and L). ROR1high cells showed no significant upregulation of classical EMT TFs, such as ZEB2, SNAI1/2, and TWIST1/2, compared with ROR1low cells (Fig EV3C). These results confirmed that ROR1 serves as a marker for partial EMT cells. Known CSC markers, such as CD44, PROM1 (encoding CD133), and DCLK1, did not show a distinctive expression pattern in our scRNA‐seq data (Fig EV3D).
ROR1high cells exhibit a high tumor‐initiating capacity
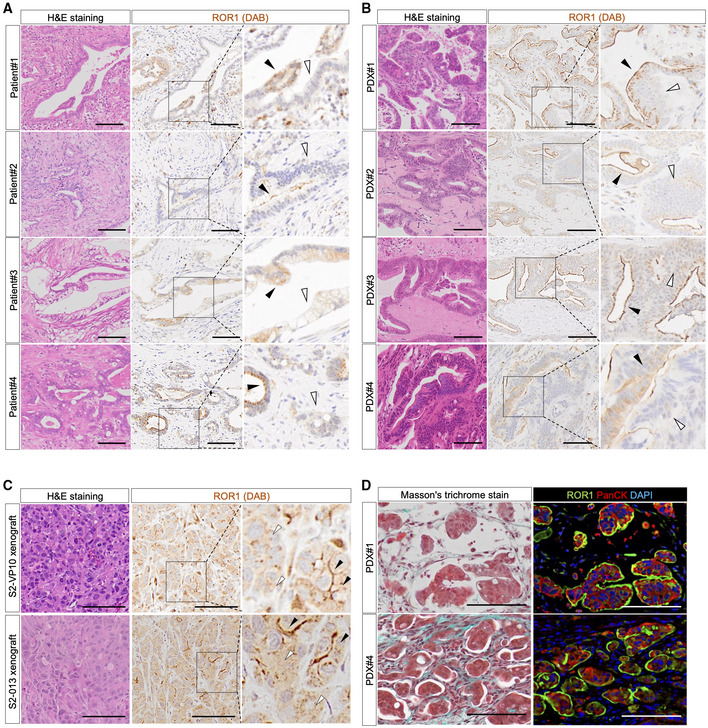
We investigated the distribution of ROR1high cells in PDAC tissue. Immunohistochemical staining showed heterogeneous expression of ROR1 in patient samples and patient‐derived xenografts (PDXs; Fig EV4A and B). Similarly, ROR1high cells were heterogeneously present in S2‐VP10 and S2‐013 xenografts (Fig EV4C). Part of the tumor tissue showed a micropapillary pattern, a factor indicating a poor prognosis (Reid et al, 2011), and was positive for ROR1 and pan‐cytokeratin (an epithelial malignancy marker) staining (Fig EV4D).
Figure EV4. ROR1 immunostaining in patient tumors and xenografts.
-
A–CRepresentative images of patient PDAC (A), parental PDXs (B), and cell‐derived xenografts (from S2‐VP10 and S2‐013) (C) stained with H&E and for ROR1. Black arrow, positive areas; white arrow, negative areas of ROR1.
-
DRepresentative images of Masson's trichrome and immunohistochemical staining for ROR1 and PanCK in patient‐derived xenografts (PDX).
Data information: Scale bars, 100 μm (A–D).
Source data are available online for this figure.
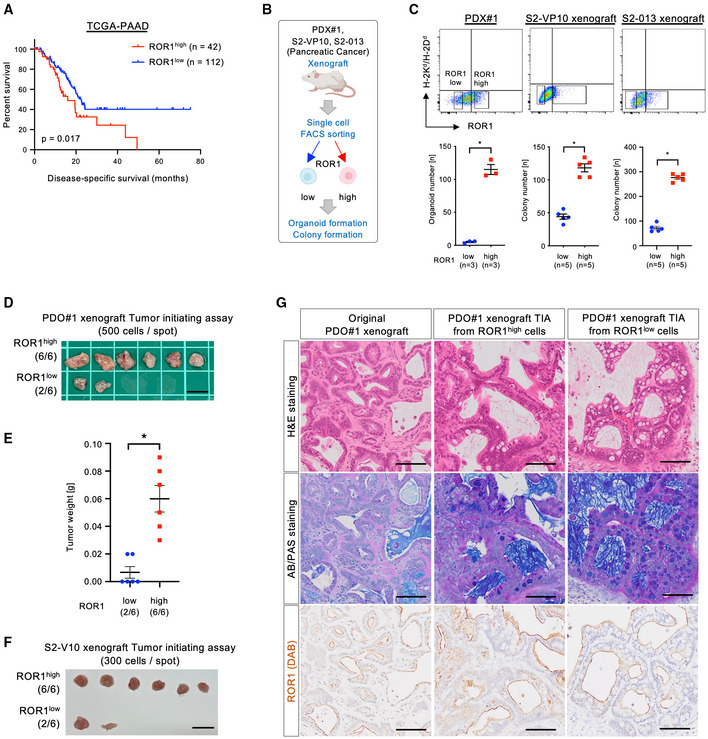
In PDAC patients, high expression of ROR1 was significantly associated with poor clinical outcomes (disease‐specific survival) in the TCGA‐PAAD dataset from The Cancer Genome Atlas (TCGA; Fig 3A and Dataset EV2), suggesting a potential role of ROR1 in PDAC progression. To investigate the tumorigenic capacity of ROR1high cells, we sorted single cells from xenografts based on their ROR1 expression and examined them in two assays (Fig 3B and Appendix Fig S2). (i) In Matrigel‐based cultures in vitro, ROR1high cells efficiently formed organoids or colonies compared with ROR1low cells (Figs 3C and EV5A). In addition, stable ROR1‐knockdown using a doxycycline (Dox)‐inducible shRNA system suppressed S2‐VP10 organoid formation (Fig EV5B–D). (ii) An in vivo tumor‐initiating assay showed that ROR1high cells from the PDO#1 xenograft generated tumors with a higher incidence (6/6) than ROR1low cells (2/6) when 500 cells were subcutaneously transplanted into Rag2 −/− /Jak3 −/− (BRJ) immunodeficient mice (Fig 3D and E). Similarly, ROR1high cells from the S2‐VP10 xenograft exhibited higher tumorigenicity than ROR1low cells (Fig 3F). In addition, the xenograft derived from ROR1high cells in the PDO#1 xenograft histologically recapitulated the original xenografts in terms of hierarchal morphology and cellular differentiation, such as mucus‐secreting cells (Fig 3G). Thus, these data demonstrated that intratumor ROR1high cells have a greater ability to initiate tumors than ROR1low cells and produce differentiated progeny. Although present at a low frequency, ROR1low cells also formed tumors with a hierarchical histology similar to the original tumor containing ROR1high cells (Fig 3D, F, and G). These results suggest that ROR1low cells may revert to ROR1high status, contributing to tumor formation.
Figure 3. ROR1high cells in PDAC have a high tumor‐initiating capacity.
-
AKaplan–Meier disease‐specific survival curves based on ROR1 expression levels in PDAC patients from the TCGA database (n = 154).
-
BExperimental strategy for the functional analyses of ROR1high and ROR1low cells by organoid/colony formation and tumor initiating assays.
-
CFACS gating to sort ROR1high and ROR1low cells and the number of organoids or colonies (n = 3 or n = 5, biological replicates). Mouse cells expressing H‐2Kd/H‐2Dd were eliminated.
-
D, ETumor initiating assay using ROR1high and ROR1low cells from the PDO#1 xenograft (n = 6). Images of tumors (D) and tumor weights (E) are shown.
-
FTumor initiating assay using ROR1high and ROR1low cells from the S2‐VP10 xenograft (n = 6).
-
GRepresentative images of tissue stained with H&E and AB/PAS, and for ROR1 in the PDO#1 xenograft and of tumor derived from ROR1high or ROR1low cells in the PDO#1 xenograft.
Data information: Scale bars, 1 cm (D), (F), 100 μm (G). Graphs are presented as mean ± s.e.m., *P < 0.05; log‐rank test (A), two‐sided t‐test (C), (E).
Source data are available online for this figure.
Figure EV5. Tumorigenicity of ROR1high cells.
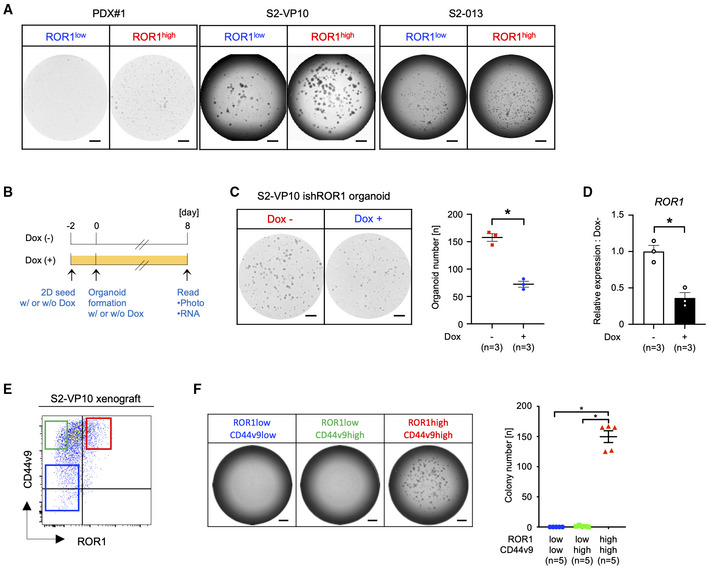
-
ARepresentative images of organoid or colony formation assays. The ROR1high cells from PDX#1 and xenografts (S2‐VP10, S2‐013) efficiently formed organoids or colonies compared with ROR1low cells.
-
BSchematic diagram for the evaluation of the organoid formation activity of ROR1‐knockdown cells.
-
C, DOrganoid formation assay of S2‐VP10 ishROR1 cells with or without Dox (n = 3, biological replicates). Representative images, the number of organoids (C), and the expression of ROR1 (D) are shown.
-
EFACS sorting of ROR1‐ and CD44v9‐stained cells from the S2‐VP10 xenograft. Red gating: ROR1high/CD44v9high, green: ROR1low/CD44v9high, blue: ROR1low/CD44v9low.
-
FColony formation assay of ROR1high/CD44v9high, ROR1low/CD44v9high, and ROR1low/CD44v9low cells (n = 5, biological replicates). Representative images of colony formation assays and the number of colonies are shown. The ROR1high/CD44v9high cells from S2‐VP10 xenografts efficiently formed colonies.
Data information: Scale bars, 1 mm (A, C, and F). Data are presented as mean ± s.e.m., two‐sided t‐test. *P < 0.05.
Source data are available online for this figure.
Since CD44 is reported as a marker of tumor‐initiating cells in PDAC (Li et al, 2007), we then investigated the relationship between ROR1 and CD44. We observed that both ROR1high and ROR1low cells express CD44 in scRNA‐seq data of S2‐VP10 xenograft (Fig EV3D); however, FACS analysis revealed that some of the CD44v9high cells coexpressed ROR1 (Fig EV5E). Only this ROR1high/CD44v9high population exhibited colony‐forming capability (Fig EV5F). These data indicate that high ROR1 expression clearly marks tumor‐initiating cells.
ROR1 and its downstream target, AURKB, are essential for tumor growth
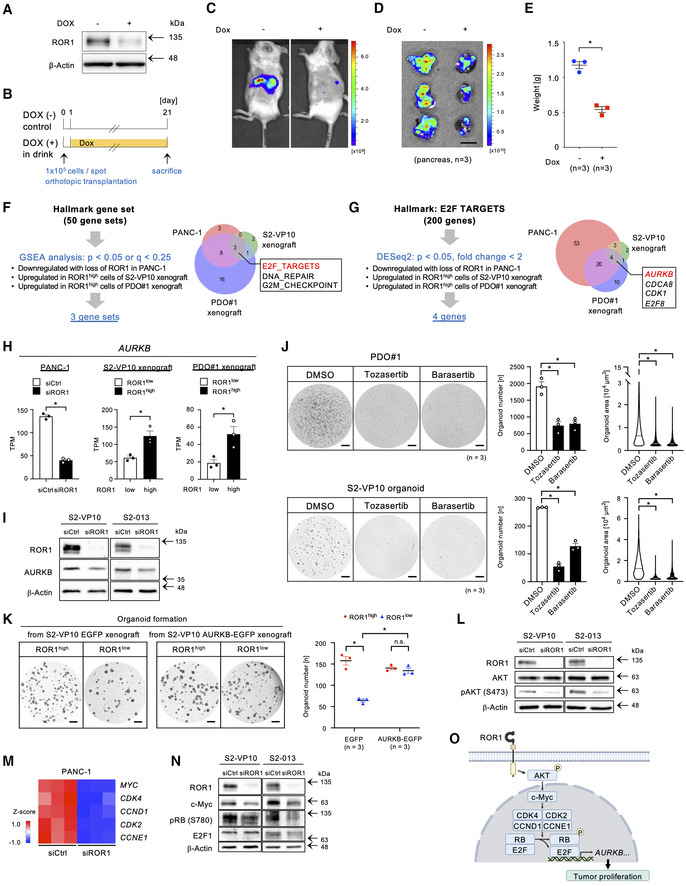
To investigate whether ROR1 is functionally involved in tumor growth, we generated xenografts using mCherry‐labeled S2‐VP10 cells expressing a Dox‐inducible shRNA against ROR1 (S2‐VP10‐mCherry‐ishROR1; Fig 4A). ROR1‐knockdown was maintained in vivo by adding doxycycline to the drinking water (Fig 4B). ROR1‐knockdown (KD) dramatically suppressed tumor growth in mice (Fig 4C–E), suggesting that ROR1 is not only a marker for tumor‐initiating cells but also a functional player in PDAC development.
Figure 4. ROR1 controls AURKB via E2F activation to promote tumor proliferation.
-
AWestern blot analysis of ROR1 expression in S2‐VP10‐mCherry‐ishROR1 cells. β‐Actin was used as a loading control.
-
BTransplantation of mCherry‐labeled S2‐VP10 cells expressing doxycycline (Dox)‐inducible shRNA against ROR1 (S2‐VP10‐mCherry‐ishROR1).
-
C, DIn vivo (C) and ex vivo (D) fluorescence imaging of S2‐VP10‐mCherry‐ishROR1 tumors using IVIS (n = 3).
-
EWeight of tumors derived from S2‐VP10‐mCherry‐ishROR1 cells (n = 3).
-
FVenn diagram showing ROR1‐mediated biological states or processes. Hallmark gene sets are referenced in MSigDB.
-
GVenn diagram to identify potential targets of ROR1 in E2F target genes.
-
HThe expression level of AURKB in PANC‐1 cells transfected with control or ROR1 siRNA and in ROR1high or ROR1low cells from S2‐VP10 and PDO#1 xenografts (n = 3).
-
IWestern blot analysis of ROR1, AURKB, and β‐actin in S2‐VP10 and S2‐013 cells transfected with control or ROR1 siRNA.
-
JTreatment of PDO#1 and S2‐VP10 organoids with DMSO (vehicle) or Aurora kinase inhibitors (n = 3, biological replicates). Tozasertib, pan‐Aurora kinase inhibitor; Barasertib, selective Aurora B kinase inhibitor. Representative images of organoids are shown. An area of 2,000 μm2 and more was identified as an organoid. The area of organoids is shown in the violin plot. Black or white solid lines indicate the median value for each violin.
-
KOrganoid formation assay of ROR1high or ROR1low cells derived from S2‐VP10 EGFP (control) or S2‐VP10 AURKB‐EGFP xenografts (n = 3, biological replicates). Representative images and the number of organoids are shown.
-
LWestern blot analysis of ROR1, AKT, phospho‐AKT (Ser473), and β‐actin in S2‐VP10 and S2‐013 cells transfected with control or ROR1 siRNA.
-
MHeatmap showing expression of MYC and of MYC target genes that regulate RB activity in PANC‐1 cells transfected with control or ROR1 siRNA.
-
NWestern blot analysis of ROR1, c‐Myc, phospho‐RB (Ser780), E2F1, and β‐actin in S2‐VP10 and S2‐013 cells transfected with control or ROR1 siRNA.
-
OSchematic diagram of how ROR1 enhances tumor proliferation. Created with BioRENDER.com.
Data information: Scale bars, 1 cm (D), 1 mm (J), (K). Data are presented as mean ± s.e.m., two‐sided t‐test. *P < 0.05; n.s., not significant.
Source data are available online for this figure.
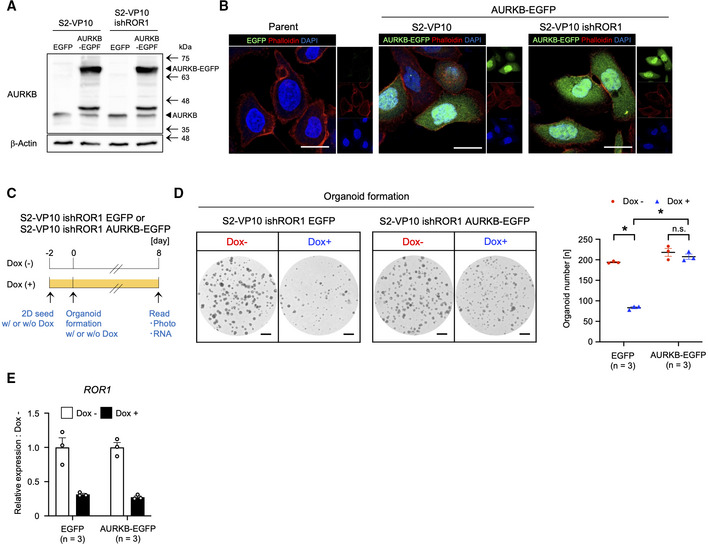
To explore downstream effectors of ROR1 activity, we next performed an integrative analysis of three transcriptomic datasets: (i) PANC‐1 cells (ROR1‐expressing pancreatic adenocarcinoma cell line) transfected with control versus ROR1 siRNA, (ii) ROR1high cells versus ROR1low cells in S2‐VP10 xenografts, and (iii) ROR1high cells versus ROR1low cells in PDO#1 xenografts (Fig 4F). This analysis revealed that the E2F transcriptional network is commonly activated in ROR1‐enriched samples, such as control‐KD and ROR1high cells, but is suppressed in ROR1‐KD and ROR1low cells (Fig 4F and Tables [Link], [Link]). We identified four E2F target genes (AURKB, CDCA8, CDK1, and E2F8) commonly upregulated in the three ROR1‐enriched datasets (Fig 4G and H). Aurora kinase B (AURKB) plays an important role in mitotic chromosome condensation (Lens et al, 2010) and has attracted considerable interest as a potential therapeutic target because of its overexpression in several cancer tissues, such as non‐small cell lung carcinoma, glioblastoma, and ovarian cancer (Vischioni et al, 2006; Zeng et al, 2007; Chen et al, 2009). We also confirmed the reduction in AURKB protein in ROR1‐downregulated S2‐VP10 and S2‐013 cells (Fig 4I). We next examined whether the kinase activity of AURKB is required for PDAC growth using PDO#1 and S2‐VP10 organoids. Both tozasertib (a pan‐Aurora kinase inhibitor) and barasertib (an Aurora kinase B selective inhibitor) markedly suppressed the formation and growth of organoids (Fig 4J). To clarify the importance of AURKB as a downstream effector of ROR1, we examined it in two assays. Stable AURKB expression increased the organoid formation ability of (i) ROR1low cells derived from S2‐VP10 AURKB‐EGFP xenografts (Figs 4K, and EV6A and B) and (ii) Dox‐inducible ROR1‐KD cells (Fig EV6A–E). These results indicate that AURKB is a critical downstream target of ROR1 in promoting PDAC cell proliferation.
Figure EV6. Stable expression of AURKB rescues the ROR1 knockdown in organoid formation activity.
-
AWestern blot analysis of AURKB. β‐Actin was used as a loading control.
-
BCellular distribution of AURKB‐EGFP protein (green) evaluated by using fluorescence confocal microscopy.
-
CSchematic diagram for the evaluation of the organoid formation activity of ROR1‐knockdown cells expressing EGFP or AURKB‐EGFP.
-
D, EOrganoid formation assay of S2‐VP10 ishROR1 cells expressing EGFP or AURKB‐EGFP (n = 3, biological replicates). Representative images, the number of organoids (D), and the expression of ROR1 (E) are shown.
Data information: Scale bars, 20 μm (B), 1 mm (D). Data are presented as mean ± s.e.m., two‐sided t‐test. *P < 0.05.
Source data are available online for this figure.
We then sought to link ROR1 activity to E2F‐mediated AURKB expression. Previous reports have shown that ROR1 induces AKT phosphorylation in breast and non‐small cell lung cancers (Yamaguchi et al, 2012; Zhang et al, 2012a). Indeed, we observed a reduction in phospho‐AKT levels in ROR1‐depleted PDAC cells (Fig 4L). Consistent with the reduced AKT signaling, c‐Myc protein levels and the expression of c‐Myc target genes, such as CDK4, CCND1, CDK2, and CCNE1, were downregulated by ROR1‐KD (Fig 4M and N). In addition, RB phosphorylation levels were also reduced by ROR1‐KD (Fig 4N), suggesting that RB‐mediated inhibition of E2F had been promoted. Taken together, these results indicate that the ROR1 enhances AKT/c‐Myc signaling, which in turn promotes the E2F‐mediated expression of AURKB (Fig 4O).
ROR1 depletion prevents relapse after chemotherapy
Tumor‐initiating cells survive cytotoxic exposure through reversible mechanisms, leading to relapse (Boumahdi & de Sauvage, 2020). We investigated the responses of ROR1high cells to drug treatment in our in vivo experimental model. In both the PDO#1 xenograft and S2‐VP10 xenograft, gemcitabine treatment led to an increase in ROR1high cells (Fig 5A and B), suggesting the functional involvement of ROR1high cells in relapse after chemotherapy. To test this possibility, we evaluated the effect of ROR1‐KD on tumor relapse using S2‐VP10‐mCherry‐ishROR1 cells. After the administration of gemcitabine, tumor growth temporarily paused but resumed approximately 2 weeks after therapy (Fig 5C, green). In contrast, the combination of ROR1‐KD (with Dox) and gemcitabine treatment significantly prevented relapse (Fig 5C, magenta). These results suggest that ROR1 supports relapse after chemotherapy.
Figure 5. The combination of gemcitabine and ROR1‐knockdown prevents the tumor relapse.
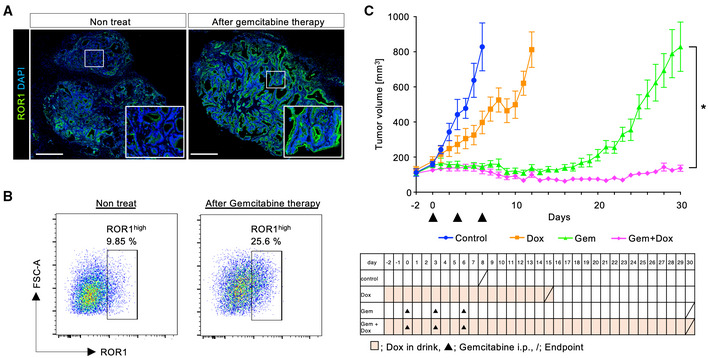
- Representative immunofluorescence images of ROR1 in the PDO#1 xenograft with or without gemcitabine treatment (120 mg/kg). The boxed area is shown at high magnification in the lower right panel.
- FACS plots of ROR1 expression in cells from the S2‐VP10 xenograft with or without the administration of gemcitabine.
- Tumor growth curve of the four groups (control, Dox only, gemcitabine only, and Dox + gemcitabine; n = 8). The endpoint for each group is shown by a slash.
Data information: Scale bars, 500 μm (A). Data are presented as mean ± s.e.m., two‐sided t‐test. *P < 0.05.
Source data are available online for this figure.
Inhibition of ROR1 suppresses metastasis
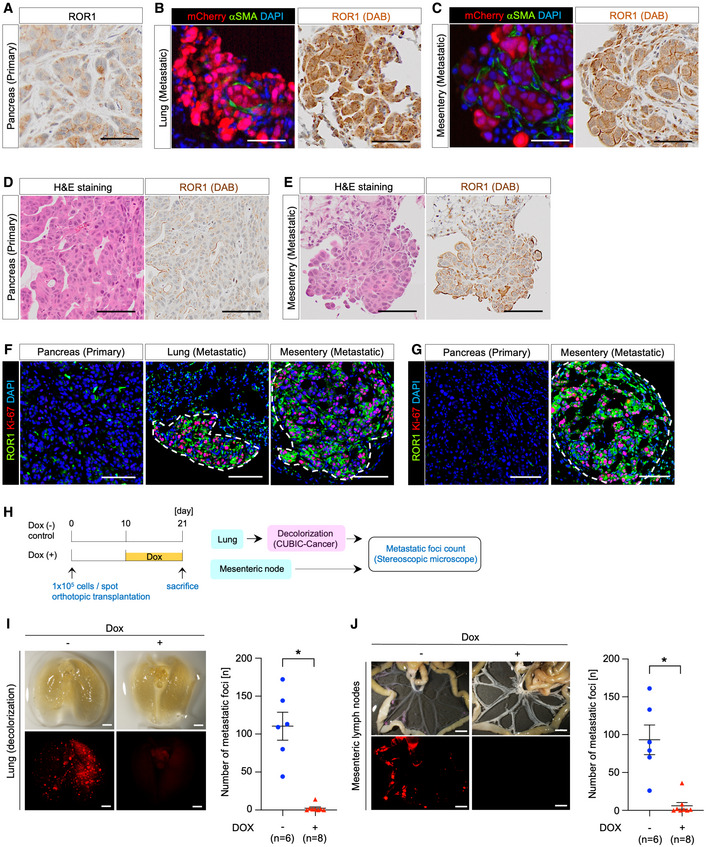
Tumor‐initiating cells are crucial for the initiation and maintenance of metastasis (De Sousa et al, 2017). To investigate whether ROR1 contributes to metastasis, we prepared an orthotopically grafted mouse model in which S2‐VP10‐mCherry cells or S2‐013 cells were transplanted into the pancreas. These cells formed primary tumors and metastases in the lung and mesenteric lymph nodes. Immunohistochemical staining revealed higher expression of ROR1 in metastatic lesions than in primary tumors (Fig 6A–E). In addition, ROR1high metastatic foci had a higher frequency of Ki‐67‐positive cells than primary lesions (Fig 6F and G). To test whether ROR1 is required for the formation of metastatic lesions, we next examined the effect of ROR1‐KD on metastatic potential using S2‐VP10‐mCherry‐ishROR1 cells (Fig 6H). In the control group, multiple metastases were observed in the lung and mesenteric lymph nodes, whereas the number of metastatic foci was greatly reduced in the group treated with Dox from 10 days after transplantation (Fig 6I and J). These data indicate that ROR1 is critical for inducing metastasis formation by regulating tumor cell proliferation.
Figure 6. ROR1 promotes metastasis.
-
A–CRepresentative images of ROR1, mCherry, and aSMA staining in the primary tumor (pancreas) (A) and metastatic lesions in the lung (B) and mesenteric lymph node (C) after orthotopic transplantation of S2‐VP10‐mCherry cells into the pancreas of BRJ mice.
-
D, ERepresentative images of S2‐013 orthotopic xenografts stained with H&E and for ROR1 in the pancreas (D) and mesenteric lymph node (E).
-
F, GRepresentative images of S2‐VP10 (F) or S2‐013 (G) orthotopic xenografts co‐staining for ROR1 and Ki‐67 in the primary tumor and metastatic lesions. Dotted lines indicate the metastatic lesions.
-
HThe schematic diagram for evaluating the metastatic activity of ROR1‐knockdown cells.
-
I, JRepresentative images and quantification of metastatic foci in the lung (I) and mesenteric lymph nodes (J) after orthotopic transplantation of S2‐VP10‐mCherry‐ishROR1 cells into the pancreas of BRJ mice (n = 6 or n = 8).
Data information: Scale bars, 100 μm (A)–(G), 2 mm (I), 5 mm (J). Data are presented as mean ± s.e.m., two‐sided t‐test. *P < 0.05.
Source data are available online for this figure.
Identification of an enhancer region regulating ROR1 gene expression
As described above, we found that intratumor ROR1high cells in PDAC displayed various features of tumor‐initiating cells. Importantly, ROR1 functionally enhances PDAC progression, such as tumor growth, relapse, and metastasis. Therefore, we considered whether the expression of ROR1 could be drug controlled and attempted to elucidate the epigenomic mechanisms governing ROR1 gene expression.
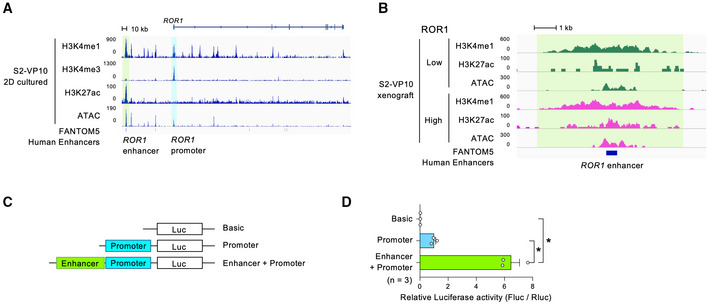
We first analyzed histone modifications in cultured S2‐VP10 cells with high ROR1 expression using a CUT&RUN assay (Skene & Henikoff, 2017) and chromatin organization using an assay for transposase‐accessible chromatin by sequencing (ATAC‐seq). Tri‐methyl histone H3 lysine 4 (H3K4me3) was enriched at the ROR1 promoter, consistent with its actively transcribed state (Fig 7A). We also identified a putative enhancer region that opened chromatin and co‐marked mono‐methyl H3K4 (H3K4me1) and acetylated H3K27 (H3K27ac) at 110 kb upstream of the ROR1 transcription start site (Fig 7A). This H3K4me1+/H3K27ac+/open chromatin region matched the active enhancer defined by the Functional Annotation of the Mammalian Genome 5 (FANTOM5) database (Fig 7A). Notably, the enrichment of H3K27ac at this region was higher in ROR1high cells from the S2‐VP10 xenograft than in ROR1low cells (Fig 7B). Furthermore, ATAC‐seq indicated higher chromatin accessibility of this region in ROR1high cells than in ROR1low cells (Fig 7B). To verify whether this H3K27ac+ region enhances transcription from the ROR1 promoter, we cloned both regions and placed them upstream of the luciferase reporter gene (Fig 7C). The luciferase reporter assay results showed that this candidate region enhanced reporter activity approximately six‐fold compared with the promoter alone in S2‐VP10 cells (Fig 7D). Together, these data indicate that ROR1 transcription is strongly regulated by the newly identified enhancer, and that the difference in chromatin states at this region creates a divergence in ROR1 expression levels among tumor cell subpopulations.
Figure 7. Epigenomic analyses identify the ROR1 gene enhancer in PDAC.
-
A, BH3K4me1, K3K4me3, H3K27ac, and open chromatin profiles around the ROR1 gene by CUT&RUN and ATAC‐sequencing in cultured S2‐VP10 cells (A) or in ROR1high and ROR1low cells from S2‐VP10 xenografts (B). The ROR1 promoter (blue‐shaded boxes) and enhancer elements (green‐shaded box) of ROR1 are indicated.
-
CSchematic description of vectors used for the luciferase reporter assay to examine the regions regulating the expression of the ROR1 gene.
-
DRelative luciferase activity in S2‐VP10 cells (n = 3, biological replicates).
Data information: Data are presented as mean ± s.e.m., two‐sided t‐test. *P < 0.05.
Source data are available online for this figure.
ROR1 is a direct target of YAP/BRD4
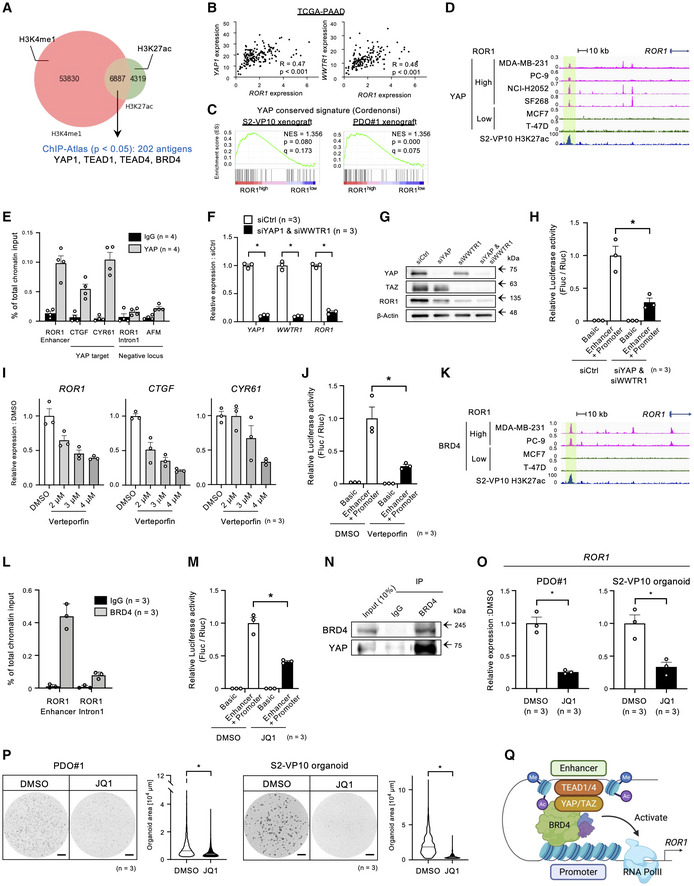
We next explored the underlying mechanism for the activation of ROR1 gene expression. To identify transcription factors (TFs) that regulate the ROR1 enhancer, we analyzed the genome‐wide distribution of H3K4me1 and H3K27ac in S2‐VP10 cells using a CUT&RUN assay. Using ChIP‐Atlas (Oki et al, 2018), we compared the distribution pattern of 6,887 overlapping peaks (H3K4me1 and H3K27ac) found in our study with those of TFs from available datasets (Fig 8A, Appendix Fig S3, Dataset EV3, and Table EV6). Of the 202 TFs and transcription‐associated antigens that showed a similar pattern with our peak data, we focused on Yes‐associated protein (YAP). YAP and its close paralog, TAZ, are transcriptional regulators involved in CSC abilities such as tumorigenicity, chemoresistance, and metastasis in breast, esophageal, and hepatocellular cancers as well as in osteosarcoma (Song et al, 2014; Bartucci et al, 2015; Basu‐Roy et al, 2015; Hayashi et al, 2015). Interestingly, both the YAP1 and WWTR1 (encoding TAZ) transcript levels were significantly and positively correlated with ROR1 transcript levels in the pancreatic adenocarcinoma dataset TCGA‐PAAD (Fig 8B and Dataset EV2). Moreover, gene set enrichment analysis revealed that intratumor ROR1high cells showed upregulation of YAP‐regulated genes compared with ROR1low cells (Fig 8C). Thus, these results suggest that ROR1high cells have higher YAP activity than ROR1low cells. Analysis of publicly available ChIP‐seq datasets revealed that YAP binds to the enhancer region of ROR1 in cancer cell lines with high ROR1 expression (MDA‐MB‐231, PC‐9, NCI‐H2052, and SF268 cells; Fig 8D and Appendix Fig S4). In contrast, in cancer cell lines with low ROR1 expression (MCF‐7 and T‐47D cells), YAP did not bind to its enhancer regions (Fig 8D and Appendix Fig S4). Using ChIP‐qPCR, we detected direct binding of YAP to the ROR1 enhancer in S2‐VP10 cells (Fig 8E). In addition, siRNA knockdown of YAP/TAZ downregulated ROR1 (Fig 8F and G). YAP/TAZ co‐knockdown also reduced luciferase activity, which was under control of ROR1 enhancer‐promoter (Fig 8H). Similarly, treatment of the cells with the YAP inhibitor verteporfin reduced the expression of ROR1 as well as the known YAP target genes such as CTGF and CYR61 (Fig 8I) and the ROR1 reporter activity (Fig 8J). Together, these results indicate that YAP directly transactivates ROR1.
Figure 8. The YAP/BRD4 axis promotes ROR1 expression in PDAC.
-
AStrategy to identify candidate antigens overlapping the H3K4me1 (salmon pink) and H3K27ac (green) peaks in S2‐VP10 using ChIP‐Atlas.
-
BPearson correlation analyses of ROR1 expression with YAP1 and WWTR1 expression in PDAC patient samples (n = 154). Pearson's correlation (R) values are indicated within each graph.
-
CGSEA plot showing significant upregulation of the YAP conserved gene set in ROR1high cells in the S2‐VP10 xenograft or PDO#1 xenograft.
-
DYAP‐binding and H3K27ac profiles around the ROR1 gene of ROR1high and ROR1low cell lines by ChIP‐sequencing and CUT&RUN analyses.
-
EYAP occupancy at the ROR1 enhancer as determined by ChIP‐qPCR. The known YAP targets, CTGF and CYR61 promoters, were tested as positive controls, and ROR1 intron 1 and AFM promoter were tested as negative controls (n = 4, biological replicates).
-
FRelative expression of ROR1 in S2‐VP10 cells transfected with YAP1 and WWTR1 siRNA (n = 3, biological replicates). mRNA levels are normalized to that of RPS18.
-
GWestern blot analysis of YAP, TAZ, ROR1, and β‐actin in S2‐VP10 cells transfected with control or YAP1/WWTR1 siRNA.
-
HRelative luciferase activity with a reporter containing the ROR1 enhancer‐promoter region (ROR1 reporter) in S2‐VP10 cells transfected with control or YAP1/WWTR1 siRNA (n = 3, biological replicates).
-
IRelative expression of ROR1 and YAP target genes (CTGF and CYR61) in S2‐VP10 cells treated with DMSO or verteporfin (VP; n = 3, biological replicates). mRNA levels are normalized to that of RPS18.
-
JRelative luciferase activity using the ROR1 reporter in S2‐VP10 cells treated with DMSO (vehicle) or YAP inhibitor (verteporfin; n = 3, biological replicates).
-
KBRD4‐binding and H3K27ac profiles around the ROR1 gene of ROR1high and ROR1low cell lines detected by ChIP‐sequencing and CUT&RUN analyses.
-
LChIP‐qPCR analysis of BRD4 occupancy at the ROR1 enhancer (n = 3, biological replicates).
-
MRelative luciferase activity using the ROR1 reporter in S2‐VP10 cells treated with DMSO or BET inhibitor (JQ1; n = 3, biological replicates).
-
NCo‐immunoprecipitation analysis to evaluate the interaction between endogenous YAP and BRD4 in S2‐VP10 cells.
-
O, PTreatment of PDO#1 and S2‐VP10 organoids with DMSO or JQ1 (n = 3, biological replicates). Relative expression of ROR1 (O), representative images of organoids, and organoid area (P) are shown. mRNA levels are normalized to that of RPS18. The area of organoids is shown in the violin plot. Black or white solid lines indicate the median value for each violin.
-
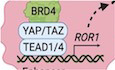
QSchematic diagram of the regulatory mechanism of ROR1 gene expression. Created with BioRENDER.com.
Data information: Scale bars, 1 mm (P). Data are presented as mean ± s.e.m., *P < 0.05.; Pearson's Correlation Coefficient (B), two‐sided t‐test (F), (H), (J), (M), (O), and (P).
Source data are available online for this figure.
ChIP‐Atlas analyses also showed that bromodomain‐containing protein 4 (BRD4), an acetylated histone‐binding protein, has a highly similar genomic distribution with H3K4me1+/H3K27ac+ shown in our experiment (Dataset EV3 and Table EV6). BRD4 is a member of the bromodomain and extraterminal motif (BET) family (Zeng & Zhou, 2002), and BET inhibitors are rapidly being developed for clinical use because of their potent anti‐tumor effects (Filippakopoulos et al, 2010; Doroshow et al, 2017). Analysis of the ChIP‐seq datasets revealed the binding of BRD4 to the ROR1 enhancer in only ROR1‐expressing cancer cell lines (MDA‐MB‐231 and PC‐9 cells; Fig 8K and Appendix Fig S4). ChIP‐qPCR also confirmed the occupancy of BRD4 on the ROR1 enhancer in S2‐VP10 cells (Fig 8L). In addition, treatment with JQ1, one of the most established BET inhibitors, reduced ROR1 reporter activity in S2‐VP10 cells (Fig 8M). Remarkably, the co‐immunoprecipitation analysis revealed that BRD4 physically interacts with YAP (Fig 8N). Treatment of PDO#1 and S2‐VP10 organoids with JQ1 resulted in the downregulation of ROR1 (Fig 8O) and the suppression of organoid growth (Fig 8P). Collectively, these data indicate that the expression of ROR1 is regulated through the YAP/BRD4 axis (Fig 8Q).
Discussion
Understanding how tumor‐initiating cells affect cancer progression and what mechanisms promote their phenomena is crucial for developing effective therapeutic strategies against malignancies. However, the tumor‐initiating cells in PDAC are not fully characterized, especially at single‐cell resolution. Here, we identified ROR1high tumor‐initiating cells in human PDAC by demonstrating their strong capability to support tumorigenicity, chemoresistance, and metastasis. Of particular note, our scRNA‐seq and bulk RNA‐seq analyses revealed that ROR1high cells highly overlap with the partial EMT population. In skin squamous cell carcinoma (SCC), partial EMT cells characterized by the expression of CD106 and CD51 gave rise to both epithelial‐ and mesenchymal‐like cells (Pastushenko et al, 2018). Another report showed that genetic ablation of the FAT1 gene (encoding protocadherin) in skin SCC cells promoted the expression of both epithelial and mesenchymal markers (but not CD106 and CD51), and potentiated the tumor‐initiating and metastatic capacities of the cells (Pastushenko et al, 2021). These previous findings indicate that the partial EMT state is associated with high cellular plasticity, and that different types of partial EMT populations exist in a tumor. In the current study, we identified ROR1 as a cell surface marker for the partial EMT population with a high tumor‐initiating potential in PDAC. In addition, ROR1high cells enriched tumor‐initiating cells from the well‐known marker CD44v9+ CSCs. Prior studies have shown that ROR1 contributes to tumor cell survival, proliferation, migration, drug resistance, and tumorigenicity in breast and ovarian cancers (Cui et al, 2013; Zhang et al, 2014, 2019). Here, we found that ROR1 regulates AURKB levels to enhance tumor proliferation through c‐Myc and E2F activation. We also demonstrated that silencing ROR1 inhibits relapse after chemotherapy and the development of metastatic foci in vivo. Our results clearly show that ROR1 functionally enhances the tumor‐initiating potential and is thus an attractive therapeutic target for PDAC.
At a low frequency, ROR1low cells also generated tumors that showed hierarchical histology mimicking the original tumor and containing ROR1high cells (Fig 3G). Interestingly, in ROR1low cells, the ROR1 enhancer employed the H3K4me1+/H3K27ac− poised chromatin state (Fig 7B), suggesting that the expression of ROR1 is flexibly regulated in PDAC. These data suggest that ROR1low cells may be reversibly converted into ROR1high tumor‐initiating cells at a low frequency, resulting in tumor seeding. Our observation is similar to that in a previous report showing that tumor cells expressing the differentiation marker keratin 20 regain their proliferative potential and convert to LGR5+ CSCs in colorectal cancer (Shimokawa et al, 2017). Because different types of tumor‐initiating cells have been identified (e.g., CD44+/CD24+/ESA+, CD133+, DCLK1+, and Musashi+ cells), other minor tumor‐initiating cells may exist within the ROR1low population.
Current therapies for PDAC are unable to ablate tumor‐initiating cells effectively. Remarkably, our in vivo study demonstrated that treatment with gemcitabine, a conventional therapeutic agent for PDAC, enriches intratumor ROR1high cells in PDAC. We also observed the suppression of tumor recurrence by using a combination of gemcitabine treatment and ROR1 depletion. The expansion of ROR1high tumor‐initiating cells after chemotherapy might be related to efficient tumor growth during relapse. Although we have not yet clearly determined why treatment with gemcitabine enriches tumor‐initiating ROR1high cells, a similar phenomenon of a chemotherapy‐induced increase in the fraction of LGR5+ CSCs has been reported in colorectal and liver cancers (Osawa et al, 2016; Cao et al, 2020). Eventually, these ROR1high cells may play a role in resistance against treatment and recurrence. It will be interesting to further explore the mechanisms underlying the gemcitabine‐induced increase in the number of ROR1high tumor‐initiating cells for anti‐tumor‐initiating cell therapy.
We demonstrated that the expression of ROR1 is controlled by the enhancer with high epigenetic flexibility, leading to ROR1 heterogeneity in PDAC. Furthermore, we elucidated the mechanism of ROR1 transactivation through the YAP/BRD4 axis. A previous study indicated that an EMT state promotes TAZ activity by inactivating Scribble, an adopter that assembles a protein complex containing MST, LATS, and TAZ, thus leading breast cancer cells to develop CSC‐like traits (Cordenonsi et al, 2011). Our data, therefore, suggest that YAP/TAZ signaling activated by the partial EMT state maintains ROR1high tumor‐initiating cells. In addition, recent studies in breast cancer have revealed that ROR1 activates the Hippo‐YAP pathway by phosphorylating and translocating HER3 into the nucleus (Li et al, 2017). Taken together, these findings suggest that ROR1 and YAP/TAZ may form a positive‐feedback loop to maintain the ROR1high tumor‐initiating cell pool. However, the mechanism by which the transactivation of ROR1 is restricted to particular cell populations, including tumor‐initiating cells, is unclear since YAP hyperactivation is widespread in cancer tissues (Harvey et al, 2013; Johnson & Halder, 2014). Further studies are needed to clarify this mechanism.
ROR1 is an attractive target for cancer therapy because of its high expression in specific populations within tumors and its functional importance. Therefore, several therapeutic approaches against ROR1 are being explored, including ROR1‐targeted CAR‐T therapy (Srivastava et al, 2019, 2021) and antibody therapy to block signals using the monoclonal anti‐ROR1 antibody cirmtuzumab (Choi et al, 2018). Importantly, we demonstrated that Aurora kinase inhibitors and a BET inhibitor effectively suppress the ROR1‐mediated growth of PDAC organoids. BET inhibitor therapy for PDAC, including JQ1, has previously been discussed with a focus on c‐Myc inhibition, stromal remodeling, and accumulation of DNA damage (Mertz et al, 2011; Yamamoto et al, 2016; Miller et al, 2019). We consider that ROR1‐mediated suppression of c‐Myc function exhibits a useful additive effect of JQ1 or other BRD4 inhibitors during ROR1high PDAC therapy. Our findings will greatly help in developing new therapeutic strategies for ROR1‐driven PDAC. In addition, we previously reported an assay that detects cancer‐derived ROR1‐positive exosomes, which could be a basic technology for companion diagnostics (Daikuzono et al, 2021). ROR1 therapy with patient stratification will be beneficial in PDAC. It would be fascinating to investigate in detail whether BET inhibitors and Aurora kinase inhibitors can eliminate ROR1high tumor‐initiating cells and suppress PDAC progression, including tumor growth, relapse, and metastasis, with minimal harmful effects on normal tissues in vivo studies.
The major limitation of this study is the use of xenograft models in immune‐deficient mice. These models mimic clinical cancer tissue with the cellar diversity and heterogeneity of tumors, which is helpful for investigating cancer biology, including the ability of tumor‐initiating cells. However, there is a close relationship between the maintenance of tumor‐initiating cells and immunosuppression in the tumor microenvironment (Bayik & Lathia, 2021). Therefore, future studies will need to use an immunocompetent mouse model to predict the therapeutic effects of targeting ROR1high tumor‐initiating cells accurately. Although we have demonstrated that ROR1‐high expressing cells in tumors play a role in the progression of PDAC in PDX and xenograft models, whether this can also occur in cancer patients requires further investigation.
Materials and Methods
Mice
All animal experiments in this study were performed based on protocols approved by the Institutional Animal Care and Use Committee of Kumamoto University, Japan (A2021‐093). Male and female Balb/c;Rag2 −/−/Jak3 −/− (BRJ) mice were a gift from Dr. Seiji Okada (Kumamoto University; Okada et al, 2011), and we used both male and female mice for this study. Female NOD.Cg‐Prkdc scid Il‐2rg tm1Sug /ShiJic (NOG) mice (7–10 weeks old) were obtained from the Central Institute for Experimental Animals (CIEA) and female C.B‐17/IcrHsd‐Prkdc scid (SCID) mice (7–10 weeks old) were obtained from Japan SLC. All mice were housed under specific pathogen‐free conditions.
Cell lines
Human pancreatic cancer cell lines (S2‐VP10, S2‐013, and PANC‐1) were provided by the Cell Resource Center for Biomedical Research, Institute of Development, Aging and Cancer, Tohoku University. S2‐VP10 and S2‐013 cells were cultured in DMEM (low glucose) supplemented with 10% FBS at 37°C in 5% CO2. PANC‐1 cells were cultured in RPMI‐1640 supplemented with 10% FBS at 37°C in 5% CO2. L Wnt‐3A cells were purchased from the American Type Culture Collection. HEK293T cells were a kind gift from Dr. Toshiro Moroishi (Kumamoto University). L Wnt3A cells and HEK293T cells were cultured in DMEM (high glucose) supplemented with 10% FBS at 37°C in 5% CO2. All cell lines were authenticated by short tandem repeat DNA profiling and were free of mycoplasma contamination. YAP inhibitor (verteporfin; Cayman, 17334) was added from the next seeding, and total RNA was extracted after 48‐h incubation.
Patient‐derived xenografts (PDXs)
PDX models were established by the University of Tsukuba (Shimomura et al, 2018). Detailed clinical information is available in Table EV2.
Establishment of human pancreatic cancer organoids from PDXs
Organoids were established from PDXs, based on a previous report (Seino et al, 2018). PDXs were washed, minced into small pieces, and digested with collagenase/dispase (Roche, 10269638001; 1 mg/ml) and DNase I (Roche, 11284932001; 1 mg/ml) in a gentleMACS Dissociator (Miltenyi Biotech) for a maximum of 60 min. After centrifugation at 300 × g for 3 min at room temperature (RT), the cells were treated with 1 × diluted RBC lysis buffer (BioLegend, 420301) for 30 s and washed three times with ice‐cold PBS containing 5% fetal bovine serum (FBS). The cell pellet was resuspended in growth‐factor‐reduced Matrigel (Corning, 356231) and cultured in 24‐well plates (50 μl Matrigel/well) with organoid culture medium: Advanced DMEM/F‐12 medium (Thermo Fisher Scientific, 12634‐010) with 10 mM HEPES, 2 mM GlutaMAX‐I, 1 × B27, 1 × Anti‐Anti (Thermo Fisher Scientific, 15630080, 35050061, 17504044, 15240062), 10 nM Gastrin I, 1 mM N‐acetylcysteine (Sigma, G9145‐1MG, A9165‐5G), 100 ng/ml human recombinant R‐spondin‐1, 100 ng/ml mouse recombinant noggin (Wako Chemicals, 181‐02801, 146‐08991), 50% Wnt‐3A conditioned medium from L Wnt3A cells, and 500 nM A83‐01 (Tocris, 2939). For the first 3 days of culture, organoids were incubated in an organoid culture medium containing 10 μl Y‐27632 (Wako Chemicals, 036‐24023). The plate was incubated in 5% CO2 and 20% O2. The medium was changed every 2 or 3 days. Organoids were passaged every 10–12 days.
Organoid culture from cell line
300 cells of S2‐VP10 cells were cultured in 50 μl Matrigel per well with S2‐VP10 organoid culture medium: Advanced DMEM/F‐12 medium with 10 mM HEPES, 2 mM GlutaMAX‐I, 1 × B27, 1 × Anti‐Anti, 10 nM Gastrin I, 1 mM N‐acetylcysteine, and 100 ng/ml human recombinant R‐spondin‐1. S2‐V10 organoids were cultured in 5% CO2 and 20% O2. 10 μl Y‐27632 was added in medium for the first 3 days of culture.
Organoid formation assay
10,000 ROR1high or ROR1low sorted cells from PDX#1, 10,000 cells of dissociated PDO#1, and 300 cells of S2‐VP10 were cultured per well under the respective medium conditions. Pan‐Aurora inhibitor (Tozasertib; Selleck, S1048; 300 nM), Aurora B inhibitor (Barasertib; Selleck, A1147; 300 nM), and BET inhibitor (JQ1; MedChemExpress, HY13030: 100 nM) were added from the day of seeding. Images of each well were captured using a BZ‐X700 microscope (Keyence) on day 30 (PDX#1), day8 or day 10 (S2‐VP10 organoid and PDO#1). The organoid area was quantified using HybridCellCount software module of BZ‐X Analyzer (Keyence). An area of 2,000 μm2 and more was identified as an organoid.
Xenotransplantation of cell lines and organoids
The cell lines and organoids were dissociated into single cells with TrypLE Express (Thermo Fisher Scientific, 12604013). For subcutaneous transplantation, 5 × 10⁵ cells suspended in 100 μl complete medium (DMEM supplemented with 10% FBS) containing 50% Matrigel were injected into the flank of female BRJ mice or female SCID mice. For orthotopic transplantation, 1 × 10⁵ cells suspended in 50 μl complete medium containing 50% Matrigel were injected into the pancreas of anesthetized female BRJ mice.
Single‐cell isolation for scRNA‐seq and flow cytometry analysis
Human PDAC xenografts were chopped and digested using collagenase/dispase (1 mg/ml) and DNase I (1 mg/ml) in a gentleMACS Dissociator for a maximum of 60 min. The single cell suspension was treated with 1 × diluted RBC lysis buffer and washed three times with ice‐cold PBS containing 5% FBS. Cell suspensions were filtered using a 70‐μm filter to remove debris. After centrifugation, the cells were resuspended in sorting buffer with 7‐AAD (BioLegend, 420404; 1:100) to gate the viable cells. The sorting gate is shown in Appendix Fig S1. Fluorescence‐activated cell sorting (FACS) was conducted using a FACS Aria III and FACS SORP Aria (BD Biosciences). The data were analyzed using FlowJo (version 10.6.2, BD Biosciences).
Library preparation for scRNA‐seq
The scRNA‐seq libraries were generated from sorted viable single cells using Chromium Single Cell 3′ Reagent Kits v3 (10x Genomics, PN‐1000092, PN‐1000074, PN‐120262) according to the manufacturer's instructions. The libraries were sequenced on a Hiseq X Ten sequencer (Illumina).
scRNA‐seq data analysis
In S2‐VP10 xenograft, the sequencing data were mapped against the human genome (GRCh38) and quantified using the CellRanger software package (version 6.0). Raw gene counts were imported into R (version 4.0.2) and processed using the R package Seurat (version 4.0.4). Cells with < 1 and > 30% mitochondrial genes mapped, > 5,000 count RNA (UMIs), and > 4,000 feature RNA (expressed genes) were eliminated from the downstream analysis. After filtering, UMI counts were normalized and subjected to principal component analysis (PCA). Clustering analysis was performed using the FindNeighbors and Findclusters functions of Seurat with the parameters Findneighbors (dim = 15) and Findclusters (resolution = 0.7). Dimensional reduction was performed by UMAP. RNA velocity analysis was carried out using Velocyto.R (version 0.6) with default parameters.
scRNA‐seq data of human PDAC were obtained from Peng et al (2019). FASTQ files were downloaded from the Genome Sequence Archive (CRA001160) and the data of T20 (CRR241804) was used for analysis. The sequencing data were mapped to the human genome (GRCh38) and quantified using the CellRanger software package (version 7.0). Cells with > 25% mitochondrial genes mapped, > 5,000 count RNA (UMIs) were eliminated from the downstream analysis using Seurat. Moreover, cells expressing KRT18 or KRT8 were selected (1,739 cells) and re‐normalize with SCTransform. Other parameters are as follows: Findneighbors (dim = 20) and Findclusters (resolution = 0.5).
Flow cytometry
After dispersal of the xenografts into single cells, the cell pellet was suspended in sorting buffer (D‐PBS with 2% FBS, 1 mM EDTA, and 25 mM HEPES). The cells were first incubated with anti‐ROR1 antibody (BD Biosciences, 564464) and/or anti‐CD44v9 antibody (Cosmo Bio, LKG‐M003) at 2 μg/ml and incubated on ice for 30 min. After washing, the cells were stained with goat anti‐mouse IgG2b labeled Alexa Fluor 647 (Thermo Fisher Scientific, A21242; 1:1,000) or goat anti‐rat IgG (H + L) labeled PE (Thermo Fisher Scientific, A10545; 1:200) and PE/Cy7‐labeled anti‐H‐2Kd/H‐2Dd (BioLegened, 114718; 1:50) on ice for 30 min in the dark. After washing twice, the cells were resuspended in sorting buffer with 7‐AAD (BioLegend) to gate the viable cells. The sorting gate is shown in Appendix Fig S2. Flow cytometric analysis was performed using FACSVerse (BD Biosciences), and FACS was conducted using a FACS Aria III and FACS SORP Aria (BD Biosciences).
RNA‐seq analysis
For the S2‐VP10 xenograft, RNA was extracted from sorted ROR1low and ROR1high cells using a MagMAX‐96 Total RNA Isolation Kit (Thermo Fisher Scientific, AM1830), and 1 ng of RNA was used for the reverse transcription reaction using SMART‐seq HT (Takara, 634455). For the PDO xenograft, ROR1low and ROR1high cells were collected directly into CDS Sorting Solution by FACS sorting, then cDNA was synthesized without RNA purification using SMART‐seq HT (Takara). For the PANC‐1 cells, RNA was extracted using total RNA was extracted using a ReliaPrep RNA Miniprep System (Promega, Z6012), and 1 ng of RNA was used for the reverse transcription reaction using SMART‐seq HT. The RNA‐seq library was prepared using a Nextera XT Library Prep Kit (Illumina, FC‐131‐1024, FC‐131‐1001) and sequenced using a Hiseq X Ten sequencer (Illumina). RNA‐seq reads were aligned to a human transcriptome (GRCh38) and quantified by Salmon (Patro et al, 2017; version 1.3.0) with default settings. Differential expression testing was performed with DESeq2 (Love et al, 2014; version 1.28.1). A P‐value threshold of < 0.05 was used to determine differentially expressed genes. Gene set enrichment analysis was performed using GSEA (version 4.0.3; Broad Institute) with H hallmark gene sets and CORDENONSI_YAP_CONSERVED_SIGNATURE (M2871) in the Molecular Signatures Database. The heat maps were drawn using the ggplot2 R package.
Real‐time quantitative PCR
For cultured S2‐VP10 cells, total RNA was extracted using a ReliaPrep RNA Miniprep System (Promega, Z6012), and cDNA was synthesized using a High Capacity cDNA Reverse Transcription Kit with RNase Inhibitor (Thermo Fisher Scientific, 4374967). Real‐time qPCR reactions were performed on a ViiA 7 Real‐Time PCR System (Thermo Fisher Scientific) using PowerUP SYBR Green Master Mix (Thermo Fisher Scientific, A25742). Samples were run in three biological replicates, and mRNA levels were normalized to RPS18. The primers used are listed in Table EV8.
Histology and immunostaining
Xenografts were isolated and immediately fixed in 4% paraformaldehyde (Nakalai Tesque, 09154‐56) at 4°C for 16 h. Paraffin‐embedded samples were cut into 4‐μm sections and used for histological analysis. Hematoxylin and eosin (H&E) staining and alcian blue and periodic acid‐Schiff (AB/PAS) staining were performed using standard protocols. For immunohistochemistry (IHC), antigen retrieval was carried out in an autoclave (2100 Retriever, Aptum Biologics) using 0.01 M citrate buffer (pH 7.0). After treating with 3% H2O2 to block endogenous peroxidase activity, sections were incubated in Tris‐buffered saline/0.1% Tween‐20 (TBS‐T) containing 5% goat serum (Jackson Immuno Research Laboratories, 005‐000‐001) to block non‐specific binding. The following primary antibodies were used: rabbit anti‐ROR1 (Thermo Fisher Scientific, PA5‐50830; 1:50), mouse anti‐pan cytokeratin (Nichirei, 412811; 1:2), rabbit anti‐RFP (MBL, PM005; 1:400), mouse anti‐Ki67 (DAKO, M7240; 1:200), and mouse anti‐alpha smooth muscle actin (Thermo Fisher Scientific; 14‐9760‐82; 1:400). The secondary antibodies were horseradish peroxidase‐conjugated goat anti‐rabbit IgG antibodies (Nichirei, 424141) for HRP‐IHC and visualized using a Liquid DAB+ Substrate Chromogen System (DAKO, K3468), or Alexa Fluor Plus 488‐ or 555‐conjugated goat anti‐mouse, rabbit IgG antibodies (Thermo Fisher Scientific, A32723, A32731, A32727, A32732; 1:1,000) for immunofluorescence. Nuclei were counterstained with hematoxylin or DAPI (Dojindo, 340‐07971). All slides were imaged using a BZ‐X700 fluorescence microscope or VS120 fluorescence virtual slide microscope (Olympus).
Colony formation assay
For 2,000 sorted cells, 20 μl of 50% Matrigel containing complete medium was added and mixed gently on ice. A 96‐well plate was chilled on ice and coated with 25 μl of cell‐free 50% Matrigel. After polymerization of the coated Matrigel at 37°C for 10 min, the cell mixture was overlaid at a density of 2,000 cells per well. Half the volume of the medium was changed every 2–3 days. Images of each well were captured using a BZ‐X700 microscope on day 8.
Tumor‐initiating assay
Sorted ROR1low and ROR1high cells from xenografts were mixed with 50% Matrigel containing complete medium. The cell suspension was subcutaneously injected into the flank of female BRJ mice or female NOG mice. The resulting tumors were harvested after 56 days (PDO#1 xenograft) or 27 days (S2‐VP10 xenograft) post‐injection.
Lentivirus preparation and establishment of stable cell lines
To generate lentivirus‐based doxycycline inducible shRNA constructs against ROR1, the shRNA sequences (5′‐CTCATTTAGCAGACATCGCAA‐3′ (shRNA‐1) and 5′‐CTTTACTAGGAGACGCCAATA‐3′ (shRNA‐2) (Zhang et al, 2012b)) were inserted into EZ‐Tet‐pLKO‐Puro vector (Addgene, 85966), respectively. The preparation of lentivirus has been described previously (Daikuzono et al, 2021). Cells were infected with the two lentiviral shRNAs against ROR1 and selected after 48 h with 0.5 μg/ml puromycin (Nakalai Tesque, 29455‐12). To induce the expression of shRNA in vitro, 1 μg/ml doxycycline (Tokyo Chemical Industry, D4116) was added to the cells. For in vivo studies, mice were given drinking water supplemented with 2 mg/ml doxycycline (Tokyo Chemical Industry) and 5% sucrose (Wako Chemicals, 196‐00015). For AURKB overexpression, AURKB cDNA derived from S2‐VP10 cells was subcloned into pJEM1 lentiviral vector (Addgene, 19319). As a control, we used the pLJM1‐EGFP vector. Cells were labeled with mCherry using the pLV‐mCherry vector (Addgene, 36084).
In vivo fluorescence imaging of tumor growth
In vivo fluorescence imaging was performed using an IVIS SPECTRUM (Caliper Life Sciences). The mCherry‐labeled tumor‐bearing mice were anesthetized with isoflurane and imaged. The filter settings were Ex = 570 nm, Em = 620 nm. Data were quantified with Living Imaging software (version 4.3.1).
Western blotting
Cells were lysed with RIPA buffer (Wako Chemicals, 182‐02451) containing cOmplete protease inhibitor cocktail (Roche, 05056489001) and PhosSTOP phosphatase inhibitor cocktail (Roche, 05056489001). Whole‐cell lysate was loaded and separated on a 7.5% polyacrylamide gel and transferred onto a PVDF membrane (Merck Millipore, IPVH07850). Membranes were blocked with PVDF Blocking Reagent for Can Get Signal (Toyobo, NYPBR01) and then incubated with primary antibody in Can Get Signal Solution 1 (Toyobo, NKB‐101). The following primary antibodies were used: mouse anti‐β‐actin (Sigma, A1978; 1:10,000), rabbit anti‐ROR1 (Cell Signaling Technology, 16450; 1:250), rabbit anti‐AKT (Cell Signaling Technology, 4691; 1:1,000), rabbit anti‐phospho‐AKT (Ser473; Cell Signaling Technology, 9271; 1:1,000), rabbit anti‐Aurora B (Abcam, ab2254; 1:1,000), rabbit anti‐YAP (Cell Signaling Technology, 14074; 1:1,000), rabbit anti‐TAZ (Cell Signaling Technology, 72804; 1:1,000), rabbit anti‐BRD4 (Cell Signaling Technology, 13440; 1:1,000), rabbit anti‐c‐Myc (Cell Signaling Technology, 5605; 1:1,000), rabbit anti‐phospho‐Rb (Ser795; Novus, 82176; 1:1,000), and mouse anti‐E2F1 (Santa Cruz Biotechnology, 251; 1:500). Signals were detected by HRP‐conjugated anti‐rabbit or mouse antibody (Cell Signaling Technology, 7074, 7076; 1:1,000) in Can Get Signal Solution 2 (Toyobo) and visualized with ECL Prime Western Blotting Detection Reagent (GE Healthcare, RPN2232). Chemiluminescent signals were detected using a LAS‐3000 Imaging System (GE Healthcare).
RNA interference
Reverse transfection of siRNA was performed using lipofectamine RNAiMAX (Thermo Fisher Scientific, 13778150) with a final siRNA concentration of 10 nM. Cells were harvested after 48‐h incubation. The siRNAs were purchased from Qiagen and Dharmacon (Qiagen, negative control siRNA: 1027280, siROR1: SI00071295; Dharmacon, negative control siRNA: D‐001810‐01, siYAP1#3: J‐012200‐07‐0002, siWWTR1#2: J‐016083‐06‐0002).
Xenograft experiments with recurrent and metastasis models
For the recurrence experiments, mice implanted with S2‐VP10 cells (14 days post‐implantation) or PDO#1 (18 days post‐implantation) were given gemcitabine (Pfizer, 4987114700506; 120 mg/kg) intraperitoneally three times daily for 3 days. For flowcytometric analysis and IHC analysis, xenografts were harvested 1 day after the last administration. Tumor volume (Tv) measurements were made every day (Tv [mm3] = (length [mm] × width [mm]2)/2). In the experiment of treatment with Dox, mice were separated experimental groups of randomize.
For the metastasis experiments, mice implanted with S2‐VP10 cells or S2‐013 cells orthotopically into the pancreas were sacrificed at 21 days post‐implantation. The metastatic foci in the isolated lung and mesentery were counted using a SZX12 stereo microscope (Olympus). To observe tissue deeply, lung samples were decolorized using CUBIC‐Cancer method (Kubota et al, 2017). In the experiment of treatment with Dox, mice were separated experimental groups of randomize.
CUT&RUN
CUT&RUN was performed using a CUT&RUN Assay Kit (Cell Signaling Technology, 86652) with a modification of the manufacturer's protocol. Between 28,000 and 50,000 collected cells were washed and bound to activated concanavalin A‐coated magnetic beads. After permeabilization, the bead‐cell complex was incubated with antibody at RT for 2 h on a nutator, with gentle tapping every 20 min. After washing, the beads were resuspended in pAG‐MNase and incubated at 4°C for 1 h, with gentle tapping every 20 min. After washing, the beads in digitonin buffer were chilled in ice water bath (0°C), then pre‐cooled calcium chloride was added to activate MNase for 30 min. Enriched DNA fragments were purified by phenol–chloroform–isoamyl alcohol/ethanol extraction. The following antibodies were used: rabbit anti‐mono‐methylated histone H3K4 (Abcam, ab8895; 1 μg), rabbit anti‐tri‐methylated histone H3K4 (Millipore, 07‐473; 1 μg), rabbit anti‐acetylated histone H3K27 (Cell Signaling Technology, 8173; 1:100), and rabbit isotype control IgG (BioLegend, 910805; 1 μg). The CUT&RUN library was prepared using a NEBNext Ultra II DNA Library Prep Kit for Illumina (New England Biolabs, E7645, E7710) as previously reported (Zhu et al, 2019). High‐throughput sequencing was performed using a NextSeq 500 Sequencer with 75‐bp single‐end reads. Qualified reads were aligned to the human genome (GRCh37) using Bowtie2 (Langmead & Salzberg, 2012; version 2.3.4.1). Duplicate reads were removed. The number of unique reads was normalized to spike‐in yeast DNA (sacCer3). The final number of mapped reads and scaling factors are listed in Table EV7. Peak detection was performed using MACS2 (Zhang et al, 2008; version 2.2.7.1) with default parameters. The overlapping peaks between H3K4me1 and H3K27ac were obtained using the bedtools intersect function (version 2.30.0). CUT&RUN data were converted to bigwig files by bamCoverage (in the deepTools package (Ramírez et al, 2016), version 3.5.1) using the parameters ‐‐scaleFactor<each sample>‐‐binSize 10, then visualized using Integrative Genome Viewer (IGV). Enrichment analysis of the overlapping peaks (H3K4me1 and H3K27ac) with other TFs was performed using ChIP‐Atlas with the following parameters: [Experiment type] ChIP TFs and others; [Cell type Class] Pancreas, Breast, Lung; [Threshold for Significance] 100. The aggregation plot was drawn using computeMatrix and plotHeatmap of deepTools.
ATAC‐sequencing
ATAC‐sequencing was performed with modifications based on a previous report (Corces et al, 2017). The collected cells (2D cultured: 50,000 cells, sorted from xenografts: 15,000 cells) were suspended in 50 μl of cold cell lysis buffer (10 mM Tris–HCl pH 7.5, 10 mM NaCl, 3 mM MgCl2, 0.1% NP‐40, 0.1% Tween‐20, 0.01% digitonin in water) by pipetting three times and incubated on ice for 3 min. After lysis, 1 ml wash buffer (10 mM Tris–HCl pH 7.5, 10 mM NaCl, 3 mM MgCl2, 0.1% Tween‐20) was added, and the reaction mixture was centrifuged at 500 × g for 10 min at 4°C to collect nuclei. The supernatant was removed, and the nuclei were resuspended in 50 μl transposition mixture (25 μl 2× Tagmentation buffer (Diagenode, C01019043), 2.5 μl Tagmentase loaded (Diagnode, C01070012), 0.5 μl digitonin (final concentration 0.01%), 0.5 μl Tween‐20 (final concentration 0.1%), 16.5 μl PBS, and 5 μl nuclease‐free water). The transposition reaction mixture was incubated for 30 min at 37°C in a block incubator. The transposition DNA fragments were purified using a MinElute PCR Purification Kit (Qiagen, 28006) and eluted in 20 μl buffer EB. Transposed DNA fragments were amplified by combining the following: 20 μl transposed DNA, 2.5 μl of 25 μM PCR Primer 1 (i5), 2.5 μl of 25 μΜ PCR Primer 2 (barcoded, i7), and 25 μl KAPA HiFi HS Ready Mix (Kapa Biosystems, KK2601). The following thermal cycler conditions were used: 72°C for 5 min, 98°C 30 s, followed by 11 cycles (50,000 cells) or 12 cycles (15,000 cells) of 98°C 10 s, 63°C 30 s, and 72°C 1 min. The amplified library was purified using a 1.8× volume of AMPure XP beads (Beckman Coulter, A63880) and eluted in 20 μl buffer EB. To remove large‐size fragments (> 1,000 bp), a 0.55× volume (11 μl) of SPRIselect (Beckman Coulter, B23317) was added to the purified library. Following 2‐min incubation at room temperature, the reaction tube was placed in a magnetic rack for 5 min. After the liquid appeared completely clear, 31 μl of the supernatant was transferred to a new tube and 25 μl SPRIselect (final volume of 1.8× based on the initial reaction volume) was added to the sample. After 2‐min incubation at room temperature, the library was washed twice with 80% ethanol and eluted in 20 μl buffer EB. Library size distributions were checked using an Agilent 2200 TapeStation (Agilent Technologies). High‐throughput sequencing and data analysis were performed by the same method as CUT&RUN. ATAC‐seq data were converted to bigwig files using bamCoverage with default parameters. The primers used are listed in Table EV8.
FANTOM5 enhancer data
Human enhancers were searched using FANTOM5 Human Enhancers Selector (https://slidebase.binf.ku.dk/human_enhancers/selector) using the parameters Genes ROR1, Upstream 1,000,000 bp, and Downstream 150,000 bp.
Luciferase reporter assay
S2‐VP10 genomic DNA was extracted using a DNeasy Blood & Tissue Kit (Qiagen, 69504). The promoter and enhancer candidate regions of ROR1 were amplified by PCR using KOD ‐Plus‐ Neo (Toyobo, KOD‐401) and subcloned into the pGL3 luciferase reporter vector (Promega, E1751; Fig 7C). The primers used are listed in Table EV8. All inserts were confirmed by sequencing. For transient transfection, S2‐VP10 cells were co‐transfected with 0.5 μg of each luciferase reporter plasmid and 1 ng of pRL‐SV40 (Promega, E2231) or pRL‐TK (Promega, E2241) the day after plating (3.45 × 10⁴ cells/well in a 24‐well plate) using FuGENE HD (Promega, E2312). After 48‐h incubation, the cells were harvested and luciferase was measured using a Dual‐Luciferase Reporter Assay System (Promega, E1980). The promoter and enhancer activity were calculated by the ratio of firefly/renilla luciferase activity.
ROR1 and YAP/TAZ gene expression analysis (TCGA database)
Gene expression data were downloaded from TCGA (TCGA‐PAAD, accessed the GDC data portal [https://portal.gdc.cancer.gov/], retrieved on March 22, 2021) (Dataset EV2). ROR1 and YAP1/WWTR1 expression were extracted and evaluated by Pearson correlation analysis. Correlation coefficients and P‐values are reported.
ChIP‐seq data analysis
Bigwig files were retrieved from the GEO database (GSE66081, GSE131687, GSE61852, GSE125609, GSE116879, GSE89128, GSE123286, and GSE63584). ROR1 gene expression data were downloaded from the CCLE database. All data were visualized using IGV.
ChIP‐qPCR
About 5 × 10⁶ S2‐VP10 cells were used to detect YAP and BRD4 enrichment. Cells were crosslinked with 1% formaldehyde for 10 min at RT, then equilibrated with 0.135 M glycine. Cells were lysed in lysis buffer (5 mM PIPES [pH 8.0], 85 mM KCl, 5% NP‐40). Isolated nuclei were suspended in low‐salt SDS buffer (0.1% SDS, 10 mM EDTA, 50 mM Tris–HCl [pH 8.0]) and sonicated to fragment the chromatin using a Bioruptor UCD‐300 (high, 30 s on/30 s off, 20 min, Cosmo Bio). After preclearing at 4°C for 1 h, chromatin fragments were incubated at 4°C overnight with antibodies for YAP (Cell Signaling Technology; 1:100) or BRD4 (Cell Signaling Technology; 1:100). Antibody/antigen complexes were recovered with Dynabeads M‐280 sheep anti‐rabbit IgG (Thermo Fisher Scientific, 11203D). Beads with DNA fragments were washed once with RIPA buffer (50 mM Tris–HCl, 150 mM NaCl, 1 mM EDTA, 1% Triton X‐100, 0.1% SDS, 0.1% sodium deoxycholate), twice with high salt RIPA buffer (50 mM Tris–HCl, 500 mM NaCl, 1 mM EDTA, 1% Triton X‐100, 0.1% SDS, 0.1% sodium deoxycholate), once with LiCl wash buffer (10 mM Tris–HCl, 250 mM LiCl, 1 mM EDTA, 0.5% NP‐40, 0.5% sodium deoxycholate), and twice with TE buffer. The washed beads with DNA fragments were resuspended in ChIP elution buffer (0.5% SDS, 10 mM Tris–HCl, 5 mM EDTA, 300 mM NaCl) and incubated at 65°C for 6 h to reduce the crosslinks. Enriched DNA fragments were purified by phenol–chloroform–isoamyl alcohol/ethanol extraction and subjected to qPCR analysis. The primers used are listed in Table EV8.
Co‐immunoprecipitation of endogenous nuclear proteins
About 1 × 10⁷ S2‐VP10 cells were used for the analysis. Proteins were crosslinked using 1 mM dithiobis (succinimidyl propionate; DSP; Dojindo, D629) to increase the stability of the protein–protein complexes. The cells were rinsed with ice‐cold PBS and harvested using a cell scraper. The nuclei were isolated in nuclear extraction buffer (20 mM HEPES‐KOH (pH 8.0), 10 mM KCl, 0.1% NP‐40, 20% glycerol, freshly added protease inhibitors) at 4°C for 15 min. After centrifugation and discarding the supernatant, the nuclear pellet was lysed in hypertonic buffer (20 mM HEPES, 400 mM NaCl, 1 mM EDTA, 0.5% NP‐40, freshly added protease inhibitors) and sonicated using a Bioruptor UCD‐300 (high, 30 s on/30 s off, 10 min). The nuclear lysates were centrifuged at 18,000 × g for 10 min at 4°C, and the supernatant was collected and diluted in 150 mM NaCl. After preclearing for 1 h at 4°C, the lysates were incubated at 4°C for 5 h with antibodies for BRD4 (Cell Signaling Technology; 1:100). Antibody/antigen complexes were recovered using Dynabeads Protein A/G (Thermo Fisher Scientific, DB10001, DB10003) for 1 h at 4°C. The immunocomplex was washed four times with wash buffer (20 mM HEPES, 150 mM NaCl, 1 mM EDTA, 0.1% NP‐40, freshly added protease inhibitors). Proteins were eluted in SDS sample buffer with 2‐mercaptoethanol at 95°C for 5 min and subjected to western blot analysis.
Survival analysis (TCGA database)
The gene expression data and clinical data were downloaded from TCGA (TCGA‐PAAD, accessed the GDC data portal [https://portal.gdc.cancer.gov/], retrieved on March 22, 2021; Dataset EV2). The association between the expression of ROR1 and patient disease‐specific survival was examined by the Kaplan–Meier method.
Statistics
Pairwise comparisons were performed using an unpaired two‐tailed Student's t‐test. Results are presented as the mean ± s.e.m. (standard error of the mean). A P‐value less than 0.05 was considered statistically significant. Statistical analysis was performed using Prism 8 (GraphPad Software Inc.).
Human samples
Clinical samples were obtained from patients at University of Tsukuba Hospital with written informed consent after approval by the ethical committees. All human experiments were approved by University of Tsukuba (BBC2021‐006) and Kumamoto University (Genome #409).
Author contributions
Masaya Yamazaki: Conceptualization; data curation; formal analysis; supervision; funding acquisition; validation; investigation; visualization; methodology; writing – original draft; project administration. Shinjiro Hino: Methodology; writing – review and editing. Shingo Usuki: Formal analysis. Yoshihiro Miyazaki: Resources. Tatsuya Oda: Resources. Mitsuyoshi Nakao: Writing – review and editing. Takaaki Ito: Supervision; funding acquisition; writing – review and editing. Kazuya Yamagata: Supervision; funding acquisition; writing – review and editing.
Disclosure and competing interests statement
The authors declare that they have no conflict of interest.
Supporting information
Appendix
Expanded View Figures PDF
Table EV1
Table EV2
Table EV3
Table EV4
Table EV5
Table EV6
Table EV7
Table EV8
Dataset EV1
Dataset EV2
Dataset EV3
Source Data for Expanded View
PDF+
Source Data for Figure 3
Source Data for Figure 4
Source Data for Figure 5
Source Data for Figure 6
Source Data for Figure 7
Source Data for Figure 8
Acknowledgements
We thank M. Yamamoto and M. Muramatsu (Kumamoto University) for insightful discussions, T. Takahashi (Aichi Cancer Center) for useful advices, Daikuzono, Y Ikeda, Y. Fukuchi (Kumamoto University), and S. Fujimura (Liaison Laboratory Research Promotion Center) for technical assistance, and K. Kurokawa (Devers Eye Institute) and S. Watanabe (Kumamoto University) for helpful comments on the manuscript. We thank T. Moroishi (Kumamoto University) for critical reading of this manuscript and providing the HEK293T cells. We also thank S. Okada (Kumamoto University) for providing the Rag2/Jak3 double‐deficient mice. We also thank The NIBB Genome Informatics Training Course (GITC; The National Institute for Basic Biology) for teaching the basics of NGS analysis. We also thank T. Takeuchi and H. Nishiyama (Tsukuba Human Tissue Bank Center, University of Tsukuba Hospital) for support in providing the resources. EZ‐Tet‐pLKO‐Puro was a gift from Cindy Miranti (Frank et al, 2017). pMD2.G and psPAX2 were a gift from Didier Trono. pLJM1‐EGFP was a gift from Prof. David Sabatini. pLV‐mCherry was a gift from Pantelis Tsoulfas. This work was supported by grant‐in‐aid for Scientific Research (19H03711, 20H03691, 22K20921), by JST SPRING (JPMJSP2127), and by grant from Center for Metabolic Regulation of Health Aging (CMHA).
The EMBO Journal (2023) 42: e112614
See also: I Peñuelas‐Haro & E Espinet (July 2023)
Data availability
The accession number for the scRNA‐seq, RNA‐seq, CUT&RUN, and ATAC‐seq data in this study is GEO: GSE191204 (https://www.ncbi.nlm.nih.gov/geo/query/acc.cgi?acc=GSE191204).
RNA‐seq data: Gene Expression Omnibus GSE191198 (https://www.ncbi.nlm.nih.gov/geo/query/acc.cgi?acc=GSE191198)
scRNA‐seq data: Gene Expression Omnibus GSE191193 (https://www.ncbi.nlm.nih.gov/geo/query/acc.cgi?acc=GSE191193)
CUT&RUN data: Gene Expression Omnibus GSE191202 (https://www.ncbi.nlm.nih.gov/geo/query/acc.cgi?acc=GSE191202)
ATAC‐seq data: Gene Expression Omnibus GSE191203 (https://www.ncbi.nlm.nih.gov/geo/query/acc.cgi?acc=GSE191203)
References
- Al‐Hajj M, Wicha MS, Benito‐Hernandez A, Morrison SJ, Clarke MF (2003) Prospective identification of tumorigenic breast cancer cells. Proc Natl Acad Sci USA 100: 3983–3988 [DOI] [PMC free article] [PubMed] [Google Scholar]
- Awad MM, Liu S, Rybkin II, Arbour KC, Dilly J, Zhu VW, Johnson ML, Heist RS, Patil T, Riely GJ et al (2021) Acquired resistance to KRAS G12C inhibition in cancer. N Engl J Med 384: 2382–2393 [DOI] [PMC free article] [PubMed] [Google Scholar]
- Bailey JM, Alsina J, Rasheed ZA, McAllister FM, Fu YY, Plentz R, Zhang H, Pasricha PJ, Bardeesy N, Matsui W et al (2014) DCLK1 marks a morphologically distinct subpopulation of cells with stem cell properties in preinvasive pancreatic cancer. Gastroenterology 146: 245–256 [DOI] [PMC free article] [PubMed] [Google Scholar]
- Barker N, Ridgway RA, Van Es JH, Van De Wetering M, Begthel H, Van Den Born M, Danenberg E, Clarke AR, Sansom OJ, Clevers H (2009) Crypt stem cells as the cells‐of‐origin of intestinal cancer. Nature 457: 608–611 [DOI] [PubMed] [Google Scholar]
- Bartucci M, Dattilo R, Moriconi C, Pagliuca A, Mottolese M, Federici G, Di Benedetto A, Todaro M, Stassi G, Sperati F et al (2015) TAZ is required for metastatic activity and chemoresistance of breast cancer stem cells. Oncogene 34: 681–690 [DOI] [PubMed] [Google Scholar]
- Basu‐Roy U, Bayin NS, Rattanakorn K, Han E, Placantonakis DG, Mansukhani A, Basilico C (2015) Sox2 antagonizes the hippo pathway to maintain stemness in cancer cells. Nat Commun 6: 1–14 [DOI] [PMC free article] [PubMed] [Google Scholar]
- Batlle E, Clevers H (2017) Cancer stem cells revisited. Nat Med 23: 1124–1134 [DOI] [PubMed] [Google Scholar]
- Bayik D, Lathia JD (2021) Cancer stem cell–immune cell crosstalk in tumour progression. Nat Rev Cancer 21: 526–536 [DOI] [PMC free article] [PubMed] [Google Scholar]
- Bonnet D, Dick JE (1997) Human acute myeloid leukemia is organized as a hierarchy that originates from a primitive hematopoietic cell. Nat Med 3: 730–737 [DOI] [PubMed] [Google Scholar]
- Boumahdi S, de Sauvage FJ (2020) The great escape: tumour cell plasticity in resistance to targeted therapy. Nat Rev Drug Discov 19: 39–56 [DOI] [PubMed] [Google Scholar]
- Canon J, Rex K, Saiki AY, Mohr C, Cooke K, Bagal D, Gaida K, Holt T, Knutson CG, Koppada N et al (2019) The clinical KRAS(G12C) inhibitor AMG 510 drives anti‐tumour immunity. Nature 575: 217–223 [DOI] [PubMed] [Google Scholar]
- Cao W, Li M, Liu J, Zhang S, Noordam L, Verstegen MMA, Wang L, Ma B, Li S, Wang W et al (2020) LGR5 marks targetable tumor‐initiating cells in mouse liver cancer. Nat Commun 11: 1961 [DOI] [PMC free article] [PubMed] [Google Scholar]
- Chen YJ, Chen CM, Twu NF, Yen MS, Lai CR, Wu HH, Wang PH, Yuan CC (2009) Overexpression of Aurora B is associated with poor prognosis in epithelial ovarian cancer patients. Virchows Arch 455: 431–440 [DOI] [PubMed] [Google Scholar]
- Choi MY, Widhopf GF, Ghia EM, Kidwell RL, Hasan MK, Yu J, Rassenti LZ, Chen L, Chen Y, Pittman E et al (2018) Phase I trial: Cirmtuzumab inhibits ROR1 signaling and stemness signatures in patients with chronic lymphocytic leukemia. Cell Stem Cell 22: 951–959 [DOI] [PMC free article] [PubMed] [Google Scholar]
- Clarke MF, Dick JE, Dirks PB, Eaves CJ, Jamieson CHM, Jones DL, Visvader J, Weissman IL, Wahl GM (2006) Cancer stem cells – perspectives on current status and future directions: AACR workshop on cancer stem cells. Cancer Res 66: 9339–9344 [DOI] [PubMed] [Google Scholar]
- Corces MR, Trevino AE, Hamilton EG, Greenside PG, Sinnott‐Armstrong NA, Vesuna S, Satpathy AT, Rubin AJ, Montine KS, Wu B et al (2017) An improved ATAC‐seq protocol reduces background and enables interrogation of frozen tissues. Nat Methods 14: 959–962 [DOI] [PMC free article] [PubMed] [Google Scholar]
- Cordenonsi M, Zanconato F, Azzolin L, Forcato M, Rosato A, Frasson C, Inui M, Montagner M, Parenti AR, Poletti A et al (2011) The hippo transducer TAZ confers cancer stem cell‐related traits on breast cancer cells. Cell 147: 759–772 [DOI] [PubMed] [Google Scholar]
- Cui B, Zhang S, Chen L, Yu J, Widhopf GF, Fecteau JF, Rassenti LZ, Kipps TJ (2013) Targeting ROR1 inhibits epithelial‐mesenchymal transition and metastasis. Cancer Res 73: 3649–3660 [DOI] [PMC free article] [PubMed] [Google Scholar]
- Daikuzono H, Yamazaki M, Sato Y, Takahashi T, Yamagata K (2021) Development of a DELFIA method to detect oncofetal antigen ROR1‐positive exosomes. Biochem Biophys Res Commun 578: 170–176 [DOI] [PubMed] [Google Scholar]
- Dalerba P, Dylla SJ, Park IK, Liu R, Wang X, Cho RW, Hoey T, Gurney A, Huang EH, Simeone DM et al (2007) Phenotypic characterization of human colorectal cancer stem cells. Proc Natl Acad Sci USA 104: 10158–10163 [DOI] [PMC free article] [PubMed] [Google Scholar]
- De Sousa E, Melo F, Kurtova AV, Harnoss JM, Kljavin N, Hoeck JD, Hung J, Anderson JE, Storm EE, Modrusan Z et al (2017) A distinct role for Lgr5 + stem cells in primary and metastatic colon cancer. Nature 543: 676–680 [DOI] [PubMed] [Google Scholar]
- Dominguez CX, Müller S, Keerthivasan S, Koeppen H, Hung J, Gierke S, Breart B, Foreman O, Bainbridge TW, Castiglioni A et al (2020) Single‐cell RNA sequencing reveals stromal evolution into LRRC15 + myofibroblasts as a determinant of patient response to Cancer immunotherapy. Cancer Discov 10: 232–253 [DOI] [PubMed] [Google Scholar]
- Dongre A, Weinberg RA (2019) New insights into the mechanisms of epithelial–mesenchymal transition and implications for cancer. Nat Rev Mol Cell Biol 20: 69–84 [DOI] [PubMed] [Google Scholar]
- Doroshow DB, Eder JP, LoRusso PM (2017) BET inhibitors: a novel epigenetic approach. Ann Oncol 28: 1776–1787 [DOI] [PubMed] [Google Scholar]
- Ellen TP, Ke Q, Zhang P, Costa M (2008) NDRG1, a growth and cancer related gene: regulation of gene expression andfunction in normal and disease states. Carcinogenesis 29: 2–8 [DOI] [PubMed] [Google Scholar]
- Filippakopoulos P, Qi J, Picaud S, Shen Y, Smith WB, Fedorov O, Morse EM, Keates T, Hickman TT, Felletar I et al (2010) Selective inhibition of BET bromodomains. Nature 468: 1067–1073 [DOI] [PMC free article] [PubMed] [Google Scholar]
- Fox RG, Lytle NK, Jaquish DV, Park FD, Ito T, Bajaj J, Koechlein CS, Zimdahl B, Yano M, Kopp JL et al (2016) Image‐based detection and targeting of therapy resistance in pancreatic adenocarcinoma. Nature 534: 407–411 [DOI] [PMC free article] [PubMed] [Google Scholar]
- Frank SB, Schulz VV, Miranti CK (2017) A streamlined method for the design and cloning of shRNAs into an optimized dox‐inducible lentiviral vector. BMC Biotechnol 17: 1–10 [DOI] [PMC free article] [PubMed] [Google Scholar]
- Harvey KF, Zhang X, Thomas DM (2013) The hippo pathway and human cancer. Nat Rev Cancer 13: 246–257 [DOI] [PubMed] [Google Scholar]
- Hayashi H, Higashi T, Yokoyama N, Kaida T, Sakamoto K, Fukushima Y, Ishimoto T, Kuroki H, Nitta H, Hashimoto D et al (2015) An imbalance in TAZ and YAP expression in hepatocellular carcinoma confers cancer stem cell‐like behaviors contributing to disease progression. Cancer Res 75: 4985–4997 [DOI] [PubMed] [Google Scholar]
- Hermann PC, Huber SL, Herrler T, Aicher A, Ellwart JW, Guba M, Bruns CJ, Heeschen C (2007) Distinct populations of cancer stem cells determine tumor growth and metastatic activity in human pancreatic cancer. Cell Stem Cell 1: 313–323 [DOI] [PubMed] [Google Scholar]
- Johnson R, Halder G (2014) The two faces of hippo: targeting the hippo pathway for regenerative medicine and cancer treatment. Nat Rev Drug Discov 13: 63–79 [DOI] [PMC free article] [PubMed] [Google Scholar]
- Kleeff J, Korc M, Apte M, La Vecchia C, Johnson CD, Biankin AV, Neale RE, Tempero M, Tuveson DA, Hruban RH et al (2016) Pancreatic cancer. Nat Rev Dis Primers 2: 1–23 [DOI] [PubMed] [Google Scholar]
- Kubota SI, Takahashi K, Nishida J, Tainaka K, Miyazono K, Ueda Correspondence HR (2017) Whole‐body profiling of Cancer metastasis with single‐cell resolution. Cell Rep 20: 236–250 [DOI] [PubMed] [Google Scholar]
- La Manno G, Soldatov R, Zeisel A, Braun E, Hochgerner H, Petukhov V, Lidschreiber K, Kastriti ME, Lönnerberg P, Furlan A et al (2018) RNA velocity of single cells. Nature 560: 494–498 [DOI] [PMC free article] [PubMed] [Google Scholar]
- Langmead B, Salzberg SL (2012) Fast gapped‐read alignment with bowtie 2. Nat Methods 9: 357–359 [DOI] [PMC free article] [PubMed] [Google Scholar]
- Lemmon MA, Schlessinger J (2010) Cell signaling by receptor tyrosine kinases. Cell 141: 1117–1134 [DOI] [PMC free article] [PubMed] [Google Scholar]
- Lens SMA, Voest EE, Medema RH (2010) Shared and separate functions of polo‐like kinases and aurora kinases in cancer. Nat Rev Cancer 10: 825–841 [DOI] [PubMed] [Google Scholar]
- Li C, Heidt DG, Dalerba P, Burant CF, Zhang L, Adsay V, Wicha M, Clarke MF, Simeone DM (2007) Identification of pancreatic cancer stem cells. Cancer Res 67: 1030–1037 [DOI] [PubMed] [Google Scholar]
- Li C, Wang S, Xing Z, Lin A, Liang K, Song J, Hu Q, Yao J, Chen Z, Park PK et al (2017) A ROR1‐HER3‐lncRNA signalling axis modulates the hippo‐YAP pathway to regulate bone metastasis. Nat Cell Biol 19: 106–119 [DOI] [PMC free article] [PubMed] [Google Scholar]
- Love MI, Huber W, Anders S (2014) Moderated estimation of fold change and dispersion for RNA‐seq data with DESeq2. Genome Biol 15: 1–21 [DOI] [PMC free article] [PubMed] [Google Scholar]
- Lytle NK, Ferguson LP, Rajbhandari N, Gilroy K, Fox RG, Deshpande A, Schürch CM, Hamilton M, Robertson N, Lin W et al (2019) A multiscale map of the stem cell state in pancreatic adenocarcinoma. Cell 177: 572–586 [DOI] [PMC free article] [PubMed] [Google Scholar]
- Magee JA, Piskounova E, Morrison SJ (2012) Cancer stem cells: impact, heterogeneity, and uncertainty. Cancer Cell 21: 283–296 [DOI] [PMC free article] [PubMed] [Google Scholar]
- Mao Z, Xiao H, Shen P, Yang Y, Xue J, Yang Y, Shang Y, Zhang L, Li X, Zhang Y et al (2022) KRAS(G12D) can be targeted by potent inhibitors via formation of salt bridge. Cell Discov 8: 1–14 [DOI] [PMC free article] [PubMed] [Google Scholar]
- Marusyk A, Janiszewska M, Polyak K (2020) Intratumor heterogeneity: the Rosetta stone of therapy resistance. Cancer Cell 37: 471–484 [DOI] [PMC free article] [PubMed] [Google Scholar]
- Mertz JA, Conery AR, Bryant BM, Sandy P, Balasubramanian S, Mele DA, Bergeron L, Sims RJ (2011) Targeting MYC dependence in cancer by inhibiting BET bromodomains. Proc Natl Acad Sci USA 108: 16669–16674 [DOI] [PMC free article] [PubMed] [Google Scholar]
- Miller AL, Fehling SC, Garcia PL, Gamblin TL, Council LN, van Waardenburg RCAM, Yang ES, Bradner JE, Yoon KJ (2019) The BET inhibitor JQ1 attenuates double‐strand break repair and sensitizes models of pancreatic ductal adenocarcinoma to PARP inhibitors. EBioMedicine 44: 419–430 [DOI] [PMC free article] [PubMed] [Google Scholar]
- Mizrahi JD, Surana R, Valle JW, Shroff RT (2020) Pancreatic cancer. Lancet 395: 2008–2020 [DOI] [PubMed] [Google Scholar]
- O'Brien CA, Pollett A, Gallinger S, Dick JE (2007) A human colon cancer cell capable of initiating tumour growth in immunodeficient mice. Nature 445: 106–110 [DOI] [PubMed] [Google Scholar]
- Okada S, Ono A, Hattori S, Kariya R, Iwanaga S, Taura M, Harada H, Suzu S (2011) Comparative study of human hematopoietic cell engraftment into Balb/c and C57BL/6 strain of rag‐2/Jak3 double‐deficient mice. J Biomed Biotechnol 2011: 539748 [DOI] [PMC free article] [PubMed] [Google Scholar]
- Oki S, Ohta T, Shioi G, Hatanaka H, Ogasawara O, Okuda Y, Kawaji H, Nakaki R, Sese J, Meno C (2018) Ch IP‐atlas: a data‐mining suite powered by full integration of public Ch IP‐seq data. EMBO Rep 19: e46255 [DOI] [PMC free article] [PubMed] [Google Scholar]
- Osawa H, Takahashi H, Nishimura J, Ohta K, Haraguchi N, Hata T, Yamamoto H, Mizushima T, Takemasa I, Doki Y et al (2016) Full‐length LGR5‐positive cells have chemoresistant characteristics in colorectal cancer. Br J Cancer 114: 1251–1260 [DOI] [PMC free article] [PubMed] [Google Scholar]
- Pastushenko I, Brisebarre A, Sifrim A, Fioramonti M, Revenco T, Boumahdi S, Van Keymeulen A, Brown D, Moers V, Lemaire S et al (2018) Identification of the tumour transition states occurring during EMT. Nature 556: 463–468 [DOI] [PubMed] [Google Scholar]
- Pastushenko I, Mauri F, Song Y, de Cock F, Meeusen B, Swedlund B, Impens F, Van Haver D, Opitz M, Thery M et al (2021) Fat1 deletion promotes hybrid EMT state, tumour stemness and metastasis. Nature 589: 448–455 [DOI] [PMC free article] [PubMed] [Google Scholar]
- Patro R, Duggal G, Love MI, Irizarry RA, Kingsford C (2017) Salmon provides fast and bias‐aware quantification of transcript expression. Nat Methods 14: 417–419 [DOI] [PMC free article] [PubMed] [Google Scholar]
- Peng J, Sun BF, Chen CY, Zhou JY, Chen YS, Chen H, Liu L, Huang D, Jiang J, Cui GS et al (2019) Single‐cell RNA‐seq highlights intra‐tumoral heterogeneity and malignant progression in pancreatic ductal adenocarcinoma. Cell Res 29: 725–738 [DOI] [PMC free article] [PubMed] [Google Scholar]
- Puram SV, Tirosh I, Parikh AS, Patel AP, Yizhak K, Gillespie S, Rodman C, Luo CL, Mroz EA, Emerick KS et al (2017) Single‐cell transcriptomic analysis of primary and metastatic tumor ecosystems in head and neck cancer. Cell 171: 1611–1624 [DOI] [PMC free article] [PubMed] [Google Scholar]
- Ramírez F, Ryan DP, Grüning B, Bhardwaj V, Kilpert F, Richter AS, Heyne S, Dündar F, Manke T (2016) deepTools2: a next generation web server for deep‐sequencing data analysis. Nucleic Acids Res 44: W160–W165 [DOI] [PMC free article] [PubMed] [Google Scholar]
- Raphael BJ, Hruban RH, Aguirre AJ, Moffitt RA, Yeh JJ, Stewart C, Robertson AG, Cherniack AD, Gupta M, Getz G et al (2017) Integrated genomic characterization of pancreatic ductal adenocarcinoma. Cancer Cell 32: 185–203 [DOI] [PMC free article] [PubMed] [Google Scholar]
- Reid MD, Basturk O, Thirabanjasak D, Hruban RH, Klimstra DS, Bagci P, Altinel D, Adsay V (2011) Tumor‐infiltrating neutrophils in pancreatic neoplasia. Mod Pathol 24: 1612–1619 [DOI] [PMC free article] [PubMed] [Google Scholar]
- Ricci‐Vitiani L, Lombardi DG, Pilozzi E, Biffoni M, Todaro M, Peschle C, De Maria R (2007) Identification and expansion of human colon‐cancer‐initiating cells. Nature 445: 111–115 [DOI] [PubMed] [Google Scholar]
- Seino T, Kawasaki S, Shimokawa M, Tamagawa H, Toshimitsu K, Fujii M, Ohta Y, Matano M, Nanki K, Kawasaki K et al (2018) Human pancreatic tumor organoids reveal loss of stem cell niche factor dependence during disease progression. Cell Stem Cell 22: 454–467 [DOI] [PubMed] [Google Scholar]
- Shackleton M, Quintana E, Fearon ER, Morrison SJ (2009) Heterogeneity in cancer: cancer stem cells versus clonal evolution. Cell 138: 822–829 [DOI] [PubMed] [Google Scholar]
- Shibue T, Weinberg RA (2017) EMT, CSCs, and drug resistance: the mechanistic link and clinical implications. Nat Rev Clin Oncol 14: 611–629 [DOI] [PMC free article] [PubMed] [Google Scholar]
- Shimokawa M, Ohta Y, Nishikori S, Matano M, Takano A, Fujii M, Date S, Sugimoto S, Kanai T, Sato T (2017) Visualization and targeting of LGR5 + human colon cancer stem cells. Nature 545: 187–192 [DOI] [PubMed] [Google Scholar]
- Shimomura O, Oda T, Tateno H, Ozawa Y, Kimura S, Sakashita S, Noguchi M, Hirabayashi J, Asashima M, Ohkohchi N (2018) A novel therapeutic strategy for pancreatic cancer: targeting cell surface glycan using rBC2LC‐N lectin–drug conjugate (LDC). Mol Cancer Ther 17: 183–195 [DOI] [PubMed] [Google Scholar]
- Singh SK, Hawkins C, Clarke ID, Squire JA, Bayani J, Hide T, Henkelman RM, Cusimano MD, Dirks PB, Terasaki M et al (2003) Identification of a cancer stem cell in human brain tumors. Cancer Res 63: 5821–5828 [PubMed] [Google Scholar]
- Skene PJ, Henikoff S (2017) An efficient targeted nuclease strategy for high‐resolution mapping of DNA binding sites. Elife 6: e21856 [DOI] [PMC free article] [PubMed] [Google Scholar]
- Song S, Ajani JA, Honjo S, Maru DM, Chen Q, Scott AW, Heallen TR, Xiao L, Hofstetter WL, Weston B et al (2014) Hippo coactivator YAP1 upregulates SOX9 and endows esophageal Cancer cells with stem‐like properties. Cancer Res 74: 4170–4182 [DOI] [PMC free article] [PubMed] [Google Scholar]
- Srivastava S, Salter AI, Liggitt D, Yechan‐Gunja S, Sarvothama M, Cooper K, Smythe KS, Dudakov JA, Pierce RH, Rader C et al (2019) Logic‐gated ROR1 chimeric antigen receptor expression rescues T cell‐mediated toxicity to Normal tissues and enables selective tumor targeting. Cancer Cell 35: 489–503 [DOI] [PMC free article] [PubMed] [Google Scholar]
- Srivastava S, Furlan SN, Jaeger‐Ruckstuhl CA, Sarvothama M, Berger C, Smythe KS, Garrison SM, Specht JM, Lee SM, Amezquita RA et al (2021) Immunogenic chemotherapy enhances recruitment of CAR‐T cells to lung tumors and improves antitumor efficacy when combined with checkpoint blockade. Cancer Cell 39: 193–208 [DOI] [PMC free article] [PubMed] [Google Scholar]
- Stuart T, Butler A, Hoffman P, Hafemeister C, Papalexi E, Mauck WM, Hao Y, Stoeckius M, Smibert P, Satija R (2019) Comprehensive integration of single‐cell data. Cell 177: 1888–1902 [DOI] [PMC free article] [PubMed] [Google Scholar]
- Subramanian A, Tamayo P, Mootha VK, Mukherjee S, Ebert BL, Gillette MA, Paulovich A, Pomeroy SL, Golub TR, Lander ES et al (2005) Gene set enrichment analysis: a knowledge‐based approach for interpreting genome‐wide expression profiles. Proc Natl Acad Sci USA 102: 15545–15550 [DOI] [PMC free article] [PubMed] [Google Scholar]
- Vischioni B, Oudejans JJ, Vos W, Rodriguez JA, Giaccone G (2006) Frequent overexpression of aurora B kinase, a novel drug target, in non‐small cell lung carcinoma patients. Mol Cancer Ther 5: 2905–2918 [DOI] [PubMed] [Google Scholar]
- Wang X, Allen S, Blake JF, Bowcut V, Briere DM, Calinisan A, Dahlke JR, Fell JB, Fischer JP, Gunn RJ et al (2022) Identification of MRTX1133, a noncovalent, potent, and selective KRASG12DInhibitor. J Med Chem 65: 3123–3133 [DOI] [PubMed] [Google Scholar]
- Xue JY, Zhao Y, Aronowitz J, Mai TT, Vides A, Qeriqi B, Kim D, Li C, de Stanchina E, Mazutis L et al (2020) Rapid non‐uniform adaptation to conformation‐specific KRAS(G12C) inhibition. Nature 577: 421–425 [DOI] [PMC free article] [PubMed] [Google Scholar]
- Yamaguchi T, Yanagisawa K, Sugiyama R, Hosono Y, Shimada Y, Arima C, Kato S, Tomida S, Suzuki M, Osada H et al (2012) NKX2‐1/TITF1/TTF‐1‐induced ROR1 is required to sustain EGFR survival signaling in lung adenocarcinoma. Cancer Cell 21: 348–361 [DOI] [PubMed] [Google Scholar]
- Yamamoto K, Tateishi K, Kudo Y, Hoshikawa M, Tanaka M, Nakatsuka T, Fujiwara H, Miyabayashi K, Takahashi R, Tanaka Y et al (2016) Stromal remodeling by the BET bromodomain inhibitor JQ1 suppresses the progression of human pancreatic cancer. Oncotarget 7: 61469–61484 [DOI] [PMC free article] [PubMed] [Google Scholar]
- Zeng L, Zhou M‐M (2002) Bromodomain: an acetyl‐lysine binding domain. FEBS Lett 513: 124–128 [DOI] [PubMed] [Google Scholar]
- Zeng WF, Navaratne K, Prayson RA, Weil RJ (2007) Aurora B expression correlates with aggressive behaviour in glioblastoma multiforme. J Clin Pathol 60: 218–221 [DOI] [PMC free article] [PubMed] [Google Scholar]
- Zhang Y, Liu T, Meyer CA, Eeckhoute J, Johnson DS, Bernstein BE, Nussbaum C, Myers RM, Brown M, Li W et al (2008) Model‐based analysis of ChIP‐seq (MACS). Genome Biol 9: 1–9 [DOI] [PMC free article] [PubMed] [Google Scholar]
- Zhang S, Chen L, Cui B, Chuang HY, Yu J, Wang‐Rodriguez J, Tang L, Chen G, Basak GW, Kipps TJ (2012a) ROR1 is expressed in human breast cancer and associated with enhanced tumor‐cell growth. PLoS ONE 7: e31127 [DOI] [PMC free article] [PubMed] [Google Scholar]
- Zhang S, Chen L, Wang‐Rodriguez J, Zhang L, Cui B, Frankel W, Wu R, Kipps TJ (2012b) The onco‐embryonic antigen ROR1 is expressed by a variety of human cancers. Am J Pathol 181: 1903–1910 [DOI] [PMC free article] [PubMed] [Google Scholar]
- Zhang S, Cui B, Lai H, Liu G, Ghia EM, Widhopf GF, Zhang Z, Wu CCN, Chen L, Wu R et al (2014) Ovarian cancer stem cells express ROR1, which can be targeted for anti ‐cancer‐stem‐cell therapy. Proc Natl Acad Sci USA 111: 17266–17271 [DOI] [PMC free article] [PubMed] [Google Scholar]
- Zhang S, Zhang H, Ghia EM, Huang J, Wu L, Zhang J, Lam S, Lei Y, He J, Cui B et al (2019) Inhibition of chemotherapy resistant breast cancer stem cells by a ROR1 specific antibody. Proc Natl Acad Sci USA 116: 1370–1377 [DOI] [PMC free article] [PubMed] [Google Scholar]
- Zhu Q, Liu N, Orkin SH, Yuan GC (2019) CUT and RUNTools: a flexible pipeline for CUT and RUN processing and footprint analysis. Genome Biol 20: 1–12 [DOI] [PMC free article] [PubMed] [Google Scholar]