Abstract
New image-derived biomarkers for patients affected by autosomal dominant polycystic kidney disease are needed to improve current clinical management. The measurement of total kidney volume (TKV) provides critical information for clinicians to drive care decisions. However, patients with similar TKV may present with very different phenotypes, often requiring subjective decisions based on other factors (e.g., appearance of healthy kidney parenchyma, a few cysts contributing significantly to overall TKV, etc.). In this study, we describe a new technique to individually segment cysts and quantify biometric parameters including cyst volume, cyst number, parenchyma volume, and cyst parenchyma surface area. Using data from the Consortium for Radiologic Imaging Studies of Polycystic Kidney Disease (CRISP) study the utility of these new parameters was explored, both quantitatively as well as visually. Total cyst number and cyst parenchyma surface area showed superior prediction of the slope of estimated glomerular filtration rate decline, kidney failure and chronic kidney disease stages 3A, 3B, and 4, compared to TKV. In addition, presentations such as a few large cysts contributing significantly to overall kidney volume were shown to be much better stratified in terms of outcome predictions. Thus, these new image biomarkers, which can be obtained automatically, will have great utility in future studies and clinical care for patients affected by autosomal dominant polycystic kidney disease.
Keywords: Polycystic kidney disease, disease prognosis, outcome prediction, imaging biomarkers, instance segmentation, glomerular filtration rate
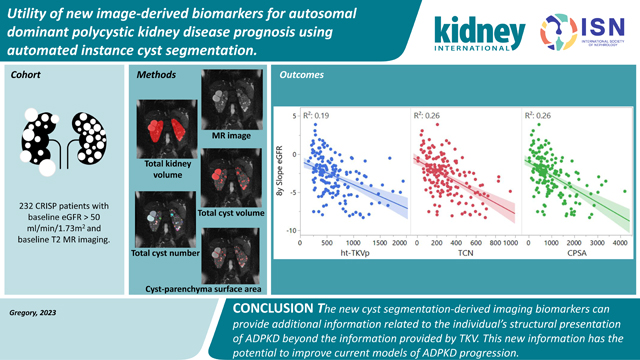
Graphical Abstract
INTRODUCTION
Autosomal dominant polycystic kidney disease (ADPKD) is the most common monogenic kidney disease characterized by the development and growth of cysts in the kidneys. The rate of ADPKD progression has been shown to vary widely among patients, thus, parameters indicative of disease progression are highly valuable for clinical decision making. Currently, total kidney volume (TKV) is the main imaging biomarker used for clinical management, outcome prediction, and assessment of the efficacy of novel therapeutics.1–7 Non-invasive visualizations of the kidneys can be made by various imaging modalities, such as US, CT, and MR. Once images of the kidneys are acquired, the most common approaches to measure TKV have been the ellipsoid formula,8 stereology,9 and planimetry. The first two methods have been shown to have the lowest accuracy but are faster to measure. Planimetry, on the other hand, has been shown to have the highest accuracy and precision, but is more time consuming to perform manually.10 This constraint is no longer a limitation with the development of semi-automated and artificial intelligence powered (fully automated) segmentation algorithms.11, 12
TKV is the only FDA approved imaging biomarker to be used as a surrogate for renal function in studies evaluating the efficacy of treatment interventions for patients affected by ADPKD. However, the wide range of phenotypic variations of the disease limit the usefulness of TKV.13, 14 This has led to studies investigating new imaging biomarkers, including the evaluation of cyst volume through the application of image processing-based intensity threshold methods. Cyst volume was found to increase at a steady rate with close correlation to TKV.1 Estimates of cyst number from a few MR slices have been studied and suggest that patients with a lower number of cysts have a milder ADPKD presentation than patients with a higher number of cysts.15, 16 Other efforts relate to the development of new image acquisition protocols for the characterization of renal tissue using magnetization transfer imaging,17 and image processing techniques to extract textural features;18 however, these methods are challenging to apply to retrospective data. We recently developed a novel automated approach that facilitates the segmentation of individual cysts,19 an impractical and time consuming task for humans to perform. This has opened the opportunity to explore more precise and new image-derived biomarkers. These include measurements of total cyst volume (TCV) defined as the sum of all cyst volumes, renal parenchyma volume (RPV) defined as the difference between TKV and TCV, total cyst number (TCN) defined as the count of all cysts, and cyst parenchyma surface area (CPSA) defined as the sum of all cyst surface areas covered by renal parenchyma (i.e., the sum of all cyst surface areas minus the outer surface of exophytic cysts).
In this retrospective study, we evaluate the utility of the new biomarkers on the Consortium for Radiologic Imaging Studies of Polycystic Kidney Disease (CRISP) dataset20 in order to understand how these new image-derived measurements can improve the quantification of disease presentations and better stratify patients beyond simple measurement of TKV.
METHODS
Study population
This study was reviewed and approved by our institution’s IRB and was HIPAA compliant. A cohort of the CRISP study including 232 ADPKD patients without azotemia and with creatinine clearance>70 mL/min were included in this study.1 The patients, as part of the CRISP protocol, were evaluated periodically since 2001 and continuing (currently for over a 20-year period). Deidentified baseline T2-weighted MR images (single-shot fast spin–echo and half-Fourier acquired single-shot turbo spin–echo) acquired between January 2001 and November 2002 were retrospectively collected (Clinical centers: University of Alabama, Emory University, the Kansas University Medical Center, and the Mayo Clinic Rochester). Patient clinical characteristic such as age, baseline eGFR, follow-up eGFR, sex, race, and height were available for all participants. Kidney volumes obtained by the ellipsoid (TKVe) and stereology (TKVs) methods were available for comparison with the deep learning-based planimetry approach (TKVp).
Estimated GFR and Study Outcomes
The CKD-EPI 2021 equation (where race is omitted) was used to calculate eGFR. The imaging biomarkers were evaluated based on the following outcomes. The slope of eGFR, estimated using least squares linear regression for patients with at least four eGFR measures between baseline and the 8-year timepoint, was considered as the primary continuous outcome. The primary dichotomous outcome was KF status after 20 years from baseline. Patients who reached KF were identified based on transplant or dialysis history and patients without KF were selected based on the availability of eGFR measurement at the 20-year timepoint. Further analysis regarding whether a patient had or had not reached chronic kidney disease (CKD) stages 3A, 3B, and 4, and KF based on the eGFR measurements at the 8-year timepoint is presented in the Supplementary Methods.
Automated Segmentations and Calculation of Imaging Biomarkers
Kidney segmentation was performed using a previously developed deep learning-based planimetry approach,11, 12 and the output was quality reviewed by a blinded expert medical imaging reader. The MR image and predicted kidney segmentation were then input into the cyst segmentation model.19 The output consisted of each cyst individually labeled. The predicted segmentations underwent a quality review by two expert medical imaging readers blinded to the patient’s clinical information, using an in-house-developed software tool.21 TKVp, TCV, RPV, TCN, and CPSA were calculated using Python 3.6.8 applying arithmetic operators and functions from the library PyRadiomics.22 Mathematical details of the specific calculations are provided in the Supplementary Methods. Height adjusted TKVp (ht-TKVp) and TCV (ht-TCV) were calculated by dividing the volumes with the patient’s height. Height adjusted RPV (ht-RPV) was calculated as the difference between ht-TKVp and ht-TCV. A threshold cyst size of 0.09 ml was applied to reduce false positives cysts due to inherent MR imaging noise artifacts (an example case is presented in Supplementary Figure S3).
Statistical analysis
The statistical analysis was performed using the statistical software JMP Pro 16.0.0 and the python library scikit-learn v0.22.1. Bland-Altman analysis was performed to evaluate the agreement between TKV calculation methods. Linear regression was conducted to evaluate each imaging biomarker’s ability to predict the slope of eGFR. P-values were estimated using the nonparametric Wilcoxon rank sum test. Sensitivity, specificity, and the area under the receiver operating characteristic (ROC) curve (Az) with 95% bootstrap confidence intervals (CI) were calculated. Area under the curve comparisons were performed using the DeLong test. The net reclassification improvement (NRI) index was used to measure the prediction increment of the new biomarkers and TKV calculation methods.
RESULTS
Study Population
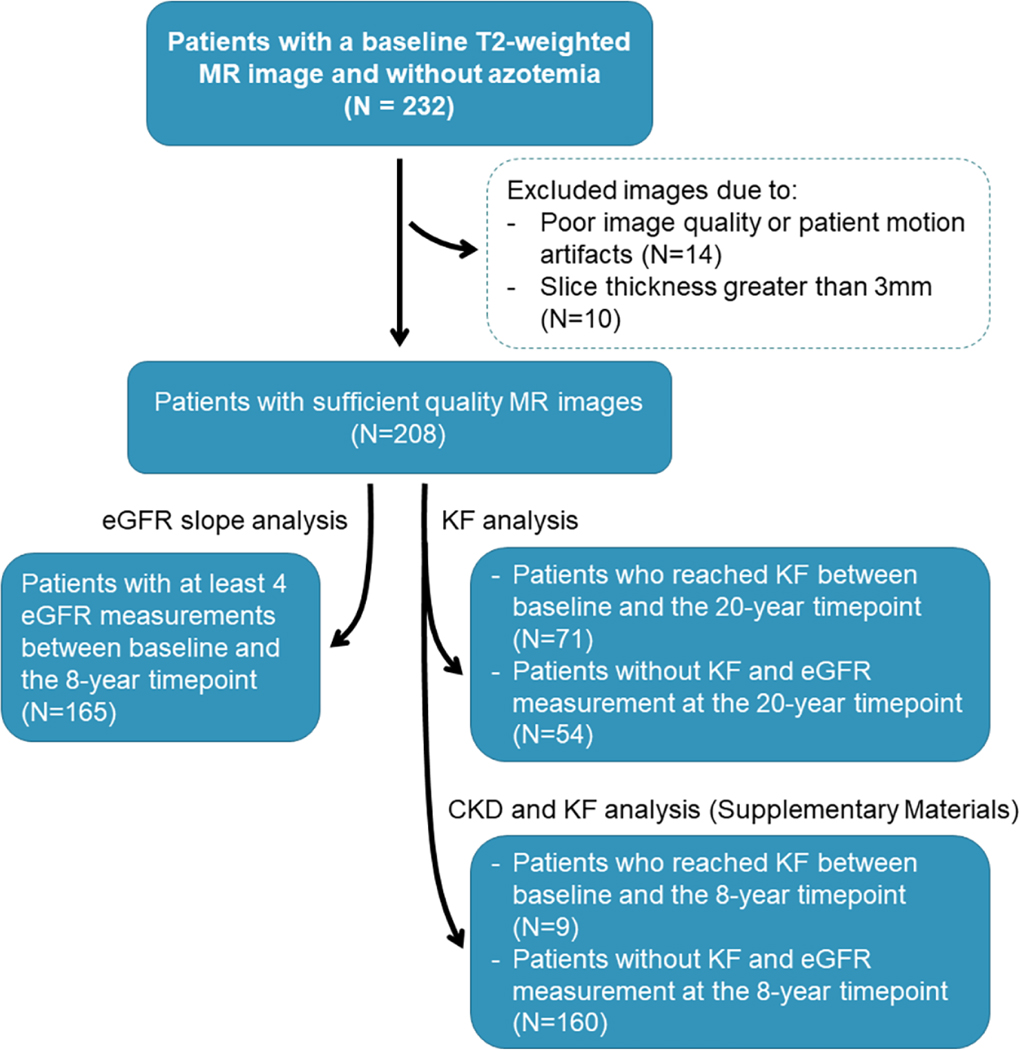
Baseline MR images from the CRISP study participants were curated as shown in Figure 1.
Figure 1.
Flowchart of the study participants – from baseline MR images (top) – to follow-up outcomes (bottom).
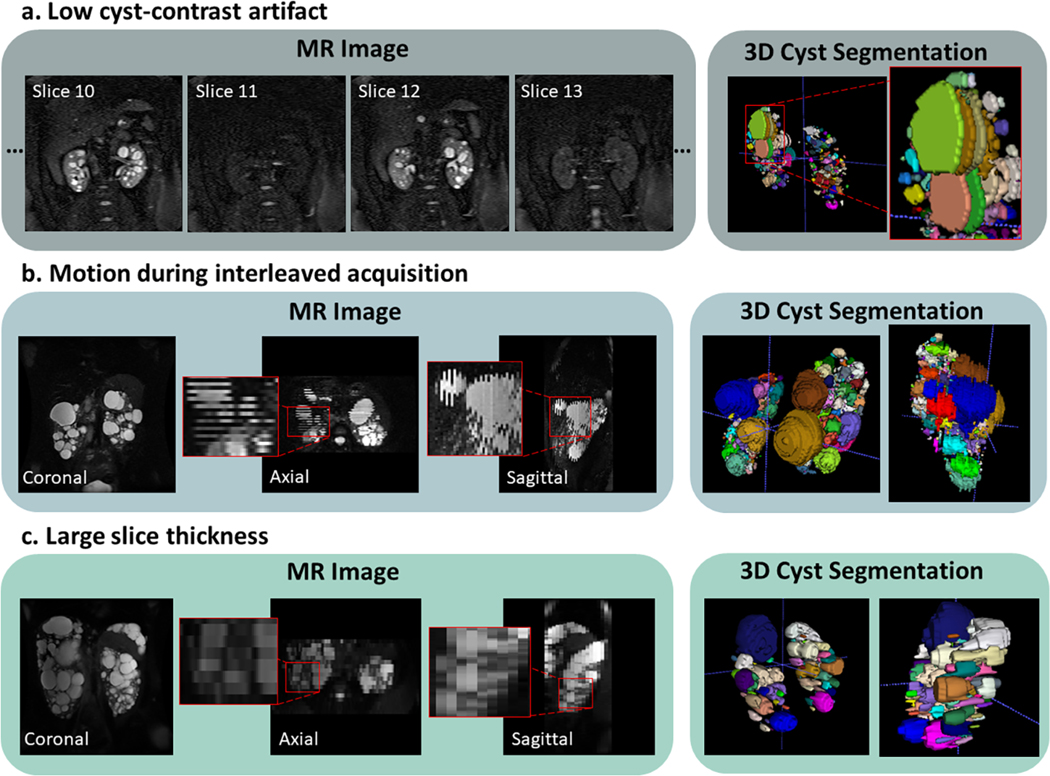
Twenty-four images were excluded during the segmentation review process due to imaging artifacts (N=14) or large slice thickness (N=10). One image presented low cyst contrast every other slice resulting in unreal gaps within the predicted cysts, thus overestimating TCN (Figure 2a). Thirteen images presented large slice misalignment due to patient movement during multiple breath-hold acquisitions (e.g. interleaved image acquisition), although the prediction of cysts was fairly accurate, CPSA measurements could be overestimated (Figure 2b). Ten cases presented a slice thickness greater than 3mm, a large slice thickness can affect the differentiation of adjacent cysts since the image resolution across slices reduces with higher slice thickness (Figure 2c). Follow-up eGFR data at the 8-year timepoint was available for 165 patients. A total of 71 patients reached KF during the 20 years of the study. All eGFR measurements were greater than 50 ml/min/1.73m2 at baseline. Details of the patient characteristics are shown in Table 1.
Figure 2.
Representative MR images of excluded cases. a) Case showing low cyst-contrast every other slice likely due to poorly prescribed fat saturation pulse. b) Slice interleaving is often used to increase the signal-to-noise ratio; however, patient motion can cause misalignments between slices. c) Image acquired with a 9mm slice thickness which limits the differentiation of adjacent cysts in the axial and sagittal planes as well as limits measurement of small cysts.
Table 1.
Baseline Patient Demographics and Clinical Characteristics.
| Characteristic | 8-year timepoint slope of eGFR (n=165) | 20-year timepoint KF (n=125) |
|---|---|---|
| Sex | ||
| Female | 61% | 60% |
| Male | 39% | 40% |
| Height (cm), median (IQR) | 170 (164–181) | 172 (164–182) |
| Age (yo), median (IQR) | 34 (26–40) | 35(27–40) |
| BMI (kg/m 2 ), median (IQR) | 24 (22–28) | 25(22–29) |
| Race | ||
| Caucasian | 87% | 92% |
| African American | 10% | 6% |
| Asian, Hispanic, and Native American | 3% | 2% |
| eGFR (ml/min/1.73m 2 ), median (IQR) | 92 (80–110) | 89 (77–108) |
| Genotype + effect | ||
| PKD1 truncating | 58% | 57% |
| PKD1 non-truncating | 22% | 26% |
| PKD2 truncating | 11% | 10% |
| PKD2 non-truncating | 2% | 2% |
| GANAB non-truncating | 1% | 1% |
| Not available | 6% | 4% |
Segmentation Results
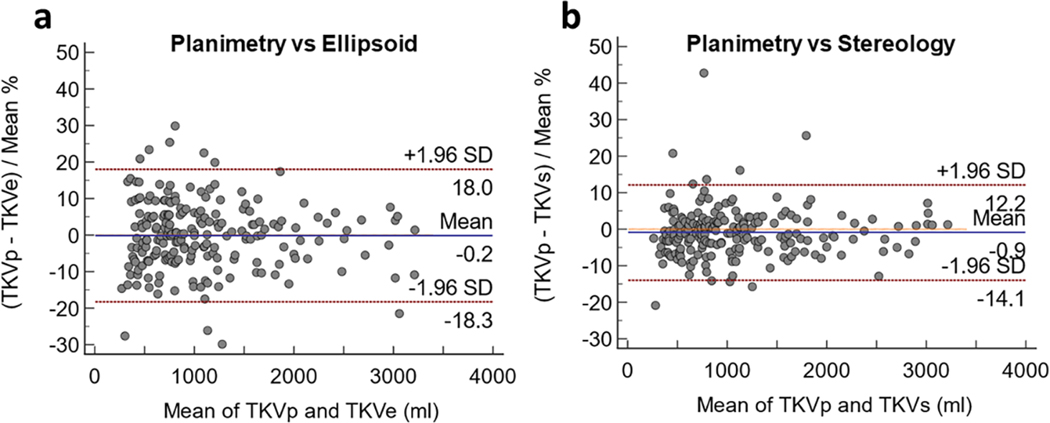
In Figure 3, the Bland-Altman plots show the bias and limits of agreement between the 208 TKV measurements estimated by planimetry (deep learning-based method) and the ellipsoid method, and between planimetry and the stereology method. The bias in both cases was less than 1%, however, narrower limits of agreement were observed between planimetry and stereology with a standard deviation of 6.7%.
Figure 3.
Bland-Altman plots between (a) the deep learning-based (planimetry) and the ellipsoid methods, and (b) the deep learning-based (planimetry) and stereology methods. The y-axis shows the percentage difference between the methods.
Distribution analysis of the imaging biomarkers from the 208 cases resulted in a mean TKVp of 1086±658 ml (range: 250–3238 ml) at baseline. The mean baseline TCV was 495±448 ml (range: 4–2397 ml). The mean baseline RPV was 591±245 ml (range: 234–1508 ml). The mean baseline TCN was 290±199 cysts (range: 3–1025 cysts). The mean baseline CPSA was 1003±79 cm2 (range: 16–4196 cm2). The correlation matrix of all imaging biomarkers, baseline age and eGFR can be found in Supplementary Figure S4. An example MR image with corresponding kidney, cyst, parenchyma, and CPSA segmentation and 3D renderings is shown in Figure 4.
Figure 4.
(a) Abdominal MR image of a 41yo female patient with a PKD1 truncating mutation and a baseline eGFR of 50.7 ml/min/1.73 m2. (b) The patient’s TKVp was 1912 ml. (c) The automated cyst segmentation shows each cyst labeled with a different color (TCV = 905 ml; TCN = 595 cysts). (d) The renal parenchyma segmentation resulted from the subtraction of kidney and cyst segmentations (RPV = 1007 ml). The cyst-parenchyma surface representation is shown in (e), where the surfaces between renal parenchyma and cysts are depicted with the red outline (CPSA = 3196 cm2).
Biomarker Performance: Linear Regression analysis
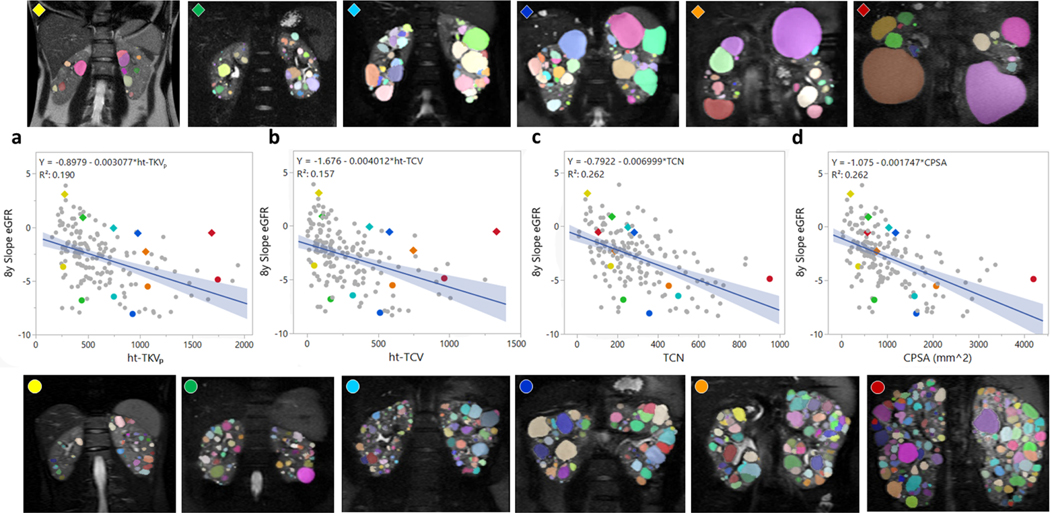
A regression analysis comparing the imaging biomarkers with the eGFR slope after an 8-year follow-up was performed. The imaging biomarkers ht-TKVp, ht-TCV, ht-RPV, TCN, and CPSA showed a fair correlation with the 8-year slope of eGFR with a Pearson’s correlation coefficient (r) of −0.44, −0.40, −0.45, −0.51, and −0.51, respectively; whereas TCN and CPSA showed the highest correlation with the slope. Figure 5 depicts some of the linear regression plots for the 8-year follow-up analysis (additional regression plots can be found in Supplementary Figure S5). In figure 5, six pairs of patients were selected to illustrate the imaging biomarkers. Each pair is color coded and was matched based on similar ht-TKVp but different eGFR slope. Patients with a steeper slope decline after 8 years are marked with color circles (bottom MR images) and patients with positive or smaller slope decline after 8 years are marked with rhombuses (top MR images). The genotype, imaging biomarkers, and age from the 12 example cases are shown in Table 2.
Figure 5.
Linear regression analysis between the 8-year slope of eGFR and the individual image biomarkers. (a) ht-TKVp, (b) ht-TCV, (c) TCN, and (d) CPSA. To illustrate the results six pairs of patients with similar ht-TKV but different slope of eGFR were randomly selected. The colored diamonds and dots correspond to the 6 cases shown above and below the plots.
Table 2.
Characteristics of the example patients shown in Figure 5.
| Parameter | Yellow | Green | Cyan | Blue | Orange | Red |
|---|---|---|---|---|---|---|
| ♦ | ||||||
| Age (yo) | 20 | 25 | 26 | 38 | 43 | 46 |
| ht-TKVp (ml/m) | 277 | 452 | 745 | 979 | 1054 | 1687 |
| ht-TCV (ml/m) | 83 | 108 | 439 | 579 | 747 | 1332 |
| ht-RPV (ml/m) | 194 | 344 | 307 | 399 | 307 | 355 |
| TCN | 52 | 173 | 252 | 283 | 188 | 106 |
| CPSA (cm2) | 198 | 588 | 1036 | 1183 | 771 | 569 |
| Genotype | PKD1-T | PKD1-T | PKD1-T | PKD1-NT | PKD2-T | PKD1-NT |
| ● | ||||||
| Age (yo) | 18 | 43 | 42 | 26 | 26 | 36 |
| ht-TKVp (ml/m) | 263 | 440 | 749 | 929 | 1073 | 1745 |
| ht-TCV (ml/m) | 51 | 166 | 322 | 513 | 600 | 965 |
| ht-RPV (ml/m) | 212 | 274 | 427 | 415 | 472 | 780 |
| TCN | 167 | 229 | 500 | 357 | 453 | 951 |
| CPSA (cm2) | 369 | 718 | 1597 | 1636 | 2070 | 4196 |
| Genotype | PKD1-T | PKD1-T | PKD1-T | PKD1-T | PKD1-T | PKD1-T |
T: truncating; NT: non-truncating
Biomarker Performance: ROC and NRI analysis
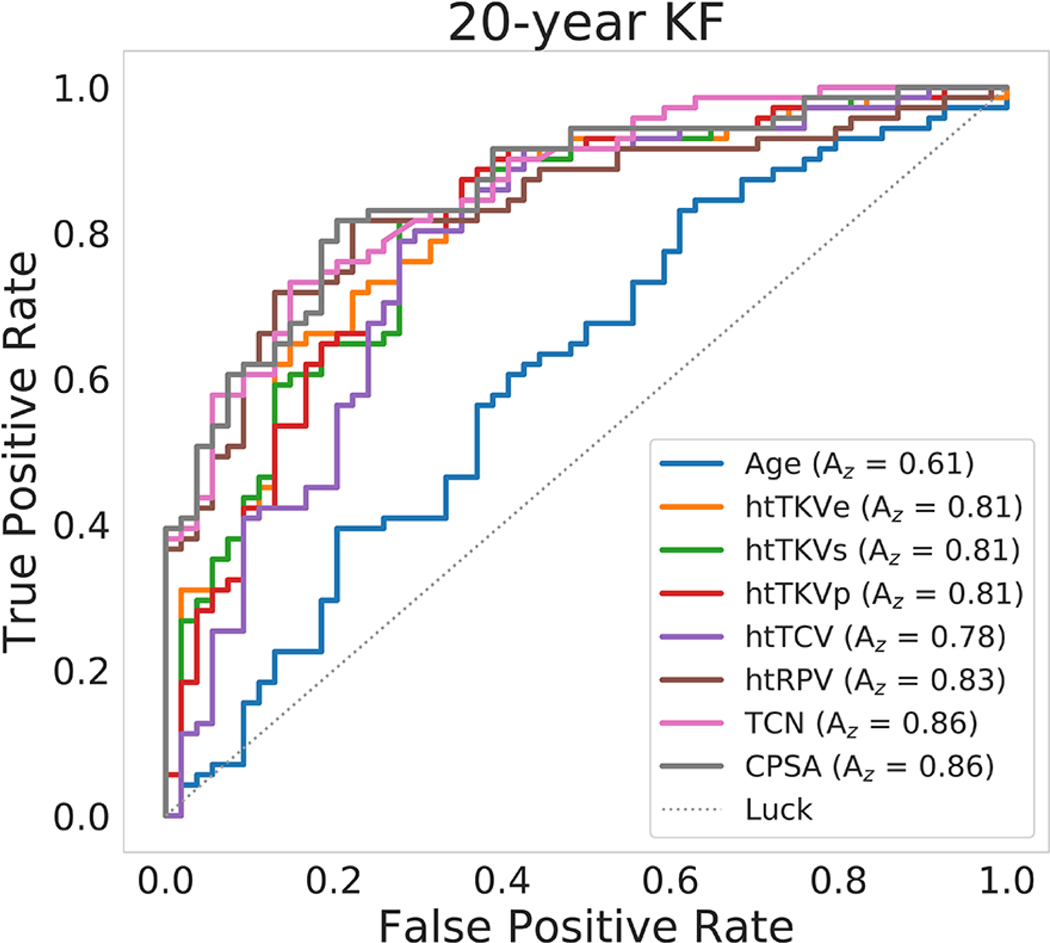
The predictive power of the imaging biomarkers for progression to KF after a 20-year follow-up was superior to baseline age as shown by the ROC analysis (Table 3). Here, ht-TKVp, ht-RPV, TCN, and CPSA had a strong predictive power with an Az greater than 0.8. Additionally, CPSA had a significantly higher Az compared to ht-TKVp in the prediction of KF. Analyses of the progression to CKD stages 3A, 3B, and 4 and KF at the 8-year timepoint can be found in the Supplementary Table S1 and Supplementary Figure S6.
Table 3.
Summary statistics for baseline age and imaging biomarkers in predicting the progression to kidney failure after a 20-year follow-up period.
| Biomarker | median (IQR) | median (IQR) | P-valuea | sensitivity | specificity | cut-off point | Az (95% CI) | ht-TKV Az P-value b |
|---|---|---|---|---|---|---|---|---|
| 20yr KF | Yes (n=71) | No (n=54) | ||||||
| Age | 35.43 (30–40.19) | 31.73 (25.01–38.28) | 0.0333 | 0.83 | 0.39 | 27.76 | 0.61 (0.51–0.71) | 0.0003 |
| ht-TKVp | 807.37 (559.12–1109.8) | 419.58 (309.6–623.38) | <0.0001 | 0.87 | 0.65 | 457.55 | 0.81 (0.72–0.88) | - |
| ht-TCV | 372.7 (232.46–597.4) | 131.49 (81.6–329) | <0.0001 | 0.79 | 0.72 | 212.12 | 0.78 (0.69–0.87) | 0.0206 |
| ht-RPV | 403.99 (316.77–548.97) | 283.43 (236.43–309.71) | <0.0001 | 0.82 | 0.78 | 311.78 | 0.83 (0.75–0.89) | 0.3233 |
| TCN | (274–577) | (125.75–261.5) | <0.0001 | 0.73 | 0.85 | 307 | 0.86 (0.78–0.91) | 0.0791 |
| CPSA | 14.71 (9.06–20.68) | 5.64 (3.93–8.09) | <0.0001 | 0.82 | 0.80 | 8.51 | 0.86 (0.79–0.92) | 0.027 |
Wilcoxon rank sum test
DeLong test
Units: Age (yo), ht-TKV (ml/m), ht-TCV (ml/m), ht-RPV (ml/m), TCN (cyst unit), CPSA (dm2)
In Figure 6, a plot comparing the ROC curves from baseline age, the traditional ht-TKV methods: ht-TKVe and ht-TKVs, and the automated ht-TKVp, ht-TCV, ht-RPV, TCN, and CPSA in predicting progression to KF after the 20-year follow-up is presented.
Figure 6.
ROC analysis to determine the individual biomarker predictive power of progression to KF after a 20-year follow-up period. The image biomarkers with highest predictive power were TCN and CPSA (lines pink and gray).
In order to understand how the individual biomarkers could improve patient stratification in terms of 20-year KF (where 71 patients did reach KF and 54 did not), we calculated the net reclassification improvement (NRI) index comparing ht-TKV measured by traditional methods to the biomarkers obtained automatically. All of the new imaging biomarkers improved NRI compared to the ellipsoid method (ht-TKVe cut-off point = 685 ml). The NRI (correctly reclassified/incorrectly reclassified) for ht-TKVp was 0.022 (16/11), for ht-TCV was 0.011 (10/7), for ht-RPV was 0.095 (16/8), for TCN was 0.084 (14/8), and for CPSA was 0.113 (16/7). Compared to stereology (ht-TKVs cut-off point = 515 ml) the NRI for ht-TKVp was −0.018 (4/4), for ht-TCV was −0.028 (1/3), for ht-RPV was 0.056 (11/8), for TCN was 0.045 (12/11), and for CPSA was 0.074 (8/4).
DISCUSSION
In this study, we analyzed the prognostic performance of novel imaging biomarkers on the CRISP cohort. Baseline age and imaging biomarkers measured from T2-weighted MR images were investigated to predict the slope of eGFR as well as KF after a follow-up period of 8- and 20-years, respectively. The segmentations were generated using two convolutional neural network models. The first model generated kidney segmentations and the second model predicted instance-level cyst segmentations.11, 12, 19 These models can generate segmentations in under a few minutes. On a standard computer, the calculation of image biomarkers from the images and segmentations can then be done in a few seconds. In this study, the segmentations underwent a quality control process by two medical imaging readers before the calculation of the imaging biomarkers, thus, the parameters are not purely extracted based on deep-learning model outputs. Finally, the performance of each imaging biomarker was evaluated and compared to the performance of TKV, the only imaging biomarker currently used clinically.
A study evaluating methods for the estimation of TKV has demonstrated that measurements by planimetry are more accurate, precise, and reproducible; however, due to the time required to perform planimetry manually, ellipsoid-based and/or stereology-based methods are often employed.10 Deep learning-based segmentation methods expedite the calculation of TKV by planimetry.12 In our study, among planimetry, stereology and the ellipsoid method, TKVp and TKVs showed the highest agreement (bias = −0.9±6.7%). The comparison of ROC curves in Figure 6 demonstrated that the three TKV estimation methods have a similar area under the curve when predicting 20-year KF; however, the NRI analysis indicated a higher reclassification improvement when comparing the ellipsoid to the planimetry method.
The new imaging biomarkers ht-RPV, TCN and CPSA were found to predict renal function decline better than ht-TKVp in the 8-year analysis as shown in the linear regression plots in Supplementary Figure S5. Ht-TCV was not as informative but it highly correlated with ht-TKVp (R2 = 0.98) (correlation matrix in Supplementary Figure S4). The best performing imaging biomarkers in differentiating patients with and without KF were ht-RPV, TCN, and CPSA. TCN was the imaging biomarker with the lowest correlation with ht-TKVp (R2 = 0.81), evidence that it provides phenotypic information not captured by ht-TKV. TCN characterizes features related to cystogenesis, a longitudinal evaluation of TCN could provide information regarding the rate of cyst formation. Previous longitudinal studies using an estimate of the total cyst number suggested that PKD1 and PKD2 genotypes have differences in cyst number and volume but no significant differences in the rate of change of cyst number or volume.15, 16 Very small cysts or microcysts may be under the MR image resolution and may not be accounted for by the algorithm. For these cases, texture analysis might provide insights related to the integrity of the renal parenchyma.18 Although, texture features are much more sensitive to image acquisition parameters and have strict requirements for standardization of the measurements. CPSA has a physiologic meaning and relates to an individual cyst’s impact on renal function (e.g., exophytic cysts will have a smaller impact compared to cysts surrounded by kidney parenchyma). Further, the visual qualitative analysis of selected cases showed that patients with larger kidney function decline presented with numerous small cysts, whereas cases with preserved kidney function presented with fewer and larger cysts and in some cases with exophytic cysts.
Even though the new imaging biomarkers showed promising results, the correlations with the slope of eGFR are moderate. Many other clinical, laboratory, biochemical, and metabolic factors could be contributing to the residual variance in the rate of disease progression, but the study of these factors is out of the scope of this paper. We envision that this work will serve as a basis for future model development that may result in better prediction of disease progression. Data sharing in the medical field has many challenges, although, efforts such as federated learning could aid in the sharing of trained algorithms. The code and model weights are made available online at https://github.com/TLKline/InstanceCystSeg.
All imaging biomarkers performed as hypothesized except for ht-RPV. We expected that smaller parenchyma volumes would correlate with greater slope of decline in eGFR, since increases in total kidney and cyst volume and reductions in parenchyma volume and GFR were observed in a longitudinal study of nine patients with ADPKD using contrast enhanced CT.23 Our cross-sectional analysis of baseline values in the CRISP population, with preserved kidney function at entry into the study, showed a negative correlation between ht-RPV and the slope of eGFR decline. A confounding factor could be related to the presence of tubular epithelial hyperplasia and/or hypertrophy and of microcysts undetected by the MR image resolution. Of note is that the CRISP study of the trajectories of eGFR in patients with ADPKD suggests a period of glomerular hyperfiltration, particularly in the patients with the most severe disease.24 Interestingly, hepatocyte hypertrophy contributes substantially to the enlargement of the liver in polycystic liver disease.25 Another confounding factor could be the development of fibrotic tissue. The non-functional parenchyma has been previously referred to as “intermediate volume”.26 The study by Caroli et. al measured the intermediate volume by applying an intensity thresholding method in CT scans and showed that the ratio of intermediate volume over renal parenchyma volume better correlates with eGFR. They demonstrated that the CT segmented intermediate volume corresponded to regions of interstitial fibrosis from histological analyses.27 In MR imaging, quantitative methods17, 28 and/or radiomic-based texture analysis18 may help differentiate functional from non-functional parenchyma to determine if the enlargement of RPV is due to the presence of intermediate volume as the mechanism leading to faster eGFR decline.
Some of the limitations of this study include the need for sufficient quality T2-weighted MR images to calculate accurate imaging biomarkers (which may be more stringent than the requirements for calculation and/or approximation of TKV). Twenty-four patients were excluded due to inadequate MR image quality. The presence of imaging artifacts can affect the quantification of imaging biomarkers. Some examples included: the lack of cyst contrast on partial slices which affected the continuity of cysts, and patient motion during image acquisition likely affecting the accuracy of surface area measurements. Lastly, large slice thickness complicated the differentiation of cysts from slice to slice and could limit the visualization of small cysts. A second limitation was the overlap of 11 patients between the cyst instance-level model development and the CRISP cohort, although, the images used for model training were acquired at different dates compared to the baseline CRISP images. Furthermore, all the cyst instance-level predicted segmentations were checked for quality by medical imaging readers before the calculation of imaging biomarkers.
In conclusion, the new cyst segmentation-derived imaging biomarkers can provide additional information related to the individual’s structural presentation of ADPKD beyond the information provided by TKV. This new information has the potential to improve current models of disease progression and move to a more personalized model of care taking into account the phenotypic differences between patients affected by ADPKD. Studies with larger cohorts are necessary to build and validate new models in order to investigate the predictive value of combining the new imaging biomarkers with ht-TKV.
Supplementary Material
Supplementary Methods: Calculation of Imaging Biomarkers
Supplementary Figure S1. Calculation of the cysts-parenchyma mask
Supplementary Figure S2. Calculation of the cyst-parenchyma surface areas.
Supplementary Figure S3. Example case presenting cysts that were excluded based on the size threshold of < 0.09 ml.
Supplementary Figure S4. Correlation matrix between imaging biomarkers and patient’s eGFR and age at baseline
Supplementary Figure S5. Linear regression analysis of the 8-year slope of eGFR versus baseline age and imaging biomarkers.
Supplementary Table S1. Summary statistics for baseline age and imaging biomarkers in predicting the progression to kidney failure and CKD stages 3A, 3B, and 4 after an 8-year follow-up period.
Supplementary Figure S6. Plots comparing the ROCs for age, ht-TKVp, ht-TCV, ht-RPV, TCN, and CPSA for predicting progression to CKD stages 3A, 3B, and 4, and KF after the 8year follow-up period.
Translational Statement.
In this study, we evaluated new image-derived biomarkers as prognostic factors of autosomal dominant polycystic kidney disease (ADPKD). We used a deep learning model to generate instance-level cyst segmentations, a previously unattainable task, that facilitated the characterization of architectural disease presentations beyond total kidney volume (TKV). The new biomarkers include total cyst volume (TCV), renal parenchyma volume (RPV), total cyst number (TCN), and cyst-parenchyma surface area (CPSA). TCN and CPSA showed improved prediction of disease progression after an 8-year and a 20-year period compared to ht-TKV, an important finding that could enhance existing prognostic tools.
Acknowledgements
This work was supported by the NIDDK under grant numbers K01DK110136, R01DK113111, U54DK126126, P20GM130423, and R01DK058816.
Sources of support
This work was supported by the NIDDK under grant numbers K01DK110136, R01DK113111, U54DK126126, P20GM130423, and R01DK058816.
Abbreviations:
- ADPKD
Autosomal dominant polycystic kidney disease
- eGFR
estimated glomerular filtration rate
- CKD
chronic kidney disease
- KF
kidney failure
- ht-TKVp
height-adjusted total kidney volume (planimetry)
- ht-TKVe
height-adjusted total kidney volume (ellipsoid)
- ht-TKVs
height-adjusted total kidney volume (stereology)
- ht-TCV
height-adjusted total cyst volume
- ht-RPV
height-adjusted renal parenchyma volum
- TCN
total cyst number
- CPSA
Cyst parenchyma surface area
- MRI
magnetic resonance imaging
- TKV
total kidney volume
- TCV
total cyst volume
- RPV
renal parenchyma volume
Footnotes
DISCLOSURE STATEMENT
None of the authors have financial interests to disclose and the authors declare no conflicts of interest.
Publisher's Disclaimer: This is a PDF file of an unedited manuscript that has been accepted for publication. As a service to our customers we are providing this early version of the manuscript. The manuscript will undergo copyediting, typesetting, and review of the resulting proof before it is published in its final form. Please note that during the production process errors may be discovered which could affect the content, and all legal disclaimers that apply to the journal pertain.
Data Sharing Statement:
Sharing of this data would be a violation of HIPAA and the policies provided by our IRB related to this study.
REFERENCES
- 1.Grantham JJ, Torres VE, Chapman AB, et al. Volume progression in polycystic kidney disease. N Engl J Med 2006; 354: 2122–2130. [DOI] [PubMed] [Google Scholar]
- 2.Torres VE, Chapman AB, Devuyst O, et al. Tolvaptan in patients with autosomal dominant polycystic kidney disease. N Engl J Med 2012; 367: 2407–2418. [DOI] [PMC free article] [PubMed] [Google Scholar]
- 3.Caroli A, Perico N, Perna A, et al. Effect of longacting somatostatin analogue on kidney and cyst growth in autosomal dominant polycystic kidney disease (ALADIN): a randomised, placebo-controlled, multicentre trial. Lancet 2013; 382: 1485–1495. [DOI] [PubMed] [Google Scholar]
- 4.Wallace DP, Hou YP, Huang ZL, et al. Tracking kidney volume in mice with polycystic kidney disease by magnetic resonance imaging. Kidney Int 2008; 73: 778–781. [DOI] [PubMed] [Google Scholar]
- 5.Grantham JJ, Torres VE. The importance of total kidney volume in evaluating progression of polycystic kidney disease. Nat Rev Nephrol 2016; 12: 667–677. [DOI] [PMC free article] [PubMed] [Google Scholar]
- 6.Higashihara E, Torres VE, Chapman AB, et al. Tolvaptan in autosomal dominant polycystic kidney disease: three years’ experience. Clin J Am Soc Nephrol 2011; 6: 2499–2507. [DOI] [PMC free article] [PubMed] [Google Scholar]
- 7.Irazabal MV, Rangel LJ, Bergstralh EJ, et al. Imaging classification of autosomal dominant polycystic kidney disease: a simple model for selecting patients for clinical trials. J Am Soc Nephrol 2015; 26: 160–172. [DOI] [PMC free article] [PubMed] [Google Scholar]
- 8.Higashihara E, Nutahara K, Okegawa T, et al. Kidney volume estimations with ellipsoid equations by magnetic resonance imaging in autosomal dominant polycystic kidney disease. Nephron 2015; 129: 253–262. [DOI] [PubMed] [Google Scholar]
- 9.Bae KT, Tao C, Zhu F, et al. MRI-based kidney volume measurements in ADPKD: reliability and effect of gadolinium enhancement. Clin J Am Soc Nephrol 2009; 4: 719–725. [DOI] [PMC free article] [PubMed] [Google Scholar]
- 10.Sharma K, Caroli A, Quach LV, et al. Kidney volume measurement methods for clinical studies on autosomal dominant polycystic kidney disease. PLoS One 2017; 12: e0178488. [DOI] [PMC free article] [PubMed] [Google Scholar]
- 11.Kline TL, Korfiatis P, Edwards ME, et al. Performance of an artificial multi-observer deep neural network for fully automated segmentation of polycystic kidneys. J Digit Imaging 2017; 30: 442–448. [DOI] [PMC free article] [PubMed] [Google Scholar]
- 12.van Gastel MD, Edwards ME, Torres VE, et al. Automatic measurement of kidney and liver volumes from MR images of patients affected by autosomal dominant polycystic kidney disease. J Am Soc Nephrol 2019; 30: 1514–1522. [DOI] [PMC free article] [PubMed] [Google Scholar]
- 13.Hateboer N, v Dijk MA, Bogdanova N, et al. Comparison of phenotypes of polycystic kidney disease types 1 and 2. Lancet 1999; 353: 103–107. [DOI] [PubMed] [Google Scholar]
- 14.Senum SR, Li YSM, Benson KA, et al. Monoallelic IFT140 pathogenic variants are an important cause of the autosomal dominant polycystic kidney-spectrum phenotype. Am J Hum Genet 2022; 109: 136–156. [DOI] [PMC free article] [PubMed] [Google Scholar]
- 15.Bae KT, Zhou W, Shen C, et al. Growth pattern of kidney cyst number and volume in autosomal dominant polycystic kidney disease. Clin J Am Soc Nephrol 2019; 14: 823–833. [DOI] [PMC free article] [PubMed] [Google Scholar]
- 16.Harris PC, Bae KT, Rossetti S, et al. Cyst number but not the rate of cystic growth is associated with the mutated gene in autosomal dominant polycystic kidney disease. J Am Soc Nephrol 2006; 17: 3013–3019. [DOI] [PubMed] [Google Scholar]
- 17.Kline TL, Irazabal MV, Ebrahimi B, et al. Utilizing magnetization transfer imaging to investigate tissue remodeling in a murine model of autosomal dominant polycystic kidney disease. Magn Reson Med 2016; 75: 1466–1473. [DOI] [PMC free article] [PubMed] [Google Scholar]
- 18.Kline TL, Korfiatis P, Edwards ME, et al. Image texture features predict renal function decline in patients with autosomal dominant polycystic kidney disease. Kidney Int 2017; 92: 1206–1216. [DOI] [PMC free article] [PubMed] [Google Scholar]
- 19.Gregory AV, Anaam DA, Vercnocke AJ, et al. Semantic Instance Segmentation of Kidney Cysts in MR Images: A Fully Automated 3D Approach Developed Through Active Learning. J Digit Imaging 2021; 34: 773–787. [DOI] [PMC free article] [PubMed] [Google Scholar]
- 20.Chapman AB, Guay-Woodford LM, Grantham JJ, et al. Renal structure in early autosomal-dominant polycystic kidney disease (ADPKD): The Consortium for Radiologic Imaging Studies of Polycystic Kidney Disease (CRISP) cohort. Kidney Int 2003; 64: 1035–1045. [DOI] [PubMed] [Google Scholar]
- 21.Kline TL, Edwards ME, Korfiatis P, et al. Semiautomated segmentation of polycystic kidneys in T2-weighted MR images. AJR Am J Roentgenol 2016; 207: 605. [DOI] [PMC free article] [PubMed] [Google Scholar]
- 22.Van Griethuysen JJ, Fedorov A, Parmar C, et al. Computational radiomics system to decode the radiographic phenotype. Cancer Res 2017; 77: e104–e107. [DOI] [PMC free article] [PubMed] [Google Scholar]
- 23.King BF, Reed JE, Bergstralh EJ, et al. Quantification and longitudinal trends of kidney, renal cyst, and renal parenchyma volumes in autosomal dominant polycystic kidney disease. J Am Soc Nephrol 2000; 11: 1505–1511. [DOI] [PubMed] [Google Scholar]
- 24.Alan S, Shen C, Landsittel DP, et al. Long-term trajectory of kidney function in autosomal-dominant polycystic kidney disease. Kidney Int 2019; 95: 1253–1261. [DOI] [PMC free article] [PubMed] [Google Scholar]
- 25.Hogan MC, Abebe K, Torres VE, et al. Liver involvement in early autosomal-dominant polycystic kidney disease. Clin Gastroenterol Hepatol 2015; 13: 155–164. e156. [DOI] [PMC free article] [PubMed] [Google Scholar]
- 26.Antiga L, Piccinelli M, Fasolini G, et al. Computed tomography evaluation of autosomal dominant polycystic kidney disease progression: a progress report. Clin J Am Soc Nephrol 2006; 1: 754–760. [DOI] [PubMed] [Google Scholar]
- 27.Caroli A, Antiga L, Conti S, et al. Intermediate volume on computed tomography imaging defines a fibrotic compartment that predicts glomerular filtration rate decline in autosomal dominant polycystic kidney disease patients. Am J Pathol 2011; 179: 619–627. [DOI] [PMC free article] [PubMed] [Google Scholar]
- 28.Kline TL, Edwards ME, Garg I, et al. Quantitative MRI of kidneys in renal disease. Abdom Radiol 2018; 43: 629–638. [DOI] [PMC free article] [PubMed] [Google Scholar]
Associated Data
This section collects any data citations, data availability statements, or supplementary materials included in this article.
Supplementary Materials
Supplementary Methods: Calculation of Imaging Biomarkers
Supplementary Figure S1. Calculation of the cysts-parenchyma mask
Supplementary Figure S2. Calculation of the cyst-parenchyma surface areas.
Supplementary Figure S3. Example case presenting cysts that were excluded based on the size threshold of < 0.09 ml.
Supplementary Figure S4. Correlation matrix between imaging biomarkers and patient’s eGFR and age at baseline
Supplementary Figure S5. Linear regression analysis of the 8-year slope of eGFR versus baseline age and imaging biomarkers.
Supplementary Table S1. Summary statistics for baseline age and imaging biomarkers in predicting the progression to kidney failure and CKD stages 3A, 3B, and 4 after an 8-year follow-up period.
Supplementary Figure S6. Plots comparing the ROCs for age, ht-TKVp, ht-TCV, ht-RPV, TCN, and CPSA for predicting progression to CKD stages 3A, 3B, and 4, and KF after the 8year follow-up period.
Data Availability Statement
Sharing of this data would be a violation of HIPAA and the policies provided by our IRB related to this study.


