Abstract
The present study investigated the sequential regulation signals of high-carbohydrate diet (HCD)-induced hepatic lipid deposition in gibel carp (Carassius gibelio). Two isonitrogenous and isolipidic diets, containing 25% (normal carbohydrate diet, NCD) and 45% (HCD) corn starch, were formulated to feed gibel carp (14.82 ± 0.04 g) for 8 weeks. The experimental fish were sampled at 2nd, 4th, 6th, and 8th week. In HCD group, the hyperlipidemia and significant hepatic lipid deposition (oil red O area and triglyceride content) was found at 4th, 6th, and 8th week, while the significant hyperglycemia was found at 2nd, 4th, and 8th week, compared to NCD group (P < 0.05). HCD induced hepatic lipid deposition via increased hepatic lipogenesis (acc, fasn, and acly) but not decreased hepatic lipolysis (hsl and cpt1a). When compared with NCD group, HCD significantly elevated the hepatic sterol regulatory element binding proteins 1 (SREBP1) signals (positive hepatocytes and fluorescence intensity) at 4th, 6th, and 8th week (P < 0.05). The hepatic SREBP1 signals increased from 2nd to 6th week, but decreased at 8th week due to substantiated insulin resistance (plasma insulin levels, plasma glucose levels, and P-AKTSer473 levels) in HCD group. Importantly, the hepatic carbohydrate response element binding protein (ChREBP) signals (positive hepatocytes, fluorescence intensity, and expression levels) were all significantly elevated by HCD-induced glucose-6-phosphate (G6P) accumulation at 2nd, 4th, 6th, and 8th week (P < 0.05). Compared to 2nd and 4th week, the hepatic ChREBP signals and G6P contents was significantly increased by HCD at 6th and 8th week (P < 0.05). The HCD-induced G6P accumulation was caused by the significantly increased expression of hepatic gck, pklr, and glut2 (P < 0.05) but not 6pfk at 4th, 6th, and 8th week, compared to NCD group. These results suggested that the HCD-induced hepatic lipid deposition was mainly promoted by SREBP1 in earlier stage and by ChREBP in later stage for gibel carp. This study revealed the sequential regulation pathways of the conversion from feed carbohydrate to body lipid in fish.
1. Introduction
Carbohydrates are widely applied in aquatic feeds as energy-supplying nutrients for their excellent price-performance ratio [1, 2]. However, many fish display a very limited ability in utilizing dietary carbohydrate [1, 3]. Consequently, a long-term excessive carbohydrate intake usually brings metabolic disorders, like disordered blood glucose [2, 4, 5], supraphysiological lipogenesis, and hepatic steatosis in various aquaculture species [6–8], including gibel carp (Carassius gibelio) [9]. In recent years, some studies focused on the metabolic syndrome caused by high-carbohydrate diet- (HCD-) induced over deposition of lipids [10, 11] and investigated the strategies for alleviating the HCD-induced metabolism disorders [12–14]. However, the dynamic changes of the conversion from feed carbohydrate to body lipid remains uncovered and whether existing sequential regulation pathways during the long-term HCD challenge is still poorly understood in the farmed fish.
In general, the lipogenesis process is mainly regulated by insulin signaling pathway [15]. After carbohydrate intake, the subsequent glucose influx triggers off insulin secretion, which abates endogenous glucose efflux and activates sterol regulatory element binding proteins 1 (SREBP1) to convert excess glucose into fatty acids via hepatic lipid anabolism [16, 17]. The regulation effects of SREBP1 in lipogenesis have been demonstrated in gibel carp [18], grass carp (Ctenopharyngodon idella) [3], and Atlantic salmon (Salmo salar L.) [19]. Notably, chronic overdeposition of lipids results in insulin resistance (high-insulin level while low-insulin efficiency) and impairs the insulin-SREBP1 signaling-mediated lipogenesis in mammalians [15, 20]. Accordingly, insulin resistance may be also established in farmed fish during the long-term HCD challenge. Importantly, previous investigations identified carbohydrate response element binding protein (ChREBP) as a key regulator in converting excess carbohydrate to lipid for long-term storage [21, 22]. ChREBP is a basic helix–loop–helix leucine-zipper transcription factor, playing crucial role in lipogenesis, and glycolysis under high-carbohydrate intake [23, 24]. Unlike SREBP1, the activation of ChREBP is promoted by carbohydrate-related metabolites, like glucose-6-phosphate (G6P) [25] and fructose 2,6-bisphosphate [26]. ChREBP and SREBP-1 showed overlapping but distinct roles in regulating postprandial hepatic lipogenesis [27]. Several studies indicated that ChREBP was involved in the carbohydrate-induced lipogenesis in aquaculture fish [3, 28]. Although SREBP1 and ChREBP seem to play overlapped roles in lipogenesis, the sequential responses and synergism of them during the long-term HCD intake remains elusive, which is of significance to the precise regulation of HCD-induced lipid overdeposition in farmed fish.
Gibel carp (C. gibelio) are widely cultured in China with an annual production of 2.78–million tons in 2021 [29]. As an omnivorous fish, gibel carp is a suitable model for its moderate carbohydrate-tolerance to investigate the metabolic alteration during a long-term HCD challenge [30]. In the present study, we evaluated the sequential changes of hepatic lipid deposition and lipogenesis regulation in the gibel carp fed with HCD for 8 weeks. The results demonstrated that HCD induced hepatic lipid deposition via increasing lipogenesis, which was mainly promoted by insulin-SREBP1 in earlier stage (4th and 6th) and by G6P-ChREBP in later stage (6th and 8th) during the 8 week experiment. Thus, we clarified a sequential regulation manner of the conversion from feed carbohydrate to body lipid in fish. These findings present sequential and precise targets for ameliorating the HCD-induced hepatic steatosis in cultured fish.
2. Materials and Methods
2.1. Experimental Diets
Two isonitrogenous (29.91% crude protein) and isolipidic (6.72% crude lipid) experimental diets were formulated, which contained 25% corn starch (normal carbohydrate diet, NCD) and 45% corn starch (HCD), respectively. The formulation and approximate chemical compositions of the experimental diets are shown in Table 1. The ingredients of each diet were thoroughly mixed through a 60 mesh sieve. Then, the ingredients were completely mixed and extruded into 3 mm diameter pellets by using a laboratory single-screw pelleter (SLR-45, Fishery Machinery and Instrument Research Institute, Chinese Academy of Fishery Science, Shanghai, China). Pellets were dried in an oven at 60°C and stored at 4°C before use.
Table 1.
Formulation and chemical composition of experimental diets (% dry matter).
| Ingredient | Content (%) | |
|---|---|---|
| NCD | HCD | |
| White fish meal | 15 | 15 |
| Casein | 24 | 24 |
| Soybean oil | 3 | 3 |
| Fish oil | 3 | 3 |
| Corn starch | 25 | 45 |
| Vitamin premix1 | 0.39 | 0.39 |
| Choline chloride | 0.11 | 0.11 |
| Mineral premix2 | 5 | 5 |
| Cellulose | 21.5 | 1.5 |
| Carboxy methyl cellulose sodium | 3 | 3 |
| Proximate composition (%) | ||
| Moisture | 9.39 | 9.11 |
| Crude protein | 29.82 | 29.99 |
| Crude lipid | 6.81 | 6.62 |
| Ash | 7.42 | 7.23 |
1Vitamin premix (mg/kg diet): Vitamin B1, 20; Vitamin B2, 20; Vitamin B6, 20; Vitamin B12, 0.02; folic acid, 5; calcium patothenate, 50; inositol, 100; niacin, 100; biotin, 0.1; cellulose, 3522; Vitamin C, 100; Vitamin A, 110; Vitamin D, 20; Vitamin E, 50; Vitamin K, 10. 2Mineral premix (mg/kg diet): NaCl, 500.0; MgSO4·7H2O, 8,155.6; NaH2PO4·2H2O, 12,500.0; KH2PO4, 16,000; Ca(H2PO4)·2H2O, 7650.6; FeSO4·7H2O, 2,286.2; C6H10CaO6·5H2O, 1750.0; ZnSO4·7H2O, 178.0; MnSO4·H2O, 61.4; CuSO4·5H2O, 15.5; CoSO4·7H2O, 0.91; KI, 1.5; Na2SeO3, 0.60; corn starch, 899.7.
2.2. Experimental Fish and Feeding Trial
The experimental gibel carp (C. gibelio var. CAS V) were obtained from the Institute of Hydrobiology, Chinese Academy of Sciences (Wuhan, Hubei, China). Four weeks prior to the feeding trial, gibel carp were acclimated in an indoor rearing system with fiber glass cylinder and fed to satiation twice a day at 8:30 and 16:30 with a commercial feed (Wuhan CP Aquatic Co., Ltd., Wuhan, China). After a 24 hr fasting, the fish of healthy appearance and uniform size (initial body weight: 14.82 ± 0.04 g) were randomly distributed into six indoor fiber glass tanks (water volume: 120 L) with 20 fish density for each tank. Triplicate tanks were assigned for each treatment. During the trial, fish were fed twice a day at 8:30 and 16:30 for 8 weeks. The water temperature was recorded daily and maintained at 27–29°C. Ammonia nitrogen (Ammonia-N), dissolved oxygen (DO), and pH were monitored every 3 days. The values showed that the concentration of Ammonia-N was below 0.3 mg/kg, the DO was 6.0–7.5 mg/L, and the pH was 6.8–7.3. The photoperiod was 12 hr light (8:00–20:00): 12 hr dark.
2.3. Sample Collection and Growth Performance Determination
Sample collections were conducted at 2nd, 4th, 6th, and 8th week, respectively. For each sample collection, three fish in each tank were randomly selected and anesthetized with MS-222 (50 mg/L; Sigma Aldrich Co. LLC., St. Louis, MO, USA) at postprandial 4 hr. The body length and weight of the anesthetized fish were measured, then two of them were sampled blood from the caudal vein by heparinized syringe. The blood was centrifuged at 3,500 g for 10 min to obtain the plasma and stored at −80°C for further analysis. Immediately, the liver tissues were removed on ice. A small part of each liver tissues was fixed by 4% paraformaldehyde for histological staining and observation, while the rest was stored at −80°C for further analysis. The specific growth rate (SGR) and condition factor (CF) were calculated as follows:
| (1) |
2.4. Total RNA Extraction, Reverse Transcription, and qPCR
Total RNA from the liver tissues was extracted by TRIzol Reagent (Ambion Life Technologies, Carlsbad, CA, USA) according to the product instructions. The quality and concentration of extracted total RNA were evaluated according to our previous methods [31]. The total RNA of liver tissues was reverse-transcribed with an M-MLV First Strand Synthesis Kit (Invitrogen, Shanghai, China) according to the product instructions. The obtained cDNA was stored at −20°C for qPCR analysis. The qPCR was conducted on LightCycle 480 II system (Roche, Basel, Switzerland). Samples were run in duplicates, and the relative expressions were calculated according to a published method [32]. The primers of qPCR analysis were designed with the National Center for Biotechnology Information (NCBI) primer BLAST service or from the previous study [18] and listed in Table 2.
Table 2.
Primer sequences for quantitative real-time PCR (qPCR) analysis.
| Gene | Accession # | Forward primer (5′– 3′) | Reverse primer (5′– 3′) | Product size |
|---|---|---|---|---|
| acc | KF499584 | GAGCTGTCTATCAGAGGAGACTTCA | GACGCTCGGCCTGCATCTTCT | 139 |
| fasn | KF511494 | CCACACCATGGACCCACAGCT | CTGGGTCTTTACTGAAGGCCTCT | 158 |
| acly | KX898508 | AGTTTGGCCACGCTGGAGCTTGT | CCCAGCTCATCGAAGCTCTTGG | 112 |
| hsl | MH536187 | GAAGAGTGTTTCTATGCCTACT | CCGTGAGACATTGCCCTCAT | 140 |
| cpt1a | KX898509 | GAAGCTCATCAGGCTGTGGCCTT | TTCCAGGAGTGAAGTCCGGAGAG | 113 |
| aco3 | KX898510 | TGTGGAGGACACGGTTACCTTGC | AGTTGCTGGTCTGCTGCAGAAGG | 115 |
| srebp1 | KX898507 | GGCCCTCTACTGCGTGGCACA | ACCACCATTTGGAGTGAGGGTCAC | 194 |
| irs1 | XM026234327.1 | CAACTACGCCCGTCCCTT | TCCGCCCTGATGACCTTA | 168 |
| irs2 | XM026218815.1 | CGGAAAGAATCTTGTAGTGG | TGCTCTGACGCATCATAAA | 382 |
| chrebp | XM026246198.1 | CCGTCATAGATCCCGAAAG | TTACCATTGTCCTGGTTGGAGACTG | 462 |
| gck | KX898498 | GAGGAGATGCGTAAGGTGGAGCT | TTCTCATACAGCTGATGTCCAGGGTT | 167 |
| 6pfk | KX898500.1 | ACACCGGATGCCGCAGAAGCA | TCGATCTCTCCGGTCACATACTCG | 105 |
| pklr | KX898502 | GCATCTGTGTCTGCTGGACATCGA | TGAGAGCCGTGAGAGAAGTTCAGTC | 144 |
| glut2 | KX898504 | CTCGTGGATGAGCTACCTCAGCAT | CCCTGACTGAAGATCTCCGCCA | 111 |
| g6pase | KX898505 | CCTTACTGGTGGGTCCATGAGACT | TGGGCCGGTCTCACAGGTCAT | 90 |
| pepck | KX898506 | AGACAAACCCTCATGCCATGGCAAC | GGGTCTATGATGGGGCACTGG | 226 |
| ef1α | AB056104 | GTTGGAGTCAACAAGATGGACTCCAC | CTTCCATCCCTTGAACCAGCCCAT | 198 |
2.5. Plasma and Tissue Biochemical Analyses
Plasma glucose levels were measured by Glucose Assay Kit with O-toluidine (Beyotime Biotechnology, China, S0201S). Hepatic and plasma triglycerides (TG) contents were measured using a Triglyceride Assay Kit (A110, Nanjing Jiancheng Bioengineering Institute, China). Plasma insulin level was measured using a commercial ELISA kit (H203, Nanjing Jiancheng Bioengineering Institute, China). Hepatic G6P content were measured using commercial Glucose-6-phosphate Assay Kit (S0185, Beyotime Biotechnology, China). All measurements were performed following the manufacturers' instructions.
2.6. Oil Red O Staining, Immunofluorescence Staining, and Imaging
The liver tissues initially fixed with 4% paraformaldehyde plus 20% sucrose overnight and sectioned to 8 μm with a cryostat (Thermo Fisher Scientific, MA, USA). For oil red O (ORO) staining, the liver cryosections were stained with ORO to visualize the lipid droplets. Images were collected by Leica automatic digital slide scanner (Aperio VERSA 8, GER) and quantified with ImageJ (National Institutes of Health, USA). Immunofluorescence on the liver cryosections was performed according to a previous study [33]. Primary antibodies were anti-SREBP1 (Abcam, ab28481, and Rabbit, 1 : 200), anti-P-AKTSer473 (Cell Signaling Technology, 4060, Rabbit, 1 : 200), and anti-CHREBP (Abcam, ab81958, Rabbit, 1 : 200), followed by Alexa Fluor 568 (Thermo Fisher Scientific, A11036, Goat anti rabbit, 1 : 1,000) or Alexa Fluor 488 (Cell Signaling Technology, 4412, Goat anti rabbit, 1 : 1,000) conjugated secondary antibody for visualization. Nuclei were stained by Hoechst 33342 (Thermo Fisher Scientific, H21492). Images were collected with Leica laser-scanning confocal microscope (SP8 DLS, GER), analyzed by Imaris Viewer (Oxford Instruments, UK), and quantified by ImageJ (National Institutes of Health, USA).
2.7. Statistical Analysis
All results are expressed as means ± SEMs (standard error of the mean). Normality was tested by 1-sample Kolmogorov–Smirnov test. Homogeneity of variance was examined by the Levene test. A two-tailed independent t test was used to evaluate the significant differences of measured parameters between two groups (data between NCD and HCD at each week). A one-way ANOVA with Duncan's multiple-range test was used to evaluate significant differences of measured parameters among several groups (data among four weeks of each treatment). Differences with P Values < 0.05 were considered significant. All statistical analyses were carried out and graphed with GraphPad Prism 8 (GraphPad Software, San Diego, CA, USA).
3. Results
3.1. Growth Performance, Plasma Glucose/TG, and Hepatic Lipid Deposition
During the 8-week feeding trial, the body weight showed significantly increased at 6th and 8th week in HCD group (P < 0.05), while there was no significant difference between HCD and NCD groups at 2nd or 4th week (Figure 1(a)). The body length showed no significant difference between HCD and NCD groups from 2nd to 8th week (Figure 1(b)). The CF value of HCD group was significantly higher than that in NCD group only at 8th week (P < 0.05) (Figure 1(c)). However, the SGR of HCD group was significantly increased at 2nd, 6th, and 8th week, compared to NCD group (P < 0.05) (Figure 1(d)).
Figure 1.
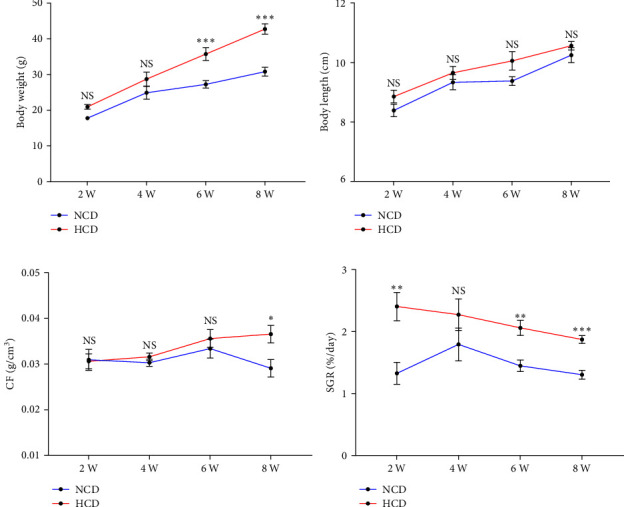
The growth performance of gibel carp fed with HCD and NCD during 8 weeks. (a) Body weight, (b) body length, (c) condition factor (CF), and (d) specific growth rate (SGR). Values are expressed as means ± SEMs, n = 9. ∗, ∗∗, ∗∗∗Different from NCD: ∗P < 0.05, ∗∗P < 0.01, and ∗∗∗P < 0.005, NS means no significant difference (two-tailed independent t test).
The plasma glucose levels of HCD group were significantly higher than those of NCD group at 2nd, 4th, and 8th week (P < 0.05) (Figure 2(a)). Within the HCD group, the plasma glucose levels of 4th and 6th week displayed significantly decreased (P < 0.05), compared to that of 2nd week (Figure 2(a)). The plasma TG levels of HCD group were significantly higher than those of NCD group at 4th, 6th, and 8th week (P < 0.05) (Figure 2(b)). Within the HCD or NCD group, the plasma TG levels of 8th week both showed significant increase, compared to those of 2nd, 4th, and 6th week (P < 0.05) (Figure 2(b)). The ORO staining of hepatic sections showed that the lipid area of HCD group were significantly larger than those of NCD group at 4th, 6th, and 8th week (P < 0.05) (Figures 2(c) and 2(d)). The hepatic TG content showed the similar change mode with the ORO staining results (Figure 2(e)). Within the HCD group, the hepatic lipid area and TG content of 6th and 8th week were significantly increased, compared to those of 2nd and 4th week (P < 0.05) (Figure 2(c)–2(e)). Besides, a mild but significant increase-trend in hepatic lipid area and TG content was also observed within the NCD group from 2nd to 8th week (Figure 2(c)–2(e)).
Figure 2.
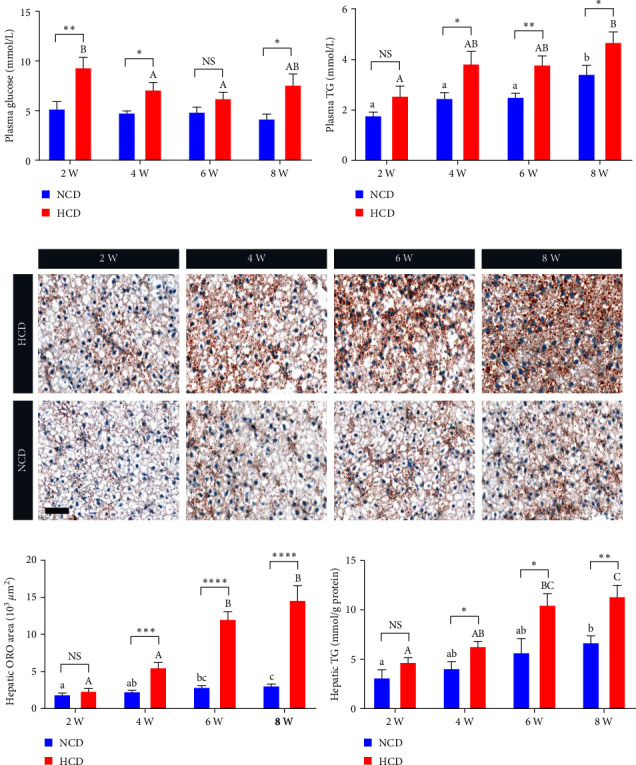
The plasma glucose, plasma triglyceride (TG) and hepatic lipid deposition levels of gibel carp fed with HCD and NCD during 8 weeks. (a) Plasma glucose level, (b) plasma TG level, (c) represented images of hepatic oil red O staining (scale bar = 50 μm), (d) quantification of the hepatic oil red O area, and (e) hepatic TG content. Values are expressed as means ± SEMs, n = 6. Labeled means without a common letter differ among 2 W, 4 W, 6 W, and 8 W (lowercase for NCD and uppercase for HCD), P < 0.05 (one-way ANOVA, Duncan's post hoc test). ∗, ∗∗, ∗∗∗, ∗∗∗∗Different from NCD: ∗P < 0.05, ∗∗P < 0.01, ∗∗∗P < 0.005, and ∗∗∗∗P < 0.001, NS means no significant difference (two-tailed independent t test).
3.2. Expression of Hepatic Lipid Metabolism Genes
The qPCR analysis of lipogenesis genes showed that the expression levels of hepatic acetyl-CoA carboxylase (acc), fatty acid synthase (fasn), and ATP-citrate lyase (acly) were all significantly increased in HCD group at 2nd, 4th, 6th, and 8th week, compared to those in NCD group (P < 0.05) (Figure 3(a)–3(c)). However, the qPCR analysis of lipolysis genes showed that the expression levels of hepatic hormone-sensitive lipase (hsl) and carnitine palmitoyl transferase 1a (cpt1a) were significantly increased in HCD group at 6th and 8th week, while acyl-CoA oxidase 3 (aco3) significantly increased in HCD group only at 8th week, compared to those in NCD group (P < 0.05) (Figure 3(d)–3(f)).
Figure 3.
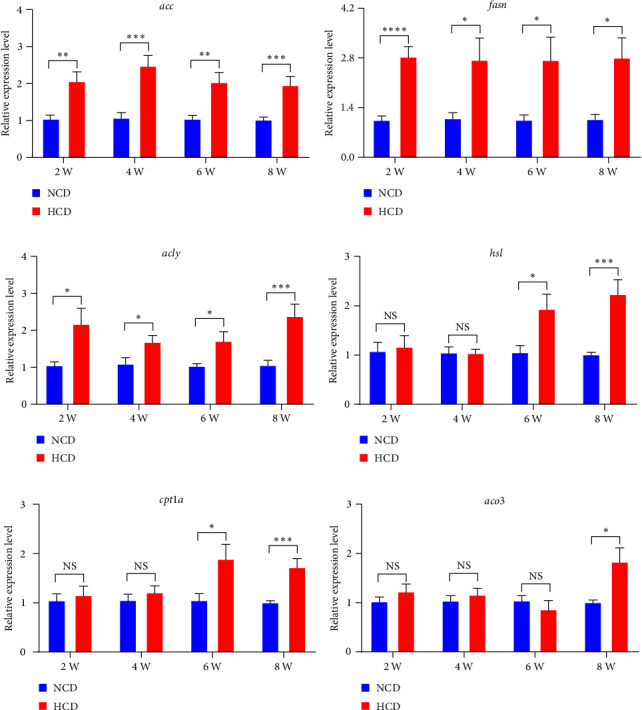
The expression levels of hepatic lipogenesis and lipolysis genes in gibel carp fed with HCD and NCD during 8 weeks. (a) Expression level of hepatic acetyl-CoA carboxylase (acc, gene), (b) expression level of hepatic fatty acid synthase (fasn, gene), (c) expression level of hepatic ATP-citrate lyase (acly, gene), (d) expression level of hepatic hormone-sensitive lipase (hsl, gene), (e) expression level of hepatic carnitine palmitoyl transferase 1a (cpt1a, gene), and (f) expression level of hepatic acyl-CoA oxidase 3 (aco3, gene). Values are expressed as means ± SEMs, n = 6. ∗, ∗∗, ∗∗∗, ∗∗∗∗Different from NCD: ∗P < 0.05, ∗∗P < 0.01, ∗∗∗P < 0.005, and ∗∗∗∗P < 0.001, NS means no significant difference (two-tailed independent t test).
3.3. Evaluations of Hepatic Insulin-SREBP1 Signal and Insulin Resistance
The immunostaining of hepatic SREBP1 showed that the percentage of SREBP1 positive hepatocytes and the fluorescence intensity of SREBP1 were significantly increased in HCD group at 4th, 6th, and 8th week, compared to those in NCD group (P < 0.05) (Figure 4(a)–4(c)). Within HCD group, the percentage of SREBP1 positive hepatocytes and the fluorescence intensity of SREBP1 were significantly increased at 4th, 6th, and 8th week, compared to those at 2nd week (P < 0.05); however, they were both significantly decreased at 8th week, compared to those at 6th week (P < 0.05) (Figure 4(a)–4(c)). Besides, the expression levels of srebp1 were all significantly increased in HCD group at 2nd, 4th, and 6th week, but not 8th week, compared to those in NCD group (P < 0.05) (Figure 4(d)). The plasma insulin levels of HCD group were significantly higher than those of NCD group at 2nd, 6th, 4th, and 8th week (P < 0.05) (Figure 4(e)). Within the HCD group, the plasma insulin levels of 4th, 6th, and 8th week displayed significantly increased compared to that of 2nd week (P < 0.05), while there was no significant difference among 4th, 6th, and 8th week (Figure 4(e)).
Figure 4.
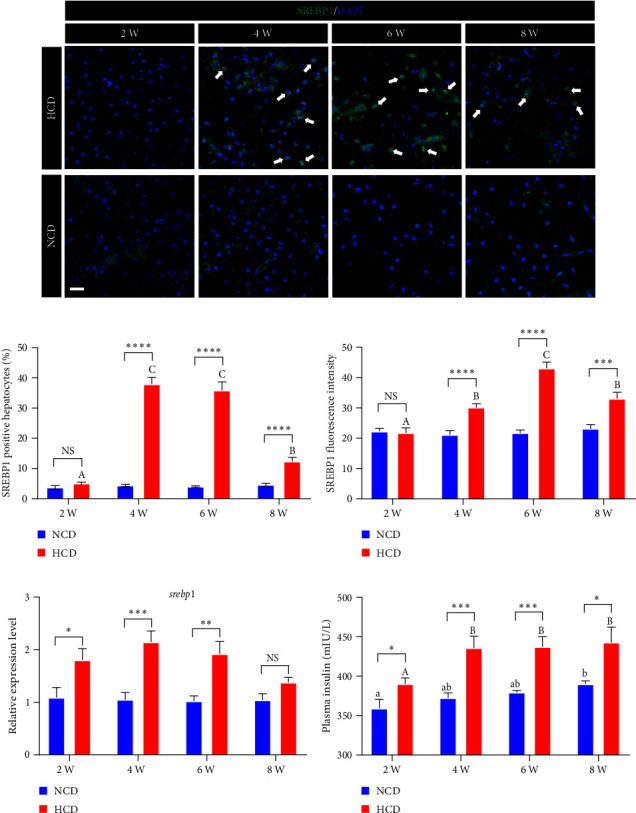
The expression and activation levels of hepatic insulin-SREBP1 signal in gibel carp fed with HCD and NCD during 8 weeks. (a) Represented SREBP1 (green) staining images (scale bar = 20 μm), (b) percentage of nuclear SREBP1 positive hepatocytes, (c) average fluorescence intensity of nuclear SREBP1, (d) expression level of hepatic srebp1, and (e) plasma insulin level. Values are expressed as means ± SEMs, n = 6. Labeled means without a common letter differ among 2 W, 4 W, 6 W, and 8 W (lowercase for NCD, uppercase for HCD), P < 0.05 (one-way ANOVA, Duncan's post hoc test). ∗, ∗∗, ∗∗∗, ∗∗∗∗Different from NCD: ∗P < 0.05, ∗∗P < 0.01, ∗∗∗P < 0.005, and ∗∗∗∗P < 0.001, NS means no significant difference (two-tailed independent t test).
The qPCR analysis of insulin receptor substrate (irs) genes showed that the expression levels of hepatic irs1 and irs2 were significantly increased in HCD group at 2nd, 4th, and 6th week, but only irs2 was significantly increased at 8th week, compared to those in NCD group (P < 0.05) (Figures 5(a) and 5(b)). Meanwhile, the immunostaining of hepatic P-AKTSer473 showed that the fluorescence intensity of P-AKTSer473 was significantly increased in HCD group at 2nd, 4th, and 6th week, but not 8th week, compared to those in NCD group (P < 0.05) (Figures 5(c) and 5(d)). Within HCD group, the fluorescence intensity of P-AKTSer473 was significantly decreased at 8th week, compared to those at 2nd, 4th, and 6th week (P < 0.05) (P < 0.05) (Figures 5(c) and 5(d)).
Figure 5.
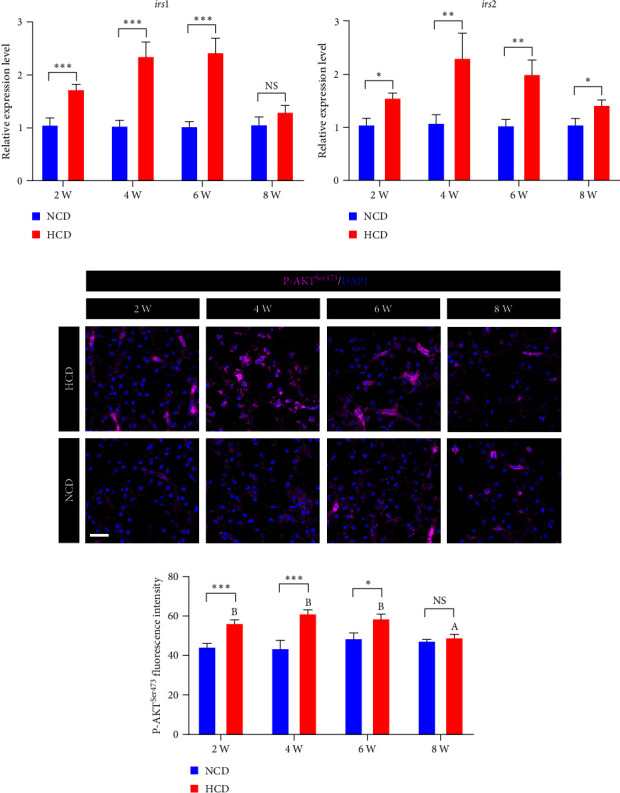
The expression and activation levels of hepatic insulin-AKT signal in gibel carp fed with HCD and NCD during 8 weeks. (a) Expression level of hepatic insulin receptor substrate 1-like (irs1, gene), (b) expression level of hepatic insulin receptor substrate 2-like (irs2, gene), (c) represented P-AKTSer473 (Magenta) staining images (scale bar = 30 μm), and (d) average fluorescence intensity of nuclear P-AKTSer473. Values are expressed as means ± SEMs, n = 6. Labeled means without a common letter differ among 2 W, 4 W, 6 W, and 8 W (uppercase for HCD), P < 0.05 (one-way ANOVA, Duncan's post hoc test). ∗, ∗∗, ∗∗∗, ∗∗∗∗different from NCD: ∗P < 0.05, ∗∗P < 0.01, ∗∗∗P < 0.005, and ∗∗∗∗P < 0.001, NS means no significant difference (two-tailed independent t test).
3.4. Expression and Activation of Hepatic G6P-ChREBP Signal
The immunostaining of hepatic ChREBP showed that the percentage of ChREBP positive hepatocytes and the fluorescence intensity of ChREBP were all significantly increased in HCD group at 2nd, 4th, 6th, and 8th week, compared to those in NCD group (P < 0.05) (Figure 6(a)–6(c)). Within HCD group, the percentage of ChREBP positive hepatocytes and the fluorescence intensity of ChREBP were significantly increased at 6th and 8th week, compared to those at 2nd and 4th week (P < 0.05); however, there was a further increase in the percentage of ChREBP positive hepatocytes at 8th week, compared to those at 6th week (P < 0.05) (Figure 6(a)–6(c)).Within NCD group, the percentage of ChREBP positive hepatocytes and the fluorescence intensity of ChREBP were also significantly increased at 6th and 8th week, compared to those at 2nd and 4th week (P < 0.05) (Figure 6(a)–6(c)). Besides, the expression levels of chrebp were all significantly increased in HCD group at 2nd, 4th, 6th, and 8th week, compared to those in NCD group (P < 0.05) (Figure 6(d)). Moreover, the hepatic G6P contents of HCD group were all significantly higher than those of NCD group at 2nd, 6th, 4th, and 8th week (P < 0.05) (Figure 6(e)). Within the HCD or NCD group, the hepatic G6P contents of 6th and 8th week displayed significantly increased compared to those of 2nd and 4th week (P < 0.05), respectively (Figure 6(e)).
Figure 6.
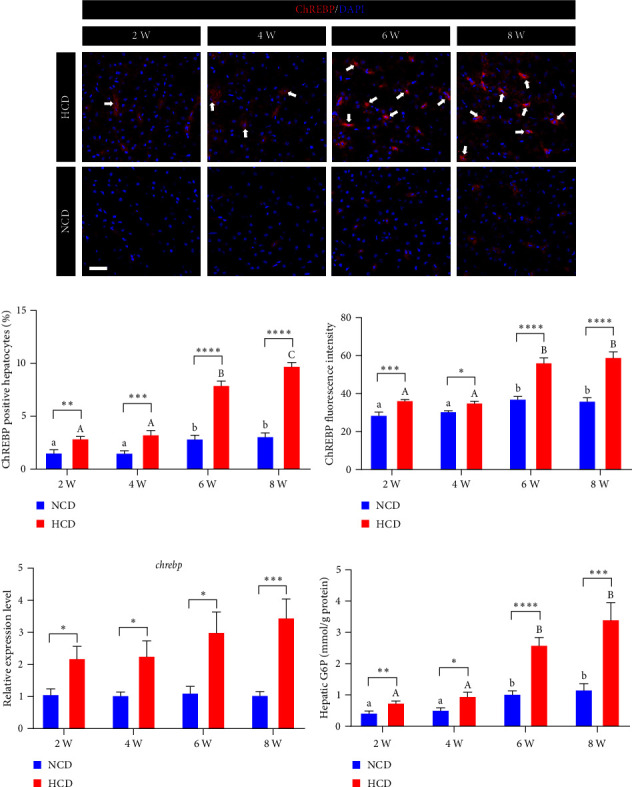
The expression and activation levels of hepatic G6P-ChREBP signal in gibel carp fed with HCD and NCD during 8 weeks. (a) Represented ChREBP (red) staining images (scale bar = 30 μm), (b) percentage of nuclear ChREBP positive hepatocytes, (c) average fluorescence intensity of nuclear ChREBP, (d) expression level of hepatic chrebp, and (e) hepatic glucose-6-phosphate (G6P) content. Values are expressed as means ± SEMs, n = 6. Labeled means without a common letter differ among 2 W, 4 W, 6 W, and 8 W (lowercase for NCD, uppercase for HCD), P < 0.05 (one-way ANOVA, Duncan's post hoc test). ∗, ∗∗, ∗∗∗, ∗∗∗∗Different from NCD: ∗P < 0.05, ∗∗P < 0.01, ∗∗∗P < 0.005, ∗∗∗∗P < 0.001, NS means no significant difference (two-tailed independent t test).
3.5. Expression of Hepatic Glucose Metabolism Genes
The qPCR analysis of glycolysis and glucose transport genes showed that the expression levels of hepatic glucokinase (gck), pyruvate kinase L/R (pklr), and glucose transporter 2 (glut2) were all significantly increased in HCD group at 4th, 6th, and 8th week, while 6-phosphofructokinase (6pfk) only significantly increased at 2nd week, compared to those in NCD group (P < 0.05) (Figure 7(a)–7(d)). However, the qPCR analysis of gluconeogenesis genes showed that the expression levels of hepatic g6pase (g6pase) and phosphoenolpyruvate carboxykinase (pepck) were significantly decreased in HCD group at 2nd week, while significantly increased in HCD group at 6th and 8th week, compared to those in NCD group (P < 0.05) (Figure 7(e)–7(f)).
Figure 7.
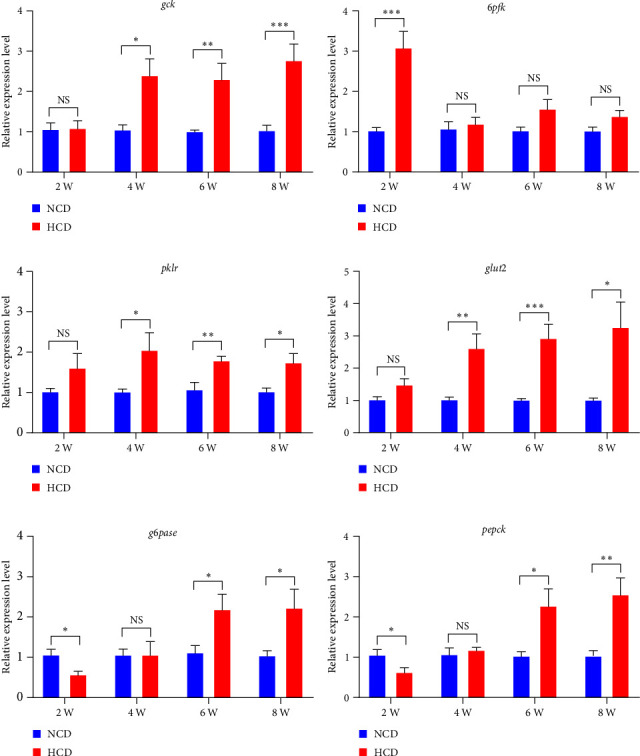
The expression levels of hepatic glycolysis and gluconeogenesis genes in gibel carp fed with HCD and NCD during 8 weeks. (a) Expression level of hepatic glucokinase (gck, gene), (b) expression level of hepatic 6-phosphofructokinase (6pfk, gene), (c) expression level of hepatic pyruvate kinase L/R (pklr, gene), (d) expression level of hepatic glucose transporter 2 (glut2, gene), (e) expression level of hepatic g6pase (g6pase, gene), and (f) expression level of hepatic phosphoenolpyruvate carboxykinase (pepck, gene). Values are expressed as means ± SEMs, n = 6. ∗, ∗∗, ∗∗∗Different from NCD: ∗P < 0.05, ∗∗P < 0.01, and ∗∗∗P < 0.005, NS means no significant difference (two-tailed independent t test).
4. Discussion
With the rapid development of artificial feeds, carbohydrates have become a basic dietary composition for aquatic animals. Fish have been thought to be inefficient in utilizing dietary carbohydrate, though carbohydrate is the most abundant energy-supplying nutrient in nature [1]. Interestingly, our recent study proposed that the conversion from glucose to lipids storage may be one of the efficient approaches for carbohydrate utilization in fish [3]. However, plenty of investigations demonstrated that excessive carbohydrate intake induced supraphysiological lipogenesis, that deteriorated to hepatic steatosis among aquaculture species [7, 8]. Therefore, depicting the comprehensive and precise regulation pathways of HCD-induced lipid deposition is of great significance for improving these negative effects caused by excessive dietary carbohydrate in fish. Accordingly, the present study investigated the sequential regulation manner of HCD-induced hepatic lipid deposition in gibel carp (C. gibelio). The results demonstrated that HCD promoted hepatic lipid deposition and lipogenesis mainly via insulin-SREBP1 in earlier stage (4th and 6th) and via G6P-ChREBP in later stage (6th and 8th) for gibel carp during the 8-week feeding experiment.
HCD induced lipid overdeposition from 6th week via supraphysiological lipogenesis in gibel carp. Excessive carbohydrate intake leads to metabolic disorders, that is particularly true for fish [1, 34]. Increasing lipid storage is one the main approaches to cope with the high carbohydrate challenge in fish [35]. In the present study, we found that the obvious HCD-induced hepatic lipid accumulation and hyperlipemia were occurred from the 4th to 8th week, while the serve fatty liver started from the 6th week under HCD treatment. The HCD-induced lipid accumulation in fish has been observed [6, 8, 9, 36]; however, here we demonstrated the dynamic changes of this process in gibel carp. We further showed the excessive lipid deposition mainly resulted from the supraphysiological lipogenesis but not decreased lipolysis in the liver of gibel carp. These results are similar to the previous studies in various of fish species [37–39]. In the present study, the lipolysis level even elevated at 6th and 8th week. The studies in largemouth bass (Micropterus salmoides) and zebrafish (Danio rerio) also indicated that the HCD-induced lipid accumulation was accompanied with activated lipolysis [10, 40]. However, studies in the yellow catfish (Pelteobagrus fulvidraco) and barramundi (Lates calcarifer) showed that dietary glucose and gelatinized wheat starch did not alter the lipolysis [6, 39]. We speculated this difference is due in part to the different carbohydrate sources and sampling time. Besides, studies in the largemouth bass and grass carp also demonstrated that HCD caused hepatic glycogen accumulation [3, 41], which is of interests for further investigations. In this study, we depicted the sequential process of HCD-induced hepatic lipid deposition and lipid metabolism in gibel carp.
Long-term HCD abated SREBP1 signal via insulin resistance in gibel carp. Insulin-SREBP1 is a key pathway in the motivation of lipogenesis in mammalians [15]. Plenty of studies showed that SREBP1 was also involved in the regulation of lipogenesis in aquaculture fish [37, 42], including gibel carp [18]. However, the activation and contribution mode of SREBP1 in HCD-induced lipogenesis have not been deciphered in the previous studies. In the present study, the expression and activation level of SREBP1 were elevated by HCD, those were consisted with previous studies in fish [10, 37, 42]. Notably, we found that the SREBP1 signal showed an obvious decrease from 6th week to 8th week, when we compared the dynamic changes of expression and activation level of SREBP1 within HCD group. This phenomenon has not been reported by previous studies. Persistent HCD usually leads to insulin resistance in mammalians [43, 44], which is characterized by fasting hyperglycemia, hyperinsulinemia, and insufficient phosphorylation of AKT [45]. Interestingly, the hepatic P-AKTser473 level became insensitive to HCD, while the hepatic gluconeogenesis, plasma insulin, and plasma glucose levels were still higher in HCD group at 8th week. These results indicated the insulin resistance was established in gibel carp after an 8-week HCD challenge. The similar results were also observed in rainbow trout (Oncorhynchus mykiss) [46]. Therefore, we proposed that the abated SREBP1 signal was due into the hepatic insulin resistance in this study. These results depicted the sequential regulating mode of SREBP1 in the HCD-induced lipogenesis of fish.
Although the SREBP1 signal was decreased by the insulin resistance at 8th week, the hepatic lipogenesis and lipid deposition did not show any mitigating trend in HCD group. In mammalians, the elevated lipogenesis and nonalcoholic fatty liver disease also developed in the setting of insulin resistance [47, 48]. This process is speculated to be promoted by ChREBP [45], as it shares the same target lipogenesis genes with SREBP1 [22]. ChREBP and SREBP-1c have been thought to be both critical pathways to signal lipogenesis, those play overlapping but distinct roles in coordinating postprandial lipogenic [22, 27]. A previous review had postulated that glucose-responsive elements could be expected in the upstream regions of the lipogenesis genes in fish [35]. Interestingly, here we found that the ChREBP signal was significantly elevated by HCD from 2nd to 8th week in gibel carp. The expression and activation levels of ChREBP were even further increased at 6th and 8th week in HCD group. The increased gene expression levels of chrebp were also observed in yellow catfish [6], grass crap [3], and amur sturgeon (Acipenser schrenckii) [28] with carbohydrate challenges. However, the present study demonstrated the sequential activation changes of ChREBP in fish fed with HCD for the first time. The activation of ChREBP is modulated by glucose-related metabolites, especially G6P [25]. The intracellular G6P content was maintained homeostasis to be a stable pool by glycolysis and gluconeogenesis. Here we found that the hepatic G6P content displayed a similar change mode with the ChREBP expression and activation during the 8-week HCD trial in gibel carp, which indicated that the accumulated hepatic G6P pool promoted ChREBP activation. Moreover, we also observed the expression levels of gck were increased more than 2.28 fold to those in NCD group from 4th to 8th week, while the expression levels of 6pfk showed no change between HCD and NCD groups. Thus, there was a fine-tuning in the glycolysis of gibel carp in HCD group. Since G6P is generated from glycolysis [49], produced by glucokinase and consumed by 6-phosphofructokinase, we speculate that this fine-tuning of glycolysis contributes to the accumulation of hepatic G6P. However, more solid evidences are required to confirm the relationships between G6P and this fine-tuning in further. Together, we revealed that the gradually amplified G6P-ChREBP signal dominated the later-stage hepatic lipogenesis and lipid accumulation in gibel carp fed with HCD.
In conclusion, the present study demonstrated that HCD induced dynamic hepatic lipid deposition via increasing lipogenesis, that was mainly promoted by insulin-SREBP1 in earlier stage (4th and 6th) while by G6P-ChREBP in later stage (6th and 8th) for gibel carp during an 8-week feeding experiment (Figure 8). Therefore, we identified a sequential regulation manner for the conversion from feed carbohydrate to body lipid in fish. These findings present sequential and comprehensive insights for understanding the HCD-induced hepatic steatosis in aquaculture animals. Based on our findings, we propose that the feed carbohydrate level could be relatively higher and supplement with the SREBP1-targeting additives in the early-culturing stage; while the feed carbohydrate level could be relatively lower and insulin resistance-improving additives should be considered in the late-culturing stage. Besides, we recommend a pulsed carbohydrate level to avoid the health damage caused by persistent HCD intake.
Figure 8.
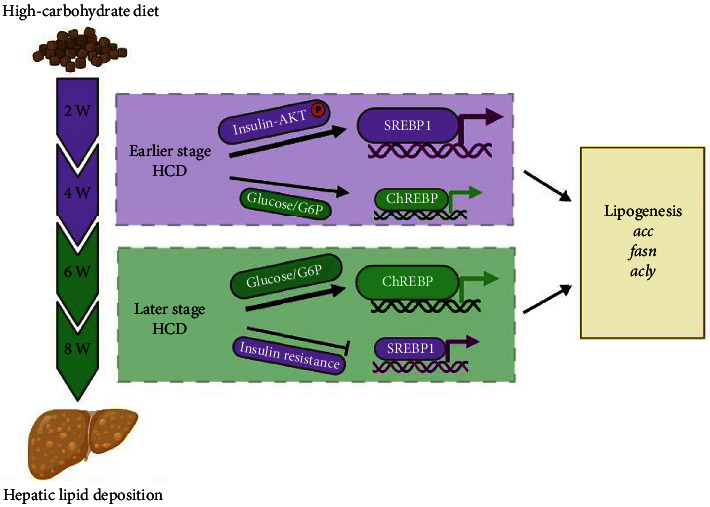
Proposed working model and regulation manner for ChREBP/SREBP1-mediated hepatic lipid deposition in gibel carp fed with HCD.
Acknowledgments
This work was supported by the earmarked fund for CARS (CARS-45), National Key R&D Program of China (2019YFD0900200 and 2018YFD0900400), National Natural Science Foundation of China (U21A20266, 31672670, 31972771, and 31972805), Fund Project in State Key Laboratory of Freshwater Ecology and Biotechnology (grant no. 2022FBZ03). The authors wish to thank Guanghan Nie, Guangxin Wang, and Fang [8] for their excellent assistance in these studies.
Contributor Information
Shouqi Xie, Email: sqxie@ihb.ac.cn.
Dong Han, Email: hand21cn@ihb.ac.cn.
Data Availability
The authors declare that all data supporting the findings of this study are available within the article, the source data provided with this paper.
Ethical Approval
Animal experiments were approved by Animal Care and Use Committee of Institute of Hydrobiology, Chinese Academy of Sciences (IHB, CAS, Protocol No. 2016–018).
Conflicts of Interest
The authors declare that they have no conflicts of interest.
Authors' Contributions
S.X and D.H contributed in conceptualization:. Y.G., L.X., Y.L., and Q.L contributed in investigation. H.L. and Y.Y contributed in methodology. Y.G. and D.H contributed in writing. J.J., Z.Z., and X.Z contributed in writing, reviewing, and editing. All the authors read and approved the final manuscript.
References
- 1.Kamalam B. S., Medale F., Panserat S. Utilisation of dietary carbohydrates in farmed fishes: new insights on influencing factors, biological limitations and future strategies. Aquaculture . 2017;467:3–27. doi: 10.1016/j.aquaculture.2016.02.007. [DOI] [Google Scholar]
- 2.Taj S., Li X., Zhou Q., et al. Insulin-mediated glycemic responses and glucose homeostasis in black sea bream (Acanthopagrus schlegelii) fed different carbohydrate sources. Aquaculture . 2021;540 doi: 10.1016/j.aquaculture.2021.736726.736726 [DOI] [Google Scholar]
- 3.Su J., Mei L., Xi L., et al. Responses of glycolysis, glycogen accumulation and glucose-induced lipogenesis in grass carp and Chinese longsnout catfish fed high-carbohydrate diet. Aquaculture . 2021;533 doi: 10.1016/j.aquaculture.2020.736146.736146 [DOI] [Google Scholar]
- 4.Kostyniuk D. J., Marandel L., Jubouri M., et al. Profiling the rainbow trout hepatic miRNAome under diet-induced hyperglycemia. Physiological Genomics . 2019;51(9):411–431. doi: 10.1152/physiolgenomics.00032.2019. [DOI] [PMC free article] [PubMed] [Google Scholar]
- 5.Su J., Gong Y., Mei L., et al. The characteristics of glucose homoeostasis in grass carp and Chinese longsnout catfish after oral starch administration: a comparative study between herbivorous and carnivorous species of fish. British Journal of Nutrition . 2020;123(6):627–641. doi: 10.1017/S0007114519003234. [DOI] [PubMed] [Google Scholar]
- 6.Zhao T., Yang S.-B., Chen G.-H., Xu Y.-H., Xu Y.-C., Luo Z. Dietary glucose increases glucose absorption and lipid deposition via SGLT1/2 signaling and acetylated ChREBP in the intestine and isolated intestinal epithelial cells of yellow catfish. The Journal of nutrition . 2020;150(7):1790–1798. doi: 10.1093/jn/nxaa125. [DOI] [PubMed] [Google Scholar]
- 7.Zhao L., Liao L., Tang X., et al. High-carbohydrate diet altered conversion of metabolites, and deteriorated health in juvenile largemouth bass. Aquaculture . 2022;549 doi: 10.1016/j.aquaculture.2021.737816.737816 [DOI] [Google Scholar]
- 8.Zhou W.-H., Wu C.-C., Limbu S. M., et al. More simple more worse: Simple carbohydrate diets cause alterations in glucose and lipid metabolism in Nile tilapia (Oreochromis niloticus) Aquaculture . 2022;550 doi: 10.1016/j.aquaculture.2021.737857.737857 [DOI] [Google Scholar]
- 9.Lin Y., Dengu J., Miao L., et al. Effects of dietary supplementary leucine in a wheat meal-rich diet on the growth performance and immunity of juvenile gibel carp (Carassius auratus gibelio var. CAS III) Aquaculture Research . 2021;52(4):1501–1512. doi: 10.1111/are.15003. [DOI] [Google Scholar]
- 10.Gong Y., Lu Q., Liu Y., et al. Dietary berberine alleviates high carbohydrate diet-induced intestinal damages and improves lipid metabolism in largemouth bass (Micropterus salmoides) Frontiers in Nutrition . 2022;9 doi: 10.3389/fnut.2022.1010859.1010859 [DOI] [PMC free article] [PubMed] [Google Scholar]
- 11.Zhao L., Liang J., Chen F., et al. High carbohydrate diet induced endoplasmic reticulum stress and oxidative stress, promoted inflammation and apoptosis, impaired intestinal barrier of juvenile largemouth bass (Micropterus salmoides) Fish & Shellfish Immunology . 2021;119:308–317. doi: 10.1016/j.fsi.2021.10.019. [DOI] [PubMed] [Google Scholar]
- 12.Yu H., Zhang L., Chen P., et al. Dietary bile acids enhance growth, and alleviate hepatic fibrosis induced by a high starch diet via AKT/FOXO1 and cAMP/AMPK/SREBP1 pathway in Micropterus salmoides. Frontiers in Physiology . 2019;10 doi: 10.3389/fphys.2019.01430.1430 [DOI] [PMC free article] [PubMed] [Google Scholar]
- 13.He C., Jia X., Zhang L., et al. Dietary berberine can ameliorate glucose metabolism disorder of Megalobrama amblycephala exposed to a high-carbohydrate diet. Fish Physiology and Biochemistry . 2021;47:499–513. doi: 10.1007/s10695-021-00927-8. [DOI] [PubMed] [Google Scholar]
- 14.Li X., Chen F., Huang D., et al. Interactions of dietary carbohydrate and vitamin D3 on growth performance, insulin signaling pathway and glucose metabolism in juvenile abalone Haliotis discus hannai. Aquaculture . 2021;542 doi: 10.1016/j.aquaculture.2021.736908.736908 [DOI] [Google Scholar]
- 15.DeBose-Boyd R. A., Ye J. SREBPs in lipid metabolism, insulin signaling, and beyond. Trends in Biochemical Sciences . 2018;43(5):358–368. doi: 10.1016/j.tibs.2018.01.005. [DOI] [PMC free article] [PubMed] [Google Scholar]
- 16.Shimomura I., Bashmakov Y., Ikemoto S., Horton J. D., Brown M. S., Goldstein J. L. Insulin selectively increases SREBP-1c mRNA in the livers of rats with streptozotocin-induced diabetes. Proceedings of the National Academy of Sciences . 1999;96(24):13656–13661. doi: 10.1073/pnas.96.24.13656. [DOI] [PMC free article] [PubMed] [Google Scholar]
- 17.Moore M. C., Cherrington A. D., Wasserman D. H. Regulation of hepatic and peripheral glucose disposal. Best Practice & Research Clinical Endocrinology & Metabolism . 2003;17(3):343–364. doi: 10.1016/s1521-690x(03)00036-8. [DOI] [PubMed] [Google Scholar]
- 18.Jin J., Zhu X., Han D., Yang Y., Liu H., Xie S. Different regulation of insulin on glucose and lipid metabolism in 2 strains of gibel carp. General and Comparative Endocrinology . 2017;246:363–371. doi: 10.1016/j.ygcen.2017.01.012. [DOI] [PubMed] [Google Scholar]
- 19.Minghetti M., Leaver M. J., Tocher D. R. Transcriptional control mechanisms of genes of lipid and fatty acid metabolism in the Atlantic salmon (Salmo salar L.) established cell line, SHK-1. Biochimica et Biophysica Acta (BBA) - Molecular and Cell Biology of Lipids . 2011;1811(3):194–202. doi: 10.1016/j.bbalip.2010.12.008. [DOI] [PubMed] [Google Scholar]
- 20.Haas J. T., Miao J., Chanda D., et al. Hepatic insulin signaling is required for obesity-dependent expression of SREBP-1c mRNA but not for feeding-dependent expression. Cell Metabolism . 2012;15:873–884. doi: 10.1016/j.cmet.2012.05.002. [DOI] [PMC free article] [PubMed] [Google Scholar]
- 21.Saltiel A. R., Ronald Kahn C. Insulin signalling and the regulation of glucose and lipid metabolism. Nature . 2001;414:799–806. doi: 10.1038/414799a. [DOI] [PubMed] [Google Scholar]
- 22.Uyeda K., Repa J. J. Carbohydrate response element binding protein, ChREBP, a transcription factor coupling hepatic glucose utilization and lipid synthesis. Cell Metabolism . 2006;4(2):107–110. doi: 10.1016/j.cmet.2006.06.008. [DOI] [PubMed] [Google Scholar]
- 23.Yamashita H., Takenoshita M., Sakurai M., et al. A glucose-responsive transcription factor that regulates carbohydrate metabolism in the liver. Proceedings of the National Academy of Sciences . 2001;98(16):9116–9121. doi: 10.1073/pnas.161284298. [DOI] [PMC free article] [PubMed] [Google Scholar]
- 24.Filhoulaud G., Guilmeau S., Dentin R., Girard J., Postic C. Novel insights into ChREBP regulation and function. Trends in Endocrinology and Metabolism: TEM . 2013;24(5):257–268. doi: 10.1016/j.tem.2013.01.003. [DOI] [PubMed] [Google Scholar]
- 25.Li M. V., Chen W., Harmancey R. N., et al. Glucose-6-phosphate mediates activation of the carbohydrate responsive binding protein (ChREBP) Biochemical and Biophysical Research Communications . 2010;395(3):395–400. doi: 10.1016/j.bbrc.2010.04.028. [DOI] [PMC free article] [PubMed] [Google Scholar]
- 26.Arden C., Tudhope S. J., Petrie J. L., et al. Fructose 2,6-bisphosphate is essential for glucose-regulated gene transcription of glucose-6-phosphatase and other ChREBP target genes in hepatocytes. Biochemical Journal . 2012;443(1):111–123. doi: 10.1042/BJ20111280. [DOI] [PubMed] [Google Scholar]
- 27.Linden A. G., Li S., Choi H. Y., et al. Interplay between ChREBP and SREBP-1c coordinates postprandial glycolysis and lipogenesis in livers of mice. Journal of Lipid Research . 2018;59(3):475–487. doi: 10.1194/jlr.M081836. [DOI] [PMC free article] [PubMed] [Google Scholar]
- 28.Zhang X., Zhu Y., Wei H., et al. Effects of low-protein high-starch diet on growth performance, glucose and lipid metabolism of Amur sturgeon (Acipenser schrenckii) during feeding and starvation phases. Aquaculture . 2023;562 doi: 10.1016/j.aquaculture.2022.738739.738739 [DOI] [Google Scholar]
- 29.Fishery Bureau, Ministry of Agriculture, People’s Republic of China. China Fishery Statistical Yearbook 2022 . Beijing: China Agriculture Press; 2022. [Google Scholar]
- 30.Li H., Xu W., Jin J., et al. Effects of dietary carbohydrate and lipid concentrations on growth performance, feed utilization, glucose, and lipid metabolism in two strains of gibel carp. Frontiers in Veterinary Science . 2019;6 doi: 10.3389/fvets.2019.00165.165 [DOI] [PMC free article] [PubMed] [Google Scholar]
- 31.Gong Y., Yang F., Hu J., et al. Effects of dietary yeast hydrolysate on the growth, antioxidant response, immune response and disease resistance of largemouth bass (Micropterus salmoides) Fish & shellfish immunology . 2019;94:548–557. doi: 10.1016/j.fsi.2019.09.044. [DOI] [PubMed] [Google Scholar]
- 32.Vandesompele J., De Preter K., Pattyn F., et al. Accurate normalization of real-time quantitative RT–PCR data by geometric averaging of multiple internal control genes. Genome Biology . 2002;3 doi: 10.1186/gb-2002-3-7-research0034.research0034 [DOI] [PMC free article] [PubMed] [Google Scholar]
- 33.Yang B., Maddison L. A., Zaborska K. E., et al. RIPK3-mediated inflammation is a conserved β cell response to ER stress. Science Advances . 2020;6(51) doi: 10.1126/sciadv.abd7272.eabd7272 [DOI] [PMC free article] [PubMed] [Google Scholar]
- 34.Basaranoglu M., Basaranoglu G., Bugianesi E. Carbohydrate intake and nonalcoholic fatty liver disease: fructose as a weapon of mass destruction. Hepatobiliary Surgery and Nutrition . 2015;4(2):109–116. doi: 10.3978/j.issn.2304-3881.2014.11.05. [DOI] [PMC free article] [PubMed] [Google Scholar]
- 35.Hemre G.-I., Mommsen T. P., Krogdahl Å. Carbohydrates in fish nutrition: effects on growth, glucose metabolism and hepatic enzymes. Aquaculture Nutrition . 2002;8(3):175–194. doi: 10.1046/j.1365-2095.2002.00200.x. [DOI] [Google Scholar]
- 36.Asemani M., Sepahdari A., Pourkazemi M., Hafezieh M., Aliyu-Paiko M., Dadgar S. Effect of different sources and forms of dietary carbohydrates on growth performance, body indices and lipogenesis activity of striped catfish Pangasianodon hypophthalmus fingerlings. Aquaculture Nutrition . 2019;25(6):1399–1409. doi: 10.1111/anu.12960. [DOI] [Google Scholar]
- 37.Jiang G.-Z., Shi H.-J., Xu C., Zhang D.-D., Liu W.-B., Li X.-F. Glucose-6-phosphate dehydrogenase in blunt snout bream Megalobrama amblycephala: molecular characterization, tissue distribution, and the responsiveness to dietary carbohydrate levels. Fish Physiology and Biochemistry . 2019;45:401–415. doi: 10.1007/s10695-018-0572-3. [DOI] [PubMed] [Google Scholar]
- 38.Rasal K. D., Iquebal M. A., Dixit S., et al. Revealing alteration in the hepatic glucose metabolism of genetically improved carp, Jayanti Rohu Labeo rohita fed a high carbohydrate diet using transcriptome sequencing. International Journal of Molecular Sciences . 2020;21(21) doi: 10.3390/ijms21218180.8180 [DOI] [PMC free article] [PubMed] [Google Scholar]
- 39.Wade N. M., Trenkner L. H., Viegas I., et al. Dietary starch promotes hepatic lipogenesis in barramundi (Lates calcarifer) The British Journal of Nutrition . 2020;124(4):363–373. doi: 10.1017/S0007114520001051. [DOI] [PubMed] [Google Scholar]
- 40.Yang B.-Y., Zhai G., Gong Y.-L., et al. Different physiological roles of insulin receptors in mediating nutrient metabolism in zebrafish. American Journal of Physiology. Endocrinology and Metabolism . 2018;315(1):E38–E51. doi: 10.1152/ajpendo.00227.2017. [DOI] [PubMed] [Google Scholar]
- 41.Li S., Sang C., Wang A., Zhang J., Chen N. Effects of dietary carbohydrate sources on growth performance, glycogen accumulation, insulin signaling pathway and hepatic glucose metabolism in largemouth bass, Micropterus salmoides. Aquaculture . 2019;513734391 [Google Scholar]
- 42.Rashidpour A., Silva-Marrero J. I., Seguí L., Baanante I. V., Metón I. Metformin counteracts glucose-dependent lipogenesis and impairs transdeamination in the liver of gilthead sea bream (Sparus aurata) American Journal of Physiology. Regulatory, Integrative and Comparative Physiology . 2019;316(3):R265–R273. doi: 10.1152/ajpregu.00216.2018. [DOI] [PubMed] [Google Scholar]
- 43.Softic S., Stanhope K. L., Boucher J., et al. Fructose and hepatic insulin resistance. Critical Reviews in Clinical Laboratory Sciences . 2020;57(5):308–322. doi: 10.1080/10408363.2019.1711360. [DOI] [PMC free article] [PubMed] [Google Scholar]
- 44.McCullough D., Harrison T., Boddy L. M., et al. The effect of dietary carbohydrate and fat manipulation on the metabolome and markers of glucose and insulin metabolism: a randomised parallel trial. Nutrients . 2022;14(18) doi: 10.3390/nu14183691.3691 [DOI] [PMC free article] [PubMed] [Google Scholar]
- 45.Petersen M. C., Shulman G. I. Mechanisms of insulin action and insulin resistance. Physiological Reviews . 2018;98(4):2133–2223. doi: 10.1152/physrev.00063.2017. [DOI] [PMC free article] [PubMed] [Google Scholar]
- 46.Seiliez I., Panserat S., Lansard M., et al. Dietary carbohydrate-to-protein ratio affects TOR signaling and metabolism-related gene expression in the liver and muscle of rainbow trout after a single meal. American Journal of Physiology-Regulatory, Integrative and Comparative Physiology . 2011;300(3):R733–R743. doi: 10.1152/ajpregu.00579.2010. [DOI] [PubMed] [Google Scholar]
- 47.Marchesini G., Moscatiello S., Di Domizio S., Forlani G. Obesity-associated liver disease. The Journal of Clinical Endocrinology and Metabolism . 2008;93(11 Supplement 1):S74–S80. doi: 10.1210/jc.2008-1399. [DOI] [PubMed] [Google Scholar]
- 48.Samuel V. T., Petersen K. F., Shulman G. I. Lipid-induced insulin resistance: unravelling the mechanism. The Lancet . 2010;375(9733):2267–2277. doi: 10.1016/S0140-6736(10)60408-4. [DOI] [PMC free article] [PubMed] [Google Scholar]
- 49.Adeva-Andany M. M., Pérez-Felpete N., Fernández-Fernández C., Donapetry-García C., Pazos-García C. Liver glucose metabolism in humans. Bioscience Reports . 2016;36(6) doi: 10.1042/BSR20160385.e00416 [DOI] [PMC free article] [PubMed] [Google Scholar]
Associated Data
This section collects any data citations, data availability statements, or supplementary materials included in this article.
Data Availability Statement
The authors declare that all data supporting the findings of this study are available within the article, the source data provided with this paper.


