

Abstract
Aims
In this study, we estimated the 30 day all‐cause and heart failure‐specific readmission rates, predictors, mortality, and hospitalization costs in patients with obstructive sleep apnoea admitted with acute decompensated heart failure with reduced ejection fraction.
Methods and results
This is a retrospective cohort study using the Agency of Healthcare Research and Quality's National Readmission Database for the year 2019. The primary outcome was the 30 day all‐cause hospital readmission rate. The secondary outcomes were (i) in‐hospital mortality rate for index admissions; (ii) 30 day mortality rate for index hospitalizations; (iii) the five most common principal diagnosis for readmission; (iv) readmission in‐hospital mortality rate; (v) length of hospital stay; (vi) independent risk factors for readmission; and (vii) hospitalization costs. We identified 6908 hospitalizations that met our study definition. The mean patient age was 62.8 years, and women comprised only 27.6% of patients. The 30 day all‐cause readmission rate was 23.4%. 48.9% of readmissions were due to decompensated heart failure. The in‐hospital mortality rate during readmissions was significantly higher than that of the index admission (5.6% vs. 2.4%; P < 0.05). The mean length of stay for patients during index admissions was 6.5 days (6.06–7.02), while during readmissions, it was 8.5 days (7.4–9.6; P < 0.05). The mean total hospitalization charges at index admissions were $78 438 (68 053–88 824), while during readmissions, they were higher at $124 282 (90 906–157 659; P < 0.05). The mean total cost of hospitalization during index admissions was $20 535 (18 311–22 758), while at readmissions, it was higher at $29 954 (24 041–35 867; P < 0.05). The total hospital charges for all 30 day readmissions were $195 million, and total hospital costs was $46.9 million. The variables found to be associated with increased rate of readmissions were patients with Medicaid insurance, higher Charlson co‐morbidity Index, and longer length of stay. The variables associated with lower rate of readmissions were prior percutaneous coronary intervention and patients with private insurance.
Conclusions
In patients with obstructive sleep apnoea admitted with heart failure with reduced ejection fraction, we found a substantial all‐cause readmission rate of 23.4% with heart failure readmission constituting about 48.9% of readmissions. Readmissions were associated with higher mortality and resource use.
Keywords: Heart failure with reduced ejection fraction, Hospitalization cost, Obstructive sleep apnoea, Readmission rate
Introduction
It has been estimated that 13.3% of all Medicare patients have a preventable hospital readmission within 30 days of discharge. Therefore, decreasing the rate of 30 day readmissions can reduce healthcare costs drastically. This was the motive for establishing the Hospital Readmissions Reduction Program under the 2010 Patient Protection and Affordable Care Act. 1 Under this programme, the excess readmission ratios (predicted/expected readmission rate) are evaluated for acute myocardial infarction, chronic obstructive pulmonary disease, heart failure, pneumonia, coronary artery bypass graft surgery, and elective primary total hip arthroplasty and/or total knee arthroplasty. Heart failure is the most common reason for hospitalization in patients over 65 years of age, and nearly one in four patients is readmitted within 30 days. 2 , 3 The prevalence of heart failure is projected to be >8 million in the United States by 2030, and total costs are estimated to increase from $31 billion annually in 2012 to $70 billion by 2030. 4
Obstructive sleep apnoea (OSA) is highly prevalent in patients with heart failure. 5 OSA is characterized by repeated partial or complete collapse of the upper airway during sleep. 6 In patients with heart failure with reduced ejection fraction (HFrEF), OSA has been associated with increased post‐discharge mortality. 7 The effect of OSA on the 30 day readmission rates, mortality rate, and hospitalization costs in patients with HFrEF has not been explored previously. In this study, we estimated the 30 day all‐cause and heart failure‐specific readmission rates in patients with OSA and HFrEF. We then identified the independent risk factors associated with readmission. The 30 day mortality rate for index admissions, in‐hospital mortality rate, length of stay, hospitalization charges, and hospitalization costs were also estimated.
Methods
This is a retrospective cohort study using the Agency of Healthcare Research and Quality's National Readmission Database (NRD) for the year 2019. The NRD is the largest publicly available all‐payer inpatient health care readmission database in the United States. It is designed as a stratified probability sample to be representative of all non‐federal acute care inpatient hospitalizations nationwide. The NRD contains both patient and hospital level discharge information. Discharge diagnoses and procedures are collected for each patient using the International Classification of Diseases, Tenth Revision, Clinical Modification (ICD10‐CM) codes (Table S1 ).
Patients with a principal diagnosis of heart failure with reduced ejection fraction and a secondary diagnosis of obstructive sleep apnoea were included in the study. Patients were excluded if they were younger than 18 years of age or if the admission was elective. Because the NRD captures admissions purely on a calendar year basis (i.e. 1 January to 31 December) without a link to the previous or following year, index hospitalization discharges occurring in the month of December were excluded. Due to the de‐identified nature of the dataset, this study was exempted from institutional review board approval.
The primary outcome was 30 day all‐cause hospital readmission. Each patient included in the NRD is assigned a unique identification number. This number can be used to identify all admissions within the state for each patient during a calendar year. A readmission was defined as any non‐traumatic admission for any principal diagnosis within 30 days of the index admission. If patients had multiple readmissions within 30 days of discharge, only the first readmission was counted. Patients who died during an index admission were excluded from the denominator.
The secondary outcomes analysed were (i) in‐hospital mortality rate for index admissions; (ii) 30 day mortality rate for index hospitalizations; (iii) the five most common principal diagnosis for readmission; (iv) readmission in‐hospital mortality rate; (v) length of hospital stay; (vi) independent risk factors for readmission; and (vii) hospitalization costs.
Statistical analysis was conducted using STATA, version 17.0 (StataCorp, College Station, TX). NRD is based on a complex sampling design that includes stratification, clustering, and weighting. Weighting of patient level observations was implemented to obtain national level estimates. Survival analysis was performed with time from discharge to readmission as the time variable and death as failure. Patients who did not experience failures were censored at day 30 after discharge. Variables with <10 cases were excluded from the analysis. Univariable Cox regression analysis was used to calculate unadjusted hazard ratios for the primary and secondary outcomes. Subsequently, multivariable Cox regression analysis was used to adjust the results for potential confounders. Multivariable regression models were built by including all confounders that were significantly associated with the primary outcome during univariable Cox regression analysis with a cut‐off P‐value of 0.2. Proportions were compared using the Fisher's exact test, and continuous variables were compared using Student's t test. All P‐values were two‐sided, with 0.05 set as threshold for statistical significance. The Healthcare Cost and Utilization Project provides data that contain hospital‐specific cost‐to‐charge ratios based on all‐payer inpatient cost. This cost information was obtained from the hospital accounting reports collected by the Centers for Medicare and Medicaid services. Using this information, total hospital costs were calculated by multiplying total hospital charges by the corresponding cost‐to‐charge ratio.
To test whether missing data could introduce bias into the study, we made the assumption that data were not missing at random and applied the multivariate imputation by chained equations method estimated from sequential multivariable models with fully conditional specifications. Results with and without imputations were not meaningfully different. Hence, results without imputation are reported.
Results
Baseline characteristics
We identified 6908 hospitalizations that met our study definition. The study inclusion process is depicted in a flow diagram (Figure 1 ). Baseline patient characteristics are shown in Table 1 . The mean patient age was 62.8 years, and women comprised only 27.6% of patients. Most patients were insured with Medicare (60.4%). About 84.3% of patients had a Charlson co‐morbidity index of 3 or more. Only 15.3% of patients had a prior myocardial infarction. More than a third of patients had obesity, atrial fibrillation/flutter, chronic kidney disease (CKD), hyperlipidaemia, chronic obstructive pulmonary disease, and diabetes. More than 50% of the studied patients had household incomes below the 50th percentile (median).
Figure 1.

Patient selection flow diagram.
Table 1.
Patient characteristics
| Variable | |
|---|---|
| Age, mean in years | 62.8 (62.16–63.5) |
| Female, n (%) | 1865 (27.6) |
| Hypertension, n (%) | 1934 (28.9) |
| Anaemia, n (%) | 553 (8.7) |
| Obesity, n (%) | 2832 (41.9) |
| Atrial fibrillation/flutter, n (%) | 2625 (38.2) |
| Valvular heart disease, n (%) | 2141 (31.07) |
| Prior MI, n (%) | 1036 (15.3) |
| Prior PCI, n (%) | 760 (11.8) |
| Prior CABG, n (%) | 829 (12) |
| PCI, n (%) | 55 (0.8) |
| NSTEMI, n (%) | 104 (1.6) |
| STEMI, n (%) | 1382 (0.2) |
| Cardiogenic shock, n (%) | 483 (7.8) |
| Mechanical Ventilation, n (%) | 10 (0.15) |
| Chronic kidney disease, n (%) | 2694 (39.4) |
| Dialysis dependence, n (%) | 110 (1.6) |
| Chronic liver disease, n (%) | 414 (6.08) |
| Hyperlipidaemia, n (%) | 2763 (40.1) |
| Chronic obstructive pulmonary disease, n (%) | 2970 (43.7) |
| Dementia, n (%) | 207 (3.4) |
| Diabetes, n (%) | 2970 (43.5) |
| Discharge to rehab facility, n (%) | 39 (0.56) |
| Charlson co‐morbidity index, n (%) | |
| 0 | None |
| 1 | None |
| 2 | 829 (15.7) |
| 3 or more | 4642 (84.3) |
| Insurance, n (%) | |
| Medicare | 4032 (60.4) |
| Medicaid | 1075 (16.7) |
| Private | 1277 (19.4) |
| Uninsured | 202 (3.3) |
| Teaching hospital, n (%) | 4973 (72.5) |
| Hospital size, n (%) | |
| Small (1–249) | 1243 (18.8) |
| Medium (250–449) | 1520 (22.2) |
| Large (450 or more) | 4006 (58.8) |
| Income quartile, n (%) | |
| 1 | 1981 (29.4) |
| 2 | 1912 (28.9) |
| 3 | 1640 (24.7) |
| 4 | 1093 (16.8) |
CABG, coronary artery bypass graft; MI, myocardial infarction; NSTEMI, non ST elevation myocardial infarction; PCI, percutaneous coronary intervention; STEMI, ST elevation myocardial infarction.
30 day all‐cause readmission and most common reasons for readmission
There were 6739 patients who were discharged alive. About 1574 patients were readmitted within 30 days. The 30 day all‐cause readmission rate was 23.4%. The Kaplan–Meier curve for all‐cause readmissions is shown in Figure 2 . The five most common causes for readmission were (i) hypertensive heart disease and CKD with heart failure and stage 1 through 4 CKD or unspecified CKD (ICD‐10: I13.0; 17.7%); (ii) acute on chronic systolic (congestive) heart failure (ICD‐10: I50.23; 13.3%); (iii) hypertensive heart disease with heart failure (ICD‐10: I11.0; 9.2%); (iv) acute on chronic combined systolic and diastolic heart failure (ICD‐10: I50.43; 4.7%); and (v) sepsis (ICD‐10: A41.9; 4%). 48.9% of readmissions were due to heart failure.
Figure 2.
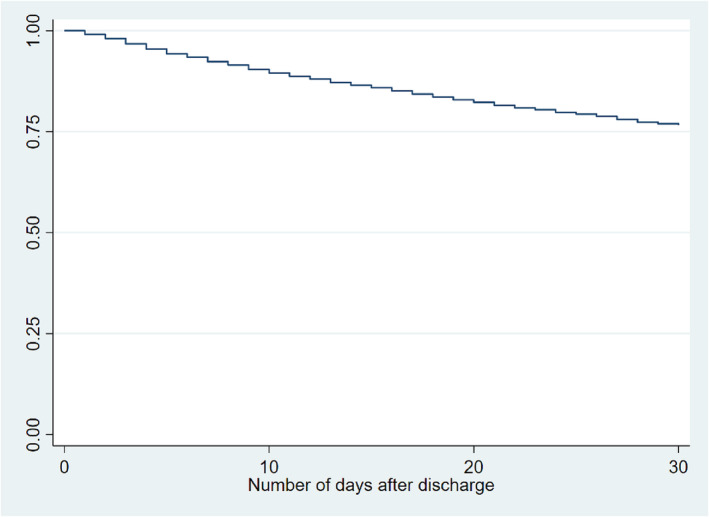
Kaplan–Meier curve for 30 day all‐cause readmissions.
In‐hospital and 30 day mortality rates among index admissions
There were 168 patients who died during the index hospitalization and an additional 78 patients who died within 30 days of discharge. The in‐hospital and 30 day mortality rates were 2.4% and 6.1%, respectively.
In‐hospital mortality among readmitted patients
Of the 1574 patients who were readmitted within 30 days, 88 died during the second hospitalization with a resulting in‐hospital mortality rate of 5.6%. The in‐hospital mortality rate during readmissions was significantly higher than that during the index admission (5.6% vs. 2.4%; P < 0.05).
Length of stay and hospitalization costs
The mean length of stay for patients during index admissions was 6.5 days (6.06–7.02), while during readmissions, it was 8.5 days (7.4–9.6; P < 0.05). The mean total hospitalization charges at index admissions were $78 438 (68 053–88 824), while during readmissions, they were higher at $124 282 (90 906–157 659; P < 0.05). The mean total cost of hospitalization during index admissions was $20 535 (18 311–22 758), while at readmissions, it was higher at $29 954 (24 041–35 867; P < 0.05). The total length of hospital stays for all patients readmitted within 30 days was 13 404 days. The total hospital charges calculated for all 30 day readmissions were $195 million, and the total hospital costs were $46.9 million.
Independent predictors of 30 day readmissions
The strength of association with readmission was tested individually for all variables and is shown in Table 1 . Using Cox regression as described in the Methods section. The final model is depicted in Table 2 .
Table 2.
Independent predictors of 30 day readmissions
| Variable | Adjusted hazard ratios (95% confidence interval) | P‐value |
|---|---|---|
| Obesity | 0.89 (0.77–1.03) | 0.14 |
| AFib/Flutter | 1.06 (0.92–1.23) | 0.38 |
| Valvular disease | 1.07 (0.93–1.24) | 0.30 |
| Prior MI | 1.18 (0.95–1.47) | 0.12 |
| Cardiogenic shock | 1.04 (0.77–1.40) | 0.75 |
| Prior PCI | 0.64 (0.49–0.85) | <0.05 |
| Charlson co‐morbidity index | 1.06 (1.0–1.12) | <0.05 |
| Insurance provider | ||
| Medicare | Reference | Reference |
| Medicaid | 1.25 (1.05–1.49) | <0.05 |
| Private | 0.67 (0.54–0.84) | <0.05 |
| Uninsured | 0.58 (0.33–1.02) | 0.06 |
| Hospital bed size | ||
| Small | Reference | Reference |
| Medium | 0.85 (0.67–1.07) | 0.17 |
| Large | 0.96 (0.80–1.15) | 0.67 |
| Income quartile (low to high) | ||
| 1 | Reference | Reference |
| 2 | 0.95 (0.77–1.18) | 0.69 |
| 3 | 0.87 (0.70–1.07) | 0.21 |
| 4 | 0.85 (0.68–1.07) | 0.18 |
| Diabetes | 1.02 (0.84–1.24) | 0.80 |
| CKD | 0.78 (0.87–1.36) | 0.43 |
| COPD | 1.01 (0.85–1.2) | 0.84 |
| Dementia | 1.13 (0.76–1.66) | 0.53 |
| Hyperlipidaemia | 0.89 (0.76–1.04) | 0.17 |
| Discharge to rehab facility | 1.57 (0.74–3.33) | 0.23 |
| Length of stay | 1.01 (1.00–1.02) | <0.05 |
CKD, chronic kidney disease; COPD, chronic obstructive pulmonary disease; MI, myocardial infarction; PCI, percutaneous coronary intervention.
The variables found to be associated with an increased rate of readmissions were patients with Medicaid insurance, higher Charlson co‐morbidity index, and longer length of stay. Among the readmitted patients, 20.4% (17.5–23.7) had Medicaid, and 66.2% (62.3–69.9) had a length of stay 4 days or greater at index hospitalization. The variables associated with lower rate of readmissions were prior percutaneous coronary intervention (PCI) and patients with private insurance. The remaining variables had no effect on 30 day readmission rates.
Discussion
OSA has been shown to both cause/and worsen heart failure by the following mechanisms: increased sympathetic activation leading to increase in blood pressure and heart rate, intermittent periods of high negative intrathoracic pressure increasing cardiac preload, abrupt increases in LV transmural pressure causing increased myocardial oxygen demand, and increased activation of the renin–angiotensin–aldosterone system. Gottlieb et al. in the Sleep Heart Health study comprising a rather large sample of community dwelling patients showed an increased rate of incident heart failure in those with OSA. 8 OSA also potentiates inflammation, oxidative stress, insulin resistance, endothelial dysfunction, and autonomic dysfunction. 9 , 10 , 11 OSA has also been associated with atrial fibrillation, sinus pauses, coronary artery disease, and sudden cardiac death. 12 , 13 , 14 , 15 Additionally, patients with OSA often have other concomitant co‐morbidities including hypertension, diabetes, and obesity that may contribute to the development and progression of heart failure in these patients.
The American Heart Association recommends considering a sleep study in patients with New York Heart Association class II–IV heart failure symptoms and suggests that continuous positive airway pressure (CPAP) therapy be offered to patients with severe OSA and CPAP/oral appliances for patients with mild to moderate OSA. 16 CPAP therapy remains the current gold standard for the management of OSA. Poor rates of optimal adherence to CPAP therapy among those diagnosed with OSA may also play a role in the progression of heart failure among these patients. Contemporary studies show high rates of termination of CPAP therapy ranging from 25% to almost 50% in diagnosed patients. Optimal adherence to CPAP therapy comprises CPAP use for >4 h per night, most nights (70%) of the week. Trends of suboptimal CPAP use among patients are ambiguous but likely high based on other adherence studies, thereby a potential risk factor.
However, the evidence regarding the effect of CPAP on heart failure outcomes is mixed. Two recent randomized controlled trials in patients with moderate to severe OSA and acute decompensated heart failure have shown that positive airway therapy can lead to improvement in pulmonary hypertension and predicted peak VO2. 17 , 18 But a meta‐analysis of randomized controlled trials and observational studies did not show any benefit to cardiovascular outcomes with CPAP. The evidence from this meta‐analysis is of low strength due to publication biases and inherent deficiencies of observational studies. 19
It is also estimated that the burden of undiagnosed sleep disordered breathing (SDB) is about 23.5 million which is about 80% of those with SDB. Sleep disordered breathing encompasses both OSA and central sleep apnoea (CSA). Among patients with symptomatic heart failure, sleep disordered breathing is seen in 40–60% of patients, of which CSA is the dominant phenotype in greater than two‐third of patients. CPAP therapy is recommended for these patients as well although management based on ventilatory pattern may vary. The CANPAP trial, where patients with CSA and HFrEF were randomized into groups treated with CPAP or not, showed improvements in left ventricular ejection fraction and 6 min walk test but failed to show any difference in hospitalizations or mortality in patients randomized to the CPAP arm. 20 For patients with CSA, adaptive servo‐ventilation (ASV) was proposed to be a better alternative to CPAP. In ASV, servo‐controlled inspiratory pressure support is delivered in addition to the expiratory airway pressure. Thus, air pressure is dynamic, adjusting to patients breathing patterns as opposed to the set level of air pressure with CPAP. However, the SERVE‐HF trial, which used an ASV device that used minute ventilation as the parameter for ventilation, showed increased mortality with ASV in patients with CSA. 21 A recently concluded randomized controlled trial, the ADVENT‐HF trial, used an ASV device that relied on peak airway flow as the ventilation parameter compared the effect of ASV to standard therapy on survival and hospitalizations in patients with sleep apnoea and heart failure. 22 It showed no difference in mortality or hospitalizations. The details of the study are yet to be published but findings were presented at the European Society of Cardiology Congress 2022. 23 In the ADVENT‐HF study, patients with OSA did not have excessive daytime sleepiness (Epsworth score ≤10). Hence, the effect of this treatment strategy in patients with symptomatic OSA is unknown. The evidence of HF outcomes with CPAP therapy on patients with isolated or predominant OSA is limited. Larger studies are necessary to further explore the therapeutic effects of ventilatory strategies in various heart failure phenotypes. Additionally, improving rates of diagnosis of SDB given the large burden of undiagnosed cases may also enhance our current understanding of the disease process and its effect on heart failure.
Our study is the first to look at readmission rates, predictors, and hospitalization costs in patients with obstructive sleep apnoea admitted with heart failure with reduced ejection fraction. We found a substantial all‐cause readmission rate of 23.4% with heart failure readmission constituting about 48.9% of readmissions. In addition, we found that total hospital charges for all 30 day readmissions were $195 million and total hospital costs were $46.9 million. Medicaid beneficiaries, higher Charlson co‐morbidity index, and longer length of stay were associated with increased risk of readmission while private insurance and prior PCI had lower risk. This is likely because sicker patients with lower income and complex treatments obtain Medicaid while healthier patients with higher income are likely to have private insurance. 24 66.2% of readmissions had a length of stay 4 days or greater. Optimizing medications, remote home monitoring, and providing early outpatient follow up on these patients might help reduce readmission rates. Adherence to CPAP should be encouraged, even though evidence is limited. Future studies, ideally randomized controlled trials, are needed to evaluate the effect of CPAP therapy in heart failure patients with symptomatic isolated/predominant OSA.
This study suffers from certain limitations. As is true of all large ICD code‐based databases, our data suffer from coding inaccuracies and inconsistencies across hospitals. As the database solely relies on diagnostic codes for data capture, we were unable to identify the timing of sleep study, type of sleep study conducted, severity of OSA, and compliance with treatment. Another limitation is that the database does not provide laboratory or imaging data. In our study, 72.5% of the patients were from teaching hospitals; therefore, the results may not have external validity in non‐teaching and community hospitals.
Conclusions
In patients with OSA admitted with HFrEF, we found a substantial all‐cause readmission rate of 23.4% with heart failure readmissions constituting about 48.9% of all readmissions. The in‐hospital mortality rate during readmissions was significantly higher than that of the index admission. Medicaid beneficiaries, higher Charlson co‐morbidity index, and longer length of stay were associated with increased risk of readmission while private insurance and prior PCI had lower risk. The total hospital charges for all 30 day readmissions were $195 million, and the total hospital costs were $46.9 million. Readmission was associated with higher mortality and resource use.
Funding
None.
Conflict of interest
None declared.
Supporting information
Table S1. Results of Univariate Analysis.
Mathew, D. , Kosuru, B. , Agarwal, S. , Shrestha, U. , and Sherif, A. (2023) Impact of sleep apnoea on 30 day hospital readmission rate and cost in heart failure with reduced ejection fraction. ESC Heart Failure, 10: 2534–2540. 10.1002/ehf2.14430.
References
- 1. Centers for Medicare & Medicaid Services . Readmissions Reduction Program (HRRP). Available from: https://www.cms.gov/medicare/medicarefee‐for‐service‐payment/acuteinpatientpps/readmissions‐reduction‐program.html. Accessed 20 Jan 2023.
- 2. Goldgrab D, Balakumaran K, Kim MJ, Tabtabai SR. Updates in heart failure 30‐day readmission prevention. Heart Fail Rev. 2019; 24: 177–187. [DOI] [PubMed] [Google Scholar]
- 3. Khan MS, Sreenivasan J, Lateef N, Abougergi MS, Greene SJ, Ahmad T, Anker SD, Fonarow GC, Butler J. Trends in 30‐ and 90‐day readmission rates for heart failure. Circ Heart Fail. 2021; 14: e008335. [DOI] [PubMed] [Google Scholar]
- 4. Heidenreich PA, Albert NM, Allen LA, Bluemke DA, Butler J, Fonarow GC, Ikonomidis JS, Khavjou O, Konstam MA, Maddox TM, Nichol G, Pham M, Piña IL, Trogdon JG, American Heart Association Advocacy Coordinating Committee , Council on Arteriosclerosis, Thrombosis and Vascular Biology , Council on Cardiovascular Radiology and Intervention , Council on Clinical Cardiology , Council on Epidemiology and Prevention , Stroke Council . Forecasting the impact of heart failure in the United States. Circ Heart Fail. 2013; 6: 606–619. [DOI] [PMC free article] [PubMed] [Google Scholar]
- 5. Oldenburg O, Lamp B, Faber L, Teschler H, Horstkotte D, Töpfer V. Sleep‐disordered breathing in patients with symptomatic heart failure a contemporary study of prevalence in and characteristics of 700 patients. Eur J Heart Fail. 2007; 9: 251–257. [DOI] [PubMed] [Google Scholar]
- 6. Fox H, Bitter T, Horstkotte D, Oldenburg O. Cardioversion of atrial fibrillation or atrial flutter into sinus rhythm reduces nocturnal central respiratory events and unmasks obstructive sleep apnoea. Clin Res Cardiol. 2016; 105: 451–459. [DOI] [PubMed] [Google Scholar]
- 7. Khayat R, Jarjoura D, Porter K, Sow A, Wannemacher J, Dohar R, Pleister A, Abraham WT. Sleep disordered breathing and post‐discharge mortality in patients with acute heart failure. Eur Heart J. 2015; 36: 1463–1469. [DOI] [PMC free article] [PubMed] [Google Scholar]
- 8. Gottlieb DJ, Yenokyan G, Newman AB, O'Connor GT, Punjabi NM, Quan SF, Redline S, Resnick HE, Tong EK, Diener‐West M, Shahar E. Prospective study of obstructive sleep apnea and incident coronary heart disease and heart failure: the sleep heart health study. Circulation. 2010; 122: 352–360. [DOI] [PMC free article] [PubMed] [Google Scholar]
- 9. Parati G, Lombardi C, Castagna F, Mattaliano P, Filardi PP, Agostoni P. Heart failure and sleep disorders. Nat Rev Cardiol. 2016; 13: 389–403. [DOI] [PubMed] [Google Scholar]
- 10. Kasai T. Sleep apnea and heart failure. J Cardiol. 2012; 60: 78–85. [DOI] [PubMed] [Google Scholar]
- 11. Garvey JF, Taylor CT, McNicholas WT. Cardiovascular disease in obstructive sleep apnoea syndrome: the role of intermittent hypoxia and inflammation. Eur Respir J. 2009; 33: 1195–1205. [DOI] [PubMed] [Google Scholar]
- 12. Mehra R, Benjamin EJ, Shahar E, Gottlieb DJ, Nawabit R, Kirchner HL, Sahadevan J, Redline S, Sleep Heart Health Study . Association of nocturnal arrhythmias with sleep‐disordered breathing: the sleep heart health study. Am J Respir Crit Care Med. 2006; 173: 910–916. [DOI] [PMC free article] [PubMed] [Google Scholar]
- 13. Simantirakis EN, Schiza SI, Marketou ME, Chrysostomakis SI, Chlouverakis GI, Klapsinos NC, Siafakas NS, Vardas PE. Severe bradyarrhythmias in patients with sleep apnoea: the effect of continuous positive airway pressure treatment: a long‐term evaluation using an insertable loop recorder. Eur Heart J. 2004; 25: 1070–1076. [DOI] [PubMed] [Google Scholar]
- 14. Gami AS, Howard DE, Olson EJ, Somers VK. Day‐night pattern of sudden death in obstructive sleep apnea. N Engl J Med. 2005; 352: 1206–1214. [DOI] [PubMed] [Google Scholar]
- 15. Tan A, Hau W, Ho HH, Ghaem Maralani H, Loo G, Khoo SM, Tai BC, Richards AM, Ong P, Lee CH. OSA and coronary plaque characteristics. Chest. 2014; 145: 322–330. [DOI] [PubMed] [Google Scholar]
- 16. Yeghiazarians Y, Jneid H, Tietjens JR, Redline S, Brown DL, el‐Sherif N, Mehra R, Bozkurt B, Ndumele CE, Somers VK. Obstructive sleep apnea and cardiovascular disease: a scientific statement from the American Heart Association. Circulation. 2021; 144: e56–e67. [DOI] [PubMed] [Google Scholar]
- 17. Sharma S, Fox H, Aguilar F, Mukhtar U, Willes L, Bozorgnia B, Bitter T, Oldenburg O. Auto positive airway pressure therapy reduces pulmonary pressures in adults admitted for acute heart failure with pulmonary hypertension and obstructive sleep apnea. The ASAP‐HF pilot trial. Sleep. 2019; 42: zsz100. [DOI] [PubMed] [Google Scholar]
- 18. Fox H, Bitter T, Sauzet O, Rudolph V, Oldenburg O. Automatic positive airway pressure for obstructive sleep apnea in heart failure with reduced ejection fraction. Clin Res Cardiol. 2021; 110: 983–992. [DOI] [PMC free article] [PubMed] [Google Scholar]
- 19. Patil SP, Ayappa IA, Caples SM, Kimoff RJ, Patel SR, Harrod CG. Treatment of adult obstructive sleep apnea with positive airway pressure: an American academy of sleep medicine systematic review, meta‐analysis, and GRADE assessment. J Clin Sleep Med. 2019; 15: 301–334. [DOI] [PMC free article] [PubMed] [Google Scholar]
- 20. Bradley TD, Logan AG, Kimoff RJ, Sériès F, Morrison D, Ferguson K, Belenkie I, Pfeifer M, Fleetham J, Hanly P, Smilovitch M, Tomlinson G, Floras JS. Continuous positive airway pressure for central sleep apnea and heart failure. N Engl J Med. 2005; 353: 2025–2033. [DOI] [PubMed] [Google Scholar]
- 21. Javaheri S, Barbe F, Campos‐Rodriguez F, Dempsey JA, Khayat R, Javaheri S, Malhotra A, Martinez‐Garcia MA, Mehra R, Pack AI, Polotsky VY, Redline S, Somers VK. Sleep apnea: types, mechanisms, and clinical cardiovascular consequences. J Am Coll Cardiol. 2017; 69: 841–858. [DOI] [PMC free article] [PubMed] [Google Scholar]
- 22. Lyons OD, Floras JS, Logan AG, Beanlands R, Cantolla JD, Fitzpatrick M, Fleetham J, John Kimoff R, Leung RST, Lorenzi Filho G, Mayer P, Mielniczuk L, Morrison DL, Ryan CM, Series F, Tomlinson GA, Woo A, Arzt M, Parthasarathy S, Redolfi S, Kasai T, Parati G, Delgado DH, Bradley TD, for the ADVENT‐HF Investigators . Design of the effect of adaptive servo‐ventilation on survival and cardiovascular hospital admissions in patients with heart failure and sleep apnoea: the ADVENT‐HF trial. Eur J Heart Fail. 2017; 19: 579–587. [DOI] [PubMed] [Google Scholar]
- 23. ADVENT‐HF: Adaptive Servo Ventilation in Pts with HF & Sleep Apnea. 2023.
- 24. Abougergi MS, Peluso H, Saltzman JR. Thirty‐day readmission among patients with non‐variceal upper gastrointestinal hemorrhage and effects on outcomes. Gastroenterology. 2018; 155: 38–46.e1. [DOI] [PubMed] [Google Scholar]
Associated Data
This section collects any data citations, data availability statements, or supplementary materials included in this article.
Supplementary Materials
Table S1. Results of Univariate Analysis.