Abstract
Purpose:
A Monte Carlo (MC) beam model and its implementation in a clinical treatment planning system (TPS, Varian Eclipse) are presented for a modified ultra-high dose-rate electron FLASH radiotherapy LINAC (eFLASH-RT) utilizing clinical accessories and geometry.
Methods:
The gantry head without scattering foils or targets, representative of the LINAC modifications, was modelled in Geant4-based GAMOS MC toolkit. The energy spectrum (σE) and beam source emittance cone angle (θcone) were varied to match the calculated open field central-axis percent depth dose (PDD) and lateral profiles with Gafchromic film measurements. The beam model and its Eclipse configuration were validated with measured profiles of the open field and nominal fields for clinical applicators. A MC forward dose calculation was conducted for a mouse whole brain treatment and an eFLASH-RT plan was compared to a conventional (Conv-RT) electron plan in Eclipse for a human patient with metastatic renal cell carcinoma.
Results:
The eFLASH beam model agreed best with measurements at σE=0.5 MeV and θcone=3.9±0.2 degrees. The model and its Eclipse configuration were validated to clinically acceptable accuracy (the absolute average error was within 1.5% for in-water lateral, 3% for in-air lateral, and 2% for PDD’s). The forward calculation showed adequate dose delivery to the entire mouse brain, while sparing the organ-at-risk (lung). The human patient case demonstrated the planning capability with routine accessories to achieve an acceptable plan (90% of the tumor volume receiving 95% and 90% of the prescribed dose for eFLASH and conventional, respectively).
Conclusion:
To the best of our knowledge, this is the first functional beam model commissioned in a clinical TPS for eFLASH-RT, enabling planning and evaluation with minimal deviation from Conv-RT workflow. It facilitates the clinical translation as eFLASH-RT and Conv-RT plan quality were comparable for a human patient involving complex geometries and tissue heterogeneity. The methods can be expanded to model other eFLASH irradiators with different beam characteristics.
1. Introduction
There is increasing evidence that ultra-high dose rate (UHDR, >40 Gy/s) treatment delivery to patients can lead to the FLASH effect1–3, or improved therapeutic ratio by reducing normal tissue toxicity4–7. While the first human patient was treated with an electron FLASH beam at UHDR and several preventative dosimetry checks were done to ensure safe delivery2, widespread translation to the clinic would benefit from prior prediction of dose to patients, which necessitates a treatment planning process to account for anatomical heterogeneity and complex geometries, predict tumor and organs-at-risk dose and create deliverable plans in a clinical setting8.
In recent FLASH RT studies, Van de Water et al. utilized their in-house treatment planning system to investigate their proton pencil beam scanning system’s potential for FLASH RT delivery9. van Marlen et al10. evaluated efficacy of FLASH RT treatments for a passive proton beam on the widely used clinical Eclipse TPS (Varian Medical Systems, Palo Alto, CA). In a recent study by Rahman et al.11 UHDR megavoltage electron beams were delivered to isocenter on a modified medical linac in its normal clinical setting. The described modifications enabled the delivery of UHDR beams with minimal modifications to the machine configuration. A similarly modified TPS is desirable to model characteristics of the UHDR beam that are different from conventional beams.
Monte Carlo (MC) dose calculation can reduce the dose prediction uncertainty to about 2–3% even in complex treatment geometries and patient compositions12. MC methods have been widely adopted in modern treatment planning systems (TPS) for accurate dose calculation and plan optimization. In this study, a Monte Carlo (MC) model of an UHDR electron beam was developed on the Geant4-based GAMOS MC toolkit13,14(p4) and implemented into the Eclipse TPS for planning treatments to biological subjects (process shown in Figure 1). The model was representative of a clinical linear accelerator (Varian Clinac 2100 C/D) modified to deliver UHDR at treatment room isocenter utilizing clinical accessories and geometry11. The beam’s parameters (e.g. mean energy, energy spread, spot size or spatial spread, and cone angle) were determined to best match film measured dose profiles. The measured profiles were used to configure the Eclipse eMC TPS beam model and both models were validated with film measurements. As demonstrations, the predicted dose distributions in a human metastatic renal cell carcinoma and mouse whole brain treatments and potential clinical importance in adoption of electron FLASH-RT (eFLASH-RT) treatment planning were presented.
Figure 1.
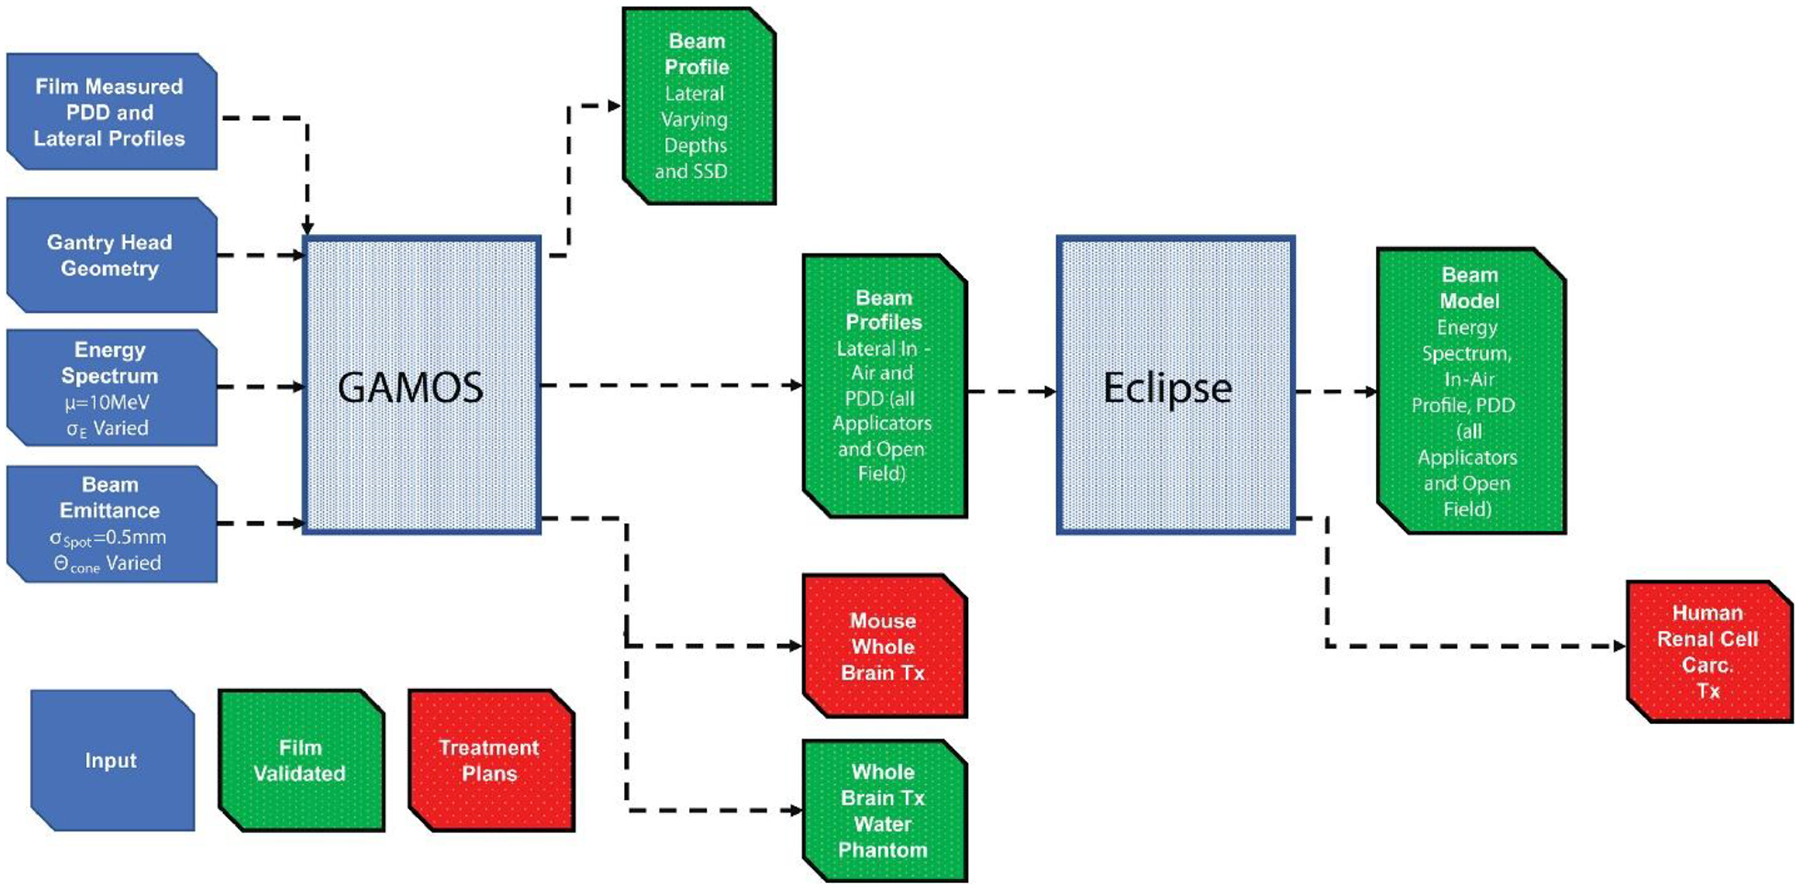
Methods to develop and validate beam models and create treatment plans on GAMOS MC toolkit and Eclipse TPS. The diagram can be read as a timeline from left to right.
2. Material and Methods
A diagram of methods used to develop the beam model and treatment plans of the biological subjects are included in Figure 1. eFLASH beam from the modified Varian Clinac 2100 C/D at UHDR (ultra-high dose rates of ~300 Gy/s, or ~1 Gy/pulse) irradiated EBT XD Gafchromic film (Ashland Advanced Materials, Bridgewater, NJ) to characterize the beam’s spatial dose distribution. The LINAC delivered 40 pulses per acquisition. The films were placed orthogonal to beam axis, on top of or in between varying thickness of solid water phantom with a slab of 5cm solid water phantom (Solid Water HE, Sun Nuclear, Florida, USA) below for backscatter. The solid water had an electron density equivalent to water within 0.5%15. The percent depth dose (PDD) at discrete depths were determined with 2.5×2.5 cm2 film placed along the central axis of at least three times per depth. The lateral dose profiles were measured using 25×20 cm2 film placed at the surface, 1cm, 3cm and 4 cm depths at 100 cm source to surface distance (SSD). The surface lateral profiles were also measured at 95 cm, 110cm, and 120 cm SSD. The films were read out and dose was quantified using the methods described in Rahman et al.11 (2021).
The emission parameters that best represented the measured film dose profiles were determined by modelling the head of the LINAC on the GEANT4 based GAMOS MC (6.1.0) toolkit. Figure 2a shows the model of the LINAC head with the scattering foil, flattening filter, and the target removed, representative of the modified clinical LINAC used to deliver UDHR beams11 in a previous study. For the unperturbed 10 MeV electron beam produced by the LINAC, the standard deviation (σE) of the nominal beam energy was varied to determine which best fit the PDD measured by the film as shown in figure 2b. The methods for determining the beam emittance using the open field beam (jaws wide open with a 40×40 cm2 field size setting) are shown in figure 2c (the energy spectrum that best matched in figure 2b was implemented). Prior studies have shown the 0.5 mm (1.18 mm FWHM)16 spot size, σ or standard deviation in profile at the source, for a gaussian emittance distribution of the electron beam is best representative of the LINAC. The σ of lateral dose profiles for the beam at 100 cm SSD were compared to that from the MC results at varying cone angles. The quadratic fit was applied to determine the cone angle that would equate the σ from the MC results to that measured17 from the film. (Note: the fit did not include simulated cone angles above 4.63 degrees and discussed further in the results). The appropriate cone angles were determined for each measured depth along the in-plane and cross-plane and averaged as shown in supplementary figure 1A. Enough particles were simulated to quantify the dose distribution with <1% uncertainty (from the entrance to the practical range of the electrons) in the open field beam for each beam parameter variation with a 25×25×10 cm3 water phantom and 1×1×1 mm3 voxel size. The lateral dose profile at each measured depth and SSD were compared with the MC results (from simulating with the determined cone angle and standard deviation in the energy spectrum) as shown in figure 3.
Figure 2.
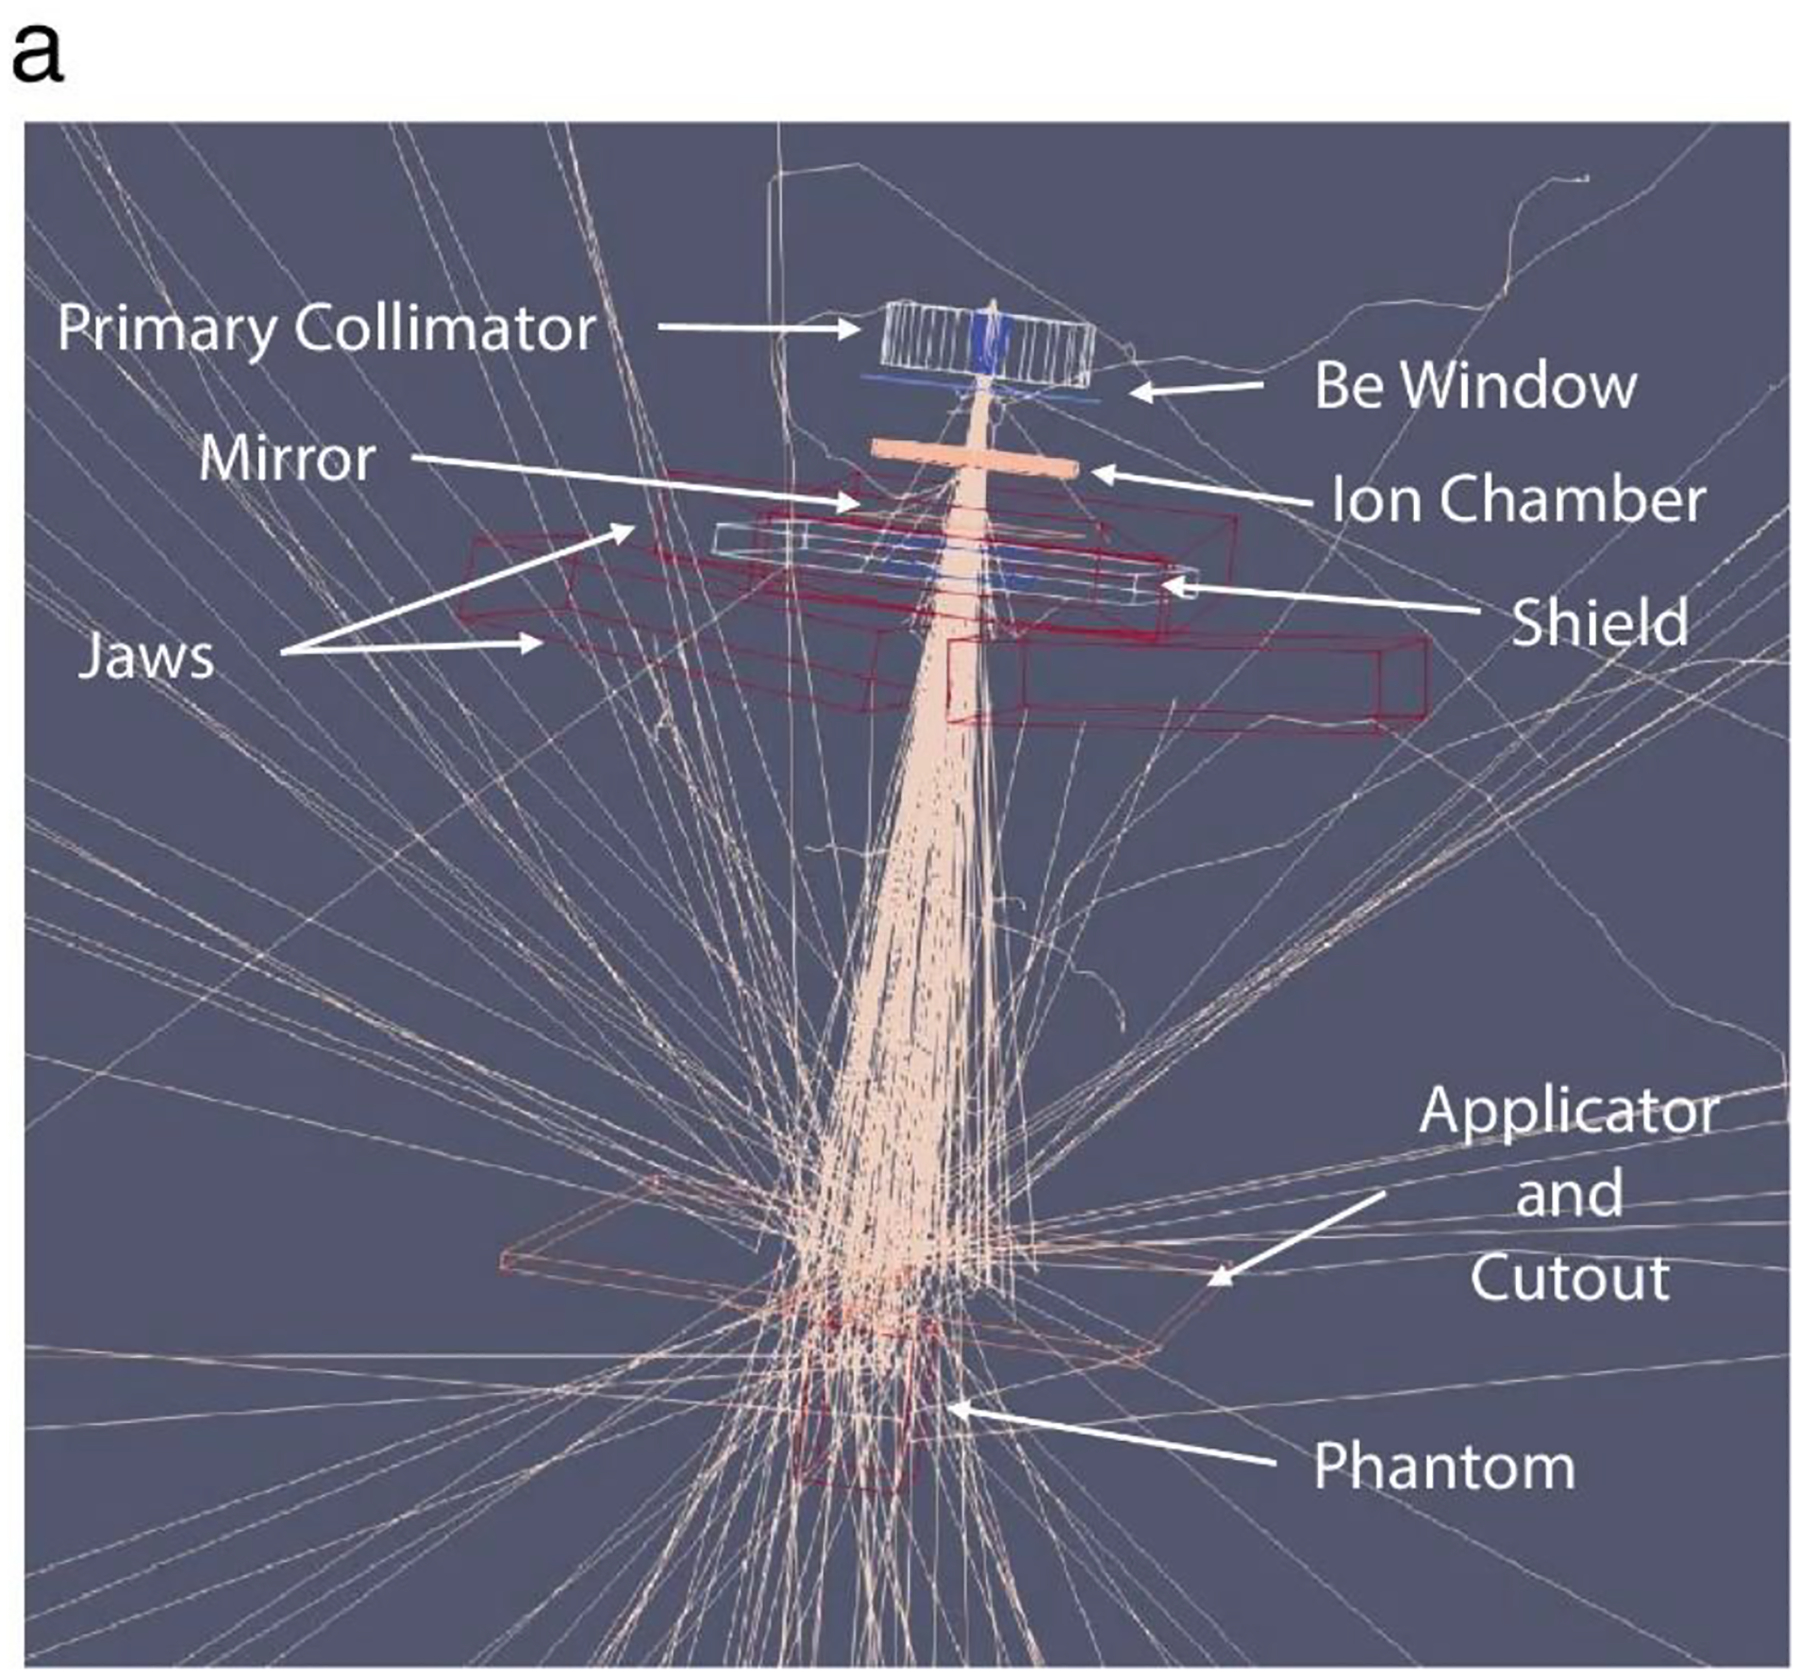
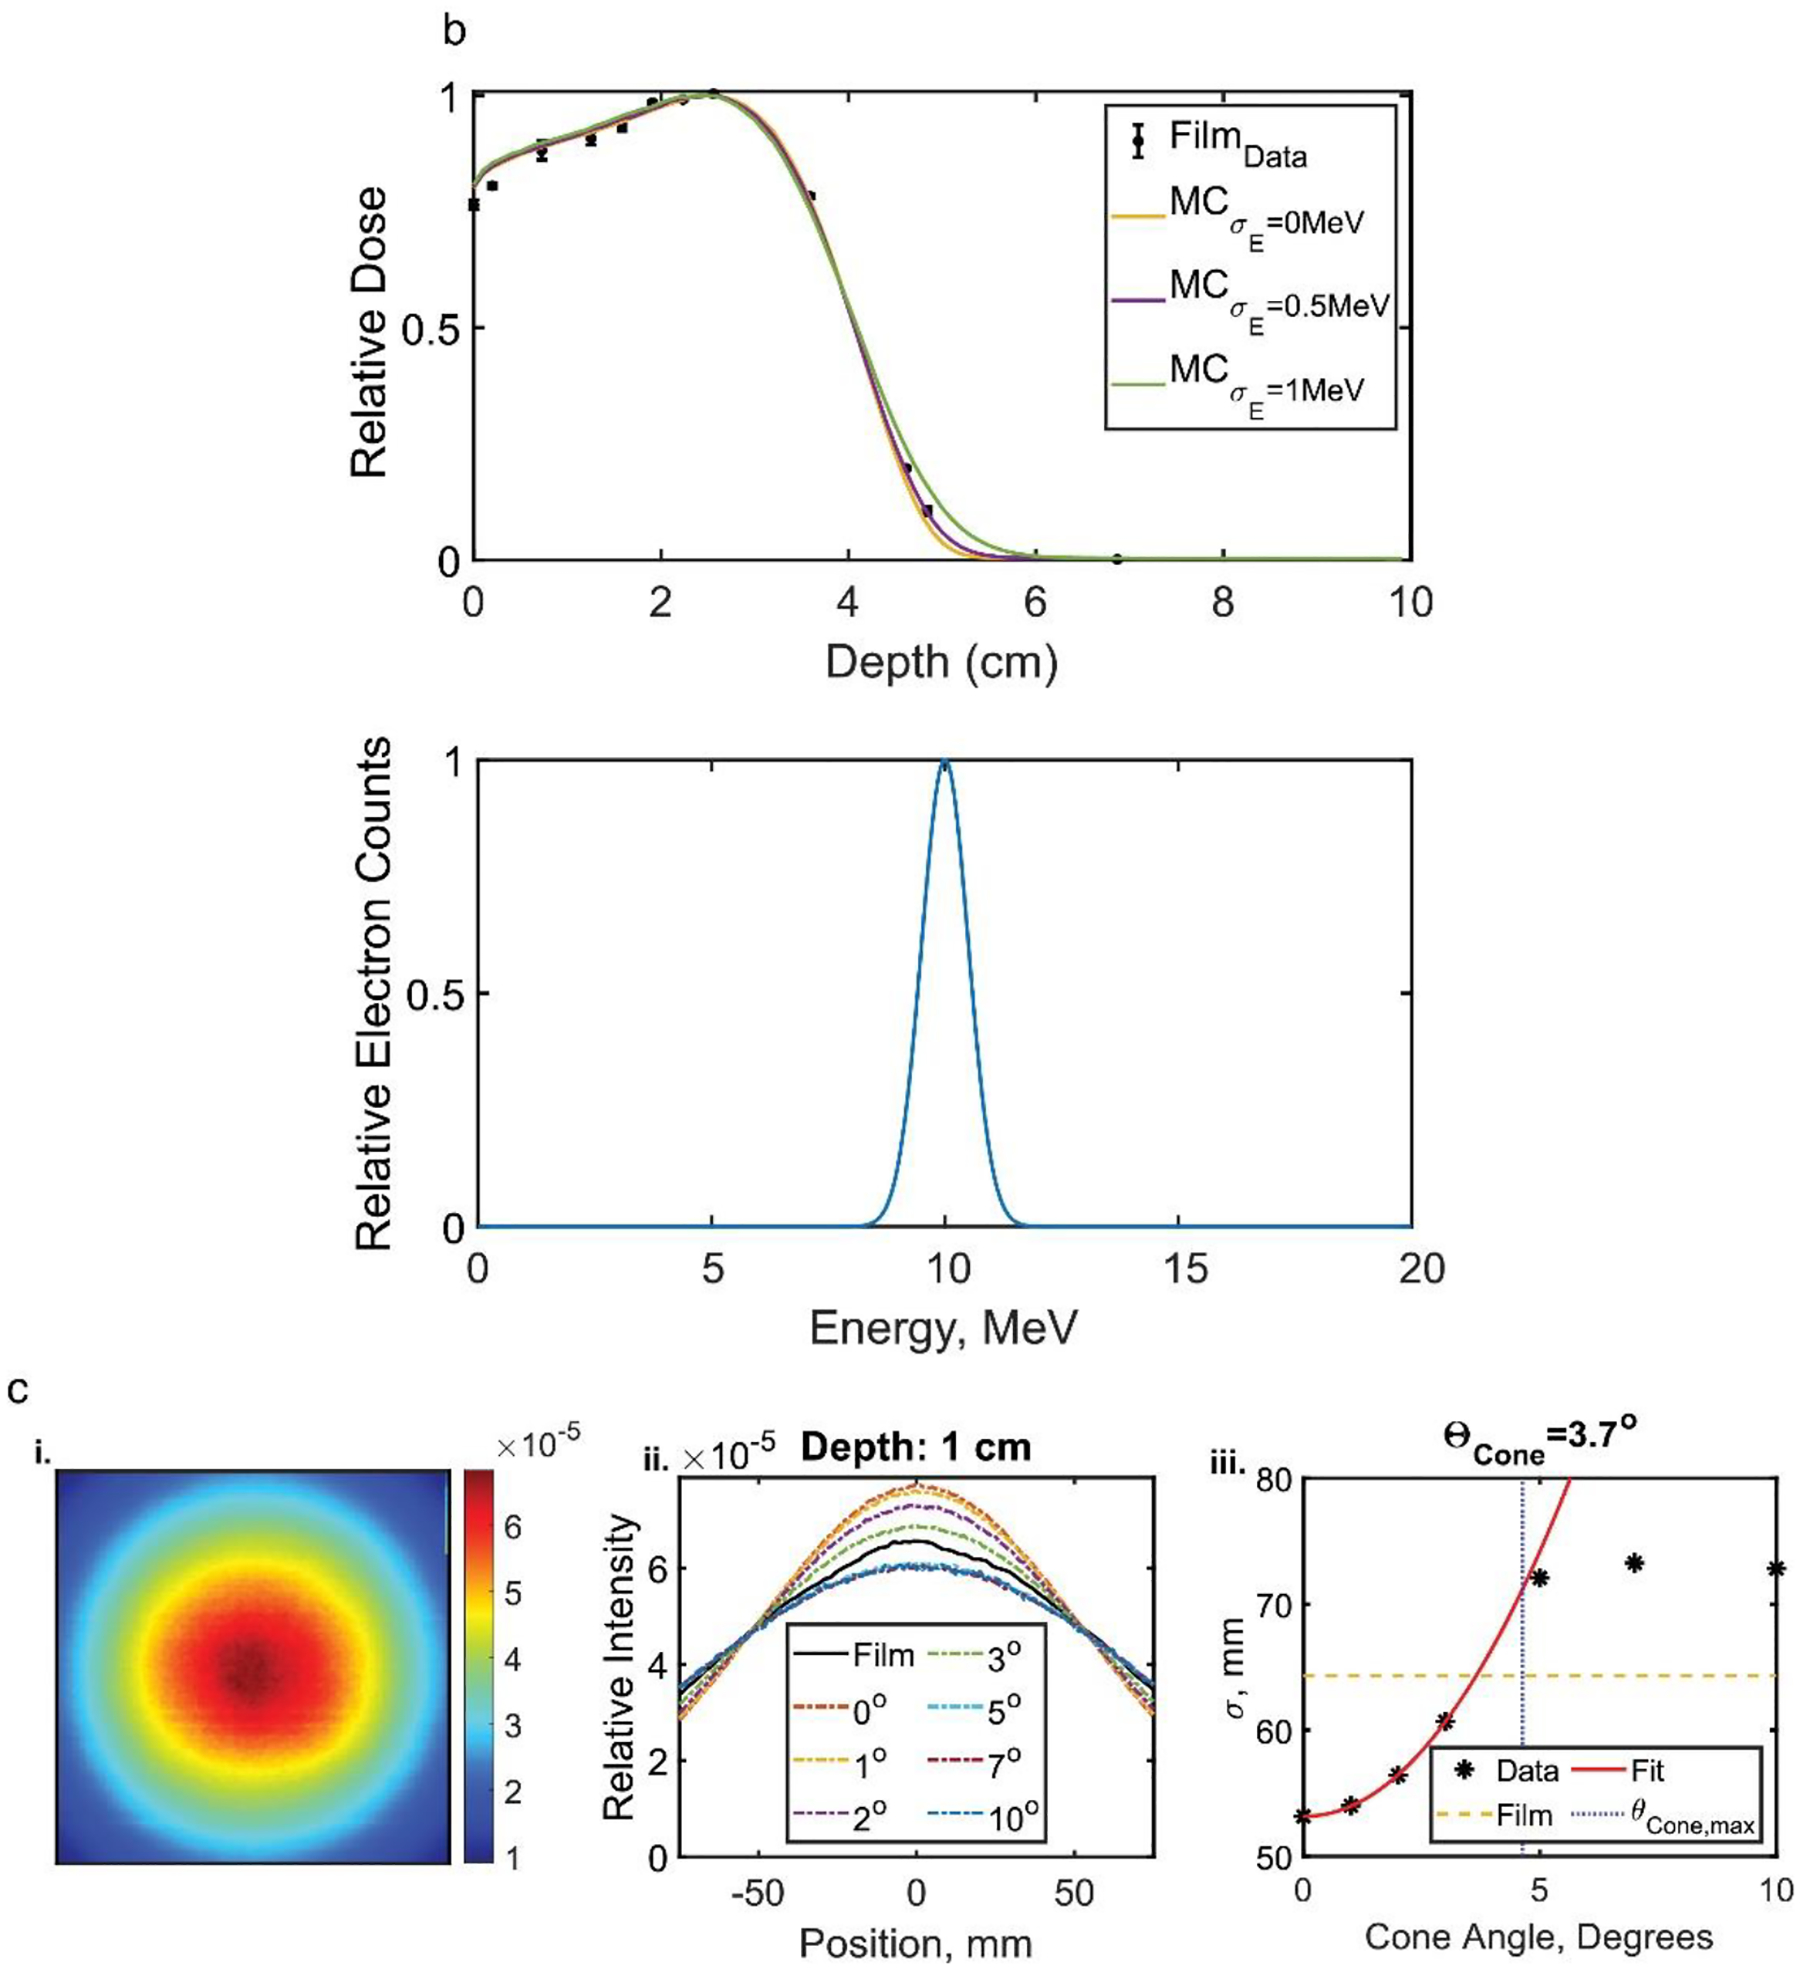
a. Set up for MC simulations of the electron FLASH beam. Methods of determining the beam parameters b. energy spectrum standard deviation and c. emittance cone angle with an example at 1cm depth and in-plane lateral profile. The implemented energy spectrum is included in b.ii. The average of cone angles determined from the fits and the film at different depths for the lateral profiles was chosen as the eFLASH beam’s cone angle (each calculated cone angle and plots are included in Supplementary Figure 1A).
Figure 3.
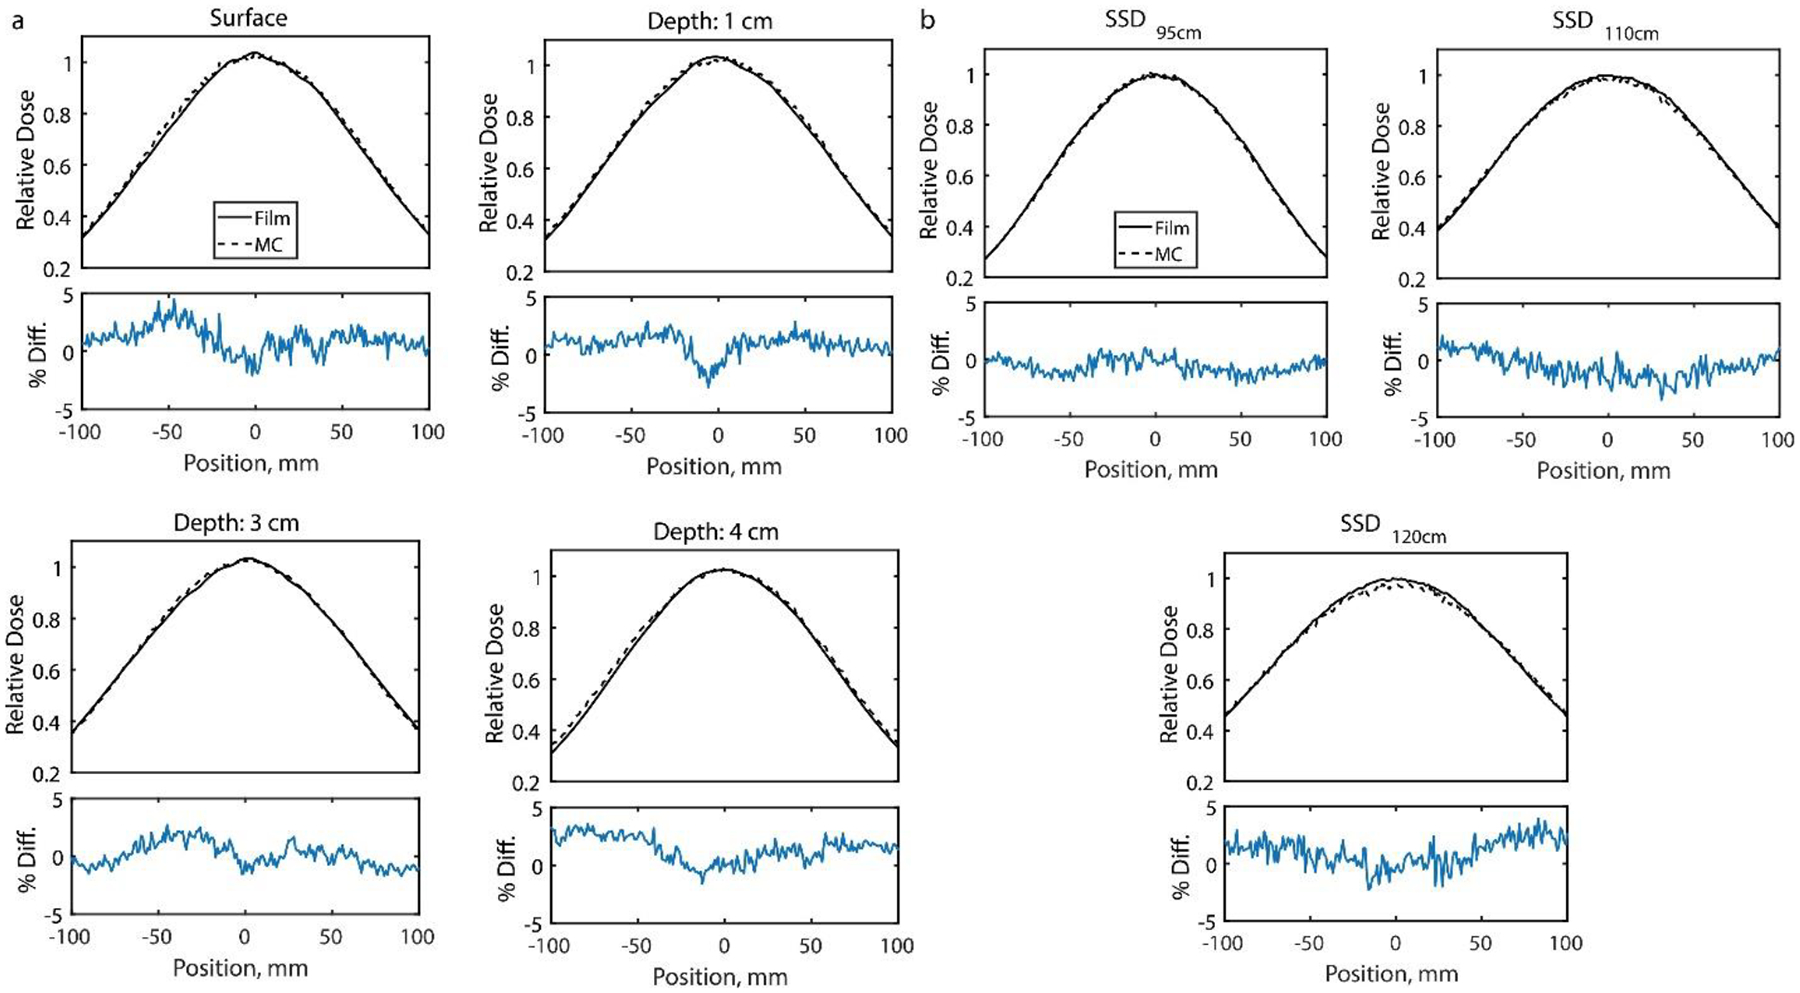
Lateral Profiles comparing GAMOS MC simulations and Film measured dose for a. different depths at 100 SSD and b. different SSD at the surface of a solid water phantom.
With confirmed beam parameters from film measured lateral profiles, an Eclipse eMC TPS beam model was created from the validated GAMOS model. Open field and the applicators (i.e. 6×6cm2, 10×10cm2, 15×15cm2, 20×20cm2) beam profiles were simulated to produce PDD curves at 100 cm SSD and lateral dose profile in air at 95 cm SSD for the open field. Again, enough particles were simulated to reduce uncertainty below 1% from superficial depth to practical range of the electrons with the same phantom volume/voxel size. The absolute output of the machine with an open field at depth of max dose was measured with film (1.01±0.02 Gy/pulse) and included in the TPS. The simulated open field profiles and the PDD’s for each applicator were uploaded within Eclipse under “Model Configuration” and as text files in the appropriate format and can be accessed in <https://github.com/optmed/eFLASHBeamModeltoTPS>. The absolute dose was set to 1 Gy/MU based on the measured dose from the open field dose measurement but may be changed based on the day-to-day output measurement of the LINAC. The inputs resulted in a model that minimized error between the Eclipse beam model with that produced from GAMOS and film measurement, creating its own energy spectrum and lateral/depth dose profiles as shown in figure 4. The profiles were compared with film measurements at discrete depths along the central axis and with a film suspended at 95 cm SSD (edges taped to vertical slabs of low Z cardboard material) to measure the in-air profile or outputs of the GAMOS configured model. The PDD’s of the applicators were measured with film once at each discrete depth (included in Figure 4c and Supplementary Figure 2Aa) where the error bars are the standard deviation from a region of interest along the central axis of the beam. To validate the TPS can accurately model heterogeneity for dose calculations, a heterogeneous water phantom with a 20×4×2 cm3 air volume 2 cm deep from the surface was created (included in Supplementary Figure 4A) on the TPS model and replicated with solid water phantom for delivery with a 10×10 cm2 field applicator at 100 cm SSD. Film measurements and TPS dose profiles were compared which included depth profiles along the central axis and lateral profiles at 2 cm and 4 cm depth.
Figure 4.
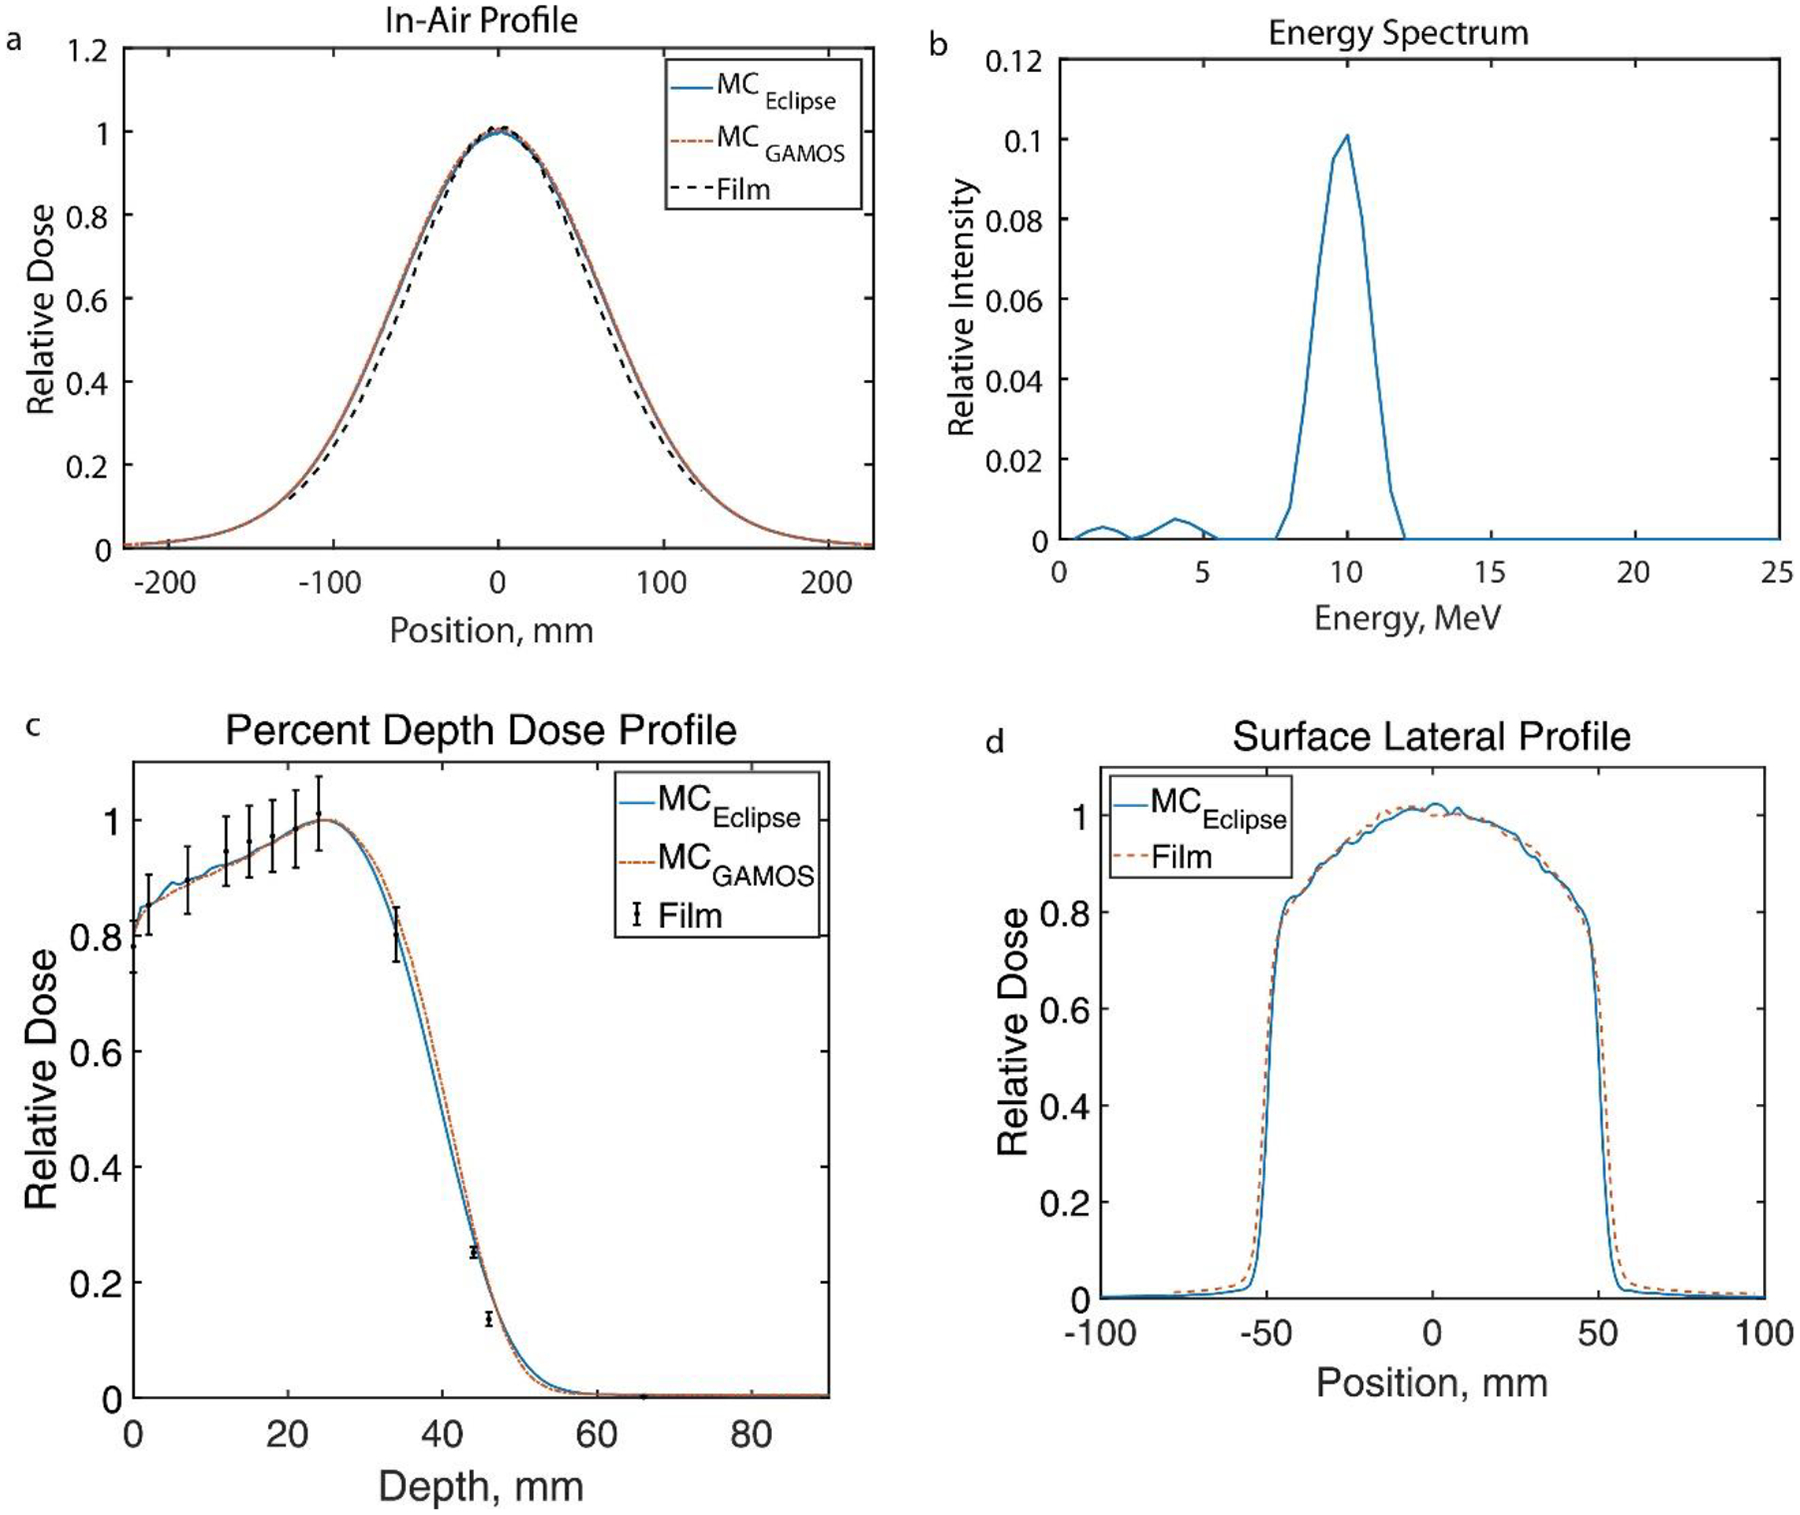
The Eclipse (Varian Medical Systems, Palo Alto, CA) calculated eFLASH beam configuration results from inputting GAMOS MC produced beam profiles, including a. film validated in-air profile b. the energy spectrum, c. film validated PDD for a 10×10 cm2 field and d. computed surface lateral profile in comparison to film for a 10×10 cm2 field (the other PDD’s of the applicators for beam configuration are included in Supplementary Figure 2A as well as lateral profiles of the applicators.)
A forward dose calculation was conducted for a mouse whole brain treatment and an eFLASH-RT optimized plan was produced in Eclipse for a human metastatic renal cell carcinoma patient. The dose delivered to a mouse brain tumor was determined via GAMOS MC simulation of a 1.5 cm diameter Cerrobend circular cutout (figure 2a). The dose distribution from the MC simulations were verified to agree with the film measured dose for a 5×5×10 cm3 water phantom and 1×1×1 mm3 voxel size at 100 cm SSD (included in supplementary figure 2A). A computed tomography (CT) scan of the mouse was imported into GAMOS with the mouse positioned to irradiate the whole brain, and lung defined as the organ at risk (figure 5). The CT scan of the human was taken with geometry intended for delivery of the treatment. Right Posterior Oblique (RPO) treatments (10MeV UHDR FLASH beam and 9MeV conventional beam) were created in Eclipse with a 10×10cm2 applicator and a patient specific cutout to conform to the tumor shape on the right rib cage. The prescribed treatment was 16 Gy single fraction, and the dose distribution from the forward calculated plan is included in figure 6. (NOTE: The human plans were created as demonstrations and will not be delivered to the anonymized patient.)
Figure 5.
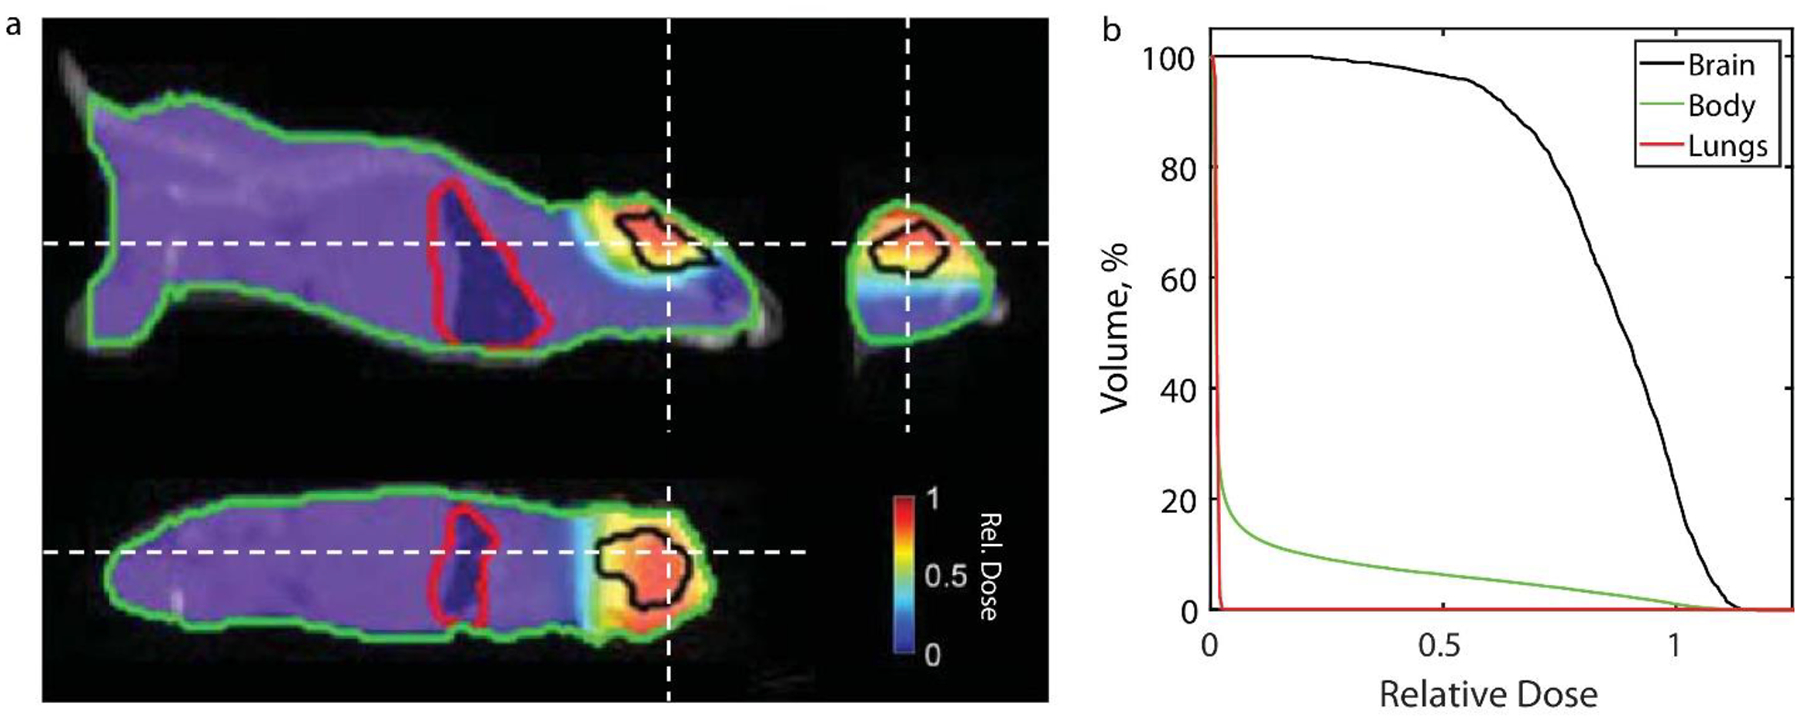
a. Dose distribution at orthogonal views and b. cumulative dose volume histogram for an irradiated brain of a mice with a 1.5 cm circular Cerrobend cutout from GAMOS simulation (dose distribution in water phantom is included in supplementary figure 2A). Dashed white lines in the orthogonal views indicate the slice location for the other two perspectives.
Figure 6.
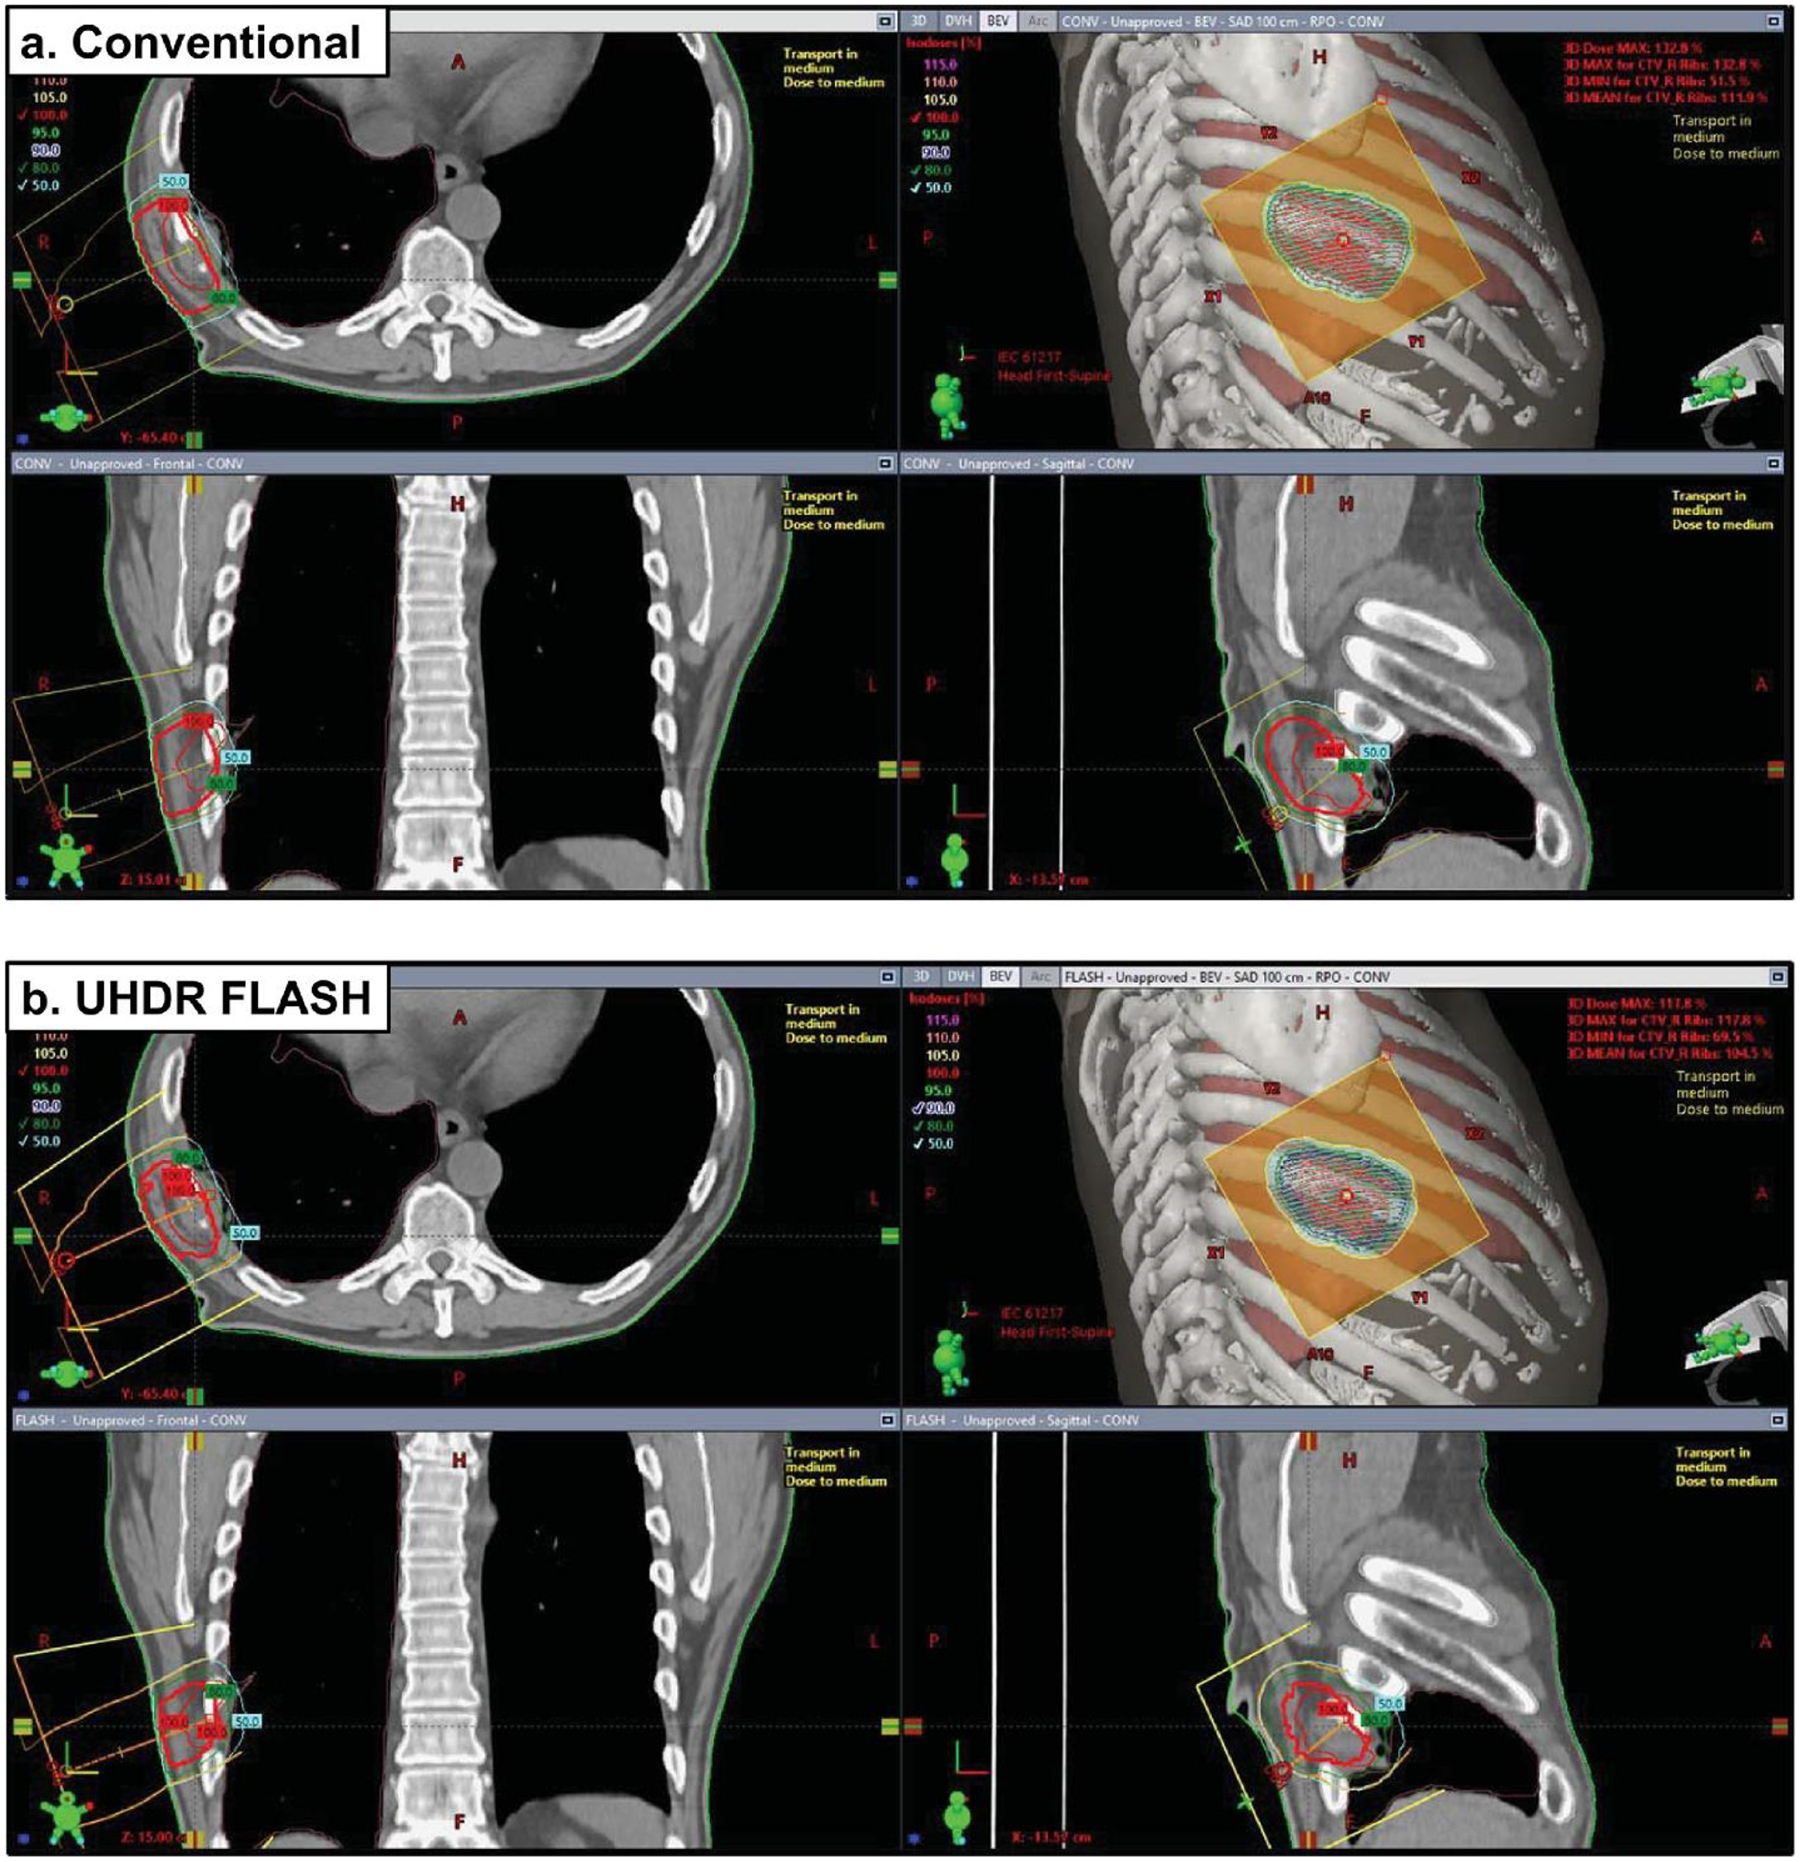
Eclipse treatment plans of a metastatic renal cell carcinoma along the right ribcage using a 10×10 cm2 applicator and a cutout specifically shaped to the tumor volume. Plans include a. conventional 9MeV beam and b. UHDR FLASH 10 MeV beam. The 16Gy single treatment regimen was planned to deliver to a targeted reference point. Beams eye view (BEV) are included along with orthogonal views for each plan. (NOTE: These plans were not delivered to the patient and are included as demonstrations.)
3. Results
Varying the standard deviation σE of simulated electron energy spectrum (with mean energy of 10 MeV) resulted predominantly in change in the maximum range and PDD at the distal edge of the phantom. The greatest agreement to film was found with σE=0.5MeV (within 5%). By varying the cone angle there was little change in the lateral profile for θcone > 4.63° because the primary collimator obstructed the edges of the beam. So, the functional relationship between σ and θcone were determined with the simulated cone angles below 4.63°. The average cone angle that would produce the same σ from the film (determined for each depth and lateral profile) was 3.9°±0.2°.
The comparison to relative film measured dose profiles suggested the GAMOS MC beam model and the Eclipse generated beam model accurately represented the electron UHDR beam produced by the modified LINAC. The lateral profiles for the open field beam at each depth for 100 cm SSD and at the surface for varying SSD (95 cm, 110 cm, and 120 cm) agreed on average within 1.5% (max within 4%) as shown in figure 3. The lateral in-air profile from the Eclipse model and GAMOS model (figure 4a) agreed with the film measured in-air profile on average within 3% (max within 5%) and the PDD (figure 4c) agreed with the film measured dose at discrete depths generally within 2% (max disagreement of 6%) with the greatest disagreement at the tail-end of the profile. The PDD’s and the lateral surface profiles (Supplementary Figure 2A) for each applicator agreed with the film measured dose generally within 2% (max difference ~10% along the penumbra in the lateral profiles). The penumbra and the full-width half-max (FWHM) of the lateral profiles matched with film to within 2 mm meeting clinical recommendations according to Smilowitz et al18. The lateral surface profile for the 1.5 cm circular field at the 100 cm SSD agreed on average within 2% (max within 5%) and the PDD agreed within 2% (max within 3%) (in supplementary figure 3A). The GAMOS MC simulation produced beams using a gaussian distribution for the energy spectrum centered at 10MeV and σE=0.5MeV and the Eclipse model’s spectrum is peaked at 10MeV with a spread indicative of a gaussian distribution. However, in the Eclipse model about 5% of electrons with energy 5 MeV or less contribute to the dose delivered and is seen as a tail in the spectrum. For the heterogenous water phantom with the air volume (Supplementary Figure 4A), the TPS calculate depth dose profiles, lateral profiles at 2 cm and 4 cm depths agreed with the film measurements with an average (max) deviation of 3% (6%), 2% (6%), and 1% (7%) respectively.
After confirming the dose predicted from GAMOS with a water phantom for a mouse treatment (Supplementary Figure 3A) and the Eclipse model configuration profiles (Figure 4, in-Air Profile and PDD’s for applicators), it was implemented to predict the dose distribution for a whole mouse brain and human renal cell carcinoma treatment as shown in figure 5 and 6, respectively. The dose volume histogram (DVH) in figure 5b suggests, while the circular field can adequately deliver dose to the entire mouse brain, the electron beam will deliver very little dose to organs-at-risk (OARs) such as the lung (or the entire body) with a steep fall off in the relative DVH. As indicated by in figure 6b, the RPO human 10MeV FLASH treatment with tumor specific cutout delivers >95% of the prescribed dose to 90% of the clinical target volume (CTV). The conventional 9MeV (nominal energy closest to the 10MeV eFLASH beam) treatment for the patient, with similar dose distribution, covers 90% of the prescribed dose to 90% of the CTV (figure 6a). The conventional plan has a greater hot spot dose (132.8% maximum in conventional vs 117.8% maximum in FLASH of the prescribed dose) but the eFLASH plan delivered greater dose to the right lung (11% of the lung receiving >1Gy in FLASH vs 7% of the lung receiving >1Gy in Conventional). Nonetheless, the plans suggest the eFLASH beam can adequately deliver dose to the tumor comparable to conventional electron plans.
4. Discussion
The agreement between measurements and calculations in GAMOS and Eclipse suggests the beam model can be used to predict the dose distribution for eFLASH-RT in preclinical and eventually clinical studies. GAMOS MC provides a free solution to treatment planning via forward dose calculations. It is worth noting the source size was chosen based on EL Bakkali et al.16 and the model was an approximation validated with the measured dose profiles. Nonetheless the optimized energy spectrum and emittance parameters produced accurate PDD’s and lateral profiles. Furthermore the profiles were compared relatively without consideration of absolute dose as the output of the UHDR LINAC can vary day-to-day11 and so the Gy/MU must be inputted in the Eclipse TPS based on the daily output. The agreement between the relative film measurements and calculated dose for the heterogeneous water phantom with an air volume suggests the Eclipse implementation accurately modeled the effects of tissue heterogeneity. The larger maximum discrepancy between TPS and film can partially be attributed to the film’s intrinsic 2–3% uncertainty19 as well as limitations of radiation transport simulation in heterogenous medium of a parametric beam model, specifically on the modeling of back and lateral scatter. This may also explain the difference in calculated and film dose at 2 cm depth (Supplementary Figure 4A.c.) along the lateral profile of the beam. The TPS profile exhibited abrupt changes in the penumbra region for the heterogeneous phantom due to the voxel resolution in the calculation. Thus, the Eclipse profiles can be improved by reducing voxel size but requiring longer computation time. Nonetheless Zhang et al.20 also demonstrated the eMC algorithm accurately calculated dose distribution in heterogenous media, further confirming the algorithm’s use for the electron FLASH treatment planning.
While in figure 5 the dose distribution was used to predict the dose delivered to a mouse brain, the Eclipse TPS implementation, as indicated in figure 6 for the human renal cell carcinoma treatment, allows the user to predict and optimize dose distributions in the standard clinical environment. This patient with a rib metastasis was chosen as an example because clinical electron treatments (energy range of ~4–20 MeV) are most appropriate for superficial tumors (<10 cm depth) and illustrated the tissue heterogeneity that would be a concern for dose calculation. While a single field appropriately delivered dose to the tumor volume in this case, a larger tumor volume may require further plan optimization for uniform coverage due to the gaussian shape of the beam profile (full width half max of 14.1 cm11).
Due to the nature of Eclipse TPS, a cumulative dose distribution can be predicted and optimized, without consideration of the temporal aspects of the treatment delivery21. To implement the FLASH effect into the treatment planning process, future work will require consideration of the dose rate distribution and its effect on biological effectiveness particularly with the delivery of multiple fields. This is conceptually straightforward as the dose rate of a specific field is proportional to the dose delivered by that field. Therefore, the dose rate distribution can be quantified on the instantaneous, field-specific averaged as well as fraction averaged levels. Prior studies have shown such dose-rate distribution can be considered in the treatment planning process9,10,22. The benefit here lies in utilizing already existing clinical technology regarding both the widely used Eclipse TPS and the modified LINAC in clinical geometry to deliver UHDR treatment11. Nonetheless this approach will require further validation before clinical implementation, especially if dose rate is considered as the biological outcomes of UHDR beams is an active area of research. The extent to which the FLASH effect reduces normal tissue damage, the mechanism (e.g. oxygen depletion) behind the effect23, and the delivery structure (dose per pulse, mean dose rate) are currently under investigation24 and necessary for adoption of FLASH radiotherapy treatment planning.
While there are studies suggesting the FLASH effect can improve patient outcome via reduced normal tissue damage1–4,25, implementation and improvement in the therapeutic ratio will require the delivery modalities’ use in tandem with prior developed technology (i.e. TPS) in radiation therapy such as analyzing and reducing the volume of irradiated normal tissue via treatment planning21,26. As the radiation therapy community mobilizes to acquire and implement UHDR irradiators (e.g. LINACs) to investigate the FLASH effect, methods laid out in this study can assist in modelling their beam line, implementation into a TPS, and its potential adoption into the clinic. The model currently is appropriate for the modifications for Rahman et al11 and 10 MeV beam energy, but would require a different geometry and beam parameters for alternative modifications such as in Schuler et al and Lempart et al27,28. For higher energy beams the simulations may also require other physics packages in GAMOS (currently utilizes GmEMPhysics) to account for neutrons produced by the beam29. Nonetheless the methods of developing and implementing the model in Eclipse are transferable. To promote transparency and data sharing, the source code for creating the model is included in <https://github.com/optmed/eFLASHBeamModeltoTPS>. The methods presented on determining the beam emittance parameters and energy spectrum can be utilized to model other clinically relevant beam energies (e.g. 18 MeV).
5. Conclusion
A clinical TPS was configured for eFLASH-RT of a LINAC delivering UHDR at clinical treatment room geometry and predicted dose delivery to a mouse and human patient. The GAMOS MC model and its implementation in Eclipse TPS accurately represented the dose delivery as measured by Gafchromic film and the methods presented in the study can be utilized by others to accurately model their UHDR irradiator for configuration into a TPS. In future work, dose rate distribution will be implemented into the treatment planning process and further validations will conducted in large animal studies prior to the clinical translation.
Supplementary Material
Funding Statement:
This work was supported by the Norris Cotton Cancer Center seed funding through core grant P30 CA023108 and through seed funding from the Thayer School of Engineering, as well as support from grant R01 EB024498. Department of Medicine Scholarship Enhancement in Academic Medicine (SEAM) Awards Program from the Dartmouth Hitchcock Medical Center and Geisel School of Medicine also supported this work.
Footnotes
Conflict of Interest Statement:
Dr. Zhang has a patent 10201718 issued, and a patent 15160576 issued.
Data Sharing Statement:
Research data are stored in an institutional repository and will be shared upon request to the corresponding author. The beam model implementation methods can be found on https://github.com/optmed/eFLASHBeamModeltoTPS.
References
- 1.Vozenin M-C, De Fornel P, Petersson K, et al. The Advantage of FLASH Radiotherapy Confirmed in Mini-pig and Cat-cancer Patients. Clin Cancer Res. Published online June 6, 2018. doi: 10.1158/1078-0432.CCR-17-3375 [DOI] [PubMed] [Google Scholar]
- 2.Bourhis J, Sozzi WJ, Jorge PG, et al. Treatment of a first patient with FLASH-radiotherapy. Radiother Oncol. 2019;139:18–22. doi: 10.1016/j.radonc.2019.06.019 [DOI] [PubMed] [Google Scholar]
- 3.Montay-Gruel P, Acharya MM, Petersson K, et al. Long-term neurocognitive benefits of FLASH radiotherapy driven by reduced reactive oxygen species. Proc Natl Acad Sci. 2019;116(22):10943–10951. doi: 10.1073/pnas.1901777116 [DOI] [PMC free article] [PubMed] [Google Scholar]
- 4.Wilson JD, Hammond EM, Higgins GS, Petersson K. Ultra-High Dose Rate (FLASH) Radiotherapy: Silver Bullet or Fool’s Gold? Front Oncol. 2020;9. doi: 10.3389/fonc.2019.01563 [DOI] [PMC free article] [PubMed] [Google Scholar]
- 5.Bourhis J, Montay-Gruel P, Gonçalves Jorge P, et al. Clinical translation of FLASH radiotherapy: Why and how? Radiother Oncol. 2019;139:11–17. doi: 10.1016/j.radonc.2019.04.008 [DOI] [PubMed] [Google Scholar]
- 6.Favaudon V, Caplier L, Monceau V, et al. Ultrahigh dose-rate FLASH irradiation increases the differential response between normal and tumor tissue in mice. Sci Transl Med. 2014;6(245):245ra93–245ra93. doi: 10.1126/scitranslmed.3008973 [DOI] [PubMed] [Google Scholar]
- 7.Mazal A, Prezado Y, Ares C, et al. FLASH and minibeams in radiation therapy: the effect of microstructures on time and space and their potential application to protontherapy. Br J Radiol. 2020;93(1107):20190807. doi: 10.1259/bjr.20190807 [DOI] [PMC free article] [PubMed] [Google Scholar]
- 8.Chetty IJ, Curran B, Cygler JE, et al. Report of the AAPM Task Group No. 105: Issues associated with clinical implementation of Monte Carlo-based photon and electron external beam treatment planning: AAPM Task Group Report No. 105: Monte Carlo-based treatment planning. Med Phys. 2007;34(12):4818–4853. doi: 10.1118/1.2795842 [DOI] [PubMed] [Google Scholar]
- 9.van de Water S, Safai S, Schippers JM, Weber DC, Lomax AJ. Towards FLASH proton therapy: the impact of treatment planning and machine characteristics on achievable dose rates. Acta Oncol. 2019;58(10):1463–1469. doi: 10.1080/0284186X.2019.1627416 [DOI] [PubMed] [Google Scholar]
- 10.van Marlen P, Dahele M, Folkerts M, Abel E, Slotman BJ, Verbakel WFAR. Bringing FLASH to the Clinic: Treatment Planning Considerations for Ultrahigh Dose-Rate Proton Beams. Int J Radiat Oncol • Biol • Phys. 2020;106(3):621–629. doi: 10.1016/j.ijrobp.2019.11.011 [DOI] [PubMed] [Google Scholar]
- 11.Rahman M, Ashraf MR, Zhang R, et al. Electron FLASH Delivery at Treatment Room Isocenter for Efficient Reversible Conversion of a Clinical LINAC. Int J Radiat Oncol. Published online January 2021. doi: 10.1016/j.ijrobp.2021.01.011 [DOI] [PMC free article] [PubMed] [Google Scholar]
- 12.Reynaert N, van der Marck SC, Schaart DR, et al. Monte Carlo treatment planning for photon and electron beams. Radiat Phys Chem. 2007;76(4):643–686. doi: 10.1016/j.radphyschem.2006.05.015 [DOI] [Google Scholar]
- 13.Arce P, Ignacio Lagares J, Harkness L, et al. Gamos: A framework to do Geant4 simulations in different physics fields with an user-friendly interface. Nucl Instrum Methods Phys Res Sect Accel Spectrometers Detect Assoc Equip. 2014;735:304–313. doi: 10.1016/j.nima.2013.09.036 [DOI] [Google Scholar]
- 14.Agostinelli S, Allison J, Amako K, et al. Geant4—a simulation toolkit. Nucl Instrum Methods Phys Res Sect Accel Spectrometers Detect Assoc Equip. 2003;506(3):250–303. doi: 10.1016/S0168-9002(03)01368-8 [DOI] [Google Scholar]
- 15.Gammex. Solid Water ® HE: On the dosimetric accuracy of a next-generation water mimicking solution (white paper). Middlet WI Sun Nucl Corp. [Google Scholar]
- 16.EL Bakkali J, EL Bardouni T. Validation of Monte Carlo Geant4 code for a 6 MV Varian linac. J King Saud Univ - Sci. 2017;29(1):106–113. doi: 10.1016/j.jksus.2016.03.003 [DOI] [Google Scholar]
- 17.Rahman M, Bruza P, Lin Y, Gladstone DJ, Pogue BW, Zhang R. Producing a Beam Model of the Varian ProBeam Proton Therapy System using TOPAS Monte Carlo Toolkit. Med Phys. Published online October 8, 2020. doi: 10.1002/mp.14532 [DOI] [PMC free article] [PubMed] [Google Scholar]
- 18.Smilowitz JB, Das IJ, Feygelman V, et al. AAPM Medical Physics Practice Guideline 5.a.: Commissioning and QA of Treatment Planning Dose Calculations - Megavoltage Photon and Electron Beams. J Appl Clin Med Phys. 2015;16(5):14–34. doi: 10.1120/jacmp.v16i5.5768 [DOI] [PMC free article] [PubMed] [Google Scholar]
- 19.León‐Marroquín EY, Mulrow D, Darafsheh A, Khan R. Response characterization of EBT‐XD radiochromic films in megavoltage photon and electron beams. Med Phys. 2019;46(9):4246–4256. doi: 10.1002/mp.13708 [DOI] [PubMed] [Google Scholar]
- 20.Zhang A, Wen N, Nurushev T, Burmeister J, Chetty IJ. Comprehensive evaluation and clinical implementation of commercially available Monte Carlo dose calculation algorithm. J Appl Clin Med Phys. 2013;14(2):127–145. doi: 10.1120/jacmp.v14i2.4062 [DOI] [PMC free article] [PubMed] [Google Scholar]
- 21.Esplen N, Mendonca MS, Bazalova-Carter M. Physics and biology of ultrahigh dose-rate (FLASH) radiotherapy: a topical review. Phys Med Biol. 2020;65(23):23TR03. doi: 10.1088/1361-6560/abaa28 [DOI] [PubMed] [Google Scholar]
- 22.Bazalova-Carter M, Qu B, Palma B, et al. Treatment planning for radiotherapy with very high-energy electron beams and comparison of VHEE and VMAT plans: Treatment planning for VHEE radiotherapy. Med Phys. 2015;42(5):2615–2625. doi: 10.1118/1.4918923 [DOI] [PubMed] [Google Scholar]
- 23.Cao X, Zhang R, Esipova TV, et al. Quantification of Oxygen Depletion During FLASH Irradiation In Vitro and In Vivo. Int J Radiat Oncol. Published online May 2021:S0360301621003588. doi: 10.1016/j.ijrobp.2021.03.056 [DOI] [PMC free article] [PubMed] [Google Scholar]
- 24.Vozenin M-C, Hendry JH, Limoli CL. Biological Benefits of Ultra-high Dose Rate FLASH Radiotherapy: Sleeping Beauty Awoken. Clin Oncol. 2019;31(7):407–415. doi: 10.1016/j.clon.2019.04.001 [DOI] [PMC free article] [PubMed] [Google Scholar]
- 25.Favaudon V, Fouillade C, Vozenin M-C. Radiothérapie « flash » à très haut débit de dose : un moyen d’augmenter l’indice thérapeutique par minimisation des dommages aux tissus sains ? Cancer/Radiothérapie. 2015;19(6–7):526–531. doi: 10.1016/j.canrad.2015.04.006 [DOI] [PubMed] [Google Scholar]
- 26.Paganetti H Monte Carlo simulations will change the way we treat patients with proton beams today. Br J Radiol. 2014;87(1040):20140293. doi: 10.1259/bjr.20140293 [DOI] [PMC free article] [PubMed] [Google Scholar]
- 27.Schüler E, Trovati S, King G, et al. Experimental Platform for Ultra-high Dose Rate FLASH Irradiation of Small Animals Using a Clinical Linear Accelerator. Int J Radiat Oncol. 2017;97(1):195–203. doi: 10.1016/j.ijrobp.2016.09.018 [DOI] [PubMed] [Google Scholar]
- 28.Lempart M, Blad B, Adrian G, et al. Modifying a clinical linear accelerator for delivery of ultra-high dose rate irradiation. Radiother Oncol. 2019;139:40–45. doi: 10.1016/j.radonc.2019.01.031 [DOI] [PubMed] [Google Scholar]
- 29.Nath R, Epp ER, Laughlin JS, Swanson WP, Bond VP. Neutrons from high-energy x-ray medical accelerators: An estimate of risk to the radiotherapy patient. Med Phys. 1984;11(3):231–241. [DOI] [PubMed] [Google Scholar]
Associated Data
This section collects any data citations, data availability statements, or supplementary materials included in this article.
Supplementary Materials
Data Availability Statement
Research data are stored in an institutional repository and will be shared upon request to the corresponding author. The beam model implementation methods can be found on https://github.com/optmed/eFLASHBeamModeltoTPS.


