Abstract
Supported catalytically active liquid metal solution (SCALMS) materials represent a recently developed class of heterogeneous catalysts, where the catalytic reaction takes place at the highly dynamic interface of supported liquid alloys. Ga nuggets were dispersed into nano-droplets in propan-2-ol using ultrasonication followed by the addition of Pt in a galvanic displacement reaction – either directly into the Ga/propan-2-ol dispersion (in situ) or consecutively onto the supported Ga droplets (ex situ). The in situ galvanic displacement reaction between Ga and Pt was studied in three different reaction media, namely propan-2-ol, water, and 20 vol% water containing propan-2-ol. TEM investigations reveal that the Ga–Pt reaction in propan-2-ol resulted in the formation of Pt aggregates on top of Ga nano-droplets. In the water/propan-2-ol mixture, the desired incorporation of Pt into the Ga matrix was achieved. The ex situ prepared Ga–Pt SCALMS were tested in n-heptane dehydrogenation. Ga–Pt SCALMS synthesized in pure alcoholic solution showed equal dehydrogenation and cracking activity. Ga–Pt SCALMS prepared in pure water, in contrast, showed mainly cracking activity due to oxidation of Ga droplets. The Ga–Pt SCALMS material prepared in water/propan-2-ol resulted in high activity, n-heptene selectivity of 63%, and only low cracking tendency. This can be attributed to the supported liquid Ga–Pt alloy where Pt atoms are present in the liquid Ga matrix at the highly dynamic catalytic interface.
The preparation of supported catalytically active metal solutions has been investigated using ultrasonication. Sonication conditions and solvents influence the Ga droplet formation and hence the catalytic performance in heptane dehydrogenation.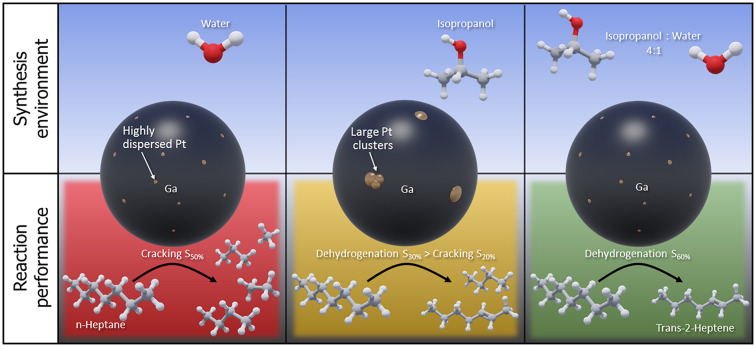
Introduction
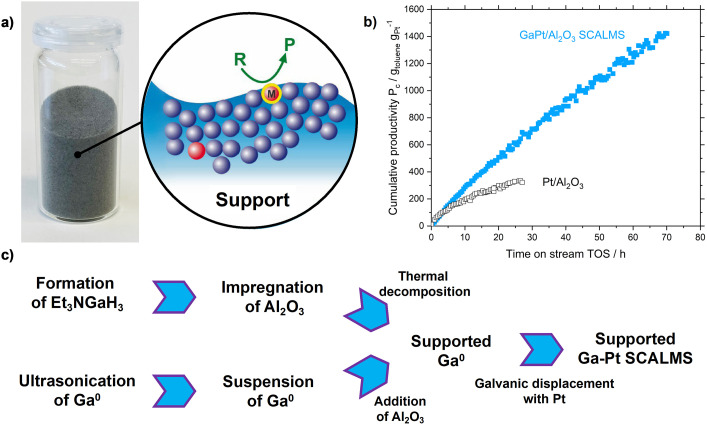
The role of catalysts in industrial processes such as the production of chemicals, materials, and fuels is crucial. In contrast to homogeneous catalysts, which offer high selectivity due to their well-defined active sites, classical heterogeneous catalysis is characterized by good thermal stability and easy product–catalyst separation at the expense of lower selectivity due to a high variety of exposed active sites.1–3 One strategy to design improved catalysts is to create systems that merge the advantages of heterogeneous and homogeneous catalysis. In this regard, supported liquid-phase catalysis is seen as an attractive strategy.4 This concept was successfully used in supported ionic liquid phase (SILP). However, this concept is typically restricted to reaction temperatures below 200 °C due to the thermal instability of ionic liquids with organic ions.5 This limitation can be overcome using supported liquid alloys in the recently introduced concept of supported catalytically active liquid metal solution (SCALMS, see Fig. 1a). Hereby, liquid metal alloy droplets of an inert low-melting metal (e.g. Ga) and a small fraction (typically <2 at%) of an active metal (e.g. Pd, Pt, Rh, Ni) are supported on porous inert support materials, such as SiO2 or Al2O3.6 Since these alloys are rich in the low-melting metal they turn into supported liquid droplets under typical reaction conditions. SCALMS systems were successfully applied for butane dehydrogenation using GaPd,6 for propane dehydrogenation using GaRh (ref. 7) and GaPt,8 and for methylcyclohexane dehydrogenation using GaPt.9 More recently, we showed the feasibility of ethylene dimerization using non-noble GaNi (ref. 10) materials. For gas-phase reactions, the SCALMS concept provides a dynamic liquid alloy-reactant gas interface, with outstanding properties compared to classical heterogeneous catalysts with respect to activity and stability (see Fig. 1b), in particular coking resistance.6–9,11 As in SCALMS systems the concentration of active metal compared to the liquid matrix metal is very low, the active metal has been found to be exposed in form of single-atom active sites at the liquid interface to the gaseous reactants.6,12,13 This special nature of the active sites in GaPt (ref. 14) and GaRh (ref. 7) systems was evidenced by infrared reflection–absorption spectroscopy (IRAS) and density functional theory (DFT) calculations, respectively. This single atom behavior has been confirmed for GaPt with ultra-low Pt loadings (<0.1 × 10⁻³ at%) in the electrochemical oxidation of methanol by Rahim et al.13
Fig. 1. a) Photograph of GaPt SCALMS on Al2O3 with schematic magnification of interface. b) Stability of GaPt SCALMS in dehydrogenation of methylcyclohexane compared to standard Pt/Al2O3 at 723 K and ambient pressure, exemplified by cumulative productivity. c) Schematic procedure for the two preparation ways of SCALMS using organometallic precursors (see top) and elemental Ga nuggets (see bottom). The final incorporation of Pt via galvanic displacement is identical.
The first generation of Ga-based SCALMS catalysts was synthesized via an organometallic route that involved (Et3N)GaH3 as volatile Ga precursor (see Fig. 1c). However, (Et3N)GaH3 is very air-sensitive and hence its synthesis and handling require strictly inert conditions. Additionally, since large excess of LiH is required for the synthesis, the process produces a significant amount of noxious waste, hampering the scalability of this SCALMS preparation route.15 Typically, less than 5% of the atoms in the starting materials show up in the final catalyst (see ESI† for details). Therefore, an alternative top-down synthetic procedure has been introduced recently.8 This scalable approach includes only two process steps: in the first step, elemental Ga is dispersed into micro- and nano-droplets in propan-2-ol using ultrasonication, creating a stable Ga/propan-2-ol dispersion. In the second step, the catalytically active metal is introduced into the elemental Ga droplets via galvanic displacement (see Fig. 1c). Conversely to the previously applied precursor route using (Et3N)GaH3, the synthesis of SCALMS via the top-down sonification route produces no waste and is characterized by nearly 100% atom efficiency.8
Ultrasonication is widely used to reduce the droplet size of liquid metals such as Ga (ref. 8, 16 and 17) and its eutectic mixtures, such as GaIn (ref. 18–22) and GaInSn (ref. 23) (see Table S1† for details). The average particle size formed during ultrasonication depends on the geometry of the sonication vessel, total power input, sonication amplitude, duration, and temperature as well as on the physicochemical properties of the continuous phase.17,24 It has been reported that by using ethanol or propan-2-ol as continuous phase under ambient conditions, a high yield of Ga nano-droplets is obtained, without the need for stabilizers or surfactants.18,19,25 The exact reason for the Ga droplet stability is not clear. It is supposed that the formation of a Ga2O3 passivation skin and/or the formation of a carbon layer coating the surface of the Ga nano-droplets provides stabilization.22,23,26 However, recent work by Creighton et al.19 supports the conclusion of a dominant stabilization by a Ga2O3 passivation layer. These authors showed that working under ambient atmosphere Ga droplets with a mean particle size of ∼150 nm are produced while identical conditions in an oxygen-free and moisture-free atmosphere resulted in the formation of much larger Ga droplets in the range of 1 to 2 μm.19
The introduction of precious metals into a Ga matrix can be carried out using the galvanic displacement reaction (GDR). GDR represents a simple and versatile method to synthesize tailored bimetallic nanostructures. The method offers control over composition, size, shape, and internal structure.27–31 GDR is a redox process, in which a metal is replaced by the ions of a second metal when they come into contact in a solution phase. In principle, the GDR should occur spontaneously between any two metals with a favorable driving force, i.e., a suitable difference in their reduction potentials.27 The morphology of bimetallic nanoparticles or nano-droplets obtained by GDR is affected by the reactivity of the metals involved, the concertation of metallic ions, and the reaction temperature.27,32 Since GDR depends on the difference in reduction potentials of the metals (determined under standard conditions), the involvement of non-standard conditions can affect the actual reduction potential. This can slow down, reverse, or even prevent the replacement reaction.27 Even though the majority of applications are limited to “solid” metallic nanoparticles, recently this elegant approach was extended to “liquid” metal alloy such as galinstan and its reaction with Pt,28 Ag,29,32 Au,29,32 Cu,30,32 and Sn (ref. 32) to form bimetallic nanoparticles. More recently, the chemical reactivity of liquid gallium in galvanic displacement reaction with Cu,33–35 Ni,33 Sn,33 and Cd (ref. 33) was explored. However, to the best of our knowledge, the factors affecting the galvanic displacement reaction between liquid gallium droplets and Pt ions have not been studied yet, which is somewhat surprising given the high relevance of supported Ga–Pt droplets for catalytic applications.8,9
If Ga-based SCALMS materials are handled in contact with air, the Ga droplets are normally surrounded by a thin Ga2O3 passivation layer. Even though metallic gallium is inert for C–H bond activation,6 Ga2O3 is a known catalyst for alkane dehydrogenation reactions36–38 but shows fast deactivation behavior.38 Additionally, Ga2O3 is an amphoteric oxide and has been found to act as a bifunctional catalyst, e.g., to promote the conversion of alkanes to aromatics via heterolytic dissociation over Lewis acid/base pairs37,39 or for the cracking of longer alkanes to lighter ones.39–41 For the direct dehydrogenation of alkanes to n-alkenes, however, a clean noble metal surface is beneficial.2 Hence, the conversion of alkanes to n-alkenes can be regarded as a good test reaction to find out whether a given catalyst material acts as a cracking, cyclization, isomerization, or as a dehydrogenation catalyst depending on the nature of its active sites.42 While noble metals, such as Pt, are well known to activate or recombine H2, metal oxides such as Ga2O3 can promote acid-catalyzed isomerization and cyclization reactions.42,43 The concerted action of both noble metal sites and acid sites enables hydrocracking, hydroisomerization, dehydrocyclization, and aromatization reactions. Since Ga2O3-rich catalysts are less selective in direct n-alkane dehydrogenation the reductive removal of this oxide skin (e.g., by pre-formation with hydrogen) has been found crucial to reaching high n-alkene selectivities.36,39,44
In Ga-based SCALMS, the thickness of the Ga2O3 passivation layer on the supported Ga droplets depends on the synthetic protocol and the synthesis conditions (i.e., moisture content of the applied solvents, calcination temperature, etc.). Fortunately, the Ga2O3 layer can be reduced to Ga0 under a reductive atmosphere in the presence of noble metals such as Pt.36 Hydrogen pre-treatment at elevated temperatures is thus able to remove the Ga2O3 skin before reaction. However, if the Ga2O3 layer becomes too thick the reduction of the oxide layer may not be complete and the resulting presence of some leftover Ga2O3 can lead to side reactions.
It has also been reported that Ga2O3 can form mixed oxides with oxidic supports, such as Al2O3, and that the resulting mixed oxide is more difficult to reduce.36,45–47 Therefore, it is important to keep the oxidation of the Ga droplet surface to a minimum during the SCALMS preparation to enable catalysis with reduced supported Ga–Pt droplets after reductive catalyst activation.
In this contribution, we present a detailed investigation of the synthesis of Ga nano-droplets using ultrasonication. In addition, we study the effect of the reaction medium on GDR between Ga and Pt as well as on the morphology of the Ga–Pt nanocomposites formed. Finally, we investigate the effect of these catalyst material synthesis parameters on the resulting catalytic performance in n-heptane dehydrogenation.
Experimental
All chemicals were used as received. Al2O3 support (Brockmann activity I, pH: 7.0 ± 0.5, particle size: 50–150 μm, Sigma Aldrich), gallium nuggets (size: 3 mm, purity: 99.999%, Materion), chloroplatinic acid hexahydrate (Pt basis: ≥37.50%, Sigma-Aldrich), and anhydrous propan-2-ol (purity: ≥99.8%, water content max.: 0.003%, VWR Chemicals) were used for catalyst preparation. The reaction substrate n-heptane (≥99%) was purchased from Honeywell.
Preparation of Ga dispersion
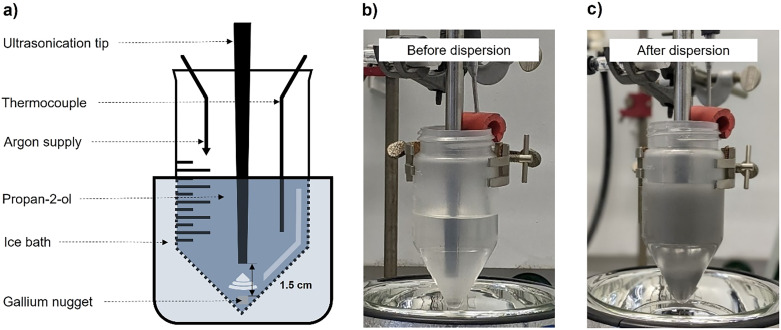
For the preparation of the Ga nano-droplets, a Ga nugget suspended in propan-2-ol was subjected to ultrasonic irradiation. The set-up for this procedure included an ultrasonic generator with a probe (Branson 450 digital sonifier, 400 W, equipped with a ¼′′ tip), a thermometer for temperature regulation, a sonication vessel (conical-bottom plastic bottle, 250 mL), an inert gas supply, and an ice-water cooling bath as shown in Fig. 2. 0.5 g of gallium and 100 mL of anhydrous propan-2-ol were placed in the sonication vessel. To avoid excessive moisture contamination, the top surface of the sonication vessel was continuously purged with argon gas. The tip of the sonication probe was kept at approx. 1.5 cm above the gallium nugget. During ultrasonication, at first, the solid gallium nugget melted (mpGa = 303 K) as the temperature of the solvent rose due to the heat generated during ultrasonication. Thereafter, the liquid gallium was dispersed into nano-droplets through the ultrasound-induced cavitation process creating a dispersion of gallium in propan-2-ol. The temperature inside the sonication vessel was always kept below 323 K. The temperature probe inserted into the solvent continuously measured the temperature of the solvent and triggered the automatic shut-off of the ultrasonic generator if the temperature exceeded 323 K. The temperature of the solvent was controlled by immersing the sonication vessel in an ice-water bath. The sonication was continued for 120 minutes at a given amplitude (20, 40, 60, or 80%; power input of 10, 25, 45 and 70 W, respectively) even though the gallium nugget was completely dispersed in the solvent after nearly 10 minutes. The probes for DLS and SEM analyses were taken at an interval of 30 minutes under irradiation. After ultrasonication, the Ga dispersion was transferred to a storage bottle, and an additional 40 mL propan-2-ol was used to wash the sonication vessel. Thus, this procedure produced 0.5 g of Ga nano-droplets dispersed in 140 mL of propan-2-ol.
Fig. 2. a) Schematic view of the applied ultrasonication set-up used to produce Ga-nano-droplets dispersed in propan-2-ol. b) Propan-2-ol and Ga nugget before dispersion. c) Ga/propan-2-ol dispersion after ultrasonic irradiation. Note that the higher liquid level after dispersion stems from additional solvent wash.
Ga–Pt galvanic displacement reaction in dispersion
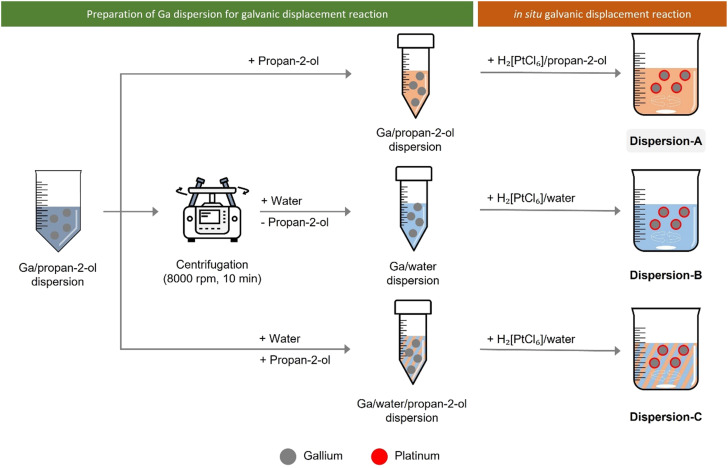
To study the effect of solvents on the Ga–Pt GDR, we monitored the Pt consumption in Ga/propan-2-ol dispersion in absence of any support material. For this experiment, the Ga dispersion was prepared as described before. Next, hexachloroplatinic acid was added to this dispersion to start the GDR as described below and illustrated in Fig. 3.
Fig. 3. Illustration of in situ galvanic displacement reaction of Ga and Pt in Ga dispersion in propan-2-ol (dispersion-A), water (dispersion-B), and water/propan-2-ol mixture (dispersion-C). Galvanic displacement reaction happens directly on suspended Ga droplets in the dispersion.
Dispersion A – galvanic displacement in pure propan-2-ol
The Ga/propan-2-ol dispersion (140 mL) was prepared and transferred into a 250 mL glass beaker. The dispersion was stirred at 1000 rpm at room temperature and the required volume of hexachloroplatinic acid solution in propan-2-ol (3.8 mg Pt mL−1) was added at once to obtain a Ga to Pt atomic ratio of 50 (dispersion A in Fig. 2). To keep the Pt concentration constant, the total volume was kept at 150 mL by adjusting the amount of Pt stock solution and propan-2-ol added.
Dispersion B – galvanic displacement in pure aqueous dispersion
In this case, the Ga/propan-2-ol dispersion (140 mL) was centrifuged at 8000 rpm for 10 min. Then, the supernatant liquid was carefully removed and the resulting Ga droplets were re-dispersed in 140 mL of deionized water. This washing step was repeated twice to obtain an alcohol-free Ga/water dispersion. After the final washing step, the resulting Ga droplets were ultrasonicated in an ultrasonic bath for 30 min to produce a well-dispersed Ga/water dispersion. This Ga/water dispersion was stirred at 1000 rpm at room temperature in a 250 mL glass beaker and the required volume of hexachloroplatinic acid solution in water (4.4 mg Pt mL−1) was added at once to obtain a Ga to Pt atomic ratio of 50 (dispersion B in Fig. 3). To keep the Pt concentration constant, the total volume was kept at 150 mL by adjusting the amount of Pt stock solution and water added.
Dispersion C – galvanic displacement in water/propan-2-ol mixture
In this case, additional propan-2-ol and deionized water were added to the Ga/propan-2-ol dispersion to obtain a 20 vol% water in propan-2-ol mixture. This Ga dispersion was stirred at 1000 rpm at room temperature in a 250 mL glass beaker and the required volume of hexachloroplatinic acid solution in water (4.4 mg Pt mL−1) was added at once to obtain a Ga to Pt atomic ratio of 50 (dispersion C in Fig. 2). To keep the Pt concentration constant, the total volume was kept at 150 mL by adjusting the amount of Pt stock solution and water and propan-2-ol added.
To monitor the depletion of Pt concentration from the continuous phase of the dispersion, aliquots of 2 mL were taken every 2 minutes using a syringe and immediately filtered using a 0.1 μm syringe filter to remove Ga droplets. The syringe filter was then washed 3 times with 3 mL propan-2-ol or water. This filtered solution was analyzed for its Pt content using ICP-AES to monitor the remaining Pt in the solution. From this, the depletion of Pt from the continuous phase was calculated, which corresponds to the amount of Pt reacted with Ga.
Preparation of Ga–Pt SCALMS
The first step of the Ga–Pt SCALMS preparation is the synthesis of Ga decorated support. For this purpose, Al2O3 support material was added to the dispersed Ga to achieve a 3 wt% loading of Ga on alumina. The solvent was then slowly evaporated under vacuum at 313 K using a rotary evaporator. The solid obtained was then calcined for 2 hours at 773 K under ambient conditions. The exact loading of Ga was determined by ICP-AES. Given the Ga loading (in wt%) of the material, the added amount of stock solution was adjusted to obtain the desired final Ga/Pt ratio, accounting for the loss of Ga due to the redox reaction between the latter and the Pt4+ cation (see Scheme 1 and eqn (1)).
 |
1 |
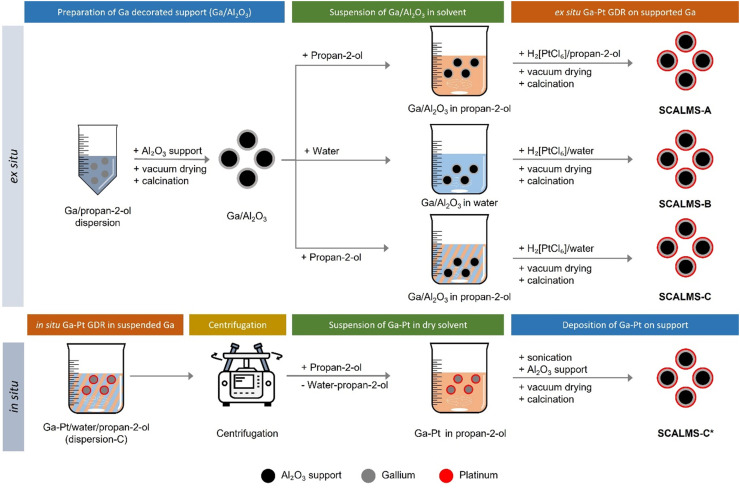
The procedure for the ex situ preparation of each of the Ga–Pt SCALMS is described below (see Fig. 4). To keep the Pt concertation constant in each sample, the GDR was always carried out in 50 mL total volume. The Ga–Pt SCALMS-A catalyst was prepared in a dry alcoholic solution. 10 g of Ga decorated Al2O3 was suspended in 40 mL of anhydrous propan-2-ol. Then, the required amount of the hexachloroplatinic acid stock solution (3.8 mg Pt mL−1 in anhydrous propan-2-ol) was added to achieve the desired Ga to Pt ratio. Then, additional propan-2-ol was added to bring the total volume to 50 mL. The Ga–Pt SCALMS-B catalyst was prepared in an aqueous solution. 10 g of Ga decorated Al2O3 was suspended in 40 mL of deionized water. Then, the required amount of the hexachloroplatinic acid stock solution (4.4 mg Pt mL−1 in deionized water) was added to achieve the desired Ga to Pt ratio. Additional water was finally added to bring the total volume to 50 mL. Finally, the Ga–Pt SCALMS-C catalyst was prepared in an alcoholic solution with 20 vol% water content. 10 g of Ga decorated Al2O3 was suspended in 40 mL of propan-2-ol. Then, the required amount of an aqueous stock solution of hexachloroplatinic acid (4.4 mg Pt mL−1 in deionized water) was added to achieve the desired Ga to Pt ratio. Additional water was then added to bring the total volume to 50 mL.
Scheme 1. Galvanic displacement for the adjustment of a certain Pt content in a SCALMS catalyst. The final Ga/Pt ratio is obtained by the mass ratio of Ga (mGa) and Pt (mPt) on the support accounting for the galvanic displacement reaction.
Fig. 4. Preparation of different Ga–Pt SCALMS catalysts by ex situ galvanic displacement reaction in propan-2-ol, water, and water/propan-2-ol mixture. Ultrasonication of Ga is followed by deposition of the Ga droplets onto Al2O3 support material. The galvanic displacement reaction between Ga–Pt happens on supported Ga droplets on Al2O3.
All SCALMS materials were dried after preparation under vacuum at 313 K using a rotary evaporator. The resulting materials were then calcined for 2 hours at 773 K under ambient conditions. The final loading of Ga and Pt was verified by ICP-AES.
For in situ preparation of Ga–Pt SCALMS-C*, the GDR was carried out directly in the Ga-dispersion in a water/propan-2-ol mixture (see Fig. 4). To the Ga stock solution additional propan-2-ol and deionized water was added to obtain 20 vol% water content. This Ga dispersion was stirred at 1000 rpm at room temperature in a 250 mL glass beaker and the required volume of hexachloroplatinic acid solution in water (4.4 mg Pt mL−1) was added at once to obtain a Ga to Pt atomic ratio of 50. To keep the Pt concentration constant, the total volume was kept at 150 mL by adjusting the amount of Pt stock solution and additional water or propan-2-ol added. After completion of the galvanic displacement reaction, the resulting dispersion was centrifuged at 8000 rpm for 10 min. Then the supernatant was carefully removed, and the resulting Ga droplets were re-dispersed in 150 mL propan-2-ol. This washing step was repeated twice to remove most of the water and to obtain an almost water-free Ga/propan-2-ol dispersion. The resulting Ga droplets were then ultrasonicated (sonication bath) for 30 min to produce a well-dispersed Ga/propan-2-ol dispersion. This material was then deposited on Al2O3, dried under vacuum at 313 K using a rotary evaporator, and finally calcined for 2 hours at 773 K under ambient conditions to get the in situ prepared SCALMS-C* material (see Fig. 4).
Characterization methods
The content of Pt and Ga, and hence their ratio, was determined by inductively coupled plasma-atomic emission spectroscopy (ICP-AES) using a Ciros CCD (Spectro Analytical Instruments GmbH). The solid samples were digested with concentrated HCl : HNO3 : HF in a 3 : 1 : 1 ratio in volume, using microwave heating up to 493 K for 40 min. The instrument was calibrated for Pt (214.123 nm) and Ga (417.206 nm) with standard solutions of the respective elements prior to the measurements.
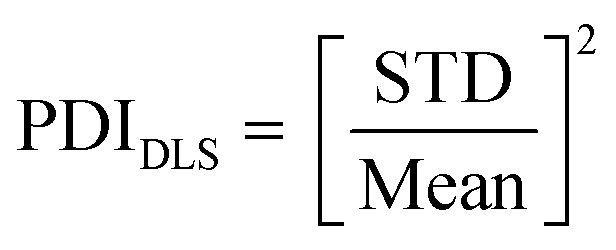
Particle size analysis was performed using dynamic light scattering (DLS) measurements. For this purpose, the Ga dispersions were further diluted in clean propan-2-ol (ratio ∼ 1 : 20) and the resulting solution was analyzed using a Zetasizer device (Malvern Panalytical). The polydispersity index PDIDLS based on DLS measurements was calculated by taking the square of the ratio between standard deviation (STD) and mean value according to eqn (2).
 |
2 |
Hence, values of PDIDLS < 0.1 indicate a narrow, monodisperse distribution. Moderate, polydisperse distributions are found for PDIDLS values between 0.1 and 0.4 while broad, polydisperse distributions are characterized by a PDIDLS value above 0.4.
Transmission electron microscopy (TEM) images were recorded on an analytical Phillips CM30 TEM instrument using beam energy of 200 kV, equipped with a 2 K CCD camera. Samples were drop-casted onto a copper TEM grid, coated with a carbon film, and dried in a covered Petri dish before imaging.
Scanning Electron Microscopy (SEM) analyses were carried out using a Phenom Desktop SEM (BSD detector, 15 kV voltage). The particles were deposited directly on a conductive sticky carbon pad and dried under ambient conditions before measurement.
Catalytic testing – gas-phase dehydrogenation of n-heptane
Catalytic dehydrogenation of n-heptane was carried out in a fixed-bed tubular reactor. A continuous flow laboratory mini-plant was used for this purpose (see Fig. S4 and S5 in the ESI†). The catalyst (2.5 g) prepared as described before was placed in the isothermal zone of the tubular reactor (material: Inconel®, inner diameter: 10 mm, length: 500 mm) between two quartz wool beds. The tubular reactor is positioned inside an electrically heated tubular split furnace (manufacturer: Carbolite). Prior to every reaction, the catalyst was pre-treated under 50 mLN min−1 H2 (purity: 99.99%, Linde Gas) at 723 K for 2 hours. This step is suitable for removing the oxide skin of the supported Ga–Pt droplets from preparation and storage. Following this pre-treatment, the reactor was flushed with 100 mLN min−1 He (purity: 99.996%, Linde Gas) for 30 minutes and allowed to cool down to the reaction temperature of 703 K. Once the temperature stabilized, the reactor was sealed under an inert atmosphere and the flow of the reaction mixture was started through the by-pass. The reaction mixture included 0.062 g min−1n-heptane, 118.87 mLN min−1 H2, and 14.86 mLN min−1 He. Liquid n-heptane was vaporized in the stream of H2 and He and mixed thoroughly in the evaporator. When the desired concentration of the reactants was achieved, the reaction was started by closing the by-pass line and diverting the flow of the reaction gas mixture to the reactor. The gas hourly space velocity (GHSV) was 3320 mLgas gcat-bed−1 h−1 and the residence time (τ) was 1.1 s (standard conditions apply).
Online analysis of reaction products
The exiting product stream was analyzed by gas chromatography (GC) using an Agilent 7820A GC equipped with a Restek Rtx®-100-DHA column (100 m, 0.25 mm ID, 0.5 μm coating) coupled with Restek Rtx®-5-PONA tuning column (5 m, 0.25 mm ID, 1.0 μm coating) and a flame ionization detector (FID). Since the relative response factors of all the hydrocarbons were close to unity,48 the mole fractions of all components i (xi) were calculated directly from the peak areas (for details see ESI†). Further details including products detected, their classification, and sample chromatograms are provided in the ESI† (Fig. S6, Table S3, eqn (S7)–(S10)).
Results and discussion
Synthesis of Ga nano-droplets via ultrasonication
Firstly, we investigated the effect of the ultrasonication parameter to optimize the synthesis of Ga nano-droplets under ambient conditions and propan-2-ol as the continuous phase. The total energy input in form of the ultrasonication amplitude was varied from 20% to 80% in steps of 20%. The particle size distribution (PSD) was determined using dynamic light scattering (DLS) measurements. PSD data obtained from DLS data were further validated by SEM imaging (see Fig. S2 in ESI†).
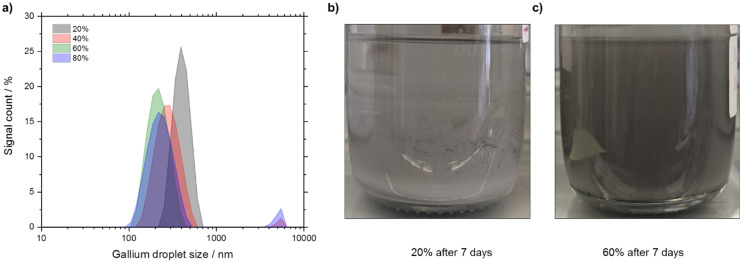
From the particle size vs. intensity graph (see Fig. 5a) it is seen that ultrasonication at 20% amplitude generates Ga droplets with larger particle size compared to the 40%, 60%, and 80% amplitudes. While ultrasonication at 20% and 60% produced Ga droplets with unimodal distribution, experiments with the 40% and 80% amplitudes resulted in bimodal distribution in our experiments. In terms of intensity-based harmonic mean, i.e., Z-average, 60% amplitude produced the lowest Z-average value of 206 nm, while at 80% the Z-average value was more than double at around 525 nm (see Table 1). When increasing the amplitude from 20% to 60%, the polydispersity index (PDIDLS) based on DLS measurements reduced from a value of 0.4 to 0.2 but further increasing the amplitude to 80% increased PDIDLS to ∼0.3. In all cases we produced Ga droplets population with a moderate polydispersity (PDIDLS = 0.1 to 0.4).
Fig. 5. a) Particle size distribution of Ga droplets obtained from ultrasonication of Ga in propan-2-ol at different sonication amplitudes (20%, 40%, 60%, and 80%). Sonication time was 120 min in all cases. b) Photograph of the Ga dispersion at 20% amplitude after 7 days. c) Photograph of the Ga dispersion at 60% amplitude after 7 days.
Effect of ultrasonication amplitude on Z-average and PDIDLS.
| Amp./% | Z-avg./nm | PDIDLS/— | ||||||
|---|---|---|---|---|---|---|---|---|
| 30 min | 60 min | 90 min | 120 min | 30 min | 60 min | 90 min | 120 min | |
| 20 | — | — | — | 525 | — | — | — | 0.40 |
| 40 | — | — | — | 277 | — | — | — | 0.24 |
| 60 | 264 | 248 | 213 | 206 | 0.31 | 0.27 | 0.22 | 0.20 |
| 80 | — | — | — | 249 | — | — | — | 0.29 |
The PDIDLS of the Ga droplets obtained in this work is comparable to the results reported by Yamaguchi et al.17 These authors, however, applied thiols as stabilizers. We also monitored the progression of Z-average and PDIDLS as a function of time at 60% amplitude (see Table 1).
Increasing the ultrasonication duration showed a positive effect in terms of reducing the Z-average as well as the PDIDLS. Increasing the ultrasonication duration from 30 to 90 min resulted in a 20% reduction in Z-average (from 264 nm to 213 nm) and in a 30% reduction in PDIDLS (from 0.31 to 0.22). Further increasing the duration to 120 min showed, however, only minor improvement in terms of both Z-average (from 213 nm to 206 nm) and PDIDLS (0.22 to 0.20). Lower Z-average and PDIDLS for 60% amplitude also became evident in the stability of the Ga-dispersion (see Fig. 5b and c and S1 in ESI†). The Ga-dispersion obtained with 60% amplitude was stable for 7 days while the one obtained with 20% amplitude settled in less than 24 hours. Therefore, we chose sonication at 60% amplitude for 120 min as our standard synthesis procedure for the following experiments.
In situ Ga–Pt galvanic displacement reaction in Ga/propan-2-ol dispersion
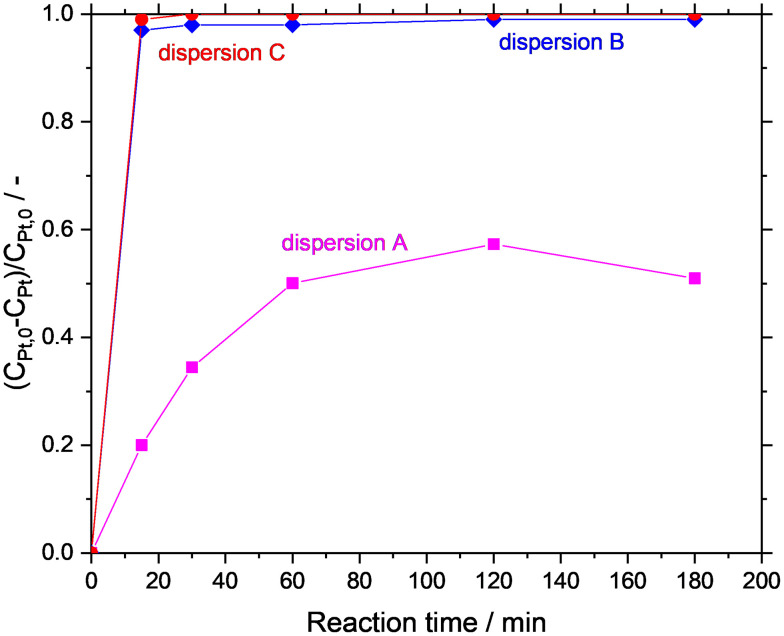
In the first set of experiments, the GDR was carried out in situ in the Ga dispersion in absence of support material. The Ga dispersions under investigation were prepared by using propan-2-ol (dispersion-A), water (dispersion-B), and water/propan-2-ol mixture (dispersion-C) as the continuous phase. The GDR between Ga and Pt was monitored by measuring the Pt concentration in the continuous phase of the dispersion over time. Fig. 6 shows the consumption of Pt from the continuous phase. It is clear from the graph that the Ga–Pt reaction was spontaneous in water-containing systems (i.e., dispersion-B and dispersion-C) as indicated by the complete consumption of Pt from the continuous phase within the first 15 min. Contrary to this, the Ga–Pt reaction in the water-free dispersion-A was found to be sluggish. After three hours of reaction time, only 50% of the Pt from the continuous phase had reacted with Ga.
Fig. 6. Kinetics of the galvanic displacement reaction monitored by the consumption of Pt from the continuous phase; propan-2-ol as continuous phase (orange, dispersion A), water as continuous phase (blue, dispersion B), and water/propan-2-ol mixture as continuous phase (red, dispersion C).
TEM analysis of synthesized Ga–Pt nano-droplets
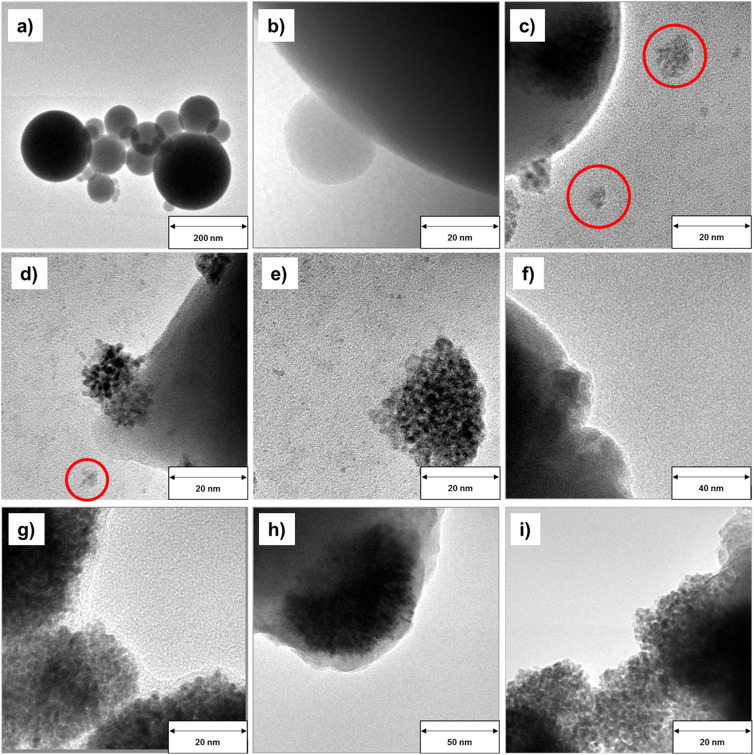
To further understand the effect of the different reaction media in the GDR on the morphology of the resulting Ga–Pt alloys, the obtained Ga–Pt nano-droplets, as well as pristine Ga nano-droplets, were investigated using transmission electron microscopy (TEM). Fig. 7a and b show the spherical morphology of pristine Ga nano-droplets prepared in propan-2-ol according to our optimized synthesis procedure. In this case, the liquid Ga nano-droplets are stabilized by a thin gallium oxide skin.19 This dispersion was used as the starting material for synthesizing Ga–Pt bimetallic nanocomposites. It is observed that all Ga–Pt materials show slightly deformed morphologies compared to pristine Ga nano-droplets. In samples derived from dispersion B, an aggregation of Pt clusters on the Ga nano-droplet surface is observed (Fig. 7c–e). A detailed analysis also indicates the presence of loose Pt structures (<20 nm) which might have been dislodged from the Ga nano-droplets after formation. In contrast, Ga–Pt materials obtained in the reaction using aqueous hexachloroplatinic acid solutions (dispersions B and C, see Fig. 7f–i) led to well-dispersed Pt nanocrystals and showed no indication of Pt cluster formation.
Fig. 7. TEM images of pristine unsupported Ga nano-droplets formed in propan-2-ol (a) and (b), Ga–Pt nano-droplets formed in propan-2-ol (c), (d), and (e), water (f) and (g), and a water/propan-2-ol mixture (h) and (i). Additionally, (e) shows Pt clusters formed in the Ga/propan-2-ol dispersion at higher magnification. Detached particles of Pt are indicated by red circles.
The driving force for the formation of Ga–Pt nanostructures by the GDR can be described using the Nernst equation (see eqn (S1) in ESI† for details).32 From the standard reduction potential of Ga and Pt, it is clear that the reaction is spontaneous due to the large thermodynamic driving force (i.e. E0 = +1.267 V). Since Ga0 has the lowest oxidation potential compared to Pt4+, Ga0 gets oxidized and releases Ga3+ ions and electrons. The released electrons take part in the reduction of Pt4+ ions to Pt0 which leads to the formation of the Ga–Pt alloy on the surface of the liquid Ga droplet.28,29 When the GDR in propan-2-ol and aqueous environments were compared, significant differences were found in terms of Ga–Pt reaction kinetics as well as Ga–Pt nanocomposites morphology. It should be noted that the standard reduction potential of metal ions is defined in aqueous media and hence different reduction potential values in alcoholic solvents can be expected.49 Even though the determination of standard reduction potential is often complicated in alcoholic solvents, it is known that the standard potential of a given metal ion is directly related to its solvation energy. The standard reduction potential is more negative in a solvent in which the metal ion solvation is stronger.50 It can be assumed that this shift in standard reduction potential of Ga3+/Ga0 and Pt4+/Pt0 considerably reduces the thermodynamic driving force (i.e. E0 < +1.267 V) of the GDR in this solvent. This is the reason for the slower GDR in case of the reaction in propan-2-ol as seen in Fig. 6.
The difference in morphology between Ga–Pt nanocomposites formed in water-free propan-2-ol and in the two different water-containing dispersions is understood from the fact that the reduction or oxidation of metal ions can proceed via different routes depending on the applied solvent. The reduction of Cu2+ to Cu0, for example, occurs in one step in aqueous media, but in two steps in an aprotic solvent such as acetonitrile (via Cu2+ → Cu+ → Cu0).50 Such differences in reaction mechanism can lead to different morphologies during the GDR.49 Apparently, in the case of Ga–Pt GDR in propan-2-ol, the strong interaction of the Pt atoms dominates the GDR process leading to Pt island formation according to a classical Volmer–Weber growth model.49 In contrast, the two aqueous systems form Ga–Pt nanocomposites with uniform Pt dispersion.
Results in the catalytic dehydrogenation of n-heptane
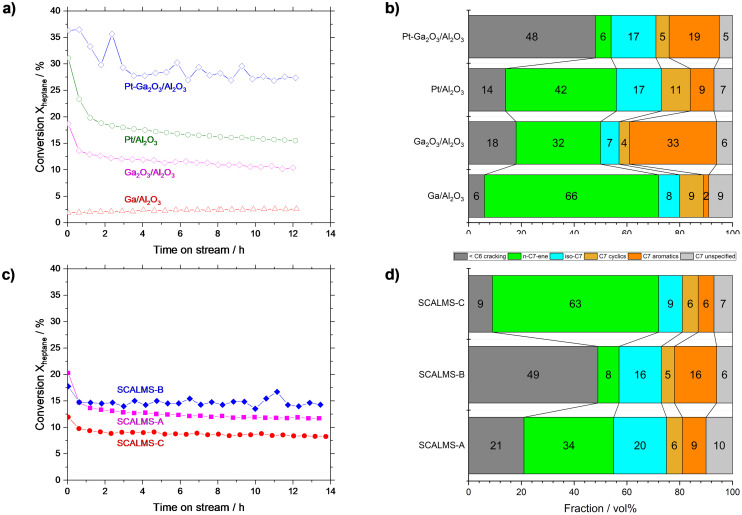
To pinpoint the role of the different components in our Ga–Pt SCALMS catalysts, we investigated their individual performance. For this purpose, pure metallic Ga0 on Al2O3 (Ga/Al2O3), pure gallium oxide (Ga2O3/Al2O3), commercially available platinum (Pt/Al2O3), and Ga2O3 on Al2O3 doped with Pt (Pt–Ga2O3/Al2O3) were investigated (reference catalyst syntheses procedures are given in ESI†). Given the complexity of the reaction network, a lumping model was used to simplify the product distribution analysis (for details see Table S3 in ESI†). The Ga/Al2O3 showed only <2.5% conversion (Fig. 8a), albeit with high n-heptene selectivity of 66% (Fig. 8b). Here, the very low conversion resulted in a high selectivity as many side-products are consecutive products from the activated alkene target product. Since Ga is inactive in C–H activation6 and bare Al2O3 showed no significant conversion in n-heptane dehydrogenation (see Fig. S7†), we attribute this low level of activity to the Ga2O3 passivation layer present on Ga droplets, which is known to be somewhat active in alkane activation.38,44 Still, the yield of n-heptenes was not very significant for the tested Ga/Al2O3 material compared to all the other catalyst samples under investigation (see Fig. 8a). Ga2O3/Al2O3 resulted in initial activity of 18%, but this declined rapidly within the first two hours, followed by a slow but steady decline in activity. Ga2O3/Al2O3 exhibited high aromatization (∼33%) and dehydrogenation (∼32%) tendency as well as significant cracking (∼18%), as shown in Fig. 8b). Noteworthy, the Ga2O3 phase showed clearly different reactivity and selectivity compared to metallic Ga (with Ga2O3 passivation layer). One explanation might be the presence of strong interactions between dispersed Ga2O3 and the oxidic support. In case of Al2O3 these interactions can lead to the formation of Ga–Al mixed oxides at the interface.46,47 Such mixed oxides, as well as bulk Ga2O3, offer weak surface acidity which is known to promote dehydrogenation, isomerization, and coking reactions.39,45–47
Fig. 8. Catalytic dehydrogenation of n-heptane with different catalysts. a) SCALMS catalysts prepared via the galvanic displacement reaction in different reaction media (Ga52Pt SCALMS-A, Ga54Pt SCALMS-B, Ga53Pt SCALMS-C). b) Lumped selectivities (after 12 h time on stream) of SCALMS catalysts. c) Individual building blocks of SCALMS, prepared by incipient wet impregnation. d) Lumped selectivities (after 12 h time on stream) of SCALMS building blocks. Reaction conditions 703 K, atmospheric pressure, 2.5 mL catalyst, H2/n-heptane = 8/1, 0.062 g min−1n-heptane, 118.87 mLN min−1 H2, 14.86 mLN min−1 He, 3320 mLgas gcat-bed−1 h−1 GHSV, ∼1.1 s residence time (τ).
Doping the Ga2O3/Al2O3 catalyst with Pt (Pt–Ga2O3/Al2O3) resulted in a material with the highest conversion level of all reference systems (approx. 28% after 3 h, see Fig. 8a). At the same time this catalyst exhibited enhanced cracking (48%) combined with significant aromatization (19%) and isomerization (17%) as shown in Fig. 8b). We also tested a commercially available, state-of-the-art, Pt/Al2O3 catalyst. Because of the high Pt loading (1.0 wt%) of the latter, the initial activity of this catalyst was around 31% but it deactivated to ∼16% over 12 h TOS, which is the highest rate of deactivation among all materials under investigation. The commercial catalyst gave rise to a n-heptene selectivity of 42%. Among all catalyst materials tested in this study, it exhibited the highest selectivity for cyclic product formation, while aromatic species were formed with only 9% selectivity.
In the next step, we studied the three different SCALMS catalysts under identical reaction conditions (Fig. 8c). For these experiments, we kept the Ga : Pt atomic ratio close to 50 since Ga50Pt alloys are liquid under the applied reaction conditions according to the Ga–Pt phase diagram.51 In the ex situ Ga52Pt SCALMS-A preparation, we worked with anhydrous propan-2-ol under an inert atmosphere to minimize the oxidation of the liquid Ga droplet surface. This catalyst showed high initial conversion (ca. 21%) but exhibited the most pronounced deactivation profile among the three SCALMS catalysts over time-on-stream. In terms of selectivity (see Fig. 8d), the desired formation of C7 n-alkenes was dominant (∼34%), followed by cracking (∼21%), isomerization (20%), and aromatization (∼9%). Thus, Ga52Pt SCALMS-A proved to be a reasonable dehydrogenation catalyst but in addition displayed significant cracking, isomerization, and aromatization activity.
For eutectic mixtures of Ga and In in water–ethanol mixtures Creighton et al.19 reported that water has a significant effect on the formation of the Ga2O3 passivation layer. The thickness of such layer increases with increasing water content.19 Therefore, we deliberately synthesized Ga54Pt SCALMS-B via galvanic displacement in pure water to produce a completely oxidized Ga surface. The resulting Ga54Pt SCALMS-B was the most active catalyst among the three systems, giving rise to stable conversion around 15% (see Fig. 8c). Note that the Pt loading in this material was 0.13 wt%, slightly less than the one in SCALMS-A with 0.15 wt%. The product distribution (see Fig. 8d) indicated that Ga54Pt SCALMS-B produced mainly cracked products (∼49%), aromatics (∼16%) and iso-alkanes/alkenes (∼16%). The selectivity towards the desired product n-heptene was low with only 8%. This selectivity pattern was in excellent accordance with the one for Pt–Ga2O3/Al2O3. This match suggests that the liquid Ga droplet surface here is indeed oxidized to a point where our standard H2 pretreatment procedure was not able to remove the Ga2O3 skin from the catalytic surface. Note that literature reports suggest that the Ga2O3 layer may also transform in presence of water to gallium oxide hydroxide (GaOOH) crystallites, which may also contribute to the observed reactivity.19
Our previous studies on propane dehydrogenation showed that the hydrogen formed in the initial phase of the process can reduce the Ga passivation layer, as the formation of water was observed.52 This process is facilitated by the presence of Pt that can indeed act as catalyst for the reduction of the Gallium oxide. However, under oxidative condition, as in pure water, the passivation layer may grow to such a thickness that even the performed pre-reduction step under pure H2 at 723 K could not completely remove the formed oxide, leaving the Ga droplets covered with a surface that is chemically analogue to a Pt–Ga2O3/Al2O3 catalyst.
The conclusion from our catalytic and analytic experiments to this point was that albeit water is needed for the GDR to form the desired Ga–Pt alloys, a pure water environment in the GDR is not suitable to produce a reducible SCALMS surface for the catalytic reaction. Hence, the right proportion of propan-2-ol and water was needed to speed up the GDR while minimizing the formation of thick Ga oxide layers on the supported Ga–Pt alloy. Consequently, we carried out the GDR in a propan-2-ol solution containing 20 vol% of water. For this reaction medium, our analytical experiments indicated fast GDR kinetics (see Fig. 6) and the formation of Ga–Pt nanocomposites with uniform Pt dispersion (see Fig. 7h and i). The resulting catalyst material (Ga53Pt SCALMS-C) showed a stable conversion of around 9% over the 14 h runtime. While this was the lowest activity level of all three catalysts, the n-heptene selectivity was highest with ∼63% (see Fig. 8d). At the same time, the cracking selectivity was low (∼9%), and other reaction such as cyclization (6%), aromatization (6%), and isomerization (9%) remained low. This selectivity pattern indicates the presence of active Pt sites in Ga53Pt SCALMS-C, where mainly the dehydrogenation of n-heptane to n-heptene proceeds. Competing acid–base activity originating from remaining Ga2O3 is largely suppressed in this Ga53Pt SCALMS-C due to the effective reduction of the thin Ga2O3 layer in the catalyst pretreatment process.
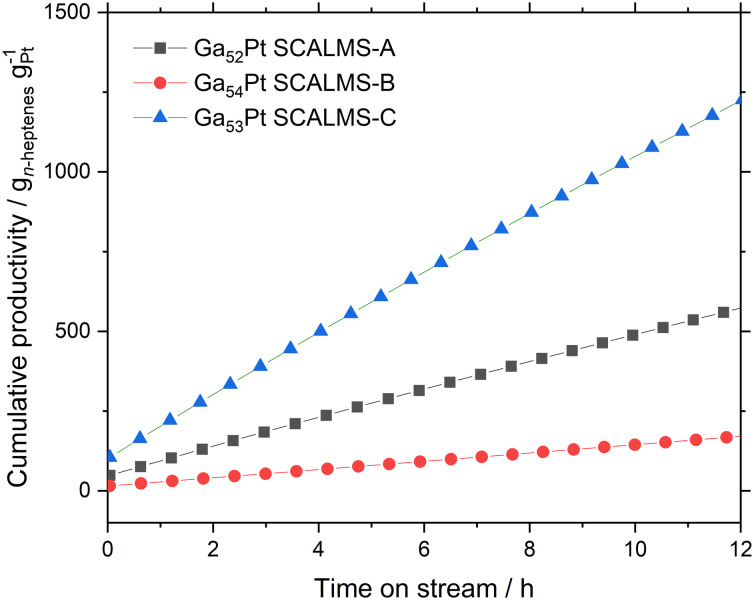
From the conversion and selectivity data, the cumulative productivity of each catalyst for the desired production of n-heptenes (in gn-heptenes gPt−1) can be calculated. Fig. 9 shows these values for the first 12 hours time-on-stream for all three SCALMS catalysts under investigation. The moderate n-heptene selectivity of Ga52Pt SCALMS-A resulted in a cumulative productivity of 630 gn-heptenes gPt−1, while the poor n-heptene selectivity of the very active Ga54Pt SCALMS-B yielded only 190 gn-heptenes gPt−1. The high n-heptene selectivity combined with high catalyst stability and reasonable activity of Ga53Pt SCALMS-C resulted clearly in the highest cumulative n-heptene productivity of 1230 gn-heptenes gPt−1 after 12 h time-on-stream.
Fig. 9. Cumulative n-heptenes productivity in n-heptane dehydrogenation using various Ga–Pt catalysts prepared via the galvanic displacement reaction in different reaction media (Ga52Pt SCALMS-A: preparation in propan-2-ol; Ga54Pt SCALMS-B: preparation in water; Ga53Pt SCALMS-C: preparation in 20 vol% water in propan-2-ol mixture; reaction conditions 703 K, atmospheric pressure, 2.5 mL catalyst, H2/n-heptane = 8/1, 0.062 g min−1n-heptane, 118.87 mLN min−1 H2, 14.86 mLN min−1 He, 3320 mLgas gcat-bed−1 h−1 GHSV, ∼1.1 s residence time (τ).
In our improved SCALMS catalyst preparation – as shown in this study for Ga–Pt SCALMS-C – the Ga droplet oxidation is reduced to a minimum by a fast GDR. The resulting thin Ga2O3 passivation layer is mostly reduced during H2 pre-treatment and creates a clean interface, where Pt atoms are present in the liquid Ga matrix. This difference explains the high selectivity for C7 dehydrogenation and the formation of n-heptenes despite the relevant and stable conversion. In-line with our previous studies on SCALMS, we attribute the high stability of Ga–Pt SCAMS-C to the dynamic liquid–gas reaction interface and the single atom nature of the active Pt sites in this SCALMS material.9
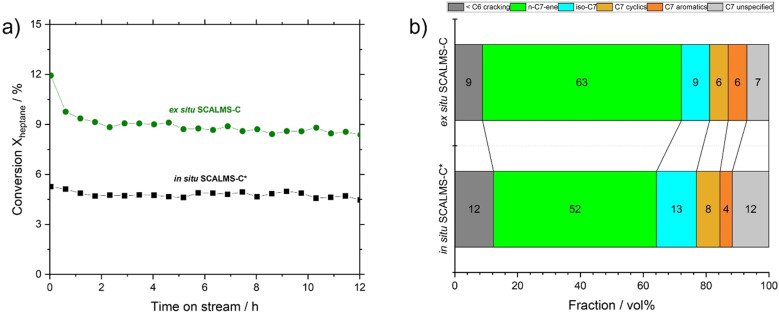
We also compared the performance of Ga–Pt SCALMS prepared via ex situ and in situ GDR (see Fig. 3 and 4). For this SCALMS with similar Ga : Pt ratio (∼50) was prepared via in situ GDR, i.e., SCALMS-C* (see Table S4 in ESI† for composition). In catalytic testing under identical reaction conditions, we observed that in situ SCALMS-C* showed ca. 53% of the activity of ex situ SCALMS-C (see Fig. 10a).
Fig. 10. a) Conversion and b) selectivity (after 12 h time on stream) of SCALMS prepared via in situ GDR (SCALMS-C*) and ex situ GDR (SCALMS-C) in n-heptane dehydrogenation. Reaction conditions 703 K, atmospheric pressure, 2.5 mL catalyst, H2/n-heptane = 8/1, 0.062 g min−1n-heptane, 118.87 mLN min−1 H2, 14.86 mLN min−1 He, 3320 mLgas gcat-bed−1 h−1 GHSV, ∼1.1 s residence time (τ).
The SEM analysis of the two materials did not show major difference (Fig. 11a and b), while EDX analysis showed a good correlation between Ga and Pt, confirming the bimetallic nature of the catalytic active phase (Fig. 11c and d and S8†) well in line with our previous investigation on Ga–Pt SCALMS.8
Fig. 11. SEM images of (a) SCALMS-C and (b) SCALMS-C* and EDX mapping of SCALMS-C* showing (c) gallium and (d) platinum. The scale bar represents 10 μm.
However, the lower activity of this in situ prepared SCALMS can be attributed to a lower reactive interface due to a three-fold higher average Ga–Pt droplet size in the suspension used to prepare SCALMS-C* (see Fig. S3 in ESI†). We interpret the differences in Ga–Pt droplet size in the following way: the addition of hexachloroplatinic acid to the Ga dispersion in the in situ preparation route leads to the dissolution of the native oxide skin of the Ga droplets and this results in the coalescence of smaller droplets into bigger ones, similar to the report by Yamaguchi et al.17 On the contrary, the Ga droplets in the ex situ SCALMS synthesis route are already support stabilized which reduces the chance of droplet coalescence in the GDR step.
SCALMS-C* also showed a reduced selectivity for n-heptenes (52% vs. 63% for SCALMS-C). This latter aspect could be still due to the history of the sample: to deposit the bimetallic Ga–Pt droplets on the support, an extra sonication step in an ultrasonic bath was rendered necessary. In fact, the material after centrifugation was not readily dispersible due to strong droplet aggregation (see Fig. 4). This extra sonication step might trigger over-oxidation and/or dealloying, with detrimental effect on the performance of the final catalyst. Nevertheless, SCALMS-C* catalyst was significantly more selective towards n-heptenes than SCALMS-A and SCALMS-B (52% vs. 34% and 8%, respectively), confirming that the oxidation and nature of metallic phase plays a key role in n-heptane dehydrogenation reaction.
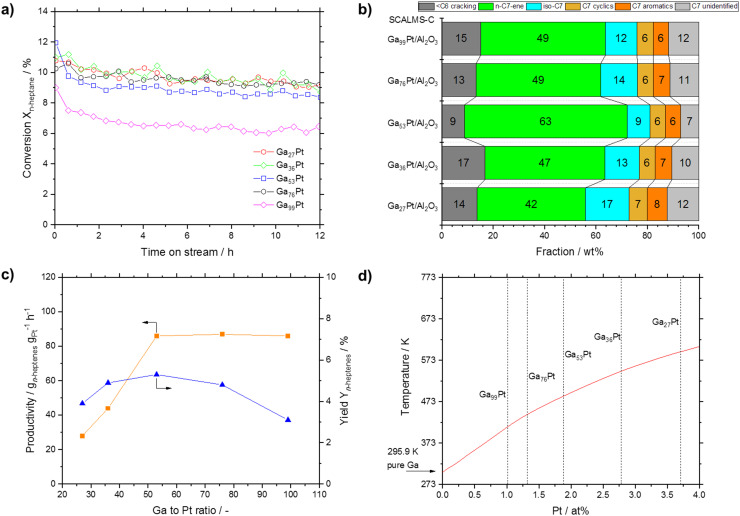
Finally, we investigated the effect of the Ga–Pt ratio in SCALMS-C materials from 27 to 99. Both Ga and Pt absolute masses in the reactor could not be kept constant but deviated by ±23% (Ga from 43 to 68 mg, Pt from 2.3 to 3.8 mg). Noteworthy, all SCALMS catalysts showed a similar conversion level between 9 and 10%, only the highly diluted Ga99Pt system was less active with only 6% at steady state conditions (see Fig. 12a). Interestingly, the selectivity of these five catalysts exhibited a maximum heptene formation for Ga53Pt, while at higher and lower ratios more cracking and cyclization occurred (see Fig. 12b). The combination of conversion and selectivity allowed the calculation of the n-heptene yield. As shown in Fig. 12c, the yield reached a maximum for Ga53Pt. The productivity, taking the different Pt loadings inside the reactor into account, also reached a maximum for Ga53Pt, after which it remained constant.
Fig. 12. a) Conversion over time in n-heptane dehydrogenation as function of the Ga–Pt ratio (all samples prepared according to the SCALMS-C protocol). b) Respective selectivity (at TOS = 12 h) in n-heptane dehydrogenation. c) Productivity and yield of heptenes obtained. d) Section of the Ga–Pt phase diagram according to Okamoto with liquidus line shown in red.51 Reaction conditions: 703 K, atmospheric pressure, 2.5 mL catalyst, H2/n-heptane = 8/1, 0.062 g min−1n-heptane, 118.87 mLN min−1 H2, 14.86 mLN min−1 He, 3320 mLgas gcat-bed−1 h−1 GHSV, ∼1.1 s residence time (τ).
We interpret these findings with the help of the Ga–Pt phase diagram (see Fig. 12d).51 Ga–Pt systems with a Pt content of >4 at% are characterized by the presence of solid intermetallic Ga–Pt phases under the applied reaction conditions. Conversely, Ga–Pt systems with a Pt content of <2 at% are expected from the phase diagram to be fully liquid and form supported Ga–Pt liquid alloys under the reaction conditions. Ga–Pt systems with Pt contents between 2 and 4 at% contain solid intermetallics together with significant amounts of Pt in Ga liquid solution. We suggest, therefore, that the observed productivity enhancement up to a Ga–Pt ratio of 50 can be attributed to the fact that only above this level of Pt dissolution the presence of single Pt atom sites at the dynamic liquid–gas interface of the intermetallic phase is maximized.
Conclusions
The ultrasonication route for SCALMS synthesis is a facile and atom-efficient alternative to the previously used tedious organometallic precursor route. In this work, we have systematically studied the parameters of the synthesis of Ga–Pt SCALMS via ultrasonication. We first investigated the effect of ultrasonication amplitude on the particle size distribution of Ga nano-droplets in dispersion and its stability. We further evaluated the influence of the galvanic displacement medium on the rate of the galvanic displacement and on the morphology of the Ga–Pt nanocomposites. Finally, the catalytic performance of the resulting materials in the catalytic dehydrogenation of n-heptane has been studied.
By ultrasonication of Ga nuggets (0.5 g) in propan-2-ol (100 mL) at 60% amplitude for 120 min under ambient conditions, we were able to produce very stable Ga/propan-2-ol dispersions with an average Ga droplet size of 206 nm and PDIDLS of 0.20 without any stabilizers. The Ga–Pt galvanic displacement reaction (GDR) was spontaneous in water-containing systems (pure aqueous system or 20 vol% water in propan-2-ol) while the reaction in dry propan-2-ol solution was sluggish. It is assumed that the shift in standard reduction potential of Ga3+/Ga0 and Pt4+/Pt0 considerably reduces the thermodynamic driving force thus making the GDR in propan-2-ol less effective. TEM analyses of Ga–Pt nanocomposites synthesized in water-containing systems showed well-dispersed Pt in Ga matrix. GDR in propan-2-ol, in contrast, resulted in the formation of Pt aggregates on Ga droplet surface leading to island formation following a Volmer–Weber growth model.
During catalytic testing in n-heptane dehydrogenation, ex situ synthesized Ga–Pt SCALMS in pure propan-2-ol (i.e., Ga52Pt SCALMS-A) shows pronounced dehydrogenation and cracking activity. According to our TEM analyses, Ga52Pt SCALMS-A consists of large Pt crystallites formed on Ga droplets. The ex situ synthesized Ga–Pt SCALMS in pure water (i.e., Ga54Pt SCALMS-B) is a very effective cracking catalyst, an activity that is attributed to the presence of a bulk, non-reducible Ga2O3 on the catalyst material. Interestingly, ex situ synthesized Ga–Pt SCALMS in water/propan-2-ol (i.e., Ga53Pt SCALMS-C), shows impressive dehydrogenation activity with n-heptenes selectivity of 63% and suppression of side reactions. This attractive performance is attributed to the liquid alloy interface in Ga53Pt SCALMS-C with minimal Ga2O3 content and clean Pt single-atom active sites. The in situ synthesized Ga–Pt SCALMS showed less activity compared to their ex situ counterparts due to higher average droplet size and thus a lower reaction interface. The slightly lower selectivity of in situ SCALMS is presumed due to the post-GDR sonication step which could result in over-oxidation and/or dealloying.
We are convinced that our findings will pave the way towards a rational development and effective production of SCALMS materials using ultrasonication. Given its simplicity and excellent atom efficiency, we anticipate that this preparation method will develop into the preferred choice to produce SCALMS materials for larger-scale, technical applications in the future.
Author contributions
Oshin Sebastian – investigation and visualization; Asem Al-Shaibani – investigation and formal analysis; Nicola Taccardi – validation and conceptualization; Umair Sultan – investigation and formal analysis; Marco Haumann – conceptualization and writing; Alexandra Inayat – supervision; Nicolas Vogel – supervision and writing; Peter Wasserscheid – project administration and writing.
Conflicts of interest
There are no conflicts of interest to report.
Supplementary Material
Acknowledgments
Financial support from the European Research Council is gratefully acknowledged (Project 786475: Engineering of Supported Catalytically Active Liquid Metal Solutions). We also acknowledge support by the Deutsche Forschungsgemeinschaft (DFG, German Research Foundation) – Project-ID 431791331 – SFB 1452 (CLINT). Contributions of Phillip Nathrath (Dipl.-Ing) and Yazan Mahayni (M.Sc.) to the TEM imaging of our SCALMS materials are gratefully acknowledged.
Electronic supplementary information (ESI) available. See DOI: https://doi.org/10.1039/d3cy00356f
References
- Hannagan R. T. Giannakakis G. Flytzani-Stephanopoulos M. Sykes E. C. H. Single-Atom Alloy Catalysis. Chem. Rev. 2020;120:12044–12088. doi: 10.1021/acs.chemrev.0c00078. doi: 10.1021/acs.chemrev.0c00078. [DOI] [PubMed] [Google Scholar]
- Flytzani-Stephanopoulos M. Supported metal catalysts at the single-atom limit – A viewpoint. Chin. J. Catal. 2017;38:1432–1442. doi: 10.1016/s1872-2067(17)62886-9. doi: 10.1016/s1872-2067(17)62886-9. [DOI] [Google Scholar]
- Giannakakis G. Flytzani-Stephanopoulos M. Sykes E. C. H. Single-Atom Alloys as a Reductionist Approach to the Rational Design of Heterogeneous Catalysts. Acc. Chem. Res. 2019;52:237–247. doi: 10.1021/acs.accounts.8b00490. doi: 10.1021/acs.accounts.8b00490. [DOI] [PubMed] [Google Scholar]
- Zhao F. Fujita S.-i. Arai M. Developments and Applications of Supported Liquid Phase Catalysts. Curr. Org. Chem. 2006;10:1681–1695. doi: 10.2174/138527206778249586. doi: 10.2174/138527206778249586. [DOI] [Google Scholar]
- Wasserscheid P. Keim W. Ionic liquids - new solutions for transition metal catalysis. Angew. Chem., Int. Ed. 2000;39:3772–3789. doi: 10.1002/1521-3773(20001103)39:21<3772::AID-ANIE3772>3.0.CO;2-5. doi: 10.1002/1521-3773(20001103)39:21<3772::AID-ANIE3772>3.0.CO;2-5. [DOI] [PubMed] [Google Scholar]
- Taccardi N. et al., Gallium-rich Pd-Ga phases as supported liquid metal catalysts. Nat. Chem. 2017;9:862–867. doi: 10.1038/nchem.2822. doi: 10.1038/nchem.2822. [DOI] [PubMed] [Google Scholar]
- Raman N. et al., Highly Effective Propane Dehydrogenation Using Ga-Rh Supported Catalytically Active Liquid Metal Solutions. ACS Catal. 2019;9:9499–9507. doi: 10.1021/acscatal.9b02459. doi: 10.1021/acscatal.9b02459. [DOI] [PMC free article] [PubMed] [Google Scholar]
- Raman N. et al., GaPt Supported Catalytically Active Liquid Metal Solution Catalysis for Propane Dehydrogenation – Support Influence and Coking Studies. ACS Catal. 2021;11:13423–13433. doi: 10.1021/acscatal.1c01924. doi: 10.1021/acscatal.1c01924. [DOI] [PMC free article] [PubMed] [Google Scholar]
- Sebastian O. et al., Stable and Selective Dehydrogenation of Methylcyclohexane using Supported Catalytically Active Liquid Metal Solutions – Ga52Pt/SiO2 SCALMS. ChemCatChem. 2020;12:4533–4537. doi: 10.1002/cctc.202000671. doi: 10.1002/cctc.202000671. [DOI] [Google Scholar]
- Søgaard A. de Oliveira A. L. Taccardi N. Haumann M. Wasserscheid P. Ga-Ni supported catalytically active liquid metal solutions (SCALMS) for selective ethylene oligomerization. Catal. Sci. Technol. 2021;11:7535–7539. doi: 10.1039/d1cy01146d. doi: 10.1039/d1cy01146d. [DOI] [PMC free article] [PubMed] [Google Scholar]
- Wolf M. Raman N. Taccardi N. Haumann M. Wasserscheid P. Coke Formation during Propane Dehydrogenation over Ga-Rh Supported Catalytically Active Liquid Metal Solutions. ChemCatChem. 2020;12:1085–1094. doi: 10.1002/cctc.201901922. doi: 10.1002/cctc.201901922. [DOI] [PMC free article] [PubMed] [Google Scholar]
- Rupprechter G. Supported liquid metal catalysts: Popping up to the surface. Nat. Chem. 2017;9:833–834. doi: 10.1038/nchem.2849. doi: 10.1038/nchem.2849. [DOI] [PubMed] [Google Scholar]
- Rahim M. A. et al., Low-temperature liquid platinum catalyst. Nat. Chem. 2022;14:935–941. doi: 10.1038/s41557-022-00965-6. doi: 10.1038/s41557-022-00965-6. [DOI] [PubMed] [Google Scholar]
- Bauer T. et al., Operando DRIFTS and DFT Study of Propane Dehydrogenation over Solid- and Liquid-Supported Ga(x)Pt(y) Catalysts. ACS Catal. 2019;9:2842–2853. doi: 10.1021/acscatal.8b04578. doi: 10.1021/acscatal.8b04578. [DOI] [PMC free article] [PubMed] [Google Scholar]
- Shriver D. F., Shirk A. E. and Dilts J. A., in Inorganic Synthesis, 1977, ch. 1, vol. XVII, pp. 42–45 [Google Scholar]
- Kumar V. B. Gedanken A. Kimmel G. Porat Z. Ultrasonic cavitation of molten gallium: formation of micro- and nano-spheres. Ultrason. Sonochem. 2014;21:1166–1173. doi: 10.1016/j.ultsonch.2013.11.004. doi: 10.1016/j.ultsonch.2013.11.004. [DOI] [PubMed] [Google Scholar]
- Yamaguchi A. Mashima Y. Iyoda T. Reversible Size Control of Liquid-Metal Nanoparticles under Ultrasonication. Angew. Chem., Int. Ed. 2015;54:12809–12813. doi: 10.1002/anie.201506469. doi: 10.1002/anie.201506469. [DOI] [PubMed] [Google Scholar]
- Boley J. W. White E. L. Kramer R. K. Mechanically sintered gallium-indium nanoparticles. Adv. Mater. 2015;27:2355–2360. doi: 10.1002/adma.201404790. doi: 10.1002/adma.201404790. [DOI] [PubMed] [Google Scholar]
- Creighton M. A. et al., Oxidation of Gallium-based Liquid Metal Alloys by Water. Langmuir. 2020;36:12933–12941. doi: 10.1021/acs.langmuir.0c02086. doi: 10.1021/acs.langmuir.0c02086. [DOI] [PubMed] [Google Scholar]
- Hohman J. N. et al., Directing substrate morphology via self-assembly: ligand-mediated scission of gallium-indium microspheres to the nanoscale. Nano Lett. 2011;11:5104–5110. doi: 10.1021/nl202728j. doi: 10.1021/nl202728j. [DOI] [PubMed] [Google Scholar]
- Lear T. R. et al., Liquid metal particle popping: Macroscale to nanoscale. Extreme Mech. Lett. 2017;13:126–134. doi: 10.1016/j.eml.2017.02.009. doi: 10.1016/j.eml.2017.02.009. [DOI] [Google Scholar]
- Lin Y. et al., Handwritten, Soft Circuit Boards and Antennas Using Liquid Metal Nanoparticles. Small. 2015;11:6397–6403. doi: 10.1002/smll.201502692. doi: 10.1002/smll.201502692. [DOI] [PubMed] [Google Scholar]
- Ren L. et al., Nanodroplets for Stretchable Superconducting Circuits. Adv. Funct. Mater. 2016;26:8111–8118. doi: 10.1002/adfm.201603427. doi: 10.1002/adfm.201603427. [DOI] [Google Scholar]
- Suslick K. S. Sonochemistry. Science. 1990;247:1439–1445. doi: 10.1126/science.247.4949.143. doi: 10.1126/science.247.4949.143. [DOI] [PubMed] [Google Scholar]
- Finkenauer L. R. Lu Q. Hakem I. F. Majidi C. Bockstaller M. R. Analysis of the Efficiency of Surfactant-Mediated Stabilization Reactions of EGaIn Nanodroplets. Langmuir. 2017;33:9703–9710. doi: 10.1021/acs.langmuir.7b01322. doi: 10.1021/acs.langmuir.7b01322. [DOI] [PubMed] [Google Scholar]
- Lin Y. Genzer J. Dickey M. D. Attributes, Fabrication, and Applications of Gallium-Based Liquid Metal Particles. Adv. Sci. 2020;7:2000192. doi: 10.1002/advs.202000192. doi: 10.1002/advs.202000192. [DOI] [PMC free article] [PubMed] [Google Scholar]
- Xia X. Wang Y. Ruditskiy A. Xia Y. Galvanic replacement: a simple and versatile route to hollow nanostructures with tunable and well-controlled properties. Adv. Mater. 2013;25:6313–6333. doi: 10.1002/adma.201302820. doi: 10.1002/adma.201302820. [DOI] [PubMed] [Google Scholar]
- Oloye O. Tang C. Du A. Will G. O'Mullane A. P. Galvanic replacement of liquid metal galinstan with Pt for the synthesis of electrocatalytically active nanomaterials. Nanoscale. 2019;11:9705–9715. doi: 10.1039/c9nr02458a. doi: 10.1039/c9nr02458a. [DOI] [PubMed] [Google Scholar]
- Hoshyargar F. Crawford J. O'Mullane A. P. Galvanic Replacement of the Liquid Metal Galinstan. J. Am. Chem. Soc. 2017;139:1464–1471. doi: 10.1021/jacs.6b05957. doi: 10.1021/jacs.6b05957. [DOI] [PubMed] [Google Scholar]
- Oloye O. Fernando J. F. S. Waclawik E. R. Golberg D. O'Mullane A. P. Galvanic replacement of liquid metal Galinstan with copper for the formation of photocatalytically active nanomaterials. New J. Chem. 2020;44:14979–14988. doi: 10.1039/d0nj02652b. doi: 10.1039/d0nj02652b. [DOI] [Google Scholar]
- Merkoçi F. Patarroyo J. Russo L. Piella J. Genç A. Arbiol J. Bastús N. G. Puntes V. Understanding galvanic replacement reactions: the case of Pt and Ag. Mater. Today Adv. 2020;5:100037. doi: 10.1016/j.mtadv.2019.100037. doi: 10.1016/j.mtadv.2019.100037. [DOI] [Google Scholar]
- Niu K. Y. Kulinich S. A. Yang J. Zhu A. L. Du X. W. Galvanic replacement reactions of active-metal nanoparticles. Chem. – Eur. J. 2012;18:4234–4241. doi: 10.1002/chem.201102544. doi: 10.1002/chem.201102544. [DOI] [PubMed] [Google Scholar]
- Falchevskaya A. S. Prilepskii A. Y. Tsvetikova S. A. Koshel E. I. Vinogradov V. V. Facile Synthesis of a Library of Hollow Metallic Particles through the Galvanic Replacement of Liquid Gallium. Chem. Mater. 2021;33:1571–1580. doi: 10.1021/acs.chemmater.0c03969. doi: 10.1021/acs.chemmater.0c03969. [DOI] [Google Scholar]
- Castilla-Amoros L. Stoian D. Pankhurst J. R. Varandili S. B. Buonsanti R. Exploring the Chemical Reactivity of Gallium Liquid Metal Nanoparticles in Galvanic Replacement. J. Am. Chem. Soc. 2020;142:19283–19290. doi: 10.1021/jacs.0c09458. doi: 10.1021/jacs.0c09458. [DOI] [PubMed] [Google Scholar]
- Castilla-Amoros L. Chien T. C. Pankhurst J. R. Buonsanti R. Modulating the Reactivity of Liquid Ga Nanoparticle Inks by Modifying Their Surface Chemistry. J. Am. Chem. Soc. 2022;144:1993–2001. doi: 10.1021/jacs.1c12880. doi: 10.1021/jacs.1c12880. [DOI] [PubMed] [Google Scholar]
- Sattler J. J. et al., Platinum-promoted Ga/Al2O3 as highly active, selective, and stable catalyst for the dehydrogenation of propane. Angew. Chem., Int. Ed. 2014;53:9251–9256. doi: 10.1002/anie.201404460. doi: 10.1002/anie.201404460. [DOI] [PMC free article] [PubMed] [Google Scholar]
- Rane N. Kersbulck M. van Santen R. A. Hensen E. J. M. Cracking of n-heptane over Brønsted acid sites and Lewis acid Ga sites in ZSM-5 zeolite. Microporous Mesoporous Mater. 2008;110:279–291. doi: 10.1016/j.micromeso.2007.06.014. doi: 10.1016/j.micromeso.2007.06.014. [DOI] [Google Scholar]
- Coperet C. C-H Bond Activation and Organometallic Intermediates on Isolated Metal Centers on Oxide Surfaces. Chem. Rev. 2010;110:656–680. doi: 10.1021/cr900122p. doi: 10.1021/cr900122p. [DOI] [PubMed] [Google Scholar]
- Shao C.-T. Lang W.-Z. Yan X. Guo Y.-J. Catalytic performance of gallium oxide based-catalysts for the propane dehydrogenation reaction: effects of support and loading amount. RSC Adv. 2017;7:4710–4723. doi: 10.1039/c6ra27204e. doi: 10.1039/c6ra27204e. [DOI] [Google Scholar]
- Han J. Jiang G. Han S. Liu J. Zhang Y. Liu Y. Wang R. Zhao Z. Xu C. Wang Y. Duan A. Liu J. Wei Y. The Fabrication of Ga2O3/ZSM-5 Hollow Fibers for Efficient Catalytic Conversion of n-Butane into Light Olefins and Aromatics. Catalysts. 2016;6:13. doi: 10.3390/catal6010013. doi: 10.3390/catal6010013. [DOI] [Google Scholar]
- Phadke N. M. Mansoor E. Bondil M. Head-Gordon M. Bell A. T. Mechanism and Kinetics of Propane Dehydrogenation and Cracking over Ga/H-MFI Prepared via Vapor-Phase Exchange of H-MFI with GaCl(3) J. Am. Chem. Soc. 2019;141:1614–1627. doi: 10.1021/jacs.8b11443. doi: 10.1021/jacs.8b11443. [DOI] [PubMed] [Google Scholar]
- Said-Aizpuru O. et al., Non-Monotonous Product Distribution Dependence on Pt/γ-Al2O3-Cl Catalysts Formulation in n-Heptane Reforming. ChemCatChem. 2020;12:2262–2270. doi: 10.1002/cctc.201902260. doi: 10.1002/cctc.201902260. [DOI] [Google Scholar]
- González-Marcos M. P. Iñarra B. Guil J. M. Gutiérrez-Ortiz M. A. Development of an industrial characterisation method for naphtha reforming bimetallic Pt-Sn/Al2O3 catalysts through n-heptane reforming test reactions. Catal. Today. 2005;107–108:685–692. doi: 10.1016/j.cattod.2005.07.052. doi: 10.1016/j.cattod.2005.07.052. [DOI] [Google Scholar]
- Sattler J. J. Ruiz-Martinez J. Santillan-Jimenez E. Weckhuysen B. M. Catalytic dehydrogenation of light alkanes on metals and metal oxides. Chem. Rev. 2014;114:10613–10653. doi: 10.1021/cr5002436. doi: 10.1021/cr5002436. [DOI] [PubMed] [Google Scholar]
- Chen M. et al., Dehydrogenation of propane over spinel-type gallia–alumina solid solution catalysts. J. Catal. 2008;256:293–300. doi: 10.1016/j.jcat.2008.03.021. doi: 10.1016/j.jcat.2008.03.021. [DOI] [Google Scholar]
- Chen M. et al., Enhanced Activity of Spinel-type Ga2O3–Al2O3 Mixed Oxide for the Dehydrogenation of Propane in the Presence of CO2. Catal. Lett. 2008;124:369–375. doi: 10.1007/s10562-008-9478-5. doi: 10.1007/s10562-008-9478-5. [DOI] [Google Scholar]
- Afonasenko T. N. et al., Synthesis and properties of γ-Ga2O3–Al2O3 solid solutions. Russ. J. Phys. Chem. A. 2017;91:1939–1945. doi: 10.1134/s003602441710003x. doi: 10.1134/s003602441710003x. [DOI] [Google Scholar]
- Dietz W. A. Response Factors for Gas Chromatographic Analyses. J. Chromatogr. Sci. 1967;5:68–71. doi: 10.1093/CHROMSCI/5.2.68. doi: 10.1093/CHROMSCI/5.2.68. [DOI] [Google Scholar]
- Kuntyi O. I. Zozulya G. I. Shepida M. V. Nanoscale galvanic replacement in non-aqueous media: a mini-review. Vopr. Khimii Khimicheskoi Tekhnologii. 2020:5–15. doi: 10.32434/0321-4095-2020-131-4-5-15. [DOI] [Google Scholar]
- Izutsu K., in Electrochemistry in Nonaqueous Solutions, Wiley-VCH Verlag GmbH & Co. KGaA, 2002, ch. 4, pp. 85–106 [Google Scholar]
- Okamoto H. Ga-Pt (Gallium-Platinum) J. Phase Equilib. Diffus. 2007;28:494. doi: 10.1007/s11669-007-9149-z. doi: 10.1007/s11669-007-9149-z. [DOI] [Google Scholar]
- Wolf M. et al., Capturing spatially resolved kinetic data and coking of Ga-Pt supported catalytically active liquid metal solutions during propane dehydrogenation in situ. Faraday Discuss. 2021;229:359–377. doi: 10.1039/d0fd00010h. doi: 10.1039/d0fd00010h. [DOI] [PubMed] [Google Scholar]
Associated Data
This section collects any data citations, data availability statements, or supplementary materials included in this article.


