

Abstract
BACKGROUND:
ICD-10-CM codes exist that facilitate provider designation of patients as “nonadherent to therapy”; however, it is unclear whether this label accurately reflects patient behavior according to widely accepted medication adherence metrics using pharmacy claims data.
OBJECTIVE:
To determine the extent to which patients are accurately coded for and have calculated rates of nonadherence using ICD-10-CM codes and claims, respectively.
METHODS:
This was a retrospective cohort study using commercial insurance and Medicare Advantage claims data from 2015 to 2016. The analysis focused on adults aged 18 years and older who had been diagnosed with and were being treated for hypertension and/or diabetes and had been coded as nonadherent by a provider during an outpatient encounter. Adherence (proportion of days covered [PDC]) to oral antihypertensive and/or antidiabetic therapy was calculated 6 months before and after the first nonadherence diagnosis identified in outpatient encounters, using 2 distinct calculation methods. Inferential statistics and multivariable logistic regression were used to determine predictors of coding agreement and changes in adherence after the nonadherence diagnosis controlling for available patient characteristics.
RESULTS:
A total of 1,142 patients who had been coded as nonadherent were identified, of which between 5.3% and 22.0% (depending on metric and condition) had PDCs before the nonadherence code deeming them adherent according to claims, conflicting with nonadherence diagnosis codes documented by their providers. Mean PDCs increased significantly (20.5%-24.3%, all P < 0.001) among both conditions following the nonadherent code, as did the proportion adherent (PDC > 80%), irrespective of disease (all P < 0.01). The odds of being correctly labeled nonadherent according to claims decreased with age (diabetes odds ratio [OR]: 0.82, 95% CI = 0.694-0.976; hypertension OR: 0.86, 95% CI = 0.773-0.944) but were higher among those taking more medications (diabetes OR: 2.97, 95% CI = 1.658-5.326; hypertension OR: 3.0, 95% CI = 2.095-4.305). Following the nonadherence coding, the odds of being adherent increased with age in both models (diabetes OR: 1.17, 95% CI = 1.012-1.363; hypertension OR: 1.13, 95% CI = 1.048-1.223) yet decreased with increasing medications (diabetes OR: 0.25, 95% CI = 0.138-0.468; hypertension OR: 0.47, 95% CI = 0.368-0.592) and were lower if the patient was observed to be nonadherent before the index encounter (diabetes OR: 0.33, 95% CI = 0.146-0.760; hypertension OR: 0.25, 95% CI = 0.152-0.423).
CONCLUSIONS:
In general, providers are properly classifying patients as nonadherent using ICD-10-CM codes, but additional assessment is needed to determine the reasons for the remaining mismatch between claims- and diagnosis-based nonadherence. In addition, the correct claims-based metric needs to be established to improve alignment with provider interpretation of patient medication use.
What is already known about this subject
Medication nonadherence may be assessed in a number of subjective and objective ways, and methods using pharmacy claims data can vary based on the regimen being assessed.
Using select ICD-10-CM diagnosis codes, providers may now indicate their contention that patients are nonadherent to therapy during encounters.
What this study adds
Significant agreement exists between calculated levels and provider-designated interpretations of medication nonadherence among adults with diabetes or hypertension.
Consistent increases in medication use observed after a patient was coded with a nonadherence diagnosis suggest that providers may be addressing the need for improved adherence when this behavior is documented on an encounter.
Medication nonadherence is a known barrier to treatment success and a major focus of the current shift toward a value-based, quality-driven reimbursement system in the United States.1 For example, efforts to motivate providers to focus on adherence include the Centers for Medicare & Medicaid (CMS) star ratings program under Medicare Part D and medication therapy management (MTM) services. Multiple studies concluded that implementation of MTM and CMS star ratings improved medication adherence and reduced health care utilization and overall medication costs.2,3
While adherence plays a major role in value-driven health care models, a gold standard metric has yet to be established, and subjective and objective measurements exist. Subjective methods involve physician or patient assessment of medication-taking behavior. Examples of the latter include the Medication Adherence Report Scale and Adherence to Refills and Medications scale, among a host of others.4-6 In contrast, objective measurements incorporate a broader range of approaches, including pill counting, electronic monitoring, and assessing refill records.4,7
Subjective measures have an advantage in that they may be more useful in assisting health care providers in determining the barriers affecting patient medication adherence. However, since objective measurements most commonly use pharmacy databases, they are thought to provide potentially less biased information on how patients adhere to their medication regimens despite not offering corroboration of whether a dose was taken.4 Even with the multiple available measurement tools, adherence is still challenging to assess due to numerous factors that influence this behavior and given that adherence is an often individualized patient behavior.8
Several studies have shown that providers have difficulty correctly evaluating patient adherence, with nonadherence being appropriately recognized in less than half of instances.7,9 Inaccurate medication adherence recognition is thought to be the result of the tendency of providers to rely mostly on subjective assessments. Heavily relying on subjective metrics often leads to health care provider misjudgment due to a number of factors, such as stereotyping and patients underreporting nonadherence to prevent disapproval from their physicians.9-13 Some evidence suggests that one of the best solutions to assist physicians in more accurately assessing patient medication adherence is through the inclusion of more than 1 measurement tool, since the strengths of one tool may compensate for the weaknesses of another instrument.4,9
In 2015, the International Classification of Diseases, Tenth Revision, Clinical Modification (ICD-10-CM) was implemented for clinical practice. A feature of ICD-10-CM is the ability for health care practitioners to “diagnose” nonadherence through a combination of codes; however, the extent to which these codes are being used remains unknown. To provide initial interpretation of the use of these codes, this study assessed the agreement between nonadherence “diagnosis codes” with claims-calculated medication nonadherence among adults with select chronic diseases. In addition, the extent to which provider-indicated (subjective measure) and claims-calculated nonadherence (objective measure) aligned was used to determine if coding resulted in subsequent changes of patient behavior.
Methods
STUDY POPULATION AND DATA
Data for this study were sourced from the 2015-2016 IBM MarketScan Commercial Claims and Encounters and Medicare Supplemental databases, which contain the inpatient, outpatient, and pharmacy event claims for millions of Americans with employer-sponsored or Medicare Advantage health insurance. The data are deidentified and fully compliant with the Health Insurance Portability and Accountability Act of 1996, and this study was deemed nonhuman subjects research by the University of Tennessee Health Science Center Institutional Review Board.
To be eligible, patients must have satisfied the following criteria: (a) at least 1 outpatient encounter record with an ICD-10-CM medication nonadherence diagnosis code (Z91.120, Z91.128, Z91.13, or Z91.14); (b) at least 1 diagnosis code for hypertension (I10.x) and/or diabetes (E11.x) within 6 months of the initial nonadherence code; (c) prescription claims for an oral medication indicated to treat either hypertension or diabetes 6 months before and after the initial nonadherence code; (d) continuous enrollment for the 12-month observation period (i.e., 6 months before and after the initial nonadherence code); and (e) lacking evidence of other chronic conditions for which medications would be taken (Figure 1). Patients with diabetes on any injectable agent were excluded from the final analytical cohort.
FIGURE 1.
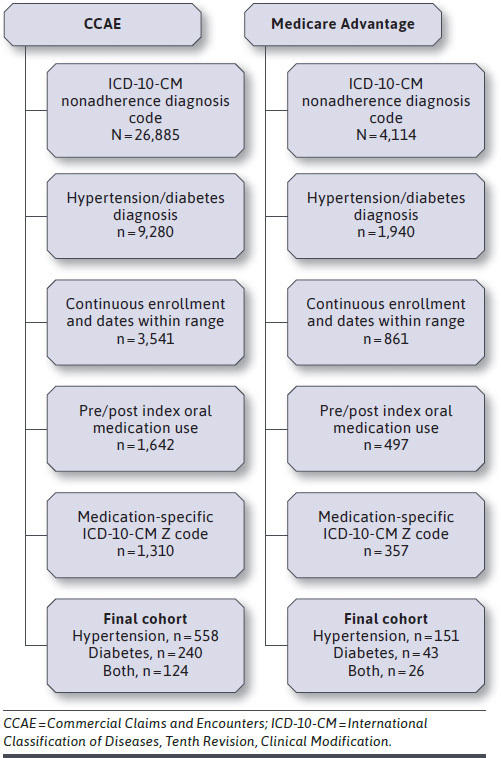
Patient Selection
EXPOSURES, OUTCOMES, AND COVARIATES
The main exposure was an ICD-10-CM code indicating potential medication nonadherence. The first instance of such a code served as the index date for analysis, before and after which (± 6 months) patients’ oral medication use was tracked. Adherence to therapy was determined using the proportion of days covered (PDC) metric, which is the currently preferred calculation method.14 The denominator was 180 days and the numerator was a count of the days in the observation period on which patients had medication in their possession according to the days supply field. The calculation method accounted for overlapping fills and medications filled before the look-back period.
Patients on multiple medications had their numerators summed in 2 ways: (1) having all condition-specific medications on-hand for a given day to be counted as adherent (i.e., regimen adherence) and (2) having at least 1 medication on-hand to be counted as adherent for a given day (i.e., the “at least one” method). Multiple calculation methods were used to compare agreement to nonadherence diagnoses, since claims are not able to indicate whether the provider determined nonadherence because of some or all medications not being taken as prescribed.
The primary outcome was agreement between provider-diagnosed and claims-based nonadherence. A PDC of less than 80% defined a patient as nonadherent in each 6-month analysis period.15 For those with diabetes and hypertension, PDCs for both conditions must have met the 80% threshold to be classified as adherent. Secondary outcomes focused on changes in medication adherence after the initial nonadherence diagnosis.
Demographic characteristics available included patient age, gender, region of residence, and health plan type. Population density (rural vs. urban) was derived from metropolitan statistical area codes provided in the databases. The number of unique medications being taken before and after the index date was also determined using outpatient pharmacy claims.
STATISTICAL ANALYSES
Patient characteristics were described using means and SDs for continuous variables and frequencies and proportions for categorical variables. Bivariate analyses identified associations with characteristics and medication use (continuous PDC and dichotomous adherence). Paired t-, McNemar’s, and chi-square tests assessed changes in PDC and adherence status before and after the index date. Multivariable logistic regression identified predictors of agreement between claims- and provider-based adherence estimates and changes in adherence status after the nonadherence diagnosis while controlling for patient characteristics. An α < 0.05 was defined a priori to determine statistical significance. SAS Enterprise Guide version 6.1 (SAS Institute, Cary, NC) was used for all analyses, which were conducted throughout 2019.
Results
A total of 1,142 patients met inclusion criteria (Table 1). A majority had hypertension only (62.10%), and 150 patients (13.1%) had both diagnoses. The sample was mostly aged 45 years and older (79.1%), was well balanced by sex, and resided mostly in the South (58.5%). Nearly all nonadherence (93.5%) was coded as Z91.14: Patient’s other noncompliance with medication regimen.
TABLE 1.
Patient Population
| Characteristic | Diabetes n (%) | Hypertension n (%) | Diabetes and Hypertension N (%) | |||
|---|---|---|---|---|---|---|
| Total | 283 | 709 | 150 | |||
| Age, years, mean (SD) | 53.3 (12.1) | 55.2 (14.3) | 57.1 (10.6) | |||
| 18-24 | 3 (1.1) | 7 (1.0) | 0 (0.0) | |||
| 25-34 | 10 (3.5) | 29 (4.1) | 3 (1.4) | |||
| 35-44 | 42 (14.8) | 132 (18.6) | 13 (6.1) | |||
| 45-54 | 103 (36.4) | 196 (27.6) | 41 (19.3) | |||
| 55-64 | 82 (29.0) | 198 (27.9) | 69 (32.5) | |||
| 65+ | 43 (15.2) | 147 (20.7) | 24 (11.3) | |||
| Male | 158 (55.8) | 350 (49.4) | 71 (33.5) | |||
| Region | ||||||
| Northeast | 35 (12.4) | 81 (11.4) | 12 (5.7) | |||
| North Central | 61 (21.6) | 153 (21.6) | 25 (11.8) | |||
| South | 151 (53.4) | 418 (59.0) | 99 (46.7) | |||
| West | 35 (12.4) | 57 (8.0) | 13 (6.1) | |||
| Rural | 39 (13.8) | 103 (14.5) | 30 (14.2) | |||
| Payer | ||||||
| Commercial | 240 (84.8) | 558 (78.7) | 124 (58.5) | |||
| Medicare Advantage | 43 (15.2) | 151 (21.3) | 26 (12.3) | |||
| Plan type | ||||||
| Comprehensive | 32 (11.3) | 99 (14) | 22 (10.4) | |||
| HMO | 33 (11.7) | 68 (9.6) | 7 (3.3) | |||
| POS | 23 (8.1) | 81 (11.4) | 21 (9.9) | |||
| EPO/PPO | 142 (50.2) | 347 (48.9) | 75 (35.4) | |||
| CDHP/HDHP | 49 (17.3) | 107 (15.1) | 24 (11.3) | |||
| Antidiabetic medications, mean (SD) | 1.0 (1.0) | 2.0 (1.2) | ||||
| Antihypertensive medications, mean (SD) | 2.4 (1.7) | 2.4 (1.8) | ||||
| Qualifying code | ||||||
| Z91.120 | 14 (4.9) | 5 (0.7) | 0 (0.0) | |||
| Z91.128 | 13 (4.6) | 32 (4.5) | 10 (6.7) | |||
| Z91.14 | 256 (90.5) | 672 (94.8) | 140 (93.3) | |||
Note: Some values do not sum to 100% due to missing data.
CDHP = consumer-driven health plan; EPO = exclusive provider organization; HDHP = high deductible health plan; HMO = health maintenance organization; POS = point-of-service; PPO = preferred provider organization.
Claims-based adherence estimates ranged considerably by condition and calculation method, with regimen-based, pre-index values substantially lower than those calculated using the “at least one” method: mean differences exceeded 36.8% irrespective of diagnosis. Consequently, classifications of adherence status varied by calculation method, with regimen-based calculation resulting in relatively few patients deemed adherent leading up to being diagnosed as nonadherent by their provider, suggesting high levels of agreement (at least 78%) between claims- and diagnosis-based nonadherence (Figure 2 and Figure 3). In comparison, according to the “at least one” method, providers correctly diagnosed patients as nonadherent 59.3% of the time, at best.
FIGURE 2.
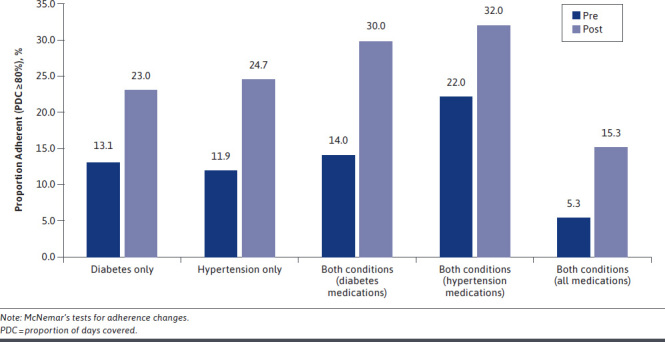
Change in Regimen Adherence Following Nonadherent Diagnosis by Disease State
FIGURE 3.
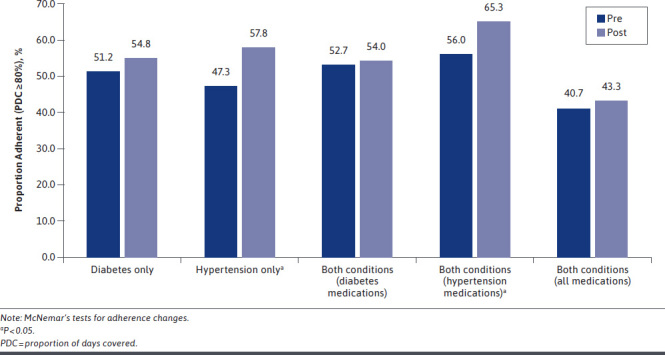
Change in Adherence Following Nonadherent Diagnosis by Disease State (At Least 1 Method)
Few patient characteristics were associated with differences in medication use: the proportion adherent to diabetes medications before index increased by age group with a weak, significant correlation between patient age and PDC (diabetes: ρ = 0.13, P < 0.05). Regional variation in adherence status was evident for those with hypertension: residents of the South were the only subgroup with, albeit marginally, more than 90% of patients correctly assigned as nonadherent (P < 0.05).
Following the index date, PDCs and the proportion adherent (Figure 2) increased among all subgroups according to the regimen-based adherence metric (all P < 0.01). Mean (SD) PDCs before the nonadherence diagnosis ranged from 29.6% (32.4) for those with hypertension only to 39.5% (36.2) for antihypertensive medications among those with both conditions. Mean (SD) improvement across all subgroups was at least 20.5% (36.9), all of which were statistically significant (all P < 0.001). In addition, the proportion of patients with both conditions and who were adherent to both sets of medications increased from 5.3% to 15.3% (P < 0.01) after the nonadherence diagnosis. Moreover, among those with both hypertension and diabetes, 46.0% remained completely nonadherent; 8.6% reduced their level of adherence; 14.0% maintained their pre-index adherence; and 31.4% improved their adherence after the index nonadherence diagnosis.
Multiple logistic regressions identified predictors of agreement between the nonadherence diagnosis and medication adherence according to claims data (multivariable models among those with both conditions were not run due to sample size and outcome variable distribution constraints). The odds of being diagnosed as nonadherent (by the provider) and having medication fills indicative of nonadherence (according to prescription claims) declined with age, while the odds of agreement were higher among patients taking more medications in the pre-index period, irrespective of condition (Table 2). Using the date of nonadherence diagnosis as the differentiating event, the odds of being adherent post-index increased with age irrespective of condition. Conversely, the odds of being adherent after the index diagnosis decreased with the number of medications being taken and, as might be expected, were lower if nonadherence (claims-based) was evident before the index event, irrespective of condition.
TABLE 2.
Predictors of Agreement and Changes in Claims-Based Adherence After a Nonadherence Diagnosis
| Predictor | Adherence Agreement Model | Adherence Change Model | ||||||
|---|---|---|---|---|---|---|---|---|
| Diabetes OR (95% CI) | P Value | Hypertension OR (95% CI) | P Value | Diabetes OR (95% CI) | P Value | Hypertension OR (95% CI) | P Value | |
| Age | 0.82 (0.694-0.976) | 0.025 | 0.86 (0.773-0.944) | 0.002 | 1.17 (1.012-1.363) | 0.035 | 1.13 (1.048-1.223) | 0.002 |
| Sex | ||||||||
| Male | ref | ref | ref | ref | ||||
| Female | 0.59 (0.274-1.272) | 0.178 | 1.78 (1.078-2.943) | 0.024 | 0.68 (0.360-1.296) | 0.243 | 0.84 (0.573-1.236) | 0.379 |
| Region | ||||||||
| Northeast | ref | ref | ref | ref | ||||
| North Central | 1.20 (0.328-4.371) | 0.786 | 0.93 (0.419-2.076) | 0.864 | 1.85 (0.577-5.913) | 0.301 | 0.82 (0.412-1.625) | 0.567 |
| South | 1.94 (0.618-6.091) | 0.256 | 1.92 (0.942-3.900) | 0.073 | 1.46 (0.502-4.228) | 0.489 | 0.80 (0.443-1.443) | 0.458 |
| West | 0.84 (0.213-3.318) | 0.805 | 2.22 (0.753-6.516) | 0.149 | 3.07 (0.881-10.669) | 0.078 | 0.67 (0.284-1.575) | 0.360 |
| Population density | ||||||||
| Rural | 1.003 (0.306-3.291) | 0.996 | 1.00 (0.471-2.115) | 0.995 | 1.58 (0.632-3.925) | 0.329 | 0.72 (0.408-1.277) | 0.262 |
| Urban | ref | ref | ref | ref | ||||
| Plan type | ||||||||
| Comprehensive | ref | ref | ref | ref | ||||
| HMO | 1.95 (0.392-9.681) | 0.415 | 1.00 (0.340-2.935) | 0.999 | 1.20 (0.316-4.544) | 0.789 | 0.63 (0.267-1.478) | 0.287 |
| POS | 1.18 (0.211-6.605) | 0.849 | 0.48 (0.180-1.290) | 0.146 | 1.05 (0.222-4.975) | 0.950 | 1.97 (0.902-4.288) | 0.089 |
| PPO/EPO | 1.09 (0.332-3.591) | 0.886 | 0.91 (0.401-2.041) | 0.809 | 1.20 (0.410-3.530) | 0.737 | 1.01 (0.534-1.904) | 0.979 |
| CDHP/HDHP | 2.02 (0.431-9.505) | 0.372 | 0.84 (0.311-2.246) | 0.723 | 0.98 (0.276-3.458) | 0.972 | 0.74 (0.328-1.651) | 0.457 |
| Medicationsa | 2.97 (1.658-5.326) | < 0.001 | 3.00 (2.095-4.305) | < 0.001 | 0.25 (0.138-0.468) | < 0.001 | 0.47 (0.368-0.592) | < 0.001 |
| Pre-index adherent | ||||||||
| Yes | ref | ref | ||||||
| No | 0.33 (0.146-0.760) | 0.009 | 0.25 (0.152-0.423) | < 0.001 | ||||
aCounts of medications for respective conditions before index (agreement model) and after index (change model).
CDHP = consumer-driven health plan; EPO = exclusive provider organization; HDHP = high deductible health plan; HMO = health maintenance organization; OR = odds ratio; POS = point-of-service; PPO = preferred provider organization; ref = reference.
Discussion
Medication adherence remains crucial to reducing the odds of detrimental outcomes among those with chronic conditions, but challenges remain in how this behavior is measured and its data are used by practitioners. Mechanisms such as pharmacy claims data, self-report, and remote monitoring provide vital information to those seeking to understand the extent to which a range of patients take their medications, but such data are either collected inconsistently or in a way that is siloed and inaccessible to all members of the care team. Expanding the singular ICD-9-CM medication nonadherence code to a set of codes provided by ICD-10-CM specific to nonadherence provides a richer opportunity to identify and intervene with those with suboptimal medication use. However, the limited research that has been conducted on the use of these codes creates significant uncertainty around their correlation with nonadherence and overall value.
As one of the first studies to examine the use of nonadherence ICD-10-CM codes, the current findings suggest that, in general, providers are correctly identifying nonadherent patients during clinical encounters, compared with claims-based adherence metrics. However, it is important to note that the agreement between these objective and subjective adherence measures is highly dependent on the manner by which PDC is calculated using claims data. In comparison, PDCs using the regimen-based formula were, in most cases, 50% lower than what was determined when giving patients credit for having at least 1 medication on hand.
As a result, the proportion deemed adherent to their entire regimen was one third or less when compared with the figures determined by the other PDC calculation method. Considering the extent to which PDC is being used by entities to determine provider and plan performance (e.g., CMS star measures), this is a potentially problematic mismatch that could be resulting in improperly determined quality assessment and subsequent reimbursement. Consequently, additional assessment is needed to interpret the correct claims-based metric to improve the odds that these estimates align to provider interpretation of patient medication use, providing a more accurate reflection of real-world behaviors.
Despite substantial agreement between claims- and diagnosis-based nonadherence assessments, some misclassification still occurred, and several potential explanations exist that may point to reasons for the observed differences. Perhaps the leading reason for such a difference is the relative newness of the medication nonadherence codes. While ICD-10-CM was launched in 2015, relatively limited insight has been provided on the manner by which providers may be using the nonadherence codes or even the extent to which providers are aware that such a set of codes exist to label patient medication use. Evidence for this in the current study may reside in the relatively high proportion of patients coded as nonadherent under the generic Z91.14 code: patient’s other noncompliance with medication regimen.
Analyses using more recent data may benefit from examining differences in patient or provider demographics across coding type once other nonadherence codes are used more consistently. Although solely focused on those more likely to be coded nonadherent, an earlier study using medical records also identified few significant predictors of patients likely to be labeled nonadherent.16 Importantly, that analysis identified significant differences in the likelihood of patients being labeled nonadherent by race, wherein Black adults had heightened risk of being coded for medication underuse16; however, that study did not link such a diagnosis with prescription records, limiting their ability to corroborate the accuracy of the assessment.
Noting the collective limited research in this area and the insight provided, a deeper analysis of provider use of the nonadherence codes is warranted. This could undoubtedly involve retrospective analyses of large datasets with robust, longitudinal patient data beyond what has been used to date, which would facilitate identifying a host of potential predictors while also providing opportunity to corroborate the potential unconscious bias suggested by Beltran et al. (2019).16 However, as has been suggested, observations that can only be made by prospective studies are certainly warranted to facilitate direct observation of provider behaviors, which would offer insight on how nonadherence codes have been used thus far and how we may train providers to apply them more appropriately.17 Specifically, such a design could provide valuable qualitative information from directly observed encounters or postvisit summaries that would add critical context to codes submitted.
The manner by which adherence is subjectively determined by providers may also explain the observations reported in this study. For instance, the comparatively higher mismatches between diagnoses and claims-based nonadherence among older adults may point to the challenges in describing medication use among those with more complex treatment regimens. Considering the generally higher number of medications taken by older adults, providers may struggle with whether to code as nonadherent slight underuse for 1 or more prescribed agents using clinical judgment. In addition, the manner by which patients describe their medication-taking may suggest poor adherence (i.e., missing a few days here and there) when in fact claims may tell a different story according to widely accepted metrics (i.e., missed days were not substantial enough to reach nonadherent status). In general, the current results suggest that providers may be erring on the side of caution when diagnosing nonadherence as the odds of agreement between diagnosis- and claims-based adherence increased with the number of medications taken during the observation period.
The results may be a signal that providers value adherence to the entire regimen, evidence for which is reflected by the observed differences in alignment between diagnoses and the 2 different adherence calculation methods, as well as the change in adherence after the nonadherence diagnosis. However, the observed discrepancy in effects between age and treatment regimen suggest that providers may be interpreting medication-use behaviors of older adults differently, warranting further investigation. The potential mismatch between insight gained from objective and subjective medication use data sources is further justification for the need to combine different data types, with or without direct observation of encounters, into interpreting how providers determine whether a patient is adherent.
The observation of substantial changes in medication use following the nonadherence diagnosis is reassuring and suggestive that measures are being taken to address potential underuse interpreted by providers. Importantly, in previous coding iterations the use of available, yet somewhat limited, nonadherence coding demonstrated significant insight into those at heightened risk for poor outcomes. Specifically, among newly treated hypertensive patients, nonadherence coding (V15.81) was associated with higher adjusted risks for chronic kidney disease, coronary artery disease, stroke, and all-cause mortality.18,19
Because the time horizon between treatment initiation and these outcomes can be lengthy and noting the important role adherence plays in managing chronic disease, specific measures should be taken by providers who recognize potential nonadherence in their patients, irrespective of how that may be determined. A potential facilitating factor to this process would be providing clinicians with claims-based medication-taking assessments of their patients in preparation for expected encounters. Such access to information demonstrated a significant effect on subsequent provider treatment decisions, which may contribute to improved downstream health outcomes.20,21
Recently, the CMS announced a pilot program to facilitate physician access to Medicare patients’ claims data, which aims to reduce barriers to actionable information that clinicians could use to make better data-driven decisions.22 While such an effort is a potentially valuable measure to assist certain providers, the means to leverage claims-based adherence information into the patient management process is already actionable by other providers, such as community pharmacists.
Accustomed to using PDC data as part of the CMS MTM and star ratings programs, community pharmacies across the country could more regularly use patient pharmacy claims data to diagnose nonadherence, guide patients outside of CMS programs, and subsequently inform physicians about objectively assessed medication use and any counseling provided. This approach could more efficiently improve medication use, pharmacist-physician collaboration on patient management, and the means by which ICD-10-CM nonadherence codes are applied, which may lead to even more substantial post-nonadherence diagnosis changes.
LIMITATIONS
Findings from this study should be considered in light of its limitations. First, analyses were conducted using data immediately before and after the implementation of ICD-10-CM; therefore, a limited number of patients with target codes were identified, and the correct means to use these codes may not have been fully understood, evidence for which may be provided herein by the high use of the non-specific nonadherence code (Z91.14) observed in these data.
Second, data used were sourced from those with employer-sponsored or Medicare Advantage insurance; therefore, results may not be generalizable to populations lacking or with alternative forms of insurance. In addition, a limited set of patient characteristics were available; consequently, documented patient characteristics beyond those included in claims may have been used by clinicians to interpret medication nonadherence, and additional insight on the potential drivers of the codes used is warranted.
Finally, while PDC is a widely accepted adherence metric, it remains an indirect measure of medication use and may overestimate the extent to which treatment is taken as prescribed.
Conclusions
In spite of the limitations, a key strength of this study is its use of a large, multipayer, nationwide claims database to connect subjective assessment and objectively calculated levels of medication adherence. Such an approach provides a first attempt to use big data sources to learn how providers may be assessing certain patient populations for medication adherence. Moving forward, future assessments of ICD-10-CM nonadherence codes should consider connecting medication use assessment with richer patient and provider practice information, changes in clinical measures, and discrete outcomes to measure the codes’ predictive abilities.
Since claims miss out on valuable context gathered during encounters, the observing or other qualitative assessment of provider visits should be combined with the quantitative data generally relied on for adherence analysis. This would advance our ability to interpret the patient characteristics and behaviors leveraged by clinicians when making a subjective determination about patient medication use. Moreover, it would facilitate identification of unconscious biases that providers are inserting into the adherence calculus made during encounters.
REFERENCES
- 1.Saver BG, Martin SA, Adler RN, et al. Care that matters: quality measurement and health care. PLoS Med. 2015;12(11):e1001902. [DOI] [PMC free article] [PubMed] [Google Scholar]
- 2.Branham A, Moose J, Ferreri S. Retrospective analysis of medication adherence and cost following medication therapy management. Innovations in Pharmacy. 2010;1(1):article 12. [Google Scholar]
- 3.Ferries E, Dye JT, Hall B, Ndehi L, Schwab P, Vaccaro J. Comparison of medication therapy management services and their effects on health care utilization and medication adherence. J Manag Care Spec Pharm. 2019;25(6):688-95. doi: 10.18553/jmcp.2019.25.6.688 [DOI] [PMC free article] [PubMed] [Google Scholar]
- 4.Lam WY, Fresco P. Medication adherence measures: an overview. Biomed Res Int. 2015;2015:217047. [DOI] [PMC free article] [PubMed] [Google Scholar]
- 5.Nguyen TM, Caze AL, Cottrell N. What are validated self-report adherence scales really measuring? a systematic review. Br J Clin Pharmacol. 2014;77(3):427-45. [DOI] [PMC free article] [PubMed] [Google Scholar]
- 6.Kripalani S, Risser J, Gatti ME, Jacobson TA. Development and evaluation of the Adherence to Refills and Medications Scale (ARMS) among low-literacy patients with chronic disease. Value Health. 2009;12(1):118-23. [DOI] [PubMed] [Google Scholar]
- 7.Meddings J, Kerr EA, Heisler M, Hofer TP. Physician assessments of medication adherence and decisions to intensify medications for patients with uncontrolled blood pressure: still no better than a coin toss. BMC Health Serv Res. 2012;21;12:270. [DOI] [PMC free article] [PubMed] [Google Scholar]
- 8.Brown MT, Bussell JK. Medication adherence: WHO cares? Mayo Clin Proc. 2011;86(4):304-14. [DOI] [PMC free article] [PubMed] [Google Scholar]
- 9.Siddiqui A, Siddiqui AS, Jawaid M, Zaman KA. Physician’s perception versus patient’s actual incidence of drug nonadherence in chronic illnesses. Cureus. 2017;9(11):e1893. [DOI] [PMC free article] [PubMed] [Google Scholar]
- 10.Huizinga MM, Bleich SN, Beach MC, Clark JM, Cooper LA. Disparity in physician perception of patients’ adherence to medications by obesity status. Obesity (Silver Spring). 2010;18(10):1932-37. [DOI] [PMC free article] [PubMed] [Google Scholar]
- 11.van Ryn M. Research on the provider contribution to race/ethnicity disparities in medical care. Med Care. 2002;40:I140-I151. [DOI] [PubMed] [Google Scholar]
- 12.van Ryn M, Burgess D, Malat J, Griffin J. Physicians’ perceptions of patients’ social and behavioral characteristics and race disparities in treatment recommendations for men with coronary artery disease. Am J Public Health. 2006;96:351-57. [DOI] [PMC free article] [PubMed] [Google Scholar]
- 13.van Ryn M, Burke J. The effect of patient race and socio-economic status on physicians’ perceptions of patients. Soc Sci Med. 2000;50:813-28. [DOI] [PubMed] [Google Scholar]
- 14.Pharmacy Quality Alliance. PQA performance measures. 2016. Accessed March 11, 2021. https://www.pqaalliance.org/pqa-measures
- 15.Fairman K, Motheral B. Evaluating medication adherence: which measure is right for your program? J Manag Care Pharm. 2000;6(6):499-504. doi: 10.18553/jmcp.2000.6.6.499 [Google Scholar]
- 16.Beltran S, Lett LA, Cronholm PF. Nonadherence labeling in primary care: bias by race and insurance type for adults with type 2 diabetes. Am J Prev Med. 2019;57(5):P652-58. [DOI] [PubMed] [Google Scholar]
- 17.Baines LS, Little DJ, Nee R, Jindal RM. Non-adherence codes in the new ICD-10: need for prospective trials. Am J Nephrol. 2015;42:148-50. [DOI] [PubMed] [Google Scholar]
- 18.Gosmanova EO, Molnar MZ, Alrifai A, et al. Impact of non-adherence on renal and cardiovascular outcomes in U.S. veterans. Am J Nephrol. 2015;42:151-57. [DOI] [PMC free article] [PubMed] [Google Scholar]
- 19.Gosmanova EO, Lu JL, Streja E, et al. Association of medical treatment nonadherence with all-cause mortality in newly treated hypertensive U.S. veterans. Hypertension. 2014;64(5):951-57. [DOI] [PMC free article] [PubMed] [Google Scholar]
- 20.Shafrin J, May SG, Shrestha A, et al. Access to credible information on schizophrenia patients’ medication adherence by prescribers can change their treatment strategies: evidence from an online survey of providers. Patient Prefer Adherence. 2017;11:1071-81. [DOI] [PMC free article] [PubMed] [Google Scholar]
- 21.Shafrin J, Bognar K, Everson K, Brauer M, Lakdawalla DN, Forma FM. Does knowledge of patient non-compliance change prescribing behavior in the real world? A claims-based analysis of patients with serious mental illness. Patient Prefer Adherence. 2018;10:573-85. [DOI] [PMC free article] [PubMed] [Google Scholar]
- 22.Cohen JK. Medicare pilot gives physicians access to patients’ claims data. Modern Healthcare. July 30, 2019. Accessed March 11, 2021. https://www.modernhealthcare.com/care-delivery/medicare-pilot-gives-physicians-access-patients-claims-data