Abstract
Disulfidptosis is a newly discovered form of cell death. Not yet clearly classified as programmed cell death or accidental cell death. This study aimed to create a novel disulfidptosis-related lncRNA index (DLI) that can be used to predict survival and chemotherapy drugs sensitivity in patients with cervical cancer. First of all, we found lncRNAs associated with disulfidptosis between cervical cancer tissues and normal tissues. By LASSO-Cox analysis, overlapping lncRNAs were then used to construct lncRNA index associated with disulfidptosis, which can be served to predict the prognosis of patients with CC, especially the chemotherapy drugs sensitivity. ROC curves and PCA based on DLI and clinical signatures were developed and demonstrated to have good predictive potential. In addition, differences in immune cell subset infiltration and differences in immune checkpoint expression between high-DLI and low-DLI groups were analyzed, and we investigated the relationship between the DLI and tumor mutation burden (TMB). In summary, we constructed a lncRNA prediction index associated with disulfidptosis. This has important clinical implications, including improving the predictive value of cervical cancer patients and providing a biomarker for cervical cancer guiding individualized treatment.
Subject terms: Cancer, Computational biology and bioinformatics, Genetics, Biomarkers, Oncology
Introduction
In recent years, a remarkable surge in global cancer incidence and associated mortality rates has been reported. Cervical cancer (CC) ranks fourth in terms of the highest mortality and incidence rates among women globally1,2. The global age-standardized incidence of CC varies substantially among countries, with reported rates ranging from fewer than 13 cases to 1 case per 70,000 women. Noteworthy, CC is the chief cause of cancer-related deaths among women in low- and middle-income countries3. It is widely known that high-risk HPV strains are associated with CC. C While HPV is necessary for the transformation of cervical epithelial cells, other co-factors and molecular procedures also the occurrence of CC4,5. Therefore, the exploration of novel potential biomarkers and underlying mechanisms is important for predicting the prognosis and improving the treatment of CC.
Cell death is a crucial process for human health. In 2018, the Cell Death Nomenclature Committee classified this process into accidental cell death (ACD) and regulatory cell death (RCD). RCD, also known as programmed cell death (PCD), is a fully physiological form of cell death6. It plays an essential role in the development of an organism, acts as a host defense mechanism against pathogens and maintains homeostasis. However, excessive activation of the PCD pathway exerts detrimental effects and may lead to disease development7. At least 12 types of PCD that are implicated in the development of malignant tumors. In glucose-deficient SLC7A11−high cancer cells, the excessive accumulation of disulfide molecules causes abnormal disulfide bonding between actin cytoskeletal proteins, thus disrupting their organization and eventually leading to the collapse of the actin network and cell death. This effect, known as disulfidptosis, effectively inhibits the growth of malignant tumors with any apparent toxicity to normal tissues8,9. This process of disulfidptosis involves glycogen accumulation, energy metabolism, mitochondrial respiration and disulfide regulation. The genes responsible for regulating these processes have been identified from published literature. For instance, GYS1 induces glycogen accumulation10; LRPPRC affects mitochondrial autophagy by regulating energy metabolism11; NDUFA11 and NDUFS1 maintain the mitochondrial structure and function12; NUBPL is involved in the mitochondrial respiratory chain13; OXSM is involved in glycogen regulation14; NCKAP1, RPN1, SLC3A2, and SLC7A11 are involved in the regulation of disulfidptosis8,9. Therefore, further investigations on disulfidptosis, the genes affecting glucose and lipid metabolism, and the underlying mechanism of disulfidptosis will aid in the identification of potential novel targets of this disease.
Non-coding RNAs (ncRNAs) represent a novel class of transcripts. That, although mostly not translated into proteins, play crucial roles in various cellular and physiological functions15. Among them, long ncRNAs (lncRNAs) are implicated in cancer development, indicated by their mutations and dysregulated expression. lncRNAs can promote tumorigenesis and metastasis, while also possessing tumor-suppressive and pro-cancer functions16. As such, lncRNAs hold immense promise as novel biomarkers and therapeutic targets for cancer17. For instance, the lncRNA SNHG1 is involved in the migration and invasion of CC18. Considerably linked with tumor size, FIGO stage, and lymph node metastasis, The lncRNA FALEC has shown substantially elevated levels in the plasma of CC patients. Additionally, overexpression of lncRNA FALEC promotes HeLa cell invasion and proliferation19. However, to date, the specific disease targets and underlying mechanisms through which lncRNA regulate disulfidptosis-related genes and affect the prognosis of CC by means of disulfidptosis remain unexplored. We extracted RNA sequencing data of patients with CC from publicly accessed databases and used bioinformatics methods to screen for lncRNAs associated with disulfidptosis related-genes (such as GYS1 etc.) that have predictive prognostic significance. This study intended to identify ncRNA-based biological targets for predicting CC prognosis, discover potential chemotherapeutic drugs targeting ncRNAs, and unravel the mechanisms underlying disulfidptosis in CC.
Materials and methods
Downloading and organizing raw data
Transcriptomic data, clinicopathological data, copy number variation (CNV) data, and single nucleotide variation (SNV) data of patients with CC (304 tumor tissues and 3 normal tissues) from The Cancer Genome Atlas (TCGA) database (https://www.cancer.gov/). The Perl programming language (version 5.32.1.1) was used to organize data for subsequent analysis. The CNV profile of disulfidptosis-associated genes in CC was assessed by constructing a lollipop plot, and the R package “RCircos” was utilized to map the variant loci on the chromosome. Additionally, waterfall plots were constructed to detect the mutations existing in disulfidptosis-associated genes in CC. Among 289 cervical cancer samples, we screened these ten genes for somatic mutations in 29 samples and counted the somatic mutation frequencies.
Acquisition of disulfidptosis-associated lncRNAs and establishment of disulfidptosis-associated lncRNA index
Details of ten disulfidptosis-related genes were manually compiled from the literature. Pearson correlation analysis was performed to evaluate the relationship between disulfidptosis-related genes and lncRNAs, which was visualized using Sankey diagrams. The criteria for deducing the association were |R2|> 0.4 and p < 0.001. Univariate COX analysis was performed to screen for prognosis-related lncRNAs. Based on clinicopathological traits, patients with CC in the TCGA-CESC dataset were randomly split into a training cohort and a testing cohort in a 1:1 ratio. LASSO and multivariate COX regression were used for the training cohort to further refine the selection of the lncRNAs for model construction. Internal validation was subsequently performed in the testing cohort as well as in the entire TCGA dataset (TCGA cohort). The best prediction model was determined using the penalty parameter calculated through 1000-fold cross-validation with a p-value of 0.05.
The final formula for establishing the disulfidptosis-associated lncRNA index (DLI) is as follows:
where coeflncRNA represents the link between a lncRNA and the survival of patients with CC. and explncRNA represents the expression level of that particular lncRNA.
In addition, we validated the expression differences of the lncRNAs screened using the Wilcox test to test whether there were expression differences between normal and tumor tissues in the TCGA dataset.
Characterization of DLI
To assess the predictive value of the DLI in CC, we conducted validation analyses in each of the three cohorts: TCGA cohort, training cohort, and testing cohort. In the TCGA cohort, patients with CC were categorized into low-risk (< median) or high-risk (≥ median) groups based on median scores of DLI (Risk). Kaplan–Meier curves depicting overall survival (OS) and progression-free survival (PFS) were generated using the R packages “survminer” and “survival,” and the differences between the risk groups were calculated. Scatter plots, risk curves, and heatmaps were constructed to confirm the distribution of risk values among patients in different risk groups and to deduce the risk of CC-associated death.
Validation of the predictive ability of DLI
Univariate and multivariate COX regression analyses were performed to evaluate the independence of DLI relative to other clinical characteristics. Receiver operating characteristic curves (ROC) were generated to assess the sensitivity and specificity of prognostic predictive value of the DLI when compared with other clinicopathological characteristics in patients with CC.
PCA analysis and nomoscore calculation
Principal component analysis (PCA) analysis was employed to compare the risk definition and spatial distribution of patients based on various genetic classifications. This analysis facilitates the clinical utilization of the DLI and provides a comprehensive evaluation of patient prognosis. We integrated the prognostic characteristics (age, grade, and T, N, M) of patients with CC to calculate the predictive power on 1-, 3- and 5-years OS. Furthermore, multivariate Cox regression and stepwise regression analysis were performed to identify independent predictors Column plots were constructed, and nomoscore was calculated, which serves as a predictive tool for the outcomes of patients with CC. A nomogram was developed using the R package "regplot".
GO analysis and GSEA analysis
We used gene ontology (GO) to analyze the differential genes between high- and low-DLI groups using the "clusterProfiler" R package. In addition. We used GSEA software (version 6.2) to perform a gene set enrichment analysis (GSEA) and identify the primary pathways of action in the high- and low-DLI groups. The statistical significance of the screen was set at P < 0.05 and the false discovery rate (FDR) q < 0.05.
Analysis of the immune infiltration of the DLI and IPS score
We evaluated immune cell infiltration in TCGA samples using seven methods. The “GSVA” and “GSEABase” R packages are used to calculate differences in immune function between different risk groups. A box plot was also used to show the differences in immune checkpoint and immune cell infiltration between high- and low-DLI groups. Immunophenoscore (IPS) obtained from The Cancer Immunome Atlas (TCIA) database (https://tcia.at/home).
Tumor mutation burden landscape and chemotherapy drug sensitivity prediction
The "maftool" package was used to create waterfall plots showing differences in tumor mutation burden (TMB) between high- and low-risk groups. The Wilcoxon test was used to analyse survival differences between high- and low-mutation groups, and for joint survival analysis with different DLI groups. KM curves were used to visualise survival analysis.
Drug sensitivity was calculated using the "oncopredict" software package. This package was developed by Maeser et al.20 for drug sensitivity prediction. The IC50 value represents the sensitivity of the chemotherapeutic drug in the cell lines of this cancer type. Higher IC50 values mean that the drug is less sensitive and a higher dose is required to achieve the same efficacy. It fits the gene expression profile of a tissue to the half-maximal inhibitory concentration (IC50) of a cancer cell line to the economics of Drug Sensitivity in Cancer (GDSC). Download details from GDSC on molecular indicators of drug sensitivity and response in cancer cells20 to generate models that can be applied to CC transcriptomics data. The data from our high- and low-DLI groups were correlated with the expression profile data from GDSC, and then unpaired t-tests were used to compare the differences in IC50 of chemotherapeutic agents between the high and low DLI groups. A sensitivity score was then performed to forecast the IC50 for each drug's half-maximal inhibitory concentration in CC patients.
Statistical analysis
Software used in this study included R language and PERL, GSEA software (version). p < 0.05 (marked with *) was considered statistically significant.
Results
Differential expression and variation landscape of disulfidptosis-associated genes in patients with CC
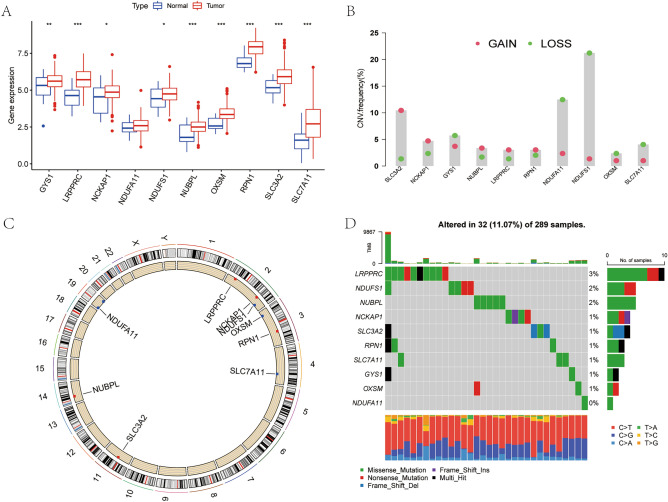
We analyzed the expression differences for the ten disulfidptosis-related genes between CC tumor tissues and normal tissues. Our findings revealed that all ten genes had upregulated expression in tumor tissues (Fig. 1A). Except for NDUFA11, the remaining nine genes showed significant differences in expression. Additionally, we investigated the CNV of the 10 genes in CC and observed that the CNVs were predominantly deletions. Notably, NDUF11 and NDUFS1 showed the highest number of copy number deletions (Fig. 1B), while SLC3A2 showed the most substantial increase in DNA copy number. The gene chromosomal loci at which these gene copy number variants are located are shown in Fig. 1C. A waterfall diagram showing the tumor mutations of these ten genes was constructed (Fig. 1D). Somatic mutations in these genes were found in 32 of 289 patients, with the highest mutation rate being LRPPRC.
Figure 1.
Differences in gene expression and variation landscape associated with disulfidptosis. (A) Differences in the expression of disulfidptosis-related genes between cervical cancer tissue and normal tissues. (B) The CNV landscape of disulfidptosis-related genes in TCGA-CESC datasets. (C) The site of CNV in disulfidptosis-related genes on chromosomes. (D) Somatic mutation landscape of disulfidptosis-related genes.
Construction of a prediction index for disulfidptosis-associated lncRNAs
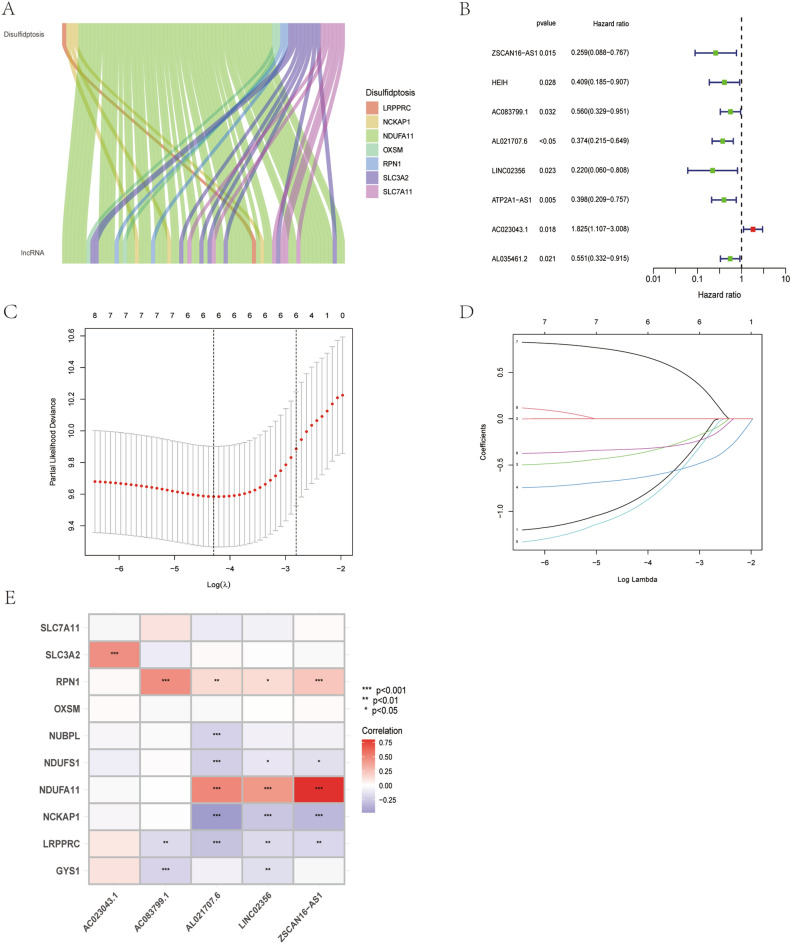
Spearman correlation analysis was performed to identify 71 lncRNAs associated with disulfidptosis-related genes (Fig. 2A). Subsequently, univariate COX regression analysis was conducted on the lncRNAs to assess their prognostic relevance. Based on the results, eight differentially expressed lncRNAs with prognostic significance were further screened and selected. Among the differentially expressed lncRNAs, one was determined as a risk factor and the remaining seven were identified as protective factors. We integrated transcriptomic data from TCGA-CESC datasets with clinical data, which generated training cohort and a testing cohort. No statistical difference in clinicopathological characteristics between the training and testing cohorts (Table 1). The LASSO-COX regression analysis was applied to the training set (eight candidate lncRNAs) to determine the optimal prediction score. Based on the optimal penalty parameter (λ) determined using the LASSO model, five lncRNAs were finally constructing the DLI. Cvfit curves and λ curves are shown in Fig. 2C,D. The expression differences of the five genes between the tumor tissues and normal tissues are shown in Supplementary Fig. S1. AC023043.1, AC083799.1, and AL021707.6 were up-regulated in tumor tissues, whereas LINC02356 and ZSCAN16-AS1 were up-regulated in normal tissues. We showed the association of these five lncRNAs with disulfidptosis-related genes in Fig. 2E, and the results indicated different degrees of regulation and correlation between the five lncRNAs and disulfidptosis-related genes. Particularly, the five lncRNAs showed a positive relationship with SLC3A2, RPN1, and NDUFA11 and a negative relationship with NUBPL, NDUFS1, NCKAP1, LRPPRC, and GYS1.
Figure 2.
Identification of the signature of disulfidptosis-related lncRNA. (A) Sankey diagram of lncRNAs co-expressed with disulfidptosis-related genes. (B) Forest plots of 8-lncRNA screening by COX regression related with disulfidptosis. (C,D) Lasso regression of the DLI of 5-lncRNA. (E) Heatmap shows the co-expression relationship between disulfidptosis-related lncRNA index and disulfidptosis-related genes.
Table 1.
Clinical characteristics of CC patients involved in the study.
| Total N = 304 |
Testing set n = 152 |
Training set n = 152 |
P-value | ||
|---|---|---|---|---|---|
| Age | ≤ 65 | 269 (88.49%) | 135 (88.82%) | 134 (88.16%) | 1 |
| Age | > 65 | 35 (11.51%) | 17 (11.18%) | 18 (11.84%) | |
| Grade | G1 | 18 (5.92%) | 7 (4.61%) | 11 (7.24%) | 0.5572 |
| Grade | G2 | 135 (44.41%) | 70 (46.05%) | 65 (42.76%) | |
| Grade | G3 | 118 (38.82%) | 59 (38.82%) | 59 (38.82%) | |
| Grade | G4 | 1 (0.33%) | 0 (0%) | 1 (0.66%) | |
| Grade | Unknow | 32 (10.53%) | 16 (10.53%) | 16 (10.53%) | |
| Stage | Stage I | 162 (53.29%) | 74 (48.68%) | 88 (57.89%) | 0.3226 |
| Stage | Stage II | 69 (22.7%) | 33 (21.71%) | 36 (23.68%) | |
| Stage | Stage III | 45 (14.8%) | 27 (17.76%) | 18 (11.84%) | |
| Stage | Stage IV | 21 (6.91%) | 12 (7.89%) | 9 (5.92%) | |
| Stage | Unknow | 7 (2.3%) | 6(3.95%) | 1 (0.66%) | |
| T | T1 | 140 (46.05%) | 68 (44.74%) | 72 (47.37%) | 0.3438 |
| T | T2 | 71 (23.36%) | 35 (23.03%) | 36 (23.68%) | |
| T | T3 | 20 (6.58%) | 7 (4.61%) | 13 (8.55%) | |
| T | T4 | 10 (3.29%) | 7 (4.61%) | 3 (1.97%) | |
| T | Unknow | 63 (20.72%) | 35 (23.03%) | 28 (18.42%) | |
| M | M0 | 116 (38.16%) | 59 (38.82%) | 57 (37.5%) | 0.8219 |
| M | M1 | 10 (3.29%) | 6 (3.95%) | 4 (2.63%) | |
| M | Unknow | 178 (58.55%) | 87 (57.24%) | 91 (59.87%) | |
| N | N0 | 133 (43.75%) | 67 (44.08%) | 66 (43.42%) | 0.5919 |
| N | N1 | 60 (19.74%) | 27 (17.76%) | 33 (21.71%) | |
| N | Unknow | 111 (36.51%) | 58 (38.16%) | 53 (34.87%) |
Characteristics of DLI
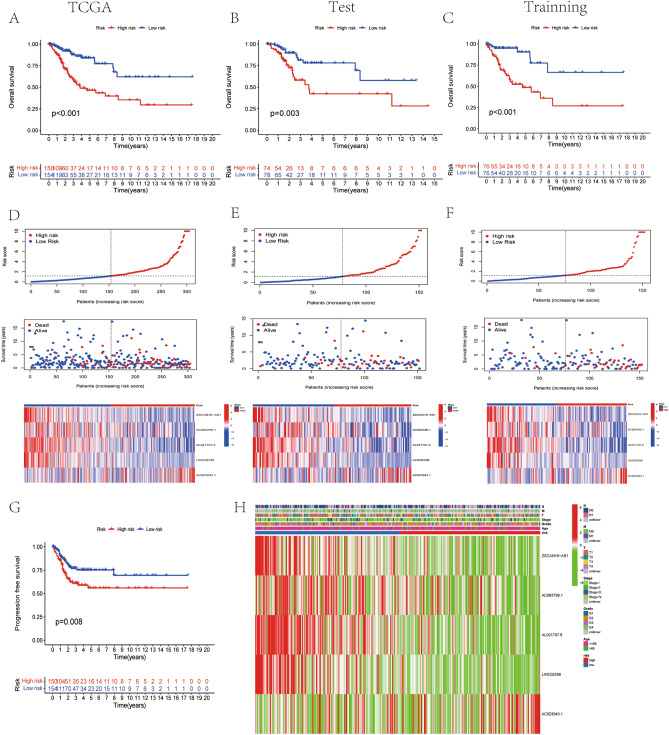
To assess the predictive potential of the DLI, we performed prognostic analyses in three cohorts: TCGA cohort, training cohort, and testing cohort. Patients in these cohorts were categorized into two groups, namely, low- and high-DLI groups, according to the median score of the DLI. Kaplan–Meier analysis of OS analysis revealed that patients in the low-DLI group exhibited a better prognosis than these in high-DLI group across all three cohorts (Fig. 3A–C). In all three cohorts, patients in the high-DLI group had an increased risk of death when compared with those in the low-DLI group (Fig. 3D–F). Furthermore, PFS was also evaluated in patients with CC, which yielded consistent results with the predicted outcome of OS, showing improved PFS outcomes in the low-DLI group (Fig. 3G). Risk grouping and clinical characteristics of all CC cases are shown in Fig. 3H. As shown in the figure, the lncRNA AC023043.1 showed high expression in patients of the high-DLI group and was a risk factor, whereas the other four lncRNAs showed low expression and were protective factors.
Figure 3.
Characteristics of disulfidptosis-related lncRNA index. (A–C) The OS of TCGA cohort, the testing cohort, and the training cohort. (D–F) Risk characteristics between high- and low- risk (DLI) groups in TCGA cohort, the testing cohort, and the training cohort. (G) The PFS survival analysis in TCGA cohort. (H) Heatmap of expression in five lncRNAs in TCGA and distribution of clinical features.
Assessment of DLI predictive capability
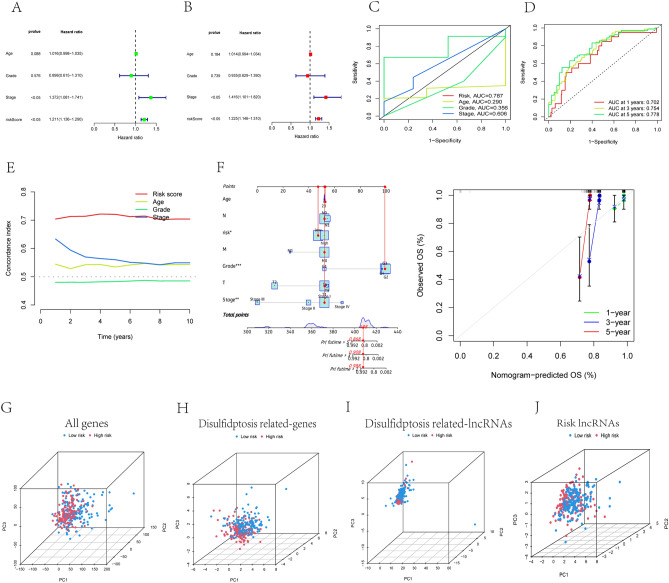
To assess the independence and accuracy of the DLI, we performed univariate and multivariate Cox regression analyses incorporating patient age, sex, and tumor grade to determine independent prognostic factors (Fig. 4A,B). The hazard ratio of the risk score was statistically significant (P < 0.05). These r analyses indicated that the prognostic predictive power of the DLI was independent of other clinical characteristics. Furthermore, the ROC curve (Fig. 4C) demonstrated that DLI was a more accurate predictors than other clinical characteristics (area under the curve [AUC] = 0.787). The predictive power of survival 1 years (AUC = 0.702), 3 years (AUC = 0.754), and 5 years (AUC = 0.778) was excellent (Fig. 4D), The C-index curves further supported these findings, with C-index values being greater than 0.7 (Fig. 4E). We believed that combined DLI and other clinical characteristics (age, grading, staging, T, N, M) is a more convenient predictive tool and has stronger predictive power in clinical applications. So we calculated nomoscore and plotted nomogram (Fig. 4F). The nomoscore showed a significant increase in the predictive confidence for 1-, 3- and 5-year survival rates after combining clinical features (0.988, 0.908, and 0.898, respectively). To validate the spatial grouping performance of risk scores for patients with CC and visualize the discriminating ability and power of DLI among patients, we conducted PCA for all four gene groups (Fig. 4G–J). The results indicated that DLI could more accurately determine the risk cutoff for patients than the other gene sets.
Figure 4.
Validation of the disulfidptosis-related lncRNA signature. (A,B) The disulfidptosis-related lncRNA signature was shown to be an independent risk factor for patients' overall survival in TCGA. (C) The AUC showed that index (risk score) was an independent predictor compared with other clinicopathological signatures. (D) The C-Index of the DLI (risk score) was higher than other clinicopathological signatures. (E) The DLI could be used as an independent predictor to predict the OS of 1-, 3-, 5 years. (F) The nomogram of DLI combined with other clinical features. (G) PCA of all genes. (H) PCA of disulfidptosis-related genes. (I) PCA of disulfidptosis-related lncRNAs. (J) PCA of DLI.
Gene ontology analysis and gene set enrichment analysis
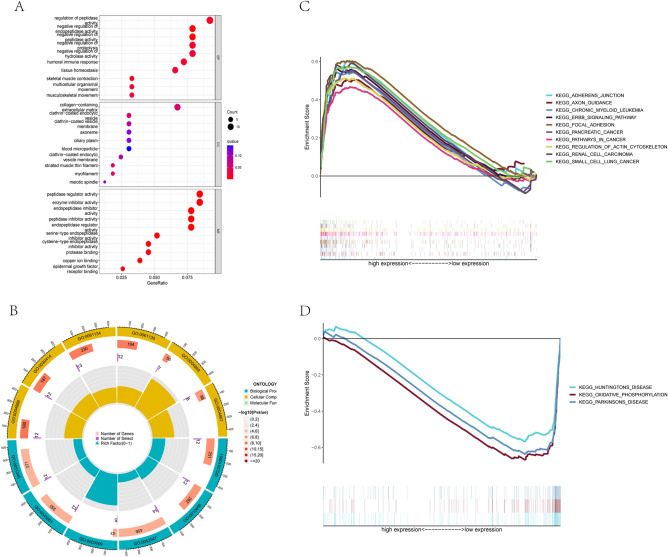
Additionally, we performed gene ontology (GO) analysis on the differentially expressed genes between the low-DLI and high-DLI groups. The analysis revealed that the differentially expressed genes were enriched mainly in the regulation of peptidase activity and function (Fig. 5A,B). Furthermore, gene set enrichment analysis (GSEA) demonstrated that the high-DLI group was enriched mainly in malignant and pan-cancer-related pathways as well as cell adhesion (Fig. 5C). By contrast, the low-DLI group was functionally enriched mainly in neurological disorders and biological oxidation (Fig. 5D).
Figure 5.
GO and GSEA analysis. (A) The bubble diagram of GO analysis. (B) The circle graph of GO analysis. (C) GSEA analysis of the high DLI group. (D) GSEA analysis of the low DLI group.
Immune infiltration for risk scores and prediction of immunotherapy
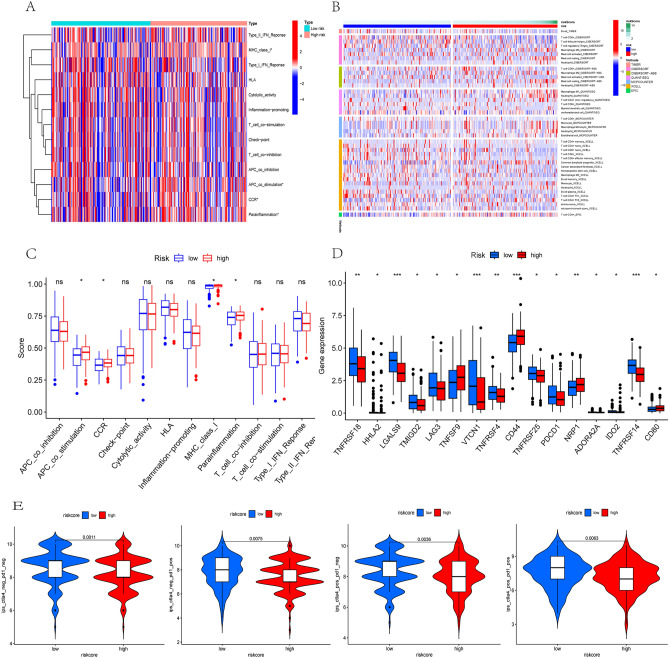
The immune function of the two risk groups is presented in Fig. 6A. Quantification of the differences is shown in Fig. 6C, indicating that among the four statistically different immune functions (antigen-presenting cell [APC] co-stimulation, chemokine receptor [CCR], major histocompatibility complex [MHC] class I presentation, and para-inflammation), the high-DLI group showed enrichment in immune functions when compared with the low-DLI group. Additionally, we assessed immune cell infiltration between the low-DLI and high-DLI groups (Fig. 6B), and observed higher infiltration of CD4+T cells and CD8+T cells in the high-DLI group. Furthermore, we analyzed the differences in immune checkpoints between the two groups (Fig. 6D) and observed that the TNF family was highly expressed in the low-risk group, which may be one of the reasons for tumor progression inhibition. By contrast, VTCN1 was highly expressed in the low-risk group when compared with that in the high-risk group, which requires further investigation. To obtain a prediction of the effectiveness of immunotherapy for CC, we calculated the immune prognostic score (IPS) for patients in the high-risk and low-risk groups. We discovered that regardless of the positive or negative status of CTLA4 and programmed death ligand 1 (PD-L1), the IPSs were lower in the high-risk group than in the low-risk group, indicating a potentially better response to immunotherapy (Fig. 6E).
Figure 6.
Immune infiltration analysis of the signature. (A) Heatmap showed immune cells and immune function between high and low risk groups in all samples. (B) Heatmap of immune penetration based on TIMER, CIBERSORT, CIBERSORT-ABS, QUANTISEQ, MCPCOUNTER, and XCELL algorithms. (C) Differences in immune function between high- and low-DLI groups. (D) Differences in immune checkpoints between high- and low-DLI groups. (E) Differences in IPS between high- and low-DLI groups.
Tumor mutational burden differences in DLI
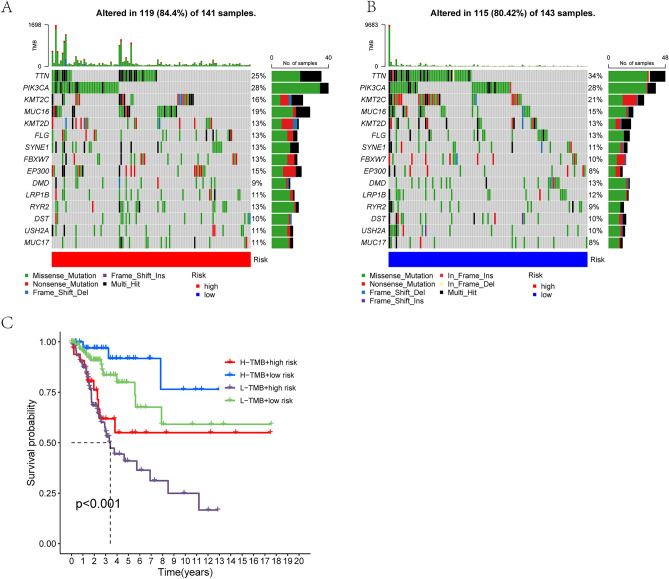
Tumor mutational burden (TMB) is crucial for tumor prognosis. The mutations in different DLI groups are depicted in Fig. 7A,B. While the mutation rate was slightly higher in the high-DLI group than in the low-DLI group, the difference was no statistically significant. Notably, the number of mutations in TTN (Titin gene) and KMT2C was significantly higher in the low-DLI group than in the high-DLI group. While further analyzing the predictive role of TMB on OS, we observed that the high-mutation group combined with the low-DLI group had the most favorable prognosis, whereas the low-mutation group combined with the high-DLI group had the worst prognosis (Fig. 7C).
Figure 7.
Relationship between DLI and tumor mutation burden. (A,B) Waterfall plots of somatic mutation characteristics in the high-DLI and low-DLI groups. (C) K–M survival curves between the four groups.
Prediction of chemotherapy drug sensitivity by DLI
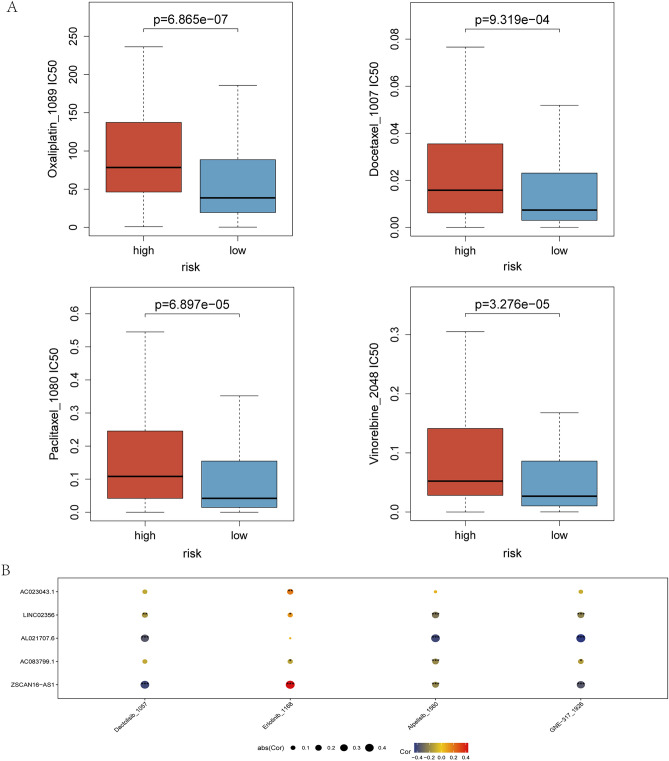
Chemotherapy is an important treatment for CC. To predict the differences in chemotherapeutic drugs sensitivity among patients in different DLI groups, we calculated the IC50 values of various chemotherapeutic drugs in different risk groups using the Genomics of Drug Sensitivity in Cancer (GDSC) database. The results demonstrated that the IC50 values for all commonly used chemotherapeutic agents in CC were higher in the high-DLI group than in the low-DLI group. Specifically, the sensitivity to chemotherapeutic drugs was higher in the low-DLI group than in the high-DLI group (Fig. 8A). Furthermore, we identified four chemotherapy drugs (oxaliplatin, docetaxel, paclitaxel, and vinorelbine) for use in CC. The chemotherapeutic drugs that correlated with the five lncRNAs of the construct score were screened for future research on CC treatment. Figure 8B shows a bubble plot illustrating the correlation between gene expression and chemotherapeutic drugs, where the size and color of the bubbles represent the magnitude of positive and negative correlations, respectively. AL021706.6 expression showed a negative correlation with the IC50 values of Dactolisib, Alpelisib and GNE-317, while ZSCAN16-AS1 showed a positively associated with Erlotinib, and a negatively associated with Dactolisib and GNE-317.
Figure 8.
Chemotherapy drug sensitivity prediction for DLI. (A) Differences in sensitivity of commonly used chemotherapeutic drugs for CC. (B) Chemotherapeutic drug prediction with correlation to five lncRNAs in DLI.
Discussion
ncRNAs, especially lncRNAs, affect CC progression through the cell death pathway and sensitivity to radiotherapy21,22. However, given the limited treatment options and poor prognosis of locally advanced and intermediate-stage CC23. The discovery of novel predictive targets and exploration of potential therapeutic agents are of utmost importance. Disulfidptosis, a newly discovered mode of cell death, has not yet been extensively studied in CC. Nonetheless, we believe that disulfidptosis involves related genes regulated by ncRNAs. Given our focus on lncRNAs, we screened publicly available databases to explore disulfidptosis-related lncRNAs that could serve as predictive targets.
In the present research, we investigated the expression of disulfidptosis-related genes in CC and observed that these ten genes had upregulated expression in tumor tissues. Consequently, we identified lncRNAs associated with upstream-elements and used a machine learning approach to screen for five lncRNAs differentially expressed lncRNAs with prognostic and predictive ability. These five lncRNAs were used to construct a DLI for CC. This index demonstrated the ability to predict the risk of death, OS, and PFS in patients with CC, with better outcomes observed in the low-DLI group. We conducted a literature survey on the five lncRNAs that comprising the index and discovered that three of the lncRNAs had been previously reported in studies on other cancer types. For instance, silencing of ZSCAN16-AS1 inhibits hepatocellular carcinoma (HCC) cell proliferation, migration and invasion, as well as acceleration of HCC cell apoptosis24. However, in our study, ZSCAN16-AS1 was highly expressed in the low-DLI group, a finding that is inconsistent with its expression in HCC. We believe this inconsistency is attributed to the heterogeneity of tumors. However, this finding should be confirmed in future studies on CC apart from elucidating the underlying mechanism. AC083799.1 as well as AC023043.1 are part of predictive models for the prognosis of endometrial cancer25 and kidney cancer26, respectively. Nevertheless, AL021707.6 and LINC02356 have not been reported yet, presenting a direction for future research in CC.
We conducted further validation to assess the independence, accuracy, and specificity of the DLI in prognostic prediction for CC. Independent prognostic analysis verified that the index could serve as a prognostic factor independent of other clinical characteristics. The ROC curve demonstrated that the diagnostic accuracy and predictive accuracy of the index were superior to those of other clinical factors, while the C-index curve indicated a higher specificity than that for other clinical factors. Furthermore, the risk score derived from the index was more widely applicable and provided a clearer definition of patient management stratification than other genetic characteristics. The Nomoscores, calculated in conjunction with other clinical factors, improved the accuracy of the prognostic assessment for patients. These validations collectively indicate that the DLI exhibits superior independence, accuracy and specificity and can be used as a target for prognostic prediction in CC.
The immune environment, which is the most critical part of the tumor microenvironment, plays a crucial role in the regulating disease progression and response to anticancer therapy27,28. Currently, programmed death ligand 1 (PD-L1) expression is utilized in clinical practice to identify patients with CC who may benefit from immune checkpoint inhibitor therapy. However, recent information suggests that PD-L1 may not be a completely reliable biomarker for patient selection29. Therefore, we conducted further analysis of the immune microenvironment between the high- and low-DLI groups based on the index. Our findings revealed that immune functions (APC-co-stimulation, CCR, MHC-class-I and parainflammation) were enriched mainly in the high-DLI group. Conversely, several algorithms for immune infiltration indicated a greater enrichment of CD4+ T cells and CD8+ T cells in the low-DLI group than in the high-DLI group. This disparity can be explained by the prolonged presence of tumor antigens and inflammatory stimuli in the high-DLI group, leading to T-cell exhaustion30, and weakened tumor-killing ability, thus resulting in a worse prognosis. Based on these findings, we believe that strategies aimed at alleviating T-cell exhaustion and enhancing effector T-cell function hold promise as potential therapeutic directions for improving the prognosis of patients with CC.
In terms of immune checkpoint expression, TNFRSF18, TNFRSF4, TNFRSF24, TNFRSF14 were significantly upregulated in the low-DLI group. The tumor necrosis factor (TNF), TNF receptor (TNFR), and TNF/TNFR superfamily (TNFSF/TNFRSF) include 29 receptors and 19 ligands that play a crucial role in controlling cellular processes. Communication routes mediated by TNFSF and TNFRSF are essential for various developmental, homeostatic, and stimulus-responsive processes in vivo31,32. Members of the TNF family have been shown potential as novel targets for tumor immunotherapy33. CD44, another important clinical target, is commonly regarded as a cancer stem cell (CSC) marker in various malignancies. High expression of CD44 significantly upregulate stumorigenic processes such as cell proliferation, metastasis, invasion, migration, and stemness34. Our study revealed upregulated CD44 expression in the high-DLI groups, consistent with the findings of previous studies. VTCN1 is also a well-reported immunotherapeutic target that promotes invasive metastasis in multiple cancer types including ovarian cancer26. In CC, VTCN1 expression facilitates the immunosuppressive microenvironment by promoting the production of IL-10 and transforming growth factor(TGF)-β1, contributing to the progression of cervical carcinogenesis35. However, in our study, we observed the elevated VTCN1 expression in the low-DLI group, which may attributed to the complex microenvironment of the tumor, and this finding should be validated in further investigations. Regarding the prediction of immunotherapy efficacy, IPS scores were calculated for the two DLI groups. The results indicated that the IPS score of the low- DLI group was higher than that of the high-DLI group in all four gene groups, suggesting that the low-DLI group has higher immunogenicity, while the high-DLI group may receive more benefit from immunotherapy strategies involving CTLA-4 blockers and PD-L1 blockers. These findings suggest that the index could serve as a reference for patient selection of immunotherapy regimens.
TMB is associated with clinical response to immune checkpoint blockade therapy in certain tumors36,37. Our study suggested no significant difference in total TMB between the high-DLI and low-DLI groups. However, TTN exhibited a considerably higher mutation frequency in the low-DLI group than in the high-DLI group, making it the gene with the largest difference in mutation frequency. TTN mutations are identified as prognostic factor in a variety of diseases, although their effect differs among different cancer types. For example, TTN mutations are positively associated with prognosis in lung squamous cell carcinoma (LUSC)38, but the association may differ in thyroid cancer39. Survival analysis also demonstrated that high TMB combined with low-DLI resulted in the most favorable prognosis. Future studies should further investigate whether the improved prognosis is attributed to increased TTN mutations.
The sensitivity of chemotherapy in patients with CC notably affects prognosis. Simultaneous chemotherapy and radiotherapy (concurrent chemoradiation therapy) plus brachytherapy is the standard-of-care treatment for CC beyond locally advanced stages40,41.The recommended chemotherapy regimens involve platinum-based agents, paclitaxel or docetaxel used in combination with platinum-based agents42. However, platinum drugs, which are non-specific chemotherapeutic agents, often cause severe systemic adverse reactions, and the recurrence and distant metastasis rates of CC after chemotherapy remain high at 40%43. Therefore, other chemotherapeutic agents have been extensively studied in CC treatment. Clinical trials investigating the use of vincristine for CC treatment have also been conducted44. Our findings indicated elevated IC50 values for oxaliplatin, docetaxel, paclitaxel, and vincristine in the high-DLI group, suggesting that the low-DLI group exhibited better chemotherapy sensitivity than the high-DLI group. This can be directly applied to the clinical selection of commonly used chemotherapeutic agents.
Furthermore, our study derived novel findings by refining the prediction of the expression of the five lncRNAs in DLI in relation to the sensitivity to targeted drugs. For instance, Dactolisib, a dual PI3K and mTORC1/2 inhibitor has shown potential benefits in CC treatment45. Erlotinib treatment sensitizes CSCs to paclitaxel treatment in vitro and in vivo46, Alpelisib demonstrates antitumor effects and enhances cisplatin efficacy through the PI3K/AKT pathway in PIK3CA mutant CC cells47. The expression of AL021707.6 as well as ZSCAN16-AS1 showed interesting correlation with the IC50 of these drugs, indicating a new direction in the study of targeting drugs in CC.
Combining the aforementioned predictions, we conclude that the risk classification of patients based on the risk scoring model constructed by disulfidptosis-related lncRNA provides valuable insights. We developed a DLI consisting of five lncRNAs. Of these five lncRNAs, ZSCAN16-AS1, AC083799.1, AL021707.6, and LINC02356 can be used as protective factors, while AC023043.1 can be used as a risk factor. The high-DLI group may exhibit increased sensitivity to immunotherapy, while the low-DLI group is more likely to benefit from chemotherapy. Clinically, detecting of the expression levels of these five lncRNAs can be used to predict the prognosis of patients with CC, guiding immunotherapy predictions, and aid the selection of chemotherapeutic agents and targeted drugs.
Our study still has some shortcomings. First, our study was based on a public database with limited sample size and lack of external data set validation. Secondly, we need to implement further experimental programs to confirm our study. In addition, the mechanism by which our model affects the prognosis of still needs further investigation.
Conclusions
Our study defined five lncRNAs associated with disulfidptosis, and their index was shown to predict the prognosis of CC patients with independence, accuracy, and specificity, which could predict patient survival and facilitate clinical management of patients in a stratified manner combined with clinical characteristics. In addition, it could be used as a predictive target for the prognosis and treatment of CC, as well as a guide for the sensitivity of patients to immunotherapy and chemotherapy.
Supplementary Information
Acknowledgements
We are grateful to the data from The Cancer Genome Atlas.
Abbreviations
- CESC
Cervical squamous cell carcinoma and endocervical adenocarcinoma
- CC
Cervical cancer
- LncRNA
Long non-coding RNA
- CNV
Copy number variation
- SNV
Single nucleotide variation
- TTN
Titin gene
- HCC
Hepatocellular carcinoma
- CSC
Cancer stem cell
- TCGA
The Cancer Genome Atlas
- LASSO
Least absolute shrinkage and selection operator
- ROC
Receiver operating characteristic curve
- OS
Overall survival
- PFS
Progression-free survival
- GSEA
Gene set enrichment analysis
- HR
Hazard ratio
- K-M
Kaplan–Meier
- GO
Gene ontology
- TMB
Tumor mutation burden
- IPS
Immunophenoscore
Author contributions
Z.W. conceived, designed, and supervised the study. L.L. and J.L. performed data analysis and drafted the manuscript. J.H., Y.C. and C.F. collected the data, Y.L. and F.C. arranged the figures. Q.L. revised the manuscript. All authors reviewed and approved the final manuscript. L.L., J.L. and Q.L. contributed equally.
Funding
This project was funded by a grant from Medical Research Topics of Foshan Health Bureau, Guangdong Province, China (20230163).
Data availability
The RNA sequencing profiles are able to be gained from The Cancer Genome Atlas (TCGA) (https://portal.gdc.cancer.gov/). Further inquiries can be directed to the corresponding author.
Competing interests
The authors declare no competing interests.
Footnotes
Publisher's note
Springer Nature remains neutral with regard to jurisdictional claims in published maps and institutional affiliations.
These authors contributed equally: Li Liu, Jun Liu and Qianbao Lyu.
Supplementary Information
The online version contains supplementary material available at 10.1038/s41598-023-39669-3.
References
- 1.Bray F, Ferlay J, Soerjomataram I, Siegel RL, Torre LA, Jemal A. Global cancer statistics 2018: GLOBOCAN estimates of incidence and mortality worldwide for 36 cancers in 185 countries. CA Cancer J. Clin. 2018;68(6):394–424. doi: 10.3322/caac.21492. [DOI] [PubMed] [Google Scholar]
- 2.Sung H, Ferlay J, Siegel RL, Laversanne M, Soerjomataram I, Jemal A, Bray F. Global Cancer Statistics 2020: GLOBOCAN estimates of incidence and mortality worldwide for 36 cancers in 185 countries. CA Cancer J. Clin. 2021;71(3):209–249. doi: 10.3322/caac.21660. [DOI] [PubMed] [Google Scholar]
- 3.Arbyn M, Weiderpass E, Bruni L, de Sanjosé S, Saraiya M, Ferlay J, Bray F. Estimates of incidence and mortality of cervical cancer in 2018: A worldwide analysis. Lancet Glob. Health. 2020;8(2):e191–e203. doi: 10.1016/S2214-109X(19)30482-6. [DOI] [PMC free article] [PubMed] [Google Scholar]
- 4.Burd EM. Human papillomavirus and cervical cancer. Clin. Microbiol. Rev. 2003;16(1):1–17. doi: 10.1128/CMR.16.1.1-17.2003. [DOI] [PMC free article] [PubMed] [Google Scholar]
- 5.Saleh M, Virarkar M, Javadi S, Elsherif SB, de Castro FS, Bhosale P. Cervical cancer: 2018 revised international federation of gynecology and obstetrics staging system and the role of imaging. AJR Am. J. Roentgenol. 2020;214(5):1182–1195. doi: 10.2214/AJR.19.21819. [DOI] [PubMed] [Google Scholar]
- 6.Galluzzi L, Vitale I, Aaronson SA, Abrams JM, Adam D, Agostinis P, Alnemri ES, Altucci L, Amelio I, Andrews DW, et al. Molecular mechanisms of cell death: Recommendations of the nomenclature committee on cell death 2018. Cell Death Differ. 2018;25(3):486–541. doi: 10.1038/s41418-017-0012-4. [DOI] [PMC free article] [PubMed] [Google Scholar]
- 7.Christgen S, Tweedell RE, Kanneganti TD. Programming inflammatory cell death for therapy. Pharmacol. Ther. 2022;232:108010. doi: 10.1016/j.pharmthera.2021.108010. [DOI] [PMC free article] [PubMed] [Google Scholar]
- 8.Machesky LM. Deadly actin collapse by disulfidptosis. Nat. Cell Biol. 2023;25(3):375–376. doi: 10.1038/s41556-023-01100-4. [DOI] [PubMed] [Google Scholar]
- 9.Liu X, Nie L, Zhang Y, Yan Y, Wang C, Colic M, Olszewski K, Horbath A, Chen X, Lei G, et al. Actin cytoskeleton vulnerability to disulfide stress mediates disulfidptosis. Nat. Cell Biol. 2023;25(3):404–414. doi: 10.1038/s41556-023-01091-2. [DOI] [PMC free article] [PubMed] [Google Scholar]
- 10.Chen SL, Huang QS, Huang YH, Yang X, Yang MM, He YF, Cao Y, Guan XY, Yun JP. GYS1 induces glycogen accumulation and promotes tumor progression via the NF-κB pathway in Clear Cell Renal Carcinoma. Theranostics. 2020;10(20):9186–9199. doi: 10.7150/thno.46825. [DOI] [PMC free article] [PubMed] [Google Scholar]
- 11.Cui J, Wang L, Ren X, Zhang Y, Zhang H. LRPPRC: A multifunctional protein involved in energy metabolism and human disease. Front. Physiol. 2019;10:595. doi: 10.3389/fphys.2019.00595. [DOI] [PMC free article] [PubMed] [Google Scholar]
- 12.Gu J, Wu M, Guo R, Yan K, Lei J, Gao N, Yang M. The architecture of the mammalian respirasome. Nature. 2016;537(7622):639–643. doi: 10.1038/nature19359. [DOI] [PubMed] [Google Scholar]
- 13.Wang Y, Wu N, Sun D, Sun H, Tong D, Liu D, Pang B, Li S, Wei J, Dai J, et al. NUBPL, a novel metastasis-related gene, promotes colorectal carcinoma cell motility by inducing epithelial-mesenchymal transition. Cancer Sci. 2017;108(6):1169–1176. doi: 10.1111/cas.13243. [DOI] [PMC free article] [PubMed] [Google Scholar]
- 14.Gao T, Qian S, Shen S, Zhang X, Liu J, Jia W, Chen Z, Ye J. Reduction of mitochondrial 3-oxoacyl-ACP synthase (OXSM) by hyperglycemia is associated with deficiency of α-lipoic acid synthetic pathway in kidney of diabetic mice. Biochem. Biophys. Res. Commun. 2019;512(1):106–111. doi: 10.1016/j.bbrc.2019.02.155. [DOI] [PubMed] [Google Scholar]
- 15.Khalil AM, Guttman M, Huarte M, Garber M, Raj A, Rivea Morales D, Thomas K, Presser A, Bernstein BE, van Oudenaarden A, et al. Many human large intergenic noncoding RNAs associate with chromatin-modifying complexes and affect gene expression. Proc. Natl. Acad. Sci. U. S. A. 2009;106(28):11667–11672. doi: 10.1073/pnas.0904715106. [DOI] [PMC free article] [PubMed] [Google Scholar]
- 16.Guttman M, Amit I, Garber M, French C, Lin MF, Feldser D, Huarte M, Zuk O, Carey BW, Cassady JP, et al. Chromatin signature reveals over a thousand highly conserved large non-coding RNAs in mammals. Nature. 2009;458(7235):223–227. doi: 10.1038/nature07672. [DOI] [PMC free article] [PubMed] [Google Scholar]
- 17.Bhan A, Mandal SS. LncRNA HOTAIR: A master regulator of chromatin dynamics and cancer. Biochim. Biophys. Acta. 2015;1856(1):151–164. doi: 10.1016/j.bbcan.2015.07.001. [DOI] [PMC free article] [PubMed] [Google Scholar]
- 18.Liu Y, Yang Y, Li L, Liu Y, Geng P, Li G, Song H. LncRNA SNHG1 enhances cell proliferation, migration, and invasion in cervical cancer. Biochem. Cell Biol. 2018;96(1):38–43. doi: 10.1139/bcb-2017-0188. [DOI] [PubMed] [Google Scholar]
- 19.Naizhaer G, Kuerban A, Meilipa KR, Zhou P. Up-regulation of lncRNA FALEC indicates prognosis and diagnosis values in cervical cancer. Pathol. Res. Pract. 2019;215(8):152495. doi: 10.1016/j.prp.2019.152495. [DOI] [PubMed] [Google Scholar]
- 20.Maeser D, Gruener RF, Huang RS. oncoPredict: An R package for predicting in vivo or cancer patient drug response and biomarkers from cell line screening data. Brief Bioinform. 2021;22(6):bbab260. doi: 10.1093/bib/bbab260. [DOI] [PMC free article] [PubMed] [Google Scholar]
- 21.Guo X, Xiao H, Guo S, Li J, Wang Y, Chen J, Lou G. Long noncoding RNA HOTAIR knockdown inhibits autophagy and epithelial–mesenchymal transition through the Wnt signaling pathway in radioresistant human cervical cancer HeLa cells. J. Cell Physiol. 2019;234(4):3478–3489. doi: 10.1002/jcp.26828. [DOI] [PubMed] [Google Scholar]
- 22.Liu HM, Ji F, Lu Y, Chen SY. MiR-499b-5p inhibits cervical cancer cell proliferation and induces apoptosis by targeting the Notch1 signaling pathway. Eur. Rev. Med. Pharmacol. Sci. 2021;25(20):6220–6231. doi: 10.26355/eurrev_202110_26992. [DOI] [PubMed] [Google Scholar]
- 23.Minion LE, Tewari KS. Cervical cancer—State of the science: From angiogenesis blockade to checkpoint inhibition. Gynecol. Oncol. 2018;148(3):609–621. doi: 10.1016/j.ygyno.2018.01.009. [DOI] [PMC free article] [PubMed] [Google Scholar]
- 24.Liu J, Liu R, Liu Y, Li L, Cao H, Liu J, Cao G. ZSCAN16-AS1 expedites hepatocellular carcinoma progression via modulating the miR-181c-5p/SPAG9 axis to activate the JNK pathway. Cell Cycle. 2021;20(12):1134–1146. doi: 10.1080/15384101.2021.1919828. [DOI] [PMC free article] [PubMed] [Google Scholar]
- 25.Liu H, Cheng Y. Identification of autophagy-related long non-coding RNAs in endometrial cancer via comprehensive bioinformatics analysis. BMC Womens Health. 2022;22(1):85. doi: 10.1186/s12905-022-01667-4. [DOI] [PMC free article] [PubMed] [Google Scholar]
- 26.Cheng G, Liu D, Liang H, Yang H, Chen K, Zhang X. A cluster of long non-coding RNAs exhibit diagnostic and prognostic values in renal cell carcinoma. Aging (Albany NY) 2019;11(21):9597–9615. doi: 10.18632/aging.102407. [DOI] [PMC free article] [PubMed] [Google Scholar]
- 27.Fridman WH, Galon J, Pagès F, Tartour E, Sautès-Fridman C, Kroemer G. Prognostic and predictive impact of intra- and peritumoral immune infiltrates. Cancer Res. 2011;71(17):5601–5605. doi: 10.1158/0008-5472.CAN-11-1316. [DOI] [PubMed] [Google Scholar]
- 28.Galon J, Angell HK, Bedognetti D, Marincola FM. The continuum of cancer immunosurveillance: Prognostic, predictive, and mechanistic signatures. Immunity. 2013;39(1):11–26. doi: 10.1016/j.immuni.2013.07.008. [DOI] [PubMed] [Google Scholar]
- 29.Manrriquez EN, Zakhour M, Salani R. Precision medicine for cervical cancer. Curr. Opin. Obstet. Gynecol. 2022;34(1):1–5. doi: 10.1097/GCO.0000000000000755. [DOI] [PubMed] [Google Scholar]
- 30.Belk JA, Daniel B, Satpathy AT. Epigenetic regulation of T cell exhaustion. Nat. Immunol. 2022;23(6):848–860. doi: 10.1038/s41590-022-01224-z. [DOI] [PMC free article] [PubMed] [Google Scholar]
- 31.So T, Ishii N. The TNF-TNFR family of co-signal molecules. Adv. Exp. Med. Biol. 2019;1189:53–84. doi: 10.1007/978-981-32-9717-3_3. [DOI] [PubMed] [Google Scholar]
- 32.Dostert C, Grusdat M, Letellier E, Brenner D. The TNF family of ligands and receptors: Communication modules in the immune system and beyond. Physiol. Rev. 2019;99(1):115–160. doi: 10.1152/physrev.00045.2017. [DOI] [PubMed] [Google Scholar]
- 33.Starzer AM, Berghoff AS. New emerging targets in cancer immunotherapy: CD27 (TNFRSF7) ESMO Open. 2020;4(Suppl 3):e000629. doi: 10.1136/esmoopen-2019-000629. [DOI] [PMC free article] [PubMed] [Google Scholar]
- 34.Hassn Mesrati M, Syafruddin SE, Mohtar MA, Syahir A. CD44: A multifunctional mediator of cancer progression. Biomolecules. 2021;11(12):1850. doi: 10.3390/biom11121850. [DOI] [PMC free article] [PubMed] [Google Scholar]
- 35.Han S, Wang Y, Shi X, Zong L, Liu L, Zhang J, Qian Q, Jin J, Ma Y, Cui B, et al. Negative roles of B7–H3 and B7–H4 in the microenvironment of cervical cancer. Exp. Cell Res. 2018;371(1):222–230. doi: 10.1016/j.yexcr.2018.08.014. [DOI] [PubMed] [Google Scholar]
- 36.Snyder A, Makarov V, Merghoub T, Yuan J, Zaretsky JM, Desrichard A, Walsh LA, Postow MA, Wong P, Ho TS, et al. Genetic basis for clinical response to CTLA-4 blockade in melanoma. N. Engl. J. Med. 2014;371(23):2189–2199. doi: 10.1056/NEJMoa1406498. [DOI] [PMC free article] [PubMed] [Google Scholar]
- 37.Rizvi NA, Hellmann MD, Snyder A, Kvistborg P, Makarov V, Havel JJ, Lee W, Yuan J, Wong P, Ho TS, et al. Cancer immunology. Mutational landscape determines sensitivity to PD-1 blockade in non-small cell lung cancer. Science (New York, NY) 2015;348(6230):124–128. doi: 10.1126/science.aaa1348. [DOI] [PMC free article] [PubMed] [Google Scholar]
- 38.Zou S, Ye J, Hu S, Wei Y, Xu J. Mutations in the TTN gene are a prognostic factor for patients with lung squamous cell carcinomas. Int. J. Gen. Med. 2022;15:19–31. doi: 10.2147/IJGM.S343259. [DOI] [PMC free article] [PubMed] [Google Scholar]
- 39.Han X, Chen J, Wang J, Xu J, Liu Y. TTN mutations predict a poor prognosis in patients with thyroid cancer. Biosci. Rep. 2022;42(7):BSR20221168. doi: 10.1042/BSR20221168. [DOI] [PMC free article] [PubMed] [Google Scholar]
- 40.Zhang Y, Yu M, Jing Y, Cheng J, Zhang C, Cheng L, Lu H, Cai M-C, Wu J, Wang W, et al. Baseline immunity and impact of chemotherapy on immune microenvironment in cervical cancer. Br. J. Cancer. 2021;124(2):414–424. doi: 10.1038/s41416-020-01123-w. [DOI] [PMC free article] [PubMed] [Google Scholar]
- 41.Gennigens C, De Cuypere M, Hermesse J, Kridelka F, Jerusalem G. Optimal treatment in locally advanced cervical cancer. Expert Rev. Anticancer Ther. 2021;21(6):657–671. doi: 10.1080/14737140.2021.1879646. [DOI] [PubMed] [Google Scholar]
- 42.Koh W-J, Abu-Rustum NR, Bean S, Bradley K, Campos SM, Cho KR, Chon HS, Chu C, Clark R, Cohn D, et al. Cervical Cancer, Version 3.2019, NCCN clinical practice guidelines in oncology. J. Natl. Compr. Cancer Netw. 2019;17(1):64–84. doi: 10.6004/jnccn.2019.0001. [DOI] [PubMed] [Google Scholar]
- 43.Wong E, Giandomenico CM. Current status of platinum-based antitumor drugs. Chem. Rev. 1999;99(9):2451–2466. doi: 10.1021/cr980420v. [DOI] [PubMed] [Google Scholar]
- 44.Vicier C, Isambert N, Cropet C, Hamimed M, Osanno L, Legrand F, de La Motte RT, Ciccolini J, Gonçalves A. MOVIE: A phase I, open-label, multicenter study to evaluate the safety and tolerability of metronomic vinorelbine combined with durvalumab plus tremelimumab in patients with advanced solid tumors. ESMO Open. 2022;7(6):100646. doi: 10.1016/j.esmoop.2022.100646. [DOI] [PMC free article] [PubMed] [Google Scholar]
- 45.Deng J, Bai X, Feng X, Ni J, Beretov J, Graham P, Li Y. Inhibition of PI3K/Akt/mTOR signaling pathway alleviates ovarian cancer chemoresistance through reversing epithelial–mesenchymal transition and decreasing cancer stem cell marker expression. BMC Cancer. 2019;19(1):618. doi: 10.1186/s12885-019-5824-9. [DOI] [PMC free article] [PubMed] [Google Scholar]
- 46.Lv Y, Cang W, Li Q, Liao X, Zhan M, Deng H, Li S, Jin W, Pang Z, Qiu X, et al. Erlotinib overcomes paclitaxel-resistant cancer stem cells by blocking the EGFR-CREB/GRβ-IL-6 axis in MUC1-positive cervical cancer. Oncogenesis. 2019;8(12):70. doi: 10.1038/s41389-019-0179-2. [DOI] [PMC free article] [PubMed] [Google Scholar]
- 47.Wei Y, Lin S, Zhi W, Chu T, Liu B, Peng T, Xu M, Ding W, Cao C, Wu P. Genomic analysis of cervical carcinoma identifies Alpelisib as a therapeutic option for PIK3CA-mutant cervical carcinoma via the PI3K/AKT pathway. J. Med. Virol. 2023;95(3):e28656. doi: 10.1002/jmv.28656. [DOI] [PubMed] [Google Scholar]
Associated Data
This section collects any data citations, data availability statements, or supplementary materials included in this article.
Supplementary Materials
Data Availability Statement
The RNA sequencing profiles are able to be gained from The Cancer Genome Atlas (TCGA) (https://portal.gdc.cancer.gov/). Further inquiries can be directed to the corresponding author.


