Abstract
Objective:
To determine the variability in county cardiovascular (CV) premature mortality explained by integrated metrics of socioeconomic deprivation and to explore temporal trends in CV mortality by county socioeconomic deprivation.
Methods:
This is a cross-sectional analysis of US county-level death certificate data from 1999 to 2018 of age-adjusted premature (25 to 64 years) CV mortality. Integrated metrics of socioeconomic deprivation (Social Deprivation Index [SDI] and county Area Deprivation Index [ADI]) were associated with mortality using linear regression analysis. Relative change in county CV mortality from 1999 to 2018 was associated with indices using linear regression analysis.
Results:
Counties with higher quartile SDI and ADI had significantly higher total, non-Hispanic Black/African American, and female premature CV mortality (P<.001). Both SDI and ADI were significantly associated with CV mortality by linear regression (P<.001) explaining 40% and 44% of county variability in CV mortality, respectively. Counties with lower deprivation indices experienced a larger decreased in premature CV mortality (P<.001).
Conclusion:
This study demonstrates an association between multiple integrated metrics of socioeconomic deprivation and premature cardiovascular mortality and shows potentially worsening disparities.
Socioeconomic deprivation is an important determinant of cardiovascular (CV) health and is defined by a number of social and economic factors such as educational attainment, income, employment, and neighborhood environment.1 There is large temporal and spatial gradation in premature CV mortality across the United States that is incompletely explained by traditional risk factors such as hyperlipidemia. 2 Recent evidence suggests that socioeconomic deprivation is a risk factor for premature coronary heart disease.3 We sought to determine whether county-level premature CV mortality is associated with socioeconomic deprivation and to assess the temporal trends in premature county-level CV mortality by socioeconomic status.
METHODS
We extracted county-level mortality data from the multiple cause of death files maintained by the US National Center for Health and Statistics. Premature CV mortality was defined as mortality with cause identified by the InternationalClassification of Diseases, version 10 code I00-I99 in individuals aged 25 to 64 years, as previously defined.4 Race was defined based on data from death certificates (non-Hispanic Whites, non-Hispanic Black/African American). Counties with less than 20 deaths were excluded. Mortality data from those 25 to 64 years of age is reported as deaths per 100,000 persons. All mortality was age-adjusted. County-level age-adjusted prevalence of traditional CV risk factors (ie, hypertension [2017], hyperlipidemia [2017], obesity [2018], current smoking [2018], diabetes [2018], and physical inactivity [2018]) were obtained from the 2020 Population Level Analysis and Community Estimates (PLACES) project.5
To assess for the association between county premature CV mortality and socioeconomic status, we used two integrated socioeconomic deprivation indices for this analysis: the 2015 Area Deprivation Index (ADI) and the 2015 Social Deprivation Index (SDI). Both are well-validated, integrated measures of social deprivation which range from 0 to 100 with 100 being the highest deprivation. The SDI is generated from a factor analysis of a variety of county-level characteristics as previously described.6 Briefly, the following seven county components met criteria for inclusion in the SDI: poverty (less than 100% of the federal poverty line), non-employment, living in a renter-occupied home, living in crowded housing, single-parent household, low education (less than a high school education), and no car ownership. The ADI is based on 17 indicators of employment, poverty, and education.6–8 The ADI was developed for use at the census tract. Population weighting was used to apply this index to county level mortality data.
Counties were divided into quartiles by deprivation index. Summary statistics are displayed as median (IQR) with analysis of variance testing to compare groups. Linear regression analyses were performed to understand the relationship between socioeconomic deprivation and mortality with multiple linear regressions used to account for county-level prevalence of CV risk factors. Models were reported as beta coefficients with 95% CI. Model residuals were visually inspected for normality. To assess for temporal changes over the study period, we calculated the relative change in CV mortality [(age-adjusted premature CV mortality (pooled 2015–2018) - age-adjusted premature CV mortality (pooled 1999–2002))/age-adjusted premature CV mortality (pooled 1999–2002)]. Four-year groupings were chosen to include smaller counties and stabilize year-to-year mortality fluctuation to better represent long-term trends. Univariate linear regressions were used to understand the relationship between deprivation index and relative change in premature CV mortality. All analyses were performed using R statistical software (R foundation, Vienna, Austria).
RESULTS
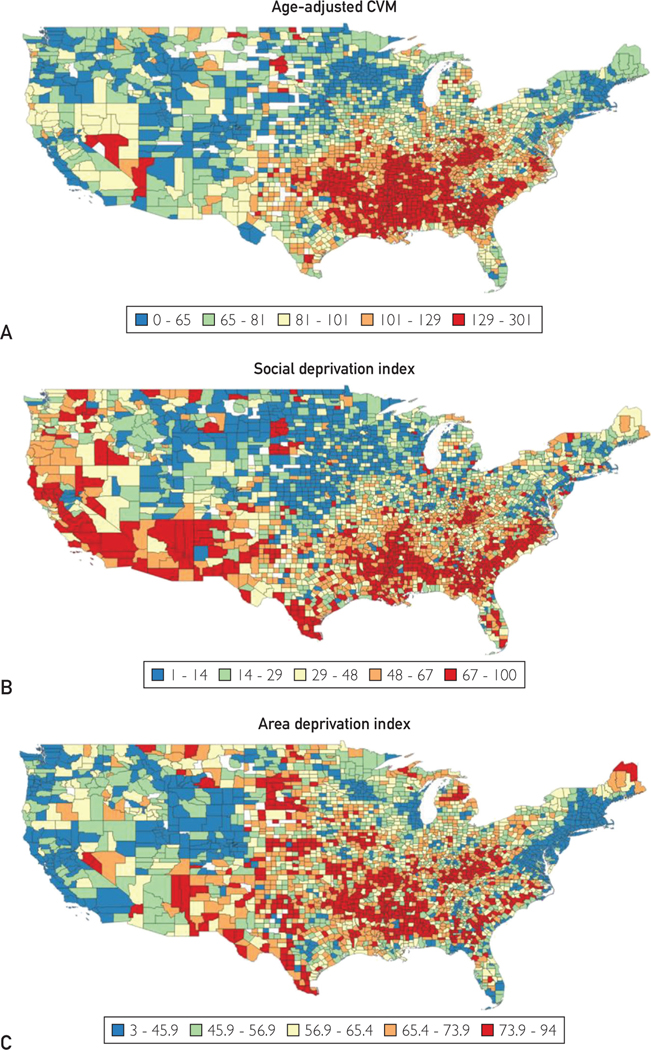
We analyzed 2,999,804 total premature CV deaths between 1999 and 2018 across 3096 counties with a median (IQR) age-adjusted CV mortality of 92.1 deaths/100,000 (50.2). Premature CV mortality decreased between 1999 and 2018 (Supplementary Figure 1; Supplementary Table, both available online at http://www.mayoclinicproceedings.org). The median (IQR) SDI and ADI were 39 (43) and 61.6 (22.4), respectively (Figure 1). The median (IQR) female premature CV mortality across 2939 counties (973,950 deaths) was 61.08 deaths/100,000 (39.4). The median (IQR) male premature CV mortality across 3073 counties (2,025,055 deaths) was 125.66 deaths/100,000 (65.8). Overall, premature CV mortality decreased from 1999 to 2018 for men and women (Supplementary Figure 1). The median (IQR) non-Hispanic Black/African American CV mortality across 1563 counties (656,206 deaths) was 177.44 deaths/100,000 (74.0). The median (IQR) non-Hispanic White CV mortality across 3084 counties (2,025,110 deaths) was 93.44 deaths/100,000 (44.5).The median (IQR) Hispanic/Latino mortality across 902 counties (206,310 deaths) was 57.85 deaths/100,000 (32.9). The ratio between the 95th percentile and 5th percentiles of CV mortality increased from 1999 to 2018 (Supplementary Figure 2, available online at http://www.mayoclinicproceedings.org).
FIGURE 1.
Continental US map showing the geographic distribution of (A) premature cardiovascular mortality (CVM) (age-adjusted, per 100,000 persons), (B) social deprivation index, and (C) area deprivation index.
Premature CV mortality (deaths/100,000) over the study period (1999–2018) was significantly higher (P<.001) for counties with higher SDI [1st quartile: 67.0 (22.1); 2nd quartile: 85.2 (29.2); 3rd quartile: 106 (41.0), 4th quartile: 131 (55.9)] and for counties with higher ADI [1st quartile: 66.1 (28.0); 2nd quartile: 86.0 (31.2); 3rd quartile: 99.7 (43.4), 4th quartile: 131 (53.0)]. The P for trend across quartiles for both SDI and ADI was less than .001, with each quartile increase associated with 23.0 and 30.5 premature cardiovascular deaths/100,000 people, respectively.
Premature CV mortality for non-Hispanic Black/African Americans was significantly higher (1563 counties; P<.001) in higher quartile SDI [1st quartile: 107 (47.1); 2nd quartile: 151 (53.6); 3rd quartile: 181 (57.2), 4th quartile: 202 (62.3)] and ADI [1st quartile: 127 (57.4); 2nd quartile: 172 (42.3); 3rd quartile: 195 (53.8), 4th quartile: 227 (57.0)] counties. Similarly, premature CV mortality in women was significantly higher (2939 counties; P<.001) for higher quartile SDI [1st quartile: 39.9 (16.1); 2nd quartile: 54.0 (21.7); 3rd quartile: 69.9 (32.0), 4th quartile: 88.3 (42.6)] and ADI counties [1st quartile: 40.2 (20.6); 2nd quartile: 55.8 (24.2); 3rd quartile: 68.5 (32.5), 4th quartile: 91.7 (38.0)] (Supplementary Figure 3, available online at http://www.mayoclinicproceedings.org).
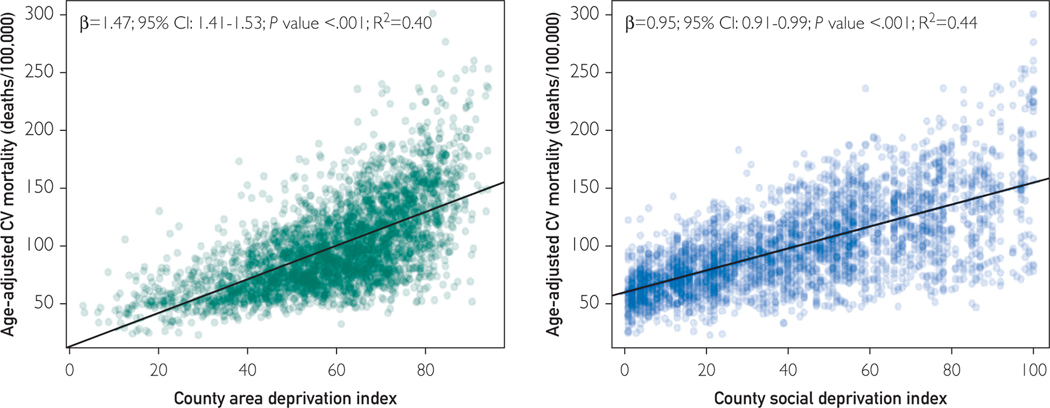
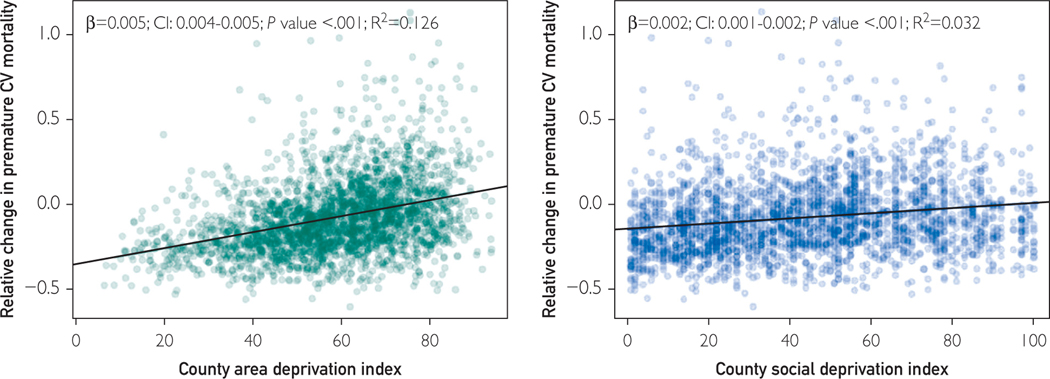
In univariable linear regression analyses, county-level ADI and SDI were associated with premature CV mortality (Figure 2). When accounting for county-level prevalence of traditional CV risk factors (hypertension, hyperlipidemia, obesity, diabetes, current smoking, and physical inactivity), both SDI (beta, 0.30; 95% CI, 0.26–0.34; P<.001; R2, 0.74) and ADI (beta, 0.41; 95% CI, 0.35–0.47; P<.001; R2, 0.74) remained significant (Table 1 and Supplementary Figure 4, available online at http://www.mayoclinicproceedings.org). The median (IQR) relative change in CV mortality across 2699 counties between 1999–2002 and 2015–2018 was −0.110 (0.258). The relative change in CV mortality decreased by a significantly larger margin (P<.001) for lower quartile SDI [1st quartile: −0.180 (0.227); 2nd quartile: −0.140 (0.242); 3rd quartile: −0.060 (0.271), 4th quartile: −0.074 (0.277)] and ADI counties [1st quartile: −0.212 (0.198); 2nd quartile: −0.120 (0.217); 3rd quartile: −0.054 (0.259), 4th quartile: −0.0168 (0.302)]. Relative change in premature CV mortality was associated with ADI and SDI (Figure 3).
FIGURE 2.
Univariate linear regression of county area deprivation index and age-adjusted premature cardiovascular (CV) mortality (A), and county social deprivation index and age-adjusted premature CV mortality (B). Univariate linear regression results are displayed. Age-adjusted premature CV mortality is pooled 1999–2018 data.
TABLE.
| Model | Variable | Beta (95% CI) | P | R2 |
|---|---|---|---|---|
|
| ||||
| ADI—premature CV mortality | ADI | 1.47 (1.41–1.53) | <0.001 | 0.40 |
| SDI premature CV mortality | SDI | 0.95 (0.91–0.99) | <0.001 | 0.44 |
| ADI+ traditional CV risk factors — premature CV mortality | ADI | 0.41 (0.35–0.47) | <0.001 | 0.74 |
| SDI+ traditional CV risk factors — premature CV mortality | SDI | 0.30 (0.26–0.34) | <0.001 | 0.74 |
| ADI—relative change in CV mortality | ADI | 0.005 (0.004–0.005) | <0.001 | 0.13 |
| SDI—relative change in CV mortality | SDI | 0.002 (0.001–0.002) | <0.001 | 0.13 |
ADI, Area Deprivation Index; CV, cardiovascular; SDI, Social Deprivation Index.
Traditional risk factors include estimated county prevalence of the following risk factors: hypertension, hyperlipidemia, obesity, diabetes, current smoking, and physical inactivity. Relative change in premature CV mortality = [(age-adjusted premature CV mortality 2015–2018- age-adjusted premature CV mortality 1999–2002)/age-adjusted premature CV mortality 1999–2002].
FIGURE 3.
Univariate linear regression of county area deprivation index and relative change in age-adjusted premature cardiovascular (CV) mortality (A) and county social deprivation index and relative change in age-adjusted premature CV mortality (B). Relative change in premature CV mortality = [(age-adjusted premature CV mortality 2015–2018- age-adjusted premature CV mortality 1999–2002)/age-adjusted premature CV mortality 1999–2002].
DISCUSSION
This analysis of county-level data in the United States reveals a strong association between county socioeconomic status and age-adjusted premature CV mortality. The ADI and SDI, two well-established indices of socioeconomic deprivation, individually account for 40% and 44% of the county-level variability in premature CV mortality, respectively. Premature CV mortality among non-Hispanic Black/African Americans and women display a similarly strong association with socioeconomic deprivation. These relationships remained true when adjusting for county-level prevalence of traditional CV risk factors. Furthermore, there is some indication of widening disparities. Counties in higher quartiles of socioeconomic deprivation experienced a lesser decline in premature CV mortality between 1999 and 2018 though deprivation indices explained a small percentage of the variability (up to 13%) in relative change in premature CV mortality. To our knowledge, this is the first study to demonstrate an association between multiple integrated metrics of socioeconomic deprivation and premature CV mortality adjusted for traditional CV risk factors and to show potentially worsening disparities. Prior studies have explored the relationship between race and premature CV mortality or individual socioeconomic factors (ie, income and high school education) and CV mortality.4,9,10
A number of factors may contribute to the observed relationship between socioeconomic deprivation and premature CV mortality including reduced access to quality health care, psychosocial stressors, environmental factors, and access to necessities (eg, food deserts).1,11–16 These results suggest that efforts to reduce premature CV mortality and CV health disparities should focus on communities of high socioeconomic deprivation.17
Study Limitations
Limitations include use misclassification of cause of death in death certificate data and data suppression as a result of low death count numbers. Additionally, although census tracts were population-weighted to generate a representative county-level ADI, it is only validated for use at the census-tract level. Both indices of socioeconomic deprivation are only available for a single year (2015); thus, our results do not account for potential changes in county socio economic deprivation. The large numbers of deaths analysed and the use of multiple socioeconomic deprivation indices strengthens our study.
CONCLUSION
This study demonstrates an association between multiple integrated metrics of socioeconomic deprivation and premature cardiovascular mortality and shows potentially worsening disparities.
Supplementary Material
Acknowledgments
Dr Al-Kindi has received grants from Wolfe Research Scholar Funds and the University Hospitals Informatics Pilot Award.
Footnotes
SUPPLEMENTAL ONLINE MATERIAL
Supplemental material can be found online at http://www.mayoclinicproceedings.org. Supplemental material attached to journal articles has not been edited, and the authors take responsibility for the accuracy of all data.
POTENTIAL COMPETING INTERESTS
The remaining authors report no potential competing interests.
REFERENCES
- 1.Schultz WM, Kelli HM, Lisko JC, et al. Socioeconomic status and cardiovascular outcomes. Circulation. 2018;137(20):2166–2178. [DOI] [PMC free article] [PubMed] [Google Scholar]
- 2.Global Burden of Cardiovascular Diseases Collaboration, Roth GA, Johnson CO, et al. The burden of cardiovascular diseases among US states, 1990e2016. JAMA Cardiol. 2018;3(5): 375–389. [DOI] [PMC free article] [PubMed] [Google Scholar]
- 3.Hamad R, Penko J, Kazi DS, et al. Association of low socioeconomic status with premature coronary heart disease in US adults. JAMA Cardiol. 2020;5(8):899–908. [DOI] [PMC free article] [PubMed] [Google Scholar]
- 4.Chen Y, Freedman ND, Albert PS, et al. Association of cardiovascular disease with premature mortality in the United States. JAMA Cardiol. 2019;4(12):1230–1238. [DOI] [PMC free article] [PubMed] [Google Scholar]
- 5.PLACES Project. Centers for Disease Control and Prevention. Accessed January 3, 2021. https://www.cdc.gov/places/index.html
- 6.Singh GK. Area deprivation and widening inequalities in US mortality, 1969e1998. Am J Public Health. 2003;93(7): 1137–1143. [DOI] [PMC free article] [PubMed] [Google Scholar]
- 7.Butler DC, Petterson S, Phillips RL, Bazemore AW. Measures of social deprivation that predict health care access and need within a rational area of primary care service delivery. Health Serv Res. 2013;48(2 Pt 1):539–559. [DOI] [PMC free article] [PubMed] [Google Scholar]
- 8.University of Wisconsin School of Medicine Public Health. 2015. Area Deprivation Index v2.0. May 19, 2020 https://www.neighborhoodatlas.medicine.wisc.edu/ [Google Scholar]
- 9.Patel SA, Ali MK, Narayan KM, Mehta NK. County-Level Variation in cardiovascular disease mortality in the United States in 2009e2013: comparative assessment of contributing factors. Am J Epidemiol. 2016;184(12):933–942. [DOI] [PubMed] [Google Scholar]
- 10.Khan SU, Javed Z, Lone AN, et al. Social vulnerability and premature cardiovascular mortality among US counties, 2014 to 2018. Circulation. 2021;144(16):1272–1279. [DOI] [PubMed] [Google Scholar]
- 11.Bevan GH, Freedman DA, Lee EK, Rajagopalan S, Al-Kindi SG. Association between ambient air pollution and county-level cardiovascular mortality in the United States by social deprivation index. Am Heart J. 2021;235:125–131. [DOI] [PubMed] [Google Scholar]
- 12.Fiscella K, Tancredi D, Franks P. Adding socioeconomic status to Framingham scoring to reduce disparities in coronary risk assessment. Am Heart J. 2009;157(6):988–994. [DOI] [PubMed] [Google Scholar]
- 13.Matetic A, Bharadwaj A, Mohamed MO, et al. Socioeconomic status and differences in the management and outcomes of 6.6 million US patients with acute myocardial infarction. Am J Cardiol. 2020;129:10–18. [DOI] [PubMed] [Google Scholar]
- 14.Kelli HM, Hammadah M, Ahmed H, et al. Association between living in food deserts and cardiovascular risk. Circ Cardiovasc Qual Outcomes. 2017;10(9):e003532. [DOI] [PMC free article] [PubMed] [Google Scholar]
- 15.Elfassy T, Swift SL, Glymour MM, et al. Associations of income volatility with incident cardiovascular disease and all-cause mortality in a US cohort. Circulation. 2019;139(7):850–859. [DOI] [PMC free article] [PubMed] [Google Scholar]
- 16.Ahmad K, Chen EW, Nazir U, et al. Regional variation in the association of poverty and heart failure mortality in the 3135 counties of the United States. J Am Heart Assoc. 2019;8(18): e012422. [DOI] [PMC free article] [PubMed] [Google Scholar]
- 17.Bevan GH, Josephson R, Al-Kindi SG. Socioeconomic deprivation and heart failure mortality in the United States. J Card Fail. 2020;26(12):1106–1107. [DOI] [PubMed] [Google Scholar]
Associated Data
This section collects any data citations, data availability statements, or supplementary materials included in this article.


