Abstract
Human immunodeficiency virus (HIV) type 1 vectors are highly efficient in their ability to transduce human progenitor hematopoietic stem cells (PHSC). Although mitosis was not required for transduction of these cells, transduction rates were much greater once cells had been cultured in the presence of cytokines. Transduction rates, however, rarely exceeded 70%. We demonstrate here that there is a distinct subpopulation that is more easily transduced by HIV vectors. These cells were distinguished by a disproportionate population in the S/G2/M phases of the cell cycle. By sorting them prior to transduction, we found that those cells in either the G1 or S/G2/M fraction were more readily transduced than G0 cells. Maintaining the cells in G0 by omitting cytokines from the medium reduced transduction rates by up to 10-fold. Addition of cytokines to the medium immediately after transduction did not improve the transduction efficiency as measured by expression of the transgene. Analysis of replication intermediates indicated that the block to transduction of G0 cells operated near the time of initiation of reverse transcription. These results suggest that although lentivirus vectors can transduce nondividing PHSC, transduction efficiency is severalfold greater once the cells exit G0 and enter G1. Further characterization of these more transducible cells and identification of the cellular factors responsible may enhance transduction while maintaining the pluripotentiality of the PHSC.
In the last few years, lentivirus vectors have shown promise in the transduction of resting cells, including arrested fibroblasts (30), peripheral blood mononuclear cells (9, 10, 36), neurons (5, 29, 37), retinal cells (28), and human progenitor hematopoietic stem cells (PHSC) (3, 38, 49). Human immunodeficiency virus (HIV) type 1 encodes a number of gene products that allow the nucleoprotein viral core to enter the nuclei of nondividing cells (24, 25). The matrix (MA) protein has a canonical nuclear localization signal (17, 18, 58), although this data is now the subject of some debate (13). In the absence of Vpr, MA is required for efficient replication of HIV in primary human macrophages (6). MA has been shown to interact biochemically with alpha-importin (karyopherin-α1), which may be partly responsible for docking the viral core at the nuclear pore (16). In addition, Vpr is localized to the inner nuclear membrane (56), and in the absence of MA it is sufficient for HIV replication in primary cells (22). Recently Gallay et al. have demonstrated that integrase has a bipartite nuclear localization signal and can mediate nuclear entry of the viral core in the absence of Vpr and MA (15).
We and others have recently demonstrated efficient transduction of human PHSC (3, 38, 49, 52). Transduction appeared to be independent of mitosis in that (i) transduction was not inhibited by aphidocolin, (ii) transduced cells had the same DNA content (as measured by Hoechst staining) as untransduced cells, and (iii) transduction appeared to be independent of S phase (as measured by bromodeoxyuridine uptake) (49). At the same time, however, we noticed that transduction rates were markedly higher once the PHSC had been cultured in cytokines for 48 h. Transduction rates were rarely greater than 70%, even at very high multiplicities of infection.
To explain this result, we hypothesized that the PHSC were heterogeneous in their susceptibility to transduction. We report here on a series of experiments that demonstrate that PHSC in G0 were poorly transducible, whereas PHSC in G1 or S/G2/M were up to 10-fold more transducible. Results of PCR analyses suggested that the block to transduction of G0 cells was close to the initiation of reverse transcription. Treatment of PHSC with cytokines immediately after exposure to the transducing vector supernatants did not improve transduction, which implies that the viral nucleoprotein core was extremely labile. These results suggest that truly quiescent PHSC are poorly transduced, even by lentivirus vectors.
MATERIALS AND METHODS
Hematopoietic stem cells.
Volunteer, nonhospitalized human donors were primed with granulocyte colony-stimulating factor for 5 days and subsequently underwent leukapheresis. Peripheral blood CD34+ cells were positively selected by using a cell separation device (Baxter HealthCare) or a MACS magnetic bead column (Milteny Biotech). Purity of the CD34+ cells was confirmed by using a fluorescein isothiocyanate (FITC)-conjugated anti-CD34 antibody (Becton Dickinson). This is considered the PHSC population. Purified cells were frozen in 90% fetal calf serum–10% dimethyl sulfoxide or used within 24 h of isolation. Cells were typically maintained in Iscove’s modified Dulbecco’s medium (IMDM) supplemented with 10% fetal calf serum, 50 U of penicillin G per ml, and 50 mg of streptomycin sulfate per ml, with 20 ng of interleukin-6 per ml, 20 ng of interleukin-3 per ml, and 100 ng of stem cell factor per ml. In some experiments, the cytokine cocktail was omitted to keep the isolated PHSC in G0.
Plasmid vector construction.
pHIV-APΔenvΔVifΔVpr has been described previously (49). It is based upon T-tropic isolate NL4-3; has large deletions in Env, Vif, and Vpr; and carries the human placental alkaline phosphatase (HPAP) gene in place of nef. In pHIV-CD4 and pHIV-eGFP, human CD4 and enhanced green fluorescence protein (GFP) (Clontech), respectively, replace HPAP. In pNL4-3-CMV-AP, an expression cassette of the cytomegalovirus immediate-early enhancer-promoter driving HPAP was inserted into the unique NheI site (within env) of the NL4-3 provirus (a gift of R. Pillai). pME VSV G, encoding the vesicular stomatitis virus (VSV) G glycoprotein, was a gift of K. Maruyama (DNAX).
Preparation of vector supernatants and transduction conditions.
Pseudotyped HIV supernatants were made essentially as described previously, without the addition of pcRev or butyrate (48). 293T cells were transfected with plasmids by calcium phosphate coprecipitation. Supernatants were collected roughly 60 h later and centrifuged at 2,000 × g for 5 min, and titers were determined with HOS cells by end point dilution. Typical titers for both HIV-CD4(VSV G) and HIV-eGFP(VSV G) were greater than 107 infectious units (IU)/ml. Titers for pHIV-APΔenvΔVifΔVpr(VSV G) and pNL4-3-CMV-AP(VSV G) were 3.0 × 10⁷ and 106 IU/ml, respectively. Before transduction of PHSC, previously frozen viral stocks were concentrated by ultracentrifugation with an SW28 rotor at 23,000 rpm for 2 h and resuspended in 1/50th to 1/100th volume of IMDM by end-over-end rotation at room temperature for 3 to 6 h. Recovery of infectious virus after concentration was usually greater than 80%. PHSC were typically transduced overnight, using 106 PHSC in a total volume of less than 1.0 ml and up to 0.35 ml of concentrated vector supernatant in the presence of 4 μg of Polybrene per ml. Medium was exchanged the next day, and initial marker analyses were carried out 48 to 96 h later. Thus, for most experiments, the multiplicity of infection (MOI) was between 500 and 2,000.
Flow cytometry and marker analysis.
Cells transduced with HIV-CD4 vector supernatants were pelleted by microcentrifugation for 5 s and incubated for 1 h in 1:10 anti-CD4–phycoerythrin (anti-CD4–PE) (Pharmingen) in phosphate-buffered saline (PBS) with 2% fetal calf serum. For simultaneous surface and nuclear marker staining, PHSC stained for CD4 (as described above) were resuspended in 0.1 ml of PBS, fixed for 40 min at room temperature by using 1.4 ml of Orthopermeafix (Orthodiagnostics), and then washed with PBS. Cells were then permeabilized by using PBS with 0.1% Tween 20 for 10 min at 4°C, washed with PBS, and then incubated with 25 μl of either anti-proliferating cell nuclear antigen (anti-PCNA)–FITC or anti-Ki-67–FITC directly conjugated antibodies (both from DAKO) for 1 h, washed with PBS, and resuspended in 0.5 ml of PBS.
For DNA content measurements, PHSC were incubated at 37°C for 1 h in the presence of 0.75 mM Hoechst dye 33342 (Molecular Probes). For RNA content measurements, PHSC were incubated at 37°C for 15 min in the presence of 0.5 μM Pyronin Y (Sigma). Following sorting, subpopulations were incubated with anti-CD34–Texas red/sulforhodamine G (TR/SR), anti-Thy-1–PE (SyStemix), anti-CD38–allophylocyanin (APC), and a panel of lineage markers which included FITC-conjugated antibodies against CD2, CD14, CD15, and CD16 (Becton Dickinson Immunocytometry Systems) and glycophorin A (Immunotech). Dual laser flow cytometric analyses and sorting were performed on a Becton-Dickinson Vantage fluorescence-activated cell sorter (FACS) and FACStar equipped with a UV laser, respectively. Live cells were gated by exclusion of propidium iodide (PI) dye. Cells were labelled with CFDA-SE (Molecular Probes) by being washed in serum-free IMDM, incubated for 10 min with 5 μM CFDA-SE, and then washed and resuspended in complete IMDM with or without cytokines. For HPAP staining, cells were fixed with 0.3% formaldehyde–0.4% glutaraldehyde (in PBS) for 5 to 10 min, washed with PBS, heated at 65°C for 20 min, and incubated with 5-bromo-4-chloro-3-indolylphosphate–nitroblue tetrazolium (BCIP-NBT) along with 0.24 mg of levamisole per ml as described previously (49), usually for less than 2 h at room temperature. Annexin V staining was carried out according to the instructions of the manufacturer (Boehringer Mannheim).
PCR marking and in situ hybridization.
After transduction with HIV-eGFP vector supernatants, cells were washed four or five times with IMDM and refed with complete IMDM with or without cytokines in the presence of 10 mM MgCl2 and 100 μg of DNase I per ml; 48 to 72 h later, live cells were sorted based upon GFP expression. Pelleted, sorted PHSC were resuspended in 0.1 M KCl–10 mM Tris HCl (pH 8.3)–1.0 mM EDTA–0.5% Tween 20–0.5% Nonidet P-40–100 μg of proteinase K per ml such that each sample contained 1,000 cells per μl. Samples were incubated for 2 to 3 h at 37°C, followed by heat inactivation for 15 min at 95°C. Forward and reverse oligonucleotide primers for late products of reverse transcription were 5′-AAGAGGCCAAATAAGGAGAGAAGAACAG-3′ (positions 171 to 198; NL4-3 171U) and 5′-ATCTAATTCTCCCCGCTTAATACCGAC-3′ (positions 804 to 831; NL4-3 831L), which gave rise to a 660-bp product. PCR was performed by using 5,000 cell equivalents with 1.25 U of Taqpluslong polymerase (Stratagene) for 30 cycles with an annealing temperature of 65°C. Forward and reverse control oligonucleotide primers (for β-actin) were 5′-TGGAGAAGAGCTACGAGCTGC-3′ and 5′-CCAGACAGCACTGTGTTGGC-3′, which gave rise to a 191-bp product. PCR was carried out as described above, except that an annealing temperature of 58°C was used. To examine integrated proviral DNA, Alu PCR was performed as described previously (8), except that Taqpluslong was used in the initial PCR step for 30 cycles and the second PCR step was performed with 2% of the original product for 15 cycles. Products obtained by using the HIV primers were digested with BspEI, size separated by horizontal gel electrophoresis, transferred under alkaline conditions to Hybond N+ (Amersham), and hybridized by using a 32P-labelled DNA probe encompassing the 5′ long terminal repeat (LTR) of NL4-3. Washed filters were exposed to X-ray film. For the β-actin PCR products, samples were fractionated on a 1.3% agarose gel and visualized by using ethidium bromide and UV light. For early reverse transcription products, the R-U5 primers M667 and AA55 were used (61). PCR was carried out by using Taqpluslong for 30 cycles with denaturation at 94°C for 30 s, annealing at 58°C for 30 s, and extension at 72°C for 30 s. The resulting products were size fractionated on a 1.6% horizontal agarose gel and visualized directly as described above.
VSV G fusion assays.
293T cells were transfected with the VSV G expression plasmid (described above) and harvested at 60 h. Target cells were labelled with CFDA-SE as described above and extensively washed. A threefold excess of transfected 293T cells was incubated with the target cells, and cell fusion was initiated by decreasing the pH of the medium to 5.2 for 3 min. After 1 h at 37°C, fused cells were placed on ice and analyzed by flow cytometry. Mock-fused 293T cells expressing VSV G were used as a negative control in order to gate on cells that had fused.
RESULTS
PHSC are heterogeneous in susceptibility to transduction by HIV vectors.
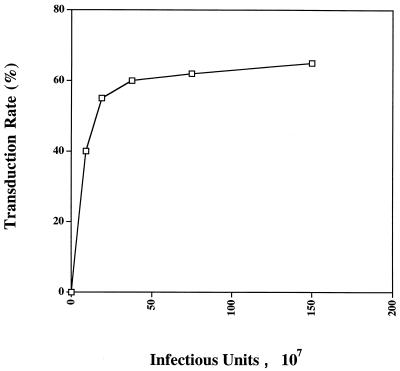
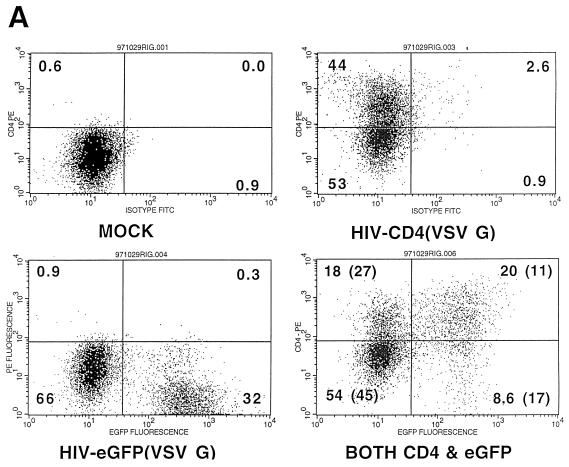
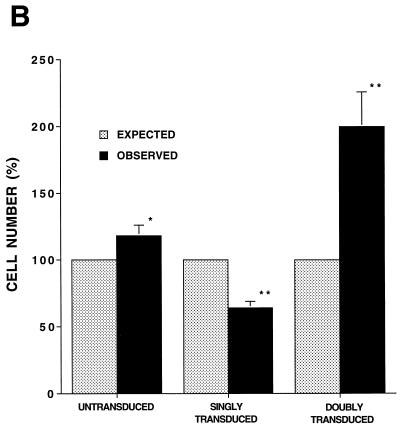
We have previously shown efficient transduction of PHSC by HIV-based vectors, with transduction rates approaching 70% (49). We were puzzled, however, by our inability to transduce 100% of the cells, despite the fact that the ultracentrifuge-concentrated, HIV(VSV G)-pseudotyped stocks could transduce virtually 100% of an established cell line, even at a 1,000-fold dilution. To study this problem, we first measured the transduction of PHSC as a function of the multiplicity of infectious units of ultracentrifuge-concentrated pHIV-APΔenvΔVifΔVpr(VSV G). Figure 1 shows that the rate of transduction of PHSC as measured by expression of the transgene plateaued at around 70% at an MOI of 2,500, consistent with our previous results. We then performed double-transduction experiments, using ultracentrifuge-concentrated HIV-CD4(VSV G) and HIV-eGFP(VSV G) (Fig. 2A). The percentage of untransduced cells was slightly increased, and the percentage of doubly transduced cells was significantly increased, compared to what would be expected if transduction with each virus was occurring completely independently (Fig. 2B). Singly transduced cells were significantly underrepresented (Fig. 2B). This is consistent with the results shown in Fig. 1 and suggests that there are subpopulations of PHSC which vary in their ability to be transduced by HIV(VSV G) supernatants.
FIG. 1.
Not all PHSC are transduced by an HIV vector. Increasing amounts of ultracentrifuge-concentrated pHIV-APΔenvΔVifΔVpr(VSV G) were used to transduce 2 × 10⁵ PHSC overnight in a total volume of 1.0 ml in the presence of 4 μg of Polybrene per ml. Prior to transduction, the PHSC had been cultured in cytokines for 48 h, and cells were stained for alkaline phosphatase by using BCIP-NBT at 72 h after transduction.
FIG. 2.
Differences in transduction efficiency among PHSC subpopulations. PHSC were cultured in cytokines for 48 h prior to overnight transduction with either ultracentrifuge-concentrated HIV-CD4(VSV G), HIV-eGFP(VSV G), or both. Three days after transduction, cells were stained with anti-CD4–PE as described in the text and analyzed on a FACStar. (A) Flow cytometry for CD4 and GFP expression, with respective quadrant percentages shown. Numbers in parentheses indicate percentages expected if transductions had occurred completely independently, by random chance alone. (B) Average values for four separate double-transduction experiments. For each transduced population, the expected value (based upon random chance) has been normalized to 100%. ∗, P > 0.05; ∗∗, P < 0.05 (observed values compared to expected values by a two-sample Student t test). Error bars indicate standard errors.
Poor transduction of PHSC in G0.
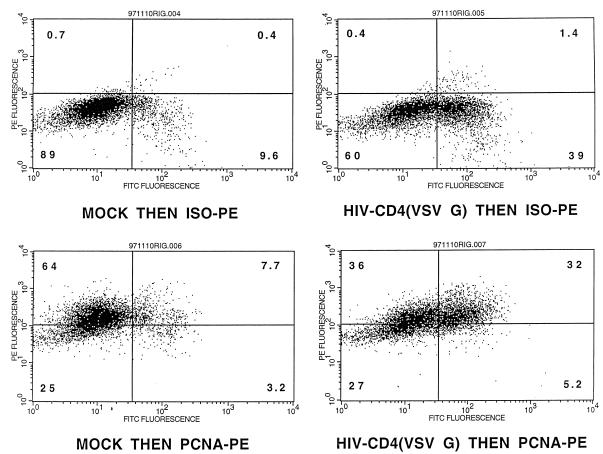
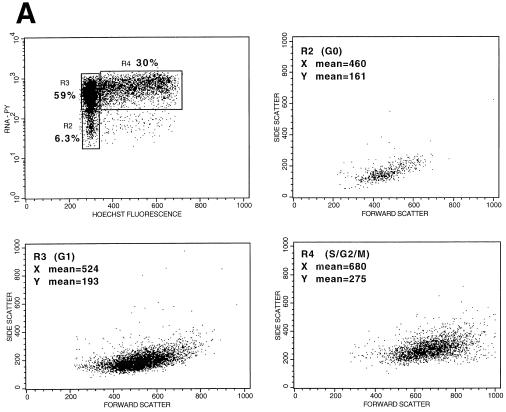
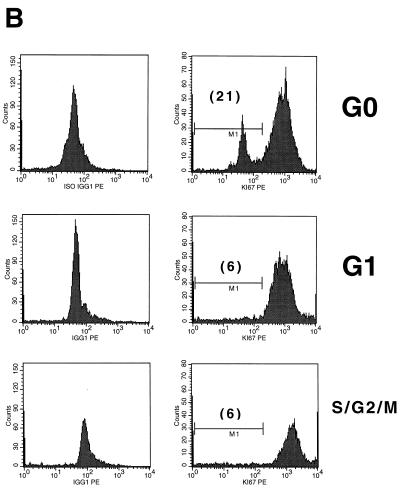
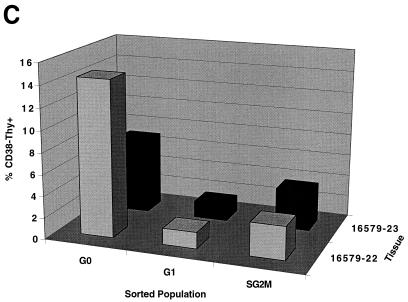
In order to determine whether PHSC that had exited G0 were more readily transduced with lentivirus vectors than G0 cells, PHSC were transduced overnight with concentrated HIV-CD4(VSV G) and 72 h later were analyzed for expression of both CD4 (a cell surface marker) and PCNA (a nuclear marker generally considered to be absent from G0 cells) by flow cytometry. As shown in Fig. 3, transduced cells were significantly more likely to be positive for PCNA staining than untransduced cells, consistent with those cells having exited G0. Note that in the mock-transduced samples 10% of the cells were CD4+, which was an artifact of cell preparation since live cells were CD4−. Even so, these cells showed significantly less PCNA staining than the transduced CD4+ population (71 versus 86%) (Fig. 3, bottom right panel). However, in this experimental design, the PCNA status of each individual cell at the time of transduction is uncertain. In addition, expression of the HIV proteins encoded by the vector (Gag, Pol, Rev, and Tat) and CD4 could potentially influence the cell cycle stage and PCNA status of each transduced cell. We thus decided to sort the PHSC into populations enriched for cells in the G0, G1, and S/G2/M cell cycle phases, based on their Pyronin Y (RNA content) and Hoechst 33342 (DNA content) staining (Fig. 4A) (19, 20, 23). PHSC with 2N DNA and a low RNA content are considered to be in G0, PHSC with 2N DNA and a high RNA content are considered to be in G1, and PHSC with 4N DNA and a high RNA content are considered to be in S/G2/M. We never observed multiple populations within the G1 fraction, so presumably this fraction contained cells in both the G1a and G1b cell cycle stages. In addition, for most of the samples analyzed, the Pyronin Y histogram showed a continuum, and only rarely was a definite separate cell population which had low RNA content observed. Thus, the dot plot in Fig. 4A is representative. Forward- and side-scatter profiles, which reflect the size and granularity, respectively, of each cell and hence its activation status, were consistent with the identities of the cell populations, although there was considerable overlap in these profiles (Fig. 4A; see also Fig. 6B). Only the G0 population (2N DNA and a low RNA content) of the PHSC had a significant and distinct fraction (21%) negative for the nuclear antigen Ki-67, a second marker for cycling cells (Fig. 4B). It is not clear to us why 80% of the cells are positive for this marker, although this result suggests that this nominally G0 subpopulation is also heterogeneous and may contain cells that have exited G0 and entered G1. We also stained each of these three populations by using antilineage, anti-CD34, anti-CD38, and anti-Thy-1 monoclonal antibodies and observed similar heterogeneity. In addition, PHSC in G0 had a greater proportion of cells which were CD38− Thy+ than did the G1 and S/G2/M populations (Fig. 4C), consistent with these cells being the most primitive of the known PHSC (53, 54).
FIG. 3.
Transduced cells are more likely than untransduced cells to express PCNA. PHSC were mock transduced or transduced overnight with ultracentrifuge-concentrated HIV-CD4(VSV G). Cells were analyzed by flow cytometry 48 h after transduction for nuclear PCNA and surface CD4 expression, using anti-PCNA–PE (or an isotype-matched control [ISO-PE]) and anti-CD4–FITC, respectively (see text for details). Quadrant percentages are indicated. CD4+ cells were significantly more likely than CD4− cells to be positive for PCNA (P < 0.001 by the Kolmogorov-Smirnov two-sample test).
FIG. 4.
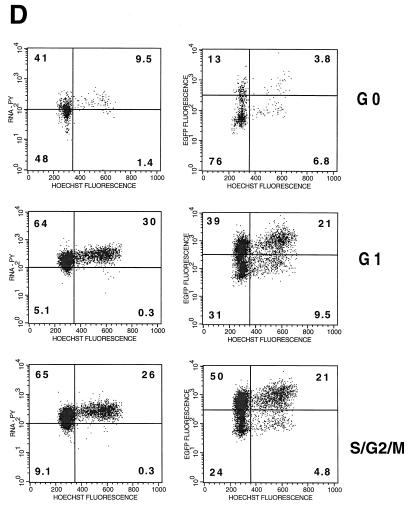
PHSC which have exited G0 are more readily transduced. (A) PHSC were cultured in cytokines for 48 h prior to sorting based on Pyronin Y (PY) and Hoechst 33342 staining. Percentages of each sorted population are shown, along with x and y means for forward and side scatters, respectively. (B) Sorted PHSC were stained by using anti-Ki67–PE (right column) or an isotype-matched control (left column). Only the G0 subpopulation, as defined by Pyronin Y and Hoechst staining had a distinct population of cells that did not detectably express Ki-67. (C) PHSC were sorted based upon Pyronin Y and Hoechst staining, and then each subpopulation was subsequently stained by using anti-lineage–FITC, anti-CD34–TR/SR, anti-Thy–PE, and anti-CD38–APC antibodies, along with appropriate isotype-matched controls. Live cells were gated by exclusion of PI. Results from two independent tissue samples are shown. (D) Sorted populations were transduced overnight with concentrated HIV-eGFP(VSV G) and analyzed 72 h later for enhanced GFP (EGFP) expression, Pyronin Y staining, and Hoechst staining. Quadrant percentages are indicated. Left column, Pyronin Y versus Hoechst; right column, GFP versus Hoechst. Note that for each subpopulation, the S/G2/M population of the transduced cells is two- to fourfold greater than that of the untransduced PHSC. Similar transduction percentages were observed 7 days later.
FIG. 6.
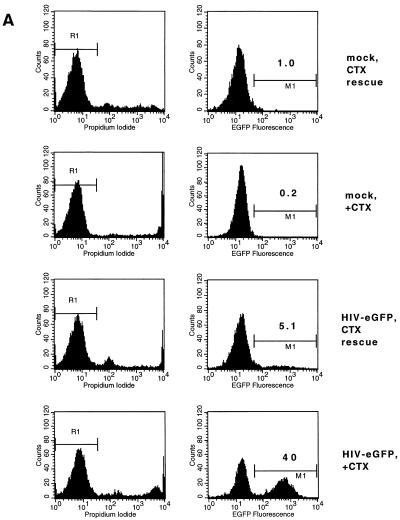
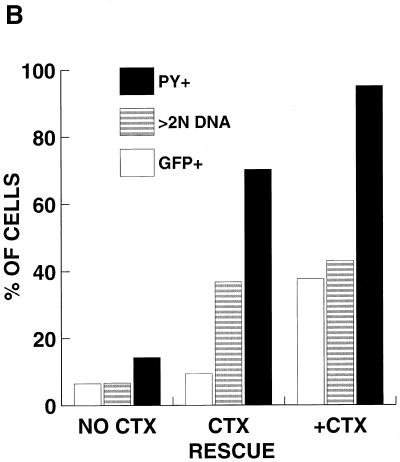
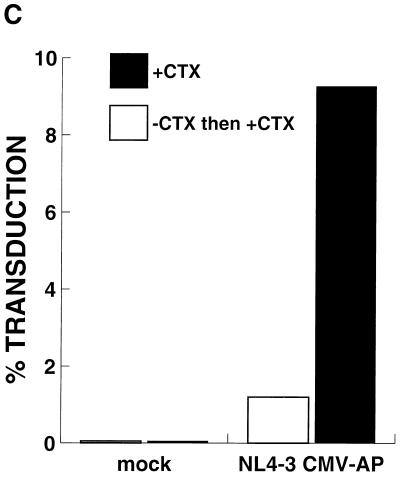
Poor transduction of G0 PHSC is not improved by immediate rescue with cytokines (CTX). (A) PHSC were maintained in the presence or absence of cytokines for 48 h prior to transduction. Immediately following transduction with concentrated HIV-eGFP(VSV G), all cells were placed into cytokine-containing medium, and 72 h later they were analyzed for enhanced GFP (EGFP) expression. Left column, PI histogram; right column, GFP histogram. Percentages of positive cells are indicated. (B) A separate experiment similar to the one for panel A was performed, except that one population of cells was never exposed to cytokines. After transduction, PHSC were stained for Pyronin Y (PY) and Hoechst 33342 and then analyzed by flow cytometry. Note that PHSC which had been rescued with cytokines were actively cycling, with a majority of cells being Pyronin Y positive, and yet they had a low transduction rate. (C) PHSC maintained in the presence or absence of cytokines for 48 h were mock transduced or transduced with ultracentrifuge-concentrated NL4-3-CMV-AP(VSV G). After transduction, all populations were refed with complete medium containing cytokines and 72 h later were stained overnight for HPAP activity by using BCIP-NBT. Shown are the average percent transductions for two independent experiments. Note that this vector (which contains all of the accessory HIV gene products) poorly transduced G0 PHSC.
PHSC that were sorted based on Pyronin Y and Hoechst staining were then transduced with ultracentrifuge-concentrated HIV-eGFP(VSV G). Seventy-two hours later, GFP expression was measured in each population as an assay for transduction (Fig. 4D). Transduction rates for the G0, G1, and S/G2/M populations (defined operationally by Pyronin Y staining and DNA content) were 17, 60, and 71%, respectively. The S/G2/M population was consistently the most transducible; in other experiments the efficiency was as high as 88%. The fact that the actively cycling population was not completely transduced suggests that factors other than cell cycle stage play a role in transduction. At 72 h after transduction, the PHSC initially sorted for G0 features had begun dividing, resulting in DNA and RNA content profiles similar to those of cycling PHSC (Fig. 4D, top left panel). For each of these populations, the percentage of cells in S/G2/M, as assayed 72 h after transduction, was two- to threefold higher in transduced (GFP-positive) than in untransduced (GFP-negative) cells. Analyses for GFP expression were also repeated at 10 days after transduction, with nearly identical results. At that time, all three cell populations had comparable DNA content profiles (not shown). However, because the cell population defined as G0 may be heterogenous and contain cycling cells, a second approach was taken to determine whether quiescent cells were less transducible.
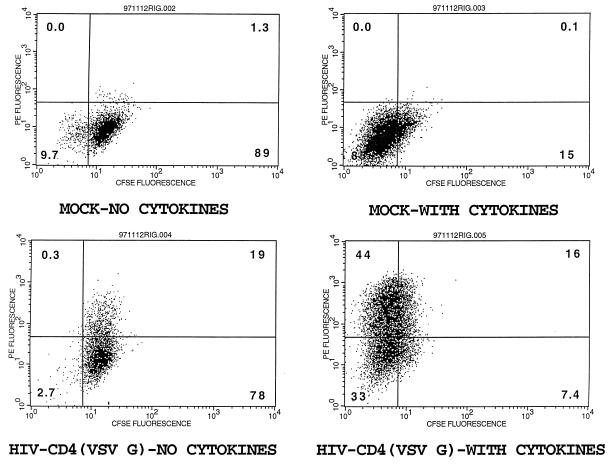
In the absence of cytokines, isolated PHSC either remain in G0 or undergo apoptosis (21, 27, 31, 33, 35, 60). To further characterize the basis of the lower transducibility of PHSC in G0, PHSC were incubated in the presence or absence of cytokines for 48 h and then transduced with concentrated HIV-CD4(VSV G). Immediately after exposure to the transducing virus, PHSC were transferred to complete medium with or without cytokines. Transduction efficiency was assessed 72 h later by immunostaining the cells for CD4 expression. To monitor whether cells had divided in the absence of cytokines, the PHSC were pulse-labelled with CFDA-SE before the 48-h incubation. After entering the cell, CFDA-SE undergoes esterification and only slowly leaks out of the cell, so that its fluorescence intensity decreases as the cell divides. As shown in Fig. 5, cells cultured in the absence of cytokines maintained their CFDA-SE fluorescence and had a transduction rate of approximately 20%, whereas PHSC cultured in the presence of cytokines lost their CFDA-SE fluorescence and had a transduction rate of 60%.
FIG. 5.
Cells maintained in G0 are poorly transduced compared to actively cycling cells. PHSC were pulse-labelled with CFDA-SE and then cultured in the presence or absence of cytokines. After 48 h, cells were either mock transduced or transduced with concentrated HIV-CD4(VSV G) and then maintained in the presence or absence of cytokines as before. Seventy-two hours later, PHSC were stained with anti-CD4–PE and analyzed by flow cytometry; quadrant percentages are indicated.
To more precisely define the stage in the transduction process at which cytokines could increase the susceptibility of PHSC to transduction, cells were exposed to transducing virus in the absence of cytokines and then immediately treated with the cytokine cocktail. As shown in Fig. 6A, at 72 h after exposure of unactivated PHSC to the vector supernatant, the transduction rate for these cells, as measured by GFP expression, was 5.1%, whereas for the PHSC maintained in cytokines for the duration of the experiment, the transduction rate was 40%. By 72 h after cytokine rescue, most of the PHSC showed elevated Pyronin Y staining and a large fraction had a DNA content of greater than 2N, suggesting that these cells had exited G0 (Fig. 6B; compare this population to that that was maintained in the presence or absence of cytokines).
Because the presence of Nef and Vif has been reported to improve HIV infectivity, we also examined transduction of PHSC by the HIV vector pNL4-3-CMV-AP, which is replication defective but has all the accessory genes intact. PHSC cultured in the absence of cytokines were poorly transduced by this vector compared to cells cultured in the presence of cytokines (Fig. 6C). Note that the transduction rate was slightly less than 10% because only 4 × 10⁷ IU of virus was used (MOI of 200; see Fig. 1).
The block to transduction of G0 cells is prior to complete reverse transcription.
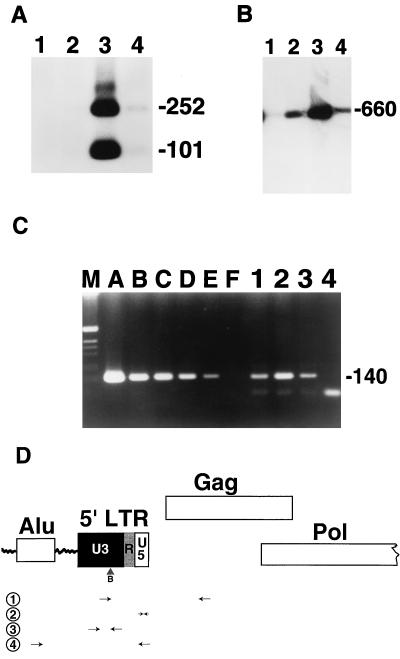
A plausible explanation of the foregoing results could be that cells that were exposed to virus in stage G0 had been transduced but failed to express the transgene. To test this possibility, mock- and HIV-eGFP(VSV G)-transduced cells were sorted on the basis of GFP expression levels, and then HIV DNA was assayed by PCR amplification with the primer pairs illustrated in Fig. 7D. Cells that had been cultured in cytokines and were GFP positive by FACS gave rise to a large amount of product, consistent with integrated forms of the HIV proviral DNA, when nested Alu PCR primers were used (Fig. 7A, lane 3). The cells that had been cultured in cytokines and were GFP negative by FACS gave rise to a small amount of product when the same primers were used (Fig. 7A, lane 4). No detectable product was obtained from DNA of mock-transduced cells or of cells that were exposed to virus prior to cytokine treatment and were GFP negative by FACS (Fig. 7A, lanes 1 and 2, respectively). All four populations gave rise to similar amounts of PCR product when control β-actin primers were used (not shown).
FIG. 7.
The block to transduction in G0 cells is at the level of initiation of reverse transcription. PHSC were maintained in the presence or absence of cytokines for 48 h prior to transduction with concentrated HIV-eGFP(VSV G). Immediately after transduction, the PHSC were placed in cytokine-containing medium. Seventy-two hours later, PHSC were sorted on the basis of GFP staining and immediately lysed in PCR buffer. (A) Analysis of integrated products by nested Alu PCR. Lane 1, mock transduction of cells maintained in cytokines; lane 2, PHSC exposed to HIV-eGFP(VSV G) and then cytokine rescued and sorted to be GFP negative; lane 3, HIV-eGFP(VSV G) transduction of PHSC which were maintained in cytokines and sorted to be GFP positive; lane 4, PHSC exposed to HIV-eGFP(VSV G) and then maintained in cytokines and sorted to be GFP negative. PCR products were digested with BspEI, size separated by agarose gel electrophoresis, transferred to a nylon membrane, and hybridized by using an HIV LTR probe as described in the text. Numbers on the right indicate base pairs. (B) Analysis of late reverse transcription products by LTR-Gag PCR (primers NL4-3 171U and NL4-3 831L). Lanes are as for panel A. PCR products were size separated and probed as for panel A. (C) Analysis of early reverse transcription products with R-U5 PCR primers M667 and AA55. Lanes A to F, .3 × 108, 4.3 × 10⁵, 8.5 × 10⁴, 1.7 × 10⁴, 3,400, and 0 copies, respectively. Lane 1, PHSC exposed to HIV-eGFP(VSV G) and then maintained in cytokines and sorted to be GFP negative; lane 2, HIV-eGFP(VSV G) transduction of PHSC which were maintained in cytokines and sorted to be GFP positive; lane 3, PHSC exposed to HIV-eGFP(VSV G) and then cytokine rescued and sorted to be GFP negative; lane 4, mock transduction of cells maintained in cytokines. A total of 2,500 cell equivalents were used in each PCR. Products were size fractionated by horizontal gel electrophoresis and stained with ethidium bromide. The source of the product of approximately 100 bp in lane 4 is unknown but does not hybridize to the HIV LTR. (D) Schematic of the 5′ end of integrated HIV provirus near the human Alu element and PCR primers used in the analyses. 1, primers NL4-3 171U and NL4-3 831L, for late reverse transcription products; 2, primers M667 and AA55 for early reverse transcription products; 3, internal primers NI-2 5′ and NI-2 3′ for nested Alu PCR for integrated products; 4, external primers Alu-LTR 5′ and Alu-LTR 3′ for nested Alu PCR for integrated products (8). B, BspEI site.
To examine products of complete reverse transcription, a forward primer within the LTR and a reverse primer within Gag were used (Fig. 7D). A 660-bp product was readily detected in the GFP-positive cells transduced in the presence of cytokines (Fig. 7B). By quantitative competitive PCR (QC-PCR), the amount of viral cDNA was approximately 1.0 copy/cell. The same product was obtained at a much lower yield from the GFP-negative cells from the same transduced population (0.11 to 0.33 copy/cell by QC-PCR). This product was still-less abundant when the GFP-negative cells were recovered following transduction in the absence of cytokines (∼0.11 copy/cell), and the product was virtually undetectable in mock-transduced cells (possibly due to incomplete DNase I treatment or washing or contamination from the adjacent gel lane).
To examine early reverse transcription products, the R-U5 PCR primers were used (Fig. 7D). As expected, the cytokine-maintained population gave the greatest amount of product (copy number of 19/cell), whereas the copy number of GFP-negative cytokine-rescued PHSC was 1.4/cell and that of GFP-negative cytokine-maintained PHSC was 2.3/cell (Fig. 7C). These results suggest that the block to transduction in G0 PHSC occurs close to the initiation of reverse transcription in the viral life cycle. Alternatively, reverse transcription may occur, but the unintegrated viral cDNA may be unstable in PHSC in the absence of cytokine treatment.
G0 PHSC fuse with VSV G-expressing cells.
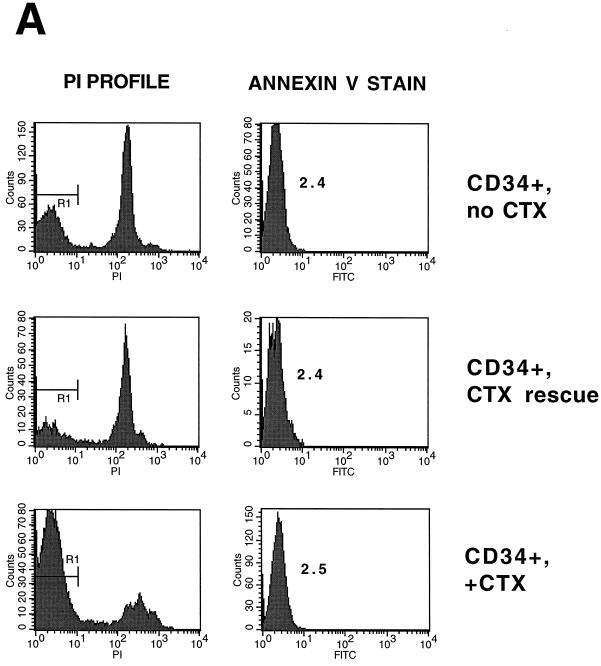
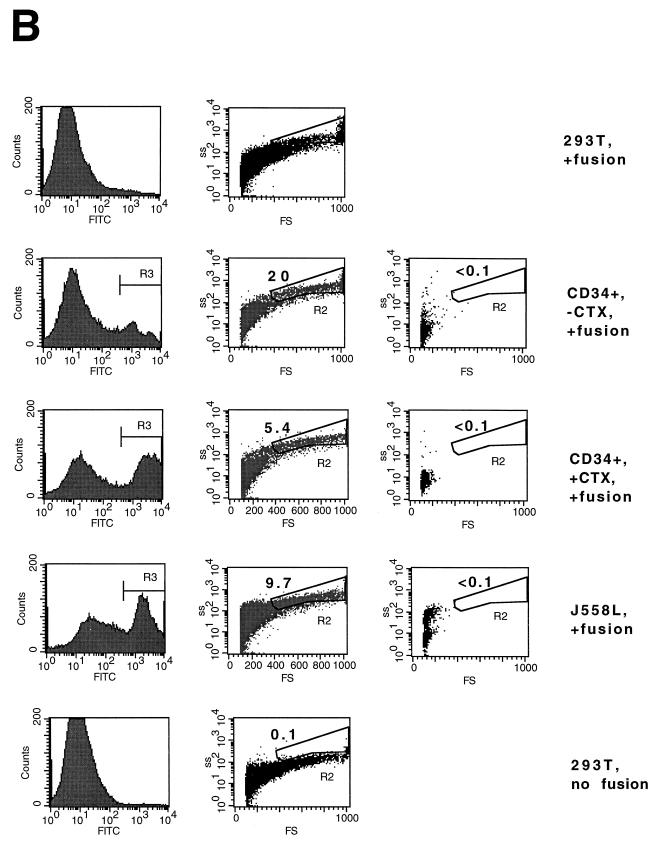
It is possible that the block to transduction in G0 PHSC is at the level of viral binding and entry. To address this question, PHSC were maintained in the presence or absence of cytokines or rescued ith cytokines. These three populations had almost identical annexin V staining profiles; annexin V specifically binds to phosphotidyl serine (the omnipresent surface receptor for VSV [40]) (Fig. 8A). Because it had been reported that VSV G binding is reduced in quiescent PHSC (43), we performed a fusion assay with VSV G-expressing cells. PHSC were maintained in the presence or absence of cytokines, labelled with CFDA-SE, fused with 293T cells expressing VSV G, and analyzed by flow cytometry. J558L cells (a mouse myeloma cell line) and unfused VSV G-expressing 293T cells were used as positive and negative controls, respectively. The forward- and side-scatter plots of the CFDA-SE-positive gated populations demonstrated that one-fifth of the unstimulated, G0 PHSC had fused, compared to 5.4% of the stimulated PHSC (Fig. 8B). This suggests that quiescent PHSC are equally fusogenic as, if not more fusogenic than, activated, cycling PHSC and that the block to transduction in resting PHSC by HIV(VSV G) pseudotypes is after viral binding and entry.
FIG. 8.
The block to transduction in G0 PHSC is at a postentry viral step. (A) CD34+ PHSC were maintained in the presence or absence of cytokines (CTX) or rescued with cytokines. The cells were then stained by using the annexin V Fluos kit (Boehringer Mannheim) and PI. Left column, PI histogram; right column, annexin V histogram. The mean cell fluorescence (MCF) for each PI-negative population is indicated. As expected, the PI-positive populations had a higher MCF (not shown). (B) CD34+ PHSC were maintained in the presence or absence of cytokines, labeled with CFDA-SE, and incubated with VSV G-expressing 293T cells. After acid shock (to promote fusion), cells were analyzed by flow cytometry. Left column, histogram of CFDA-SE fluorescence; middle column, forward-scatter (FS) and side-scatter (SS) dot plot of CFDA-SE-positive cells. The R2 gate includes cells that have undergone fusion (higher forward and side scatters). The percentage of cells is indicated. Right column, forward- and side-scatter dot plot of targets alone. Top and bottom rows, 293T cells alone which have and have not undergone fusion, respectively.
DISCUSSION
More than 20 years ago, Fritsch and Temin (14) and Varmus and colleagues (55) demonstrated limited DNA replication of avian retroviruses in serum-starved cells, which increased (even after 6 days) once fresh serum was supplied. It is now known that oncoretroviruses require mitosis and nuclear envelope breakdown to complete a replication cycle (25, 39), whereas HIV has multiple gene products that allow infection of a cell independent of mitosis (51). Whether HIV can establish a productive infection of a truly quiescent cell (i.e., a cell that has low RNA levels and 2N DNA and is not cycling) remains an area of controversy. Some investigators have reported efficient reverse transcription of HIV genomes following infection of resting T cells, but in these cells the DNA fails to integrate (45–47). Instead, it persists in a stable, extrachromosomal form for several weeks. Translocation of the preintegration complex through intact nuclear pores is thought to require energy and cellular cofactors (11, 34), and nonproliferating T cells have lower pools of ribonucleotides, including ATP, than do activated T cells (4, 26). Spliced viral mRNAs are not observed, consistent with the block occurring before the initiation of transcription (45). Subsequent mitogenic activation of these cells (1 to 2 weeks after initial viral inoculation) results in integration and completion of the viral life cycle (46, 47, 58), suggesting that the viral nucleoprotein complex is extremely stable in these cells. In these experiments, the ability to infect quiescent lymphocytes appeared to be dependent on the presence of viral gene products, including MA and Nef (46, 58).
Other investigators, however, have reported a block to viral replication in quiescent T cells at the level of initiation or processivity of reverse transcription (23, 32, 50, 61, 62). The initiation of reverse transcription occurred at a rate similar to that in activated cells, but elongation proceeded more slowly, with the accumulation of replication intermediates. In the case of freshly isolated peripheral blood monocytes, the block was observed prior to initiation of DNA synthesis, perhaps at the stage of viral entry (44). In T cells, upon mitogenic stimulation, viral DNA synthesis proceeded to completion, but the overall efficiency of infection was only a few percent of that of activated cells (62). The half-life of incomplete reverse transcripts was estimated in one study to be approximately 24 h (61). The rate of reverse transcription could be increased by adding exogenous deoxynucleosides, which is consistent with these pools being limiting in G0 cells (32). Recently, Korin and Zack (23) reported that quiescent T cells stimulated with anti-CD3 alone entered cell cycle stage G1a (defined by a 2N DNA content, intermediate RNA levels, and blockage by N-butyrate [19, 20]) and HIV infection of these cells was arrested at the level of completion of reverse transcription, whereas cells that had been costimulated with anti-CD3 and anti-CD28 progressed to stage G1b (defined by a 2N DNA content and high RNA levels [19, 20]) and HIV infection of these cells progressed normally. These discrepancies between previous studies may be due to differences in the purities of the cell population, cell culture conditions, viral clones used, or sizes of the inocula.
The limitation to transduction in G0 PHSC that we observed appeared to be close to the initiation of reverse transcription of the viral cDNA. We therefore cannot exclude the possibility that there may be additional blocks to later stages in the infection process (e.g., at integration or transcription). The fact that the ratio of early to late reverse transcription products remained similar in the different cell populations suggests that the major block to reverse transcription is early. The fact that the different populations bound equivalent amounts of annexin V and fused equally well with VSV G-expressing cells suggests that it is unlikely that the block was at the level of virus binding and entry.
Our results appear to be at odds with those of Reiser et al., who reported a transduction rate of 83% in freshly isolated CD34+ cells, which were essentially all in the 2N DNA (presumably G0) population (38). The possible sources of this discrepancy are diverse, including differences in the preparation or purity of tissue; in the vector construct, viral titer, or transduction protocol; or in the handling of the cells after transduction.
Resting T lymphocytes have low intracellular pools of ATP and deoxynucleoside triphosphates (4, 26). This may be the basis for the observed failure of reverse transcription in quiescent T cells. We were unable to increase transduction rates of PHSC by providing purines, pyrimidines, or deoxynucleotides exogenously, but the addition of deoxynucleosides to cells in G0 increased transduction efficiency modestly (our unpublished results). Nevertheless, the overall transduction efficiency was still 5- to 10-fold less than that of activated, cycling cells. Raising the cellular deoxynucleoside triphosphate and ATP concentrations (by using liposomes or cationic lipids as delivery vehicles, for example) may be worth exploring.
At present, no host factor is known to assist in the process of reverse transcription, although it appears that reverse transcription becomes activated in the cytosol. The absence of an essential cytoplasmic component in G0 cells could account for the failure of reverse transcription. Nef-deficient, replication-competent HIV has been reported to synthesize viral DNA less efficiently than wild-type HIV (2, 7, 41, 46), but the presence or absence of Nef does not appear to affect infection efficiency when VSV G pseudotypes are assayed in a single replication cycle (1, 49). In our experiments, Nef did not improve transduction rates in G0 cells (also see Fig. 6A). Recent evidence suggests that the positive effect of Nef on viral infectivity is envelope specific, implying that Nef promotes viral binding and/or entry of wild-type HIV (1). Although Vif has been suggested to play a role in reverse transcription (42, 51, 57, 59), the presence of Vif in the HIV vector did not improve transduction of G0 PHSC.
Treatment of G0 PHSC with cytokines immediately following exposure to virus did not greatly improve transduction rates, suggesting that the HIV nucleoprotein core (NPC) is very labile, at least for pseudotyped particles. This result is consistent with previous work using replication-competent HIV in peripheral T cells (61). It is possible that the composition or routes for uncoating of pseudotyped particles and of replication-competent HIV are not the same (1), and there may be intrinsic differences in the stability of the NPC arrested at different postentry steps. NPC stability may also be cell type specific, dependent upon the presence of associated host factors (such as HMG I/Y [12]) and the absence of both proteases and nucleases.
Based upon surface protein markers and in vitro functional assays, it is likely that the PHSC in G0 represent the most primitive, uncommitted hematopoietic progenitors and thus the preferred targets for gene transfer (53, 54) (Fig. 4C). Understanding the basis for the inefficient transduction of these cells and developing strategies for overcoming it are therefore important goals. Our results suggest that transient activation of PHSC, perhaps by using pharmacologic agents to block progression from G1 or artificial elevation of intracellular deoxynucleoside triphosphate pools, should be investigated as a possible means to improve transduction of PHSC without sacrificing their pluripotentiality.
ACKNOWLEDGMENTS
We thank C. Dowding and R. Tushinski for purified PHSC, R. Pillai for pNL4-3-CMV-AP, and R. Rigg and G. Veres for useful discussions.
R.E.S. was supported by NIH grant CA71671. P.O.B. is an associate investigator of the Howard Hughes Medical Institute. This work was funded in part by NIH grant AI36898 and the Howard Hughes Medical Institute.
REFERENCES
- 1.Aiken C. Pseudotyping human immunodeficiency virus type 1 (HIV-1) by the glycoprotein of vesicular stomatitis virus targets HIV-1 entry to an endocytic pathway and suppresses both the requirement for Nef and the sensitivity to cyclosporin A. J Virol. 1997;71:5871–5877. doi: 10.1128/jvi.71.8.5871-5877.1997. [DOI] [PMC free article] [PubMed] [Google Scholar]
- 2.Aiken C, Trono D. Nef stimulates human immunodeficiency virus type 1 proviral DNA synthesis. J Virol. 1995;69:5048–5056. doi: 10.1128/jvi.69.8.5048-5056.1995. [DOI] [PMC free article] [PubMed] [Google Scholar]
- 3.Akkina R K, Walton R M, Chen M L, Li Q X, Planelles V, Chen I S. High-efficiency gene transfer into CD34+ cells with a human immunodeficiency virus type 1-based retroviral vector pseudotyped with vesicular stomatitis virus envelope glycoprotein G. J Virol. 1996;70:2581–2585. doi: 10.1128/jvi.70.4.2581-2585.1996. [DOI] [PMC free article] [PubMed] [Google Scholar]
- 4.Barankiewicz J, Cohen A. Purine nucleotide metabolism in phytohemagglutin-induced human T lymphocytes. Arch Biochem Biophys. 1987;258:167–175. doi: 10.1016/0003-9861(87)90333-x. [DOI] [PubMed] [Google Scholar]
- 5.Blomer U, Naldini L, Kafri T, Trono D, Verma I M, Gage F H. Highly efficient and sustained gene transfer in adult neurons with a lentivirus vector. J Virol. 1997;71:6641–6649. doi: 10.1128/jvi.71.9.6641-6649.1997. [DOI] [PMC free article] [PubMed] [Google Scholar]
- 6.Bukrinsky M I, Haggerty S, Dempsey M P, Sharova N, Adzhubel A, Spitz L, Lewis P, Goldfarb D, Emerman M, Stevenson M. A nuclear localization signal within HIV-1 matrix protein that governs infection of non-dividing cells. Nature. 1993;365:666–669. doi: 10.1038/365666a0. [DOI] [PMC free article] [PubMed] [Google Scholar]
- 7.Chowers M Y, Pandori M W, Spina C A, Richman D D, Guatelli J C. The growth advantage conferred by HIV-1 nef is determined at the level of viral DNA formation and is independent of CD4 downregulation. Virology. 1995;212:451–457. doi: 10.1006/viro.1995.1502. [DOI] [PubMed] [Google Scholar]
- 8.Chun T-W, Stuyver L, Mizell S B, Ehler L A, Mican J M, Baseler M, Lloyd A L, Nowak M A, Fauci A S. Presence of an inducible HIV-1 latent reservoir during highly active antiretroviral therapy. Proc Natl Acad Sci USA. 1997;94:13193–13197. doi: 10.1073/pnas.94.24.13193. [DOI] [PMC free article] [PubMed] [Google Scholar]
- 9.Corbeau P, Kraus G, Wong-Staal F. Efficient gene transfer by a human immunodeficiency virus type 1 (HIV-1)-derived vector utilizing a stable HIV packaging cell line. Proc Natl Acad Sci USA. 1996;93:14070–14075. doi: 10.1073/pnas.93.24.14070. [DOI] [PMC free article] [PubMed] [Google Scholar]
- 10.Corbeau P, Kraus G, Wong-Staal F. Transduction of human macrophages using a stable HIV-1/HIV-2-derived gene delivery system. Gene Ther. 1998;5:99–104. doi: 10.1038/sj.gt.3300563. [DOI] [PubMed] [Google Scholar]
- 11.Cullen B R. HIV-1 auxiliary proteins: making connections in a dying cell. Cell. 1998;93:685–692. doi: 10.1016/s0092-8674(00)81431-2. [DOI] [PubMed] [Google Scholar]
- 12.Farnet C M, Bushman F D. HIV-1 cDNA integration: requirement of HMG I(Y) protein for function of preintegration complexes in vitro. Cell. 1997;88:483–492. doi: 10.1016/s0092-8674(00)81888-7. [DOI] [PubMed] [Google Scholar]
- 13.Fouchier R A, Meyer B E, Simon J H, Fischer U, Malim M H. HIV-1 infection of non-dividing cells: evidence that the amino-terminal basic region of the viral matrix protein is important for Gag processing but not for post-entry nuclear import. EMBO J. 1997;16:4531–4539. doi: 10.1093/emboj/16.15.4531. [DOI] [PMC free article] [PubMed] [Google Scholar]
- 14.Fritsch E F, Temin H M. Inhibition of viral DNA synthesis in stationary chicken embryo fibroblasts infected with avian retroviruses. J Virol. 1977;24:461–469. doi: 10.1128/jvi.24.2.461-469.1977. [DOI] [PMC free article] [PubMed] [Google Scholar]
- 15.Gallay P, Hope T, Chin D, Trono D. HIV-1 infection of nondividing cells through the recognition of integrase by the importin/karyopherin pathway. Proc Natl Acad Sci USA. 1997;94:9825–9830. doi: 10.1073/pnas.94.18.9825. [DOI] [PMC free article] [PubMed] [Google Scholar]
- 16.Gallay P, Stitt V, Mundy C, Oettinger M, Trono D. Role of the karyopherin pathway in human immunodeficiency virus type 1 nuclear import. J Virol. 1996;70:1027–1032. doi: 10.1128/jvi.70.2.1027-1032.1996. [DOI] [PMC free article] [PubMed] [Google Scholar]
- 17.Gallay P, Swingler S, Aiken C, Trono D. HIV-1 infection of non-dividing cells: C-terminal tyrosine phosphorylation of the viral matrix protein is a key regulator. Cell. 1995;80:379–388. doi: 10.1016/0092-8674(95)90488-3. [DOI] [PubMed] [Google Scholar]
- 18.Gallay P, Swingler S, Song J, Bushman F, Trono D. HIV nuclear import is governed by the phosphotyrosine-mediated binding of Matrix to the core domain of integrase. Cell. 1995;83:569–575. doi: 10.1016/0092-8674(95)90097-7. [DOI] [PubMed] [Google Scholar]
- 19.Gilbert K M, Ernst D N, Hobbs M V, Weigle W O. Effects of tolerance induction on early cell cycle progression by Th1 clones. Cell Immunol. 1992;141:362–372. doi: 10.1016/0008-8749(92)90155-i. [DOI] [PubMed] [Google Scholar]
- 20.Gilbert K M, Weigle W O. Th1 cell anergy and blockade in G1a phase of the cell cycle. J Immunol. 1993;151:1245–1254. [PubMed] [Google Scholar]
- 21.Gore S D, Amin S, Weng L J, Civin C I. Steel factor supports the cycling of isolated human CD34+ cells in the absence of other growth factors. Exp Hematol. 1995;23:413–421. [PubMed] [Google Scholar]
- 22.Heinzinger N K, Bukinsky M I, Haggerty S A, Ragland A M, Kewalramani V, Lee M A, Gendelman H E, Ratner L, Stevenson M, Emerman M. The Vpr protein of human immunodeficiency virus type 1 influences nuclear localization of viral nucleic acids in nondividing host cells. Proc Natl Acad Sci USA. 1994;91:7311–7315. doi: 10.1073/pnas.91.15.7311. [DOI] [PMC free article] [PubMed] [Google Scholar]
- 23.Korin Y D, Zack J A. Progression to the G1b phase of the cell cycle is required for completion of human immunodeficiency virus type 1 reverse transcription. J Virol. 1998;72:3161–3168. doi: 10.1128/jvi.72.4.3161-3168.1998. [DOI] [PMC free article] [PubMed] [Google Scholar]
- 24.Lewis P, Hensel M, Emerman M. Human immunodeficiency virus infection of cells arrested in the cell cycle. EMBO J. 1992;11:3053–3058. doi: 10.1002/j.1460-2075.1992.tb05376.x. [DOI] [PMC free article] [PubMed] [Google Scholar]
- 25.Lewis P F, Emerman M. Passage through mitosis is required for oncoretroviruses but not for the human immunodeficiency virus. J Virol. 1994;68:510–516. doi: 10.1128/jvi.68.1.510-516.1994. [DOI] [PMC free article] [PubMed] [Google Scholar]
- 26.Marijnen Y M, de Korte D, Haverkort W A, den Breejen E J, van Gennip A H, Roos D. Studies on the incorporation of precursors into purine and pyrimidine nucleotides via ‘de novo’ and ‘salvage’ pathways in normal lymphocytes and lymphoblastic cell-line cells. Biochim Biophys Acta. 1989;1012:148–155. doi: 10.1016/0167-4889(89)90088-8. [DOI] [PubMed] [Google Scholar]
- 27.Metcalf D. Hematopoietic regulators: redundancy or subtlety? Blood. 1993;82:3515–3523. [PubMed] [Google Scholar]
- 28.Miyoshi H, Takahashi M, Gage F H, Verma I M. Stable and efficient gene transfer into the retina using an HIV-based lentiviral vector. Proc Natl Acad Sci USA. 1997;94:10319–10323. doi: 10.1073/pnas.94.19.10319. [DOI] [PMC free article] [PubMed] [Google Scholar]
- 29.Naldini L, Blomer U, Gage F H, Trono D, Verma I M. Efficient transfer, integration, and sustained long-term expression of the transgene in adult rat brains injected with a lentiviral vector. Proc Natl Acad Sci USA. 1996;93:11382–11388. doi: 10.1073/pnas.93.21.11382. [DOI] [PMC free article] [PubMed] [Google Scholar]
- 30.Naldini L, Blomer U, Gallay P, Ory D, Mulligan R, Gage F H, Verma I M, Trono D. In vivo delivery and stable transduction of nondividing cells by a lentiviral vector. Science. 1996;272:263–267. doi: 10.1126/science.272.5259.263. [DOI] [PubMed] [Google Scholar]
- 31.Nordon R E, Ginsberg S S, Eaves C J. High-resolution cell division tracking demonstrates the FLt3-ligand-dependence of human marrow CD34+CD38− cell production in vitro. Br J Haematol. 1997;98:528–539. doi: 10.1046/j.1365-2141.1997.2823097.x. [DOI] [PubMed] [Google Scholar]
- 32.O’Brien W A, Namazi A, Kalhor H, Mao S-H, Zack J A, Chen I S Y. Kinetics of human immunodeficiency virus type 1 reverse transcription in blood mononuclear phagocytes are slowed by limitations of nucleotide precursors. J Virol. 1994;68:1258–1263. doi: 10.1128/jvi.68.2.1258-1263.1994. [DOI] [PMC free article] [PubMed] [Google Scholar]
- 33.Ogawa M. Differentiation and proliferation of hematopoietic stem cells. Blood. 1993;81:2844–2853. [PubMed] [Google Scholar]
- 34.Ohno M, Fornerod M, Mattaj I W. Nucleocytoplasmic transport: the last 200 nanometers. Cell. 1998;92:327–336. doi: 10.1016/s0092-8674(00)80926-5. [DOI] [PubMed] [Google Scholar]
- 35.Park J R. Cytokine regulation of apoptosis in hematopoietic precursor cells. Curr Opin Hematol. 1996;3:191–196. doi: 10.1097/00062752-199603030-00005. [DOI] [PubMed] [Google Scholar]
- 36.Poeschla E, Corbeau P, Wong-Staal F. Development of HIV vectors for anti-HIV gene therapy. Proc Natl Acad Sci USA. 1996;93:11395–11399. doi: 10.1073/pnas.93.21.11395. [DOI] [PMC free article] [PubMed] [Google Scholar]
- 37.Poeschla E M, Wong-Staal F, Looney D J. Efficient transduction of nondividing human cells by feline immunodeficiency virus lentiviral vectors. Nat Med. 1998;4:354–357. doi: 10.1038/nm0398-354. [DOI] [PubMed] [Google Scholar]
- 38.Reiser J, Harmison G, Kluepfel-Stahl S, Brady R O, Karlsson S, Schubert M. Transduction of nondividing cells using pseudotyped defective high-titer HIV type 1 particles. Proc Natl Acad Sci USA. 1996;93:15266–15271. doi: 10.1073/pnas.93.26.15266. [DOI] [PMC free article] [PubMed] [Google Scholar]
- 39.Roe T, Reynolds T C, Yu G, Brown P O. Integration of murine leukemia virus DNA depends on mitosis. EMBO J. 1993;12:2099–2108. doi: 10.1002/j.1460-2075.1993.tb05858.x. [DOI] [PMC free article] [PubMed] [Google Scholar]
- 40.Schlegel R, Tralka T S, Willingham M C, Pastan I. Inhibition of VSV binding and infectivity by phosphotidylserine: is phosphotidylserine a VSV-binding site? Cell. 1983;32:639–646. doi: 10.1016/0092-8674(83)90483-x. [DOI] [PubMed] [Google Scholar]
- 41.Schwartz O, Marechal V, Danos O, Heard J M. Human immunodeficiency virus type 1 Nef increases the efficiency of reverse transcription in the infected cell. J Virol. 1995;69:4053–4059. doi: 10.1128/jvi.69.7.4053-4059.1995. [DOI] [PMC free article] [PubMed] [Google Scholar]
- 42.Simon J H, Malim M H. The human immunodeficiency virus type 1 Vif protein modulates the postpenetration stability of viral nucleoprotein complexes. J Virol. 1996;70:5297–5305. doi: 10.1128/jvi.70.8.5297-5305.1996. [DOI] [PMC free article] [PubMed] [Google Scholar]
- 43.Sinclair A M, Agrawal Y P, Elbar E, Agrawal R, Ho A D, Levine F. Interaction of vesicular stomatitis virus-G pseudotyped retrovirus with CD34+ and CD34+ CD38− hematopoietic progenitor cells. Gene Ther. 1997;4:918–927. doi: 10.1038/sj.gt.3300479. [DOI] [PubMed] [Google Scholar]
- 44.Sonza S, Maerz A, Deacon N, Meanger J, Mills J, Crowe S. Human immunodeficiency virus type 1 replication is blocked prior to reverse transcription and integration in freshly isolated peripheral blood monocytes. J Virol. 1996;70:3863–3869. doi: 10.1128/jvi.70.6.3863-3869.1996. [DOI] [PMC free article] [PubMed] [Google Scholar]
- 45.Spina C A, Guatelli J C, Richman D D. Establishment of a stable, inducible form of human immunodeficiency virus type 1 DNA in quiescent CD4 lymphocytes in vitro. J Virol. 1995;69:2977–2988. doi: 10.1128/jvi.69.5.2977-2988.1995. [DOI] [PMC free article] [PubMed] [Google Scholar]
- 46.Spina C A, Kwoh T J, Chowers M Y, Guatelli J C, Richman D D. The importance of nef in the induction of human immunodeficiency virus type 1 replication from primary quiescent CD4 lymphocytes. J Exp Med. 1994;179:115–123. doi: 10.1084/jem.179.1.115. [DOI] [PMC free article] [PubMed] [Google Scholar]
- 47.Stevenson M, Stanwick T L, Dempsey M P, Lamonica C A. HIV-1 replication is controlled at the level of T cell activation and proviral integration. EMBO J. 1990;9:1551–1560. doi: 10.1002/j.1460-2075.1990.tb08274.x. [DOI] [PMC free article] [PubMed] [Google Scholar]
- 48.Sutton R E, Littman D R. Broad host range of human T-cell leukemia virus type 1 demonstrated with an improved pseudotyping system. J Virol. 1996;70:7322–7326. doi: 10.1128/jvi.70.10.7322-7326.1996. [DOI] [PMC free article] [PubMed] [Google Scholar]
- 49.Sutton R E, Wu H T, Rigg R, Bohnlein E, Brown P O. Human immunodeficiency virus type 1 vectors efficiently transduce human hematopoietic stem cells. J Virol. 1998;72:5781–5788. doi: 10.1128/jvi.72.7.5781-5788.1998. [DOI] [PMC free article] [PubMed] [Google Scholar]
- 50.Tang S, Patterson B, Levy J A. Highly purified quiescent human peripheral blood CD4+ T cells are infectable by human immunodeficiency virus but do not release virus after activation. J Virol. 1995;69:5659–5665. doi: 10.1128/jvi.69.9.5659-5665.1995. [DOI] [PMC free article] [PubMed] [Google Scholar]
- 51.Trono D. HIV accessory proteins: leading roles for the supporting cast. Cell. 1995;82:189–192. doi: 10.1016/0092-8674(95)90306-2. [DOI] [PubMed] [Google Scholar]
- 52.Uchida N, Sutton R E, Friera A N, He D, Reitsma M J, Chang W C, Veres G, Scollay R, Weissman I L. HIV, but not MuLV vectors, mediate high efficiency gene transfer into freshly isolated G0/G1 human hematopoietic stem cells. Proc Natl Acad Sci USA. 1998;95:11939–11944. doi: 10.1073/pnas.95.20.11939. [DOI] [PMC free article] [PubMed] [Google Scholar]
- 53.Uchida N, Weissman I L. Searching for hematopoietic stem cells: evidence that Thy-1.1lo Lin− Sca-1+ cells are the only stem cells in C57BL/Ka-Thy-1.1 bone marrow. J Exp Med. 1992;175:175–184. doi: 10.1084/jem.175.1.175. [DOI] [PMC free article] [PubMed] [Google Scholar]
- 54.Uchida N, Yang Z, Combs J, Pourquie O, Nguyen M, Ramanathan R, Fu J, Welply A, Chen S, Weddell G, et al. The characterization, molecular cloning, and expression of a novel hematopoietic cell antigen from CD34+ human bone marrow cells. Blood. 1997;89:2706–2716. [PubMed] [Google Scholar]
- 55.Varmus H E, Padgett T, Heasley S, Simon G, Bishop J M. Cellular functions are required for the synthesis and integration of avian sarcoma virus-specific DNA. Cell. 1977;11:307–319. doi: 10.1016/0092-8674(77)90047-2. [DOI] [PubMed] [Google Scholar]
- 56.Vodicka M A, Koepp D M, Silver P A, Emerman M. HIV-1 Vpr interacts with the nuclear transport pathway to promote macrophage infection. Genes Dev. 1998;12:175–185. doi: 10.1101/gad.12.2.175. [DOI] [PMC free article] [PubMed] [Google Scholar]
- 57.Volsky D J, Potash M J, Simm M, Ma X-Y, Chao W, Shahabuddin M. The human immunodeficiency virus type 1 vif gene: the road from an accessory to an essential role in human immunodeficiency virus type 1 replication. Curr Top Microbiol Immunol. 1995;193:157–168. doi: 10.1007/978-3-642-78929-8_9. [DOI] [PubMed] [Google Scholar]
- 58.Von Schwedler U, Kornbluth R S, Trono D. The nuclear localization signal of the matrix protein of human immunodeficiency virus type 1 allows the establishment of infection in macrophages and quiescent T lymphocytes. Proc Natl Acad Sci USA. 1994;91:6992–6996. doi: 10.1073/pnas.91.15.6992. [DOI] [PMC free article] [PubMed] [Google Scholar]
- 59.Von Schwedler U, Song J, Aiken C, Trono D. Vif is crucial for human immunodeficiency virus type 1 proviral DNA synthesis in infected cells. J Virol. 1993;67:4945–4955. doi: 10.1128/jvi.67.8.4945-4955.1993. [DOI] [PMC free article] [PubMed] [Google Scholar]
- 60.Williams G T, Smith C A, Spooncer E, Dexter T M, Taylor D R. Haemopoietic colony stimulating factors promote cell survival by suppressing apoptosis. Nature. 1990;343:76–79. doi: 10.1038/343076a0. [DOI] [PubMed] [Google Scholar]
- 61.Zack J A, Arrigo S J, Weitsman S R, Go A S, Haislip A, Chen I S Y. HIV-1 entry into quiescent primary lymphocytes: molecular analysis reveals a labile, latent viral structure. Cell. 1990;61:213–222. doi: 10.1016/0092-8674(90)90802-l. [DOI] [PubMed] [Google Scholar]
- 62.Zack J A, Haislip A M, Krogstad P, Chen I S Y. Incompletely reverse-transcribed human immunodeficiency virus type 1 genomes in quiescent cells can function as intermediates in the retroviral life cycle. J Virol. 1992;66:1717–1725. doi: 10.1128/jvi.66.3.1717-1725.1992. [DOI] [PMC free article] [PubMed] [Google Scholar]


