Abstract
PURPOSE
Low-dose computed tomography (LDCT) for lung cancer screening is effective, although most eligible people are not being screened. Tools that provide personalized future cancer risk assessment could focus approaches toward those most likely to benefit. We hypothesized that a deep learning model assessing the entire volumetric LDCT data could be built to predict individual risk without requiring additional demographic or clinical data.
METHODS
We developed a model called Sybil using LDCTs from the National Lung Screening Trial (NLST). Sybil requires only one LDCT and does not require clinical data or radiologist annotations; it can run in real time in the background on a radiology reading station. Sybil was validated on three independent data sets: a heldout set of 6,282 LDCTs from NLST participants, 8,821 LDCTs from Massachusetts General Hospital (MGH), and 12,280 LDCTs from Chang Gung Memorial Hospital (CGMH, which included people with a range of smoking history including nonsmokers).
RESULTS
Sybil achieved area under the receiver-operator curves for lung cancer prediction at 1 year of 0.92 (95% CI, 0.88 to 0.95) on NLST, 0.86 (95% CI, 0.82 to 0.90) on MGH, and 0.94 (95% CI, 0.91 to 1.00) on CGMH external validation sets. Concordance indices over 6 years were 0.75 (95% CI, 0.72 to 0.78), 0.81 (95% CI, 0.77 to 0.85), and 0.80 (95% CI, 0.75 to 0.86) for NLST, MGH, and CGMH, respectively.
CONCLUSION
Sybil can accurately predict an individual's future lung cancer risk from a single LDCT scan to further enable personalized screening. Future study is required to understand Sybil's clinical applications. Our model and annotations are publicly available.
INTRODUCTION
Two large randomized controlled trials have established the efficacy of lung cancer screening (LCS) using low-dose computed tomography (LDCT) in cigarette smokers, with 20% and 24% decreases in lung cancer mortality in the National Lung Screening Trial (NLST) and the NELSON trial, respectively.1 Hence, the US Preventive Services Task Force recommends annual LDCTs for those age 50 years and older with a 20 pack-year history of smoking.2 There are currently major shortcomings in achieving appropriate LCS. For instance, in the United States, a dismal < 10% of the eligible population is being screened.3-5 Evidence also suggests those being screened are not being optimally routed to follow-up or kept engaged in long-term screening.6-8 In parallel, lung cancer diagnoses among never- and lighter-smokers are rapidly rising,9,10 suggesting that if we continue to focus research about LCS only on heavier smokers, a gap will persist between the screen population and the disease population.
CONTEXT
Key Objective
Individualized risk models for lung cancer prediction can improve screening practices, but current models require a combination of demographic information, clinical risk factors, and radiologic annotations. Using data from National Lung Screening Trial, this study describes the development of a deep learning cancer risk model, Sybil, that uses a single low-dose chest computed tomography (CT) scan to predict lung cancers occurring 1-6 years after a screen. Sybil's performance without image annotation and demographic or clinical data is then evaluated on modern and independent test sets from Massachusetts General Hospital and Chang Gung Memorial Hospital, Taiwan.
Knowledge Generated
Sybil was able to forecast both short-term and long-term lung cancer risk on the National Lung Screening Trial test set. Using low-dose chest CT lung screening scans collected over the past 15 years, Sybil maintained its accuracy across diverse sets of patients from the United States and Taiwan. The code is publicly available.
Relevance (T.E. Stinchcombe)
The preliminary results of this study suggest the program can provide additional information about the future lung cancer risk in patients undergoing CT lung cancer screening with minimal disruption in the normal clinical workflow. Further evaluation in a prospective study to assess the performance and clinical benefit is warranted.*
*Relevance section written by JCO Associate Editor Thomas E. Stinchcombe, MD.
One strategy that could help address these disparate LCS obstacles is to improve the efficiency and benefits of LCS by individualizing assessment of future lung cancer risk. Past efforts to improve LCS rates have focused on identifying those at the highest risk for lung cancer and directing available resources to screen them. To that end, significant progress has been made using clinical and demographic variables as well as chest radiographs to model lung cancer risk among smokers, and an ongoing clinical trial is examining the utility of one such clinical model (PLCOm2012) to select patients for LDCT screening.11-16
Once patients have started LCS, determining follow-up imaging frequency relies primarily on visible pulmonary nodule assessment.17 Ardila et al18 leveraged LDCTs from the NLST to develop a cancer detection algorithm that identifies pulmonary nodules, processes the region surrounding a visible nodule using deep learning, and accurately predicts lung cancer within 1 and 2 years. Others showed improved risk predictions when combining PLCOm2012 with outcomes from the last three screens, but did not leverage image data directly.18,19 In more recent work, Robbins et al20 used risk factors and image-based features to recommend personalized screening intervals.
We hypothesize that LDCT images contain information that is predictive of future lung cancer risk beyond currently identifiable features such as lung nodules. An algorithm that goes past visible nodules to predicting future lung cancer risk over several years could further enhance patient management and LCS implementation strategies. Therefore, we aimed to develop and validate a deep learning algorithm that predicts future lung cancer risk out to 6 years from a single LDCT scan, and assess its potential clinical impact.
MATERIALS AND METHODS
NLST Data
The NLST eligibility criteria and patient demographics have been described in previous work.1,21 We applied for and were granted access to the radiologic and clinical data from a sample of 15,000 NLST participants in the LDCT arm, including all lung cancers in that arm. The data included participants' initial LDCT and up to two annual follow-up LDCTs when available. All participants signed an institutional review board (IRB)–approved informed consent form.
NLST Training, Development, and Test Sets
NLST participants were split into training, development, and test sets, as per standard practice in computer science methodology.22 LDCTs from participants included in the Ardila et al18 test set were assigned to our test set (n = 2,328) and remained unseen during training. All other participants were randomly assigned to either the training set (n = 10,200) or the development set (n = 2,472), which is a proxy for the test set during algorithm development. We considered each LDCT as a unique data point, and did not link or associate multiple scans from an individual participant to each other (other than to ensure they were coassigned within the same set by allocating the set at the participant level). Within each LDCT, we selected the single series with the thinnest CT image slices for inclusion in the analysis and considered any given LDCT positive in terms of future cancer risk if biopsy-confirmed lung cancer was diagnosed within 6 years, independent of presence/absence of nodules or other abnormalities on that examination.
NLST Image Annotations
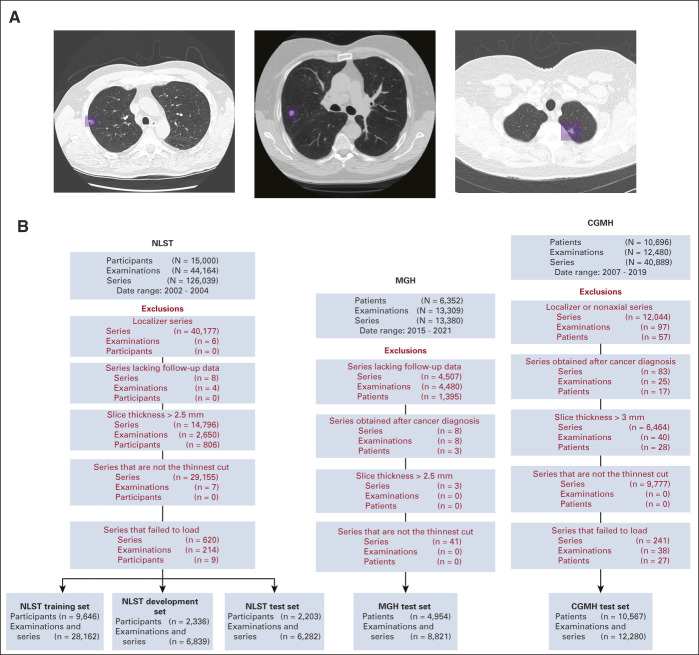
To help train the model, two fellowship-trained thoracic radiologists jointly annotated suspicious lesions on NLST LDCTs using MD.AI software23 for all participants who developed cancer within 1 year after an LDCT. Each lesion's volume was marked with bounding boxes on contiguous thin-cut axial images (Fig 1A).
FIG 1.
(A) Annotation of lung cancers in Sybil training. For NLST participants who were diagnosed with lung cancer within 1 year of an LDCT examination, thoracic radiologists drew two-dimensional bounding boxes (purple) on every image showing the lesion, generating a 3D volume of each cancer to assist with model training. Each image below shows a different cancer from the NLST data set. (B) Data set construction flowcharts. Disposition of patients, LDCT examinations, and individual series within LDCTs from the data sets received from the NLST (left), MGH (center), and CGMH (right). Red font indicates a data filtration step. CGMH, Chang Gung Memorial Hospital; LDCT, low-dose chest computed tomography; MGH, Massachusetts General Hospital; NLST, National Lung Screening Trial.
Independent External Validation Data Sets
Following IRB-approvals, we retrospectively obtained 13,309 LDCTs from 6,392 consecutive adult patients receiving standard-of-care LCS at Massachusetts General Hospital (MGH; Boston, US) between 2015 and 2021, and 12,480 LDCTs from 10,696 adult patients who had undergone LDCTs for LCS at Chang Gung Memorial Hospital (CGMH; Linkou and Taoyuan, Taiwan) between 2007 and 2019. Note that unlike the NLST and MGH cohorts, at CGMH, any adult without a personal cancer history can obtain an LDCT, regardless of smoking history (Data Supplement, online only).24-26 Patients without clinical follow-up or imaging series not suitable for analysis were excluded (Data Supplement).
Algorithm Development
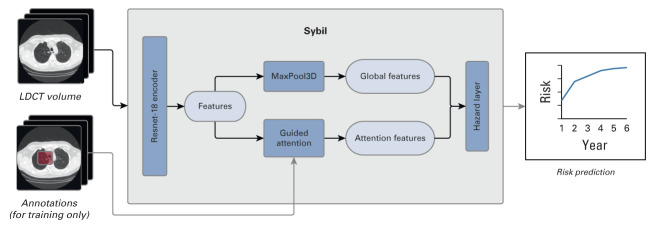
Sybil was designed to predict future lung cancer risk using a 3D convolutional neural network architecture (Appendix Fig A1, online only). A detailed description of data processing, algorithm design, and hyperparameter choices selected during Sybil's build can be found in the Data Supplement. Sybil's outcome is a set of six scores representing calibrated probabilities of lung cancer diagnosis extending 1 to 6 years following the LDCT.
Future Lung Cancer Prediction
To assess Sybil's performance, we computed Uno's concordance (C)–index27 and area under the receiver operating characteristic (ROC) curve for each year up to 6 years following a positive LDCT. The C-index expresses how likely in a randomly selected pair of LDCTs the scan closer to a cancer diagnosis had a higher predicted risk, while the ROC curve characterizes the model's tradeoff between sensitivity and specificity. For instance, when the aim is to limit false positives, the left portion of the ROC curve is most relevant for choosing a risk threshold. Bootstrapped CIs were computed with 5,000 resamples after clustering LDCTs by participant. To our knowledge, no other algorithm exists that uses a single LDCT scan to predict an overall future lung cancer risk up to 6 years, independent from visible nodules. Hence, there was no clear standard against which to compare Sybil's performance. We considered a P value of .05 statistically significant for all tests.
Additional Analyses
We performed additional analyses to better understand the inner workings of Sybil and explore clinical utility. For specificity analyses within the NLST test set, we considered true-positive LDCTs as those with a visible nodule(s) known to subsequently be confirmed as lung cancer, and true-negative LDCTs as those without lung cancer diagnosed after 6 years of follow-up. LDCTs that fit neither the true-positive nor true-negative definition were excluded from these analyses. This yielded 4,201 examinations with 93 true positives from the NLST test set. Within this subset, we retrospectively assigned the same Lung Imaging Reporting and Data Systems (Lung-RADS) 1.0 scores as calculated by Ardila et al,18 and classified Lung-RADS scores of 1 and 2 as negative and scores of 3 and 4 as positive as per Pinksy et al.28 Finally, we compared Sybil's false-positivity rate (FPR, defined as 1-specificity) to that of Lung-RADS 1.0 at the same sensitivity using the McNemar test.28,29 Additional details about these and the other analyses can be found in the Data Supplement.
RESULTS
Future Lung Cancer Prediction
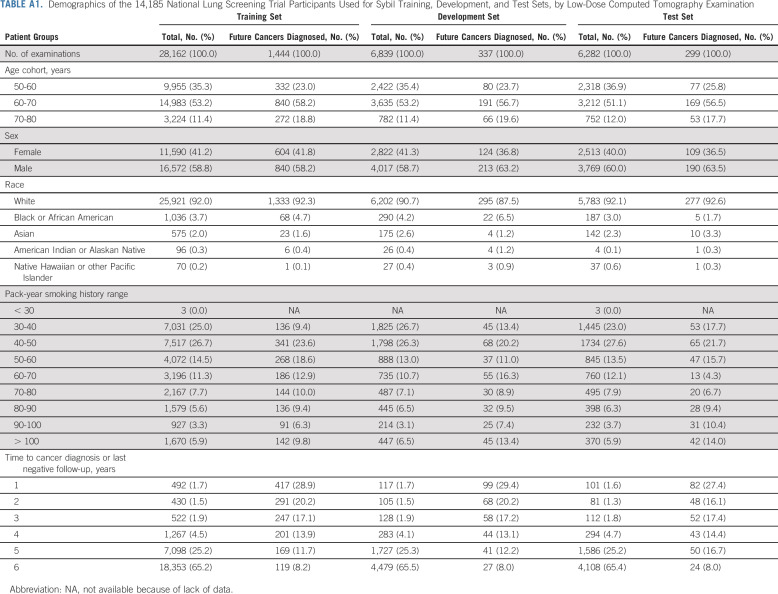
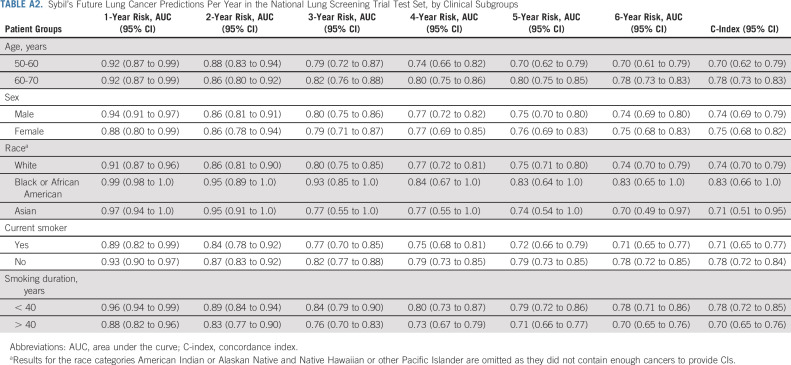
We obtained data on 15,000 participants from the NLST's LDCT arm. Filtration for image and data suitability resulted in 28,162 LDCTs in the Sybil training set, 6,839 LDCTs in the development set, and 6,282 LDCTs in the test set, with 1,444 (5.1%), 337 (4.9%), and 299 (4.8%) positive LDCTs, corresponding to lung cancers diagnosed over the subsequent 6 years, respectively (Fig 1B, Appendix Table A1, online only). After Sybil was developed using the NLST training and development sets, we evaluated its ability to predict future lung cancer risk on the NLST test set by computing area under the curves (AUCs) for each year out to 6 years and the C-index (Fig 2, Table 1). For testing, Sybil's input was limited to LDCT images only; no image annotation or clinical information was provided. Examining Sybil's accuracy in predicting future lung cancer, the model achieved a 1-year AUC of 0.92 (95% CI, 0.88 to 0.95), a 2-year AUC of 0.86 (95% CI, 0.82 to 0.90), and a C-index over the 6 years of prediction of 0.75 (95% CI, 0.72 to 0.78). Additionally, Sybil maintained performance across sex, age, and smoking history subgroups (Appendix Table A2, online only).
FIG 2.
Receiver operating characteristic curves displaying Sybil's ability to predict future lung cancer over 6 years following a single low-dose computed tomography from the (A) NLST, (B) MGH, and (C) CGMH test sets. CIs for each curve can be found in Table 1. AUC, area under the curve; C-index, concordance index; CGMH, Chang Gung Memorial Hospital; MGH, Massachusetts General Hospital; NLST, National Lung Screening Trial.
TABLE 1.
Sybil's Future Lung Cancer Predictions per Year in the NLST Test Set and the MGH and CGMH External Validation Sets
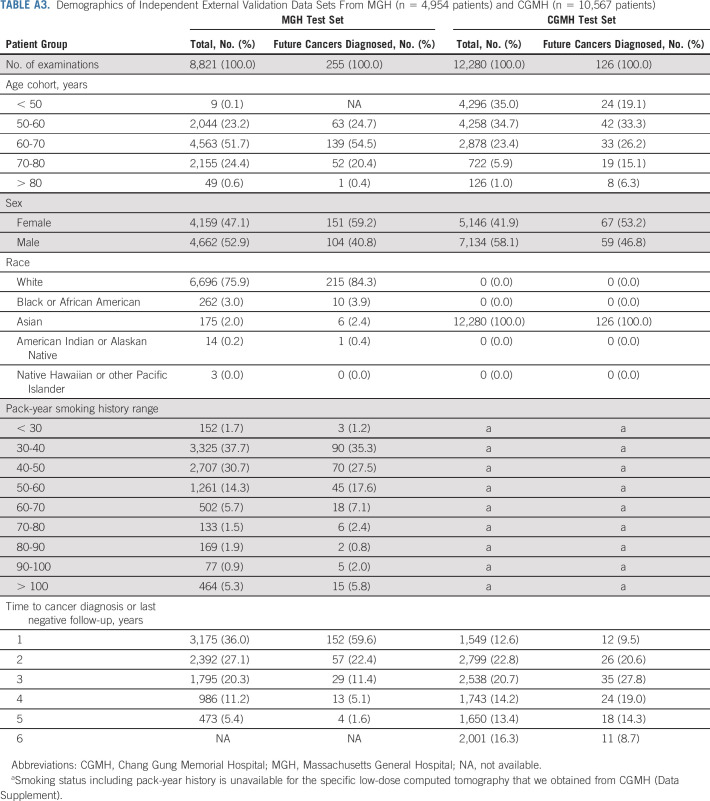
We next applied Sybil to two independent test sets. From MGH, we used 8,821 LDCTs, including 169 confirmed cancers (Fig 1B, Appendix Table A3, online only). From CGMH, we used 12,280 LDCTs including 101 cancers. Note that unlike the NLST and MGH cohorts, CGMH does not require a positive smoking history to access LDCTs; so, the cohort includes some people who have never smoked (Data Supplement). Sybil's risk prediction in the MGH and CGMH cohorts was similar to its power in the NLST test set, with comparable C-indices of 0.81 (95% CI, 0.77 to 0.85) and 0.80 (95% CI, 0.75 to 0.86) in the MGH and CGHM sets, respectively (Table 2).
TABLE 2.
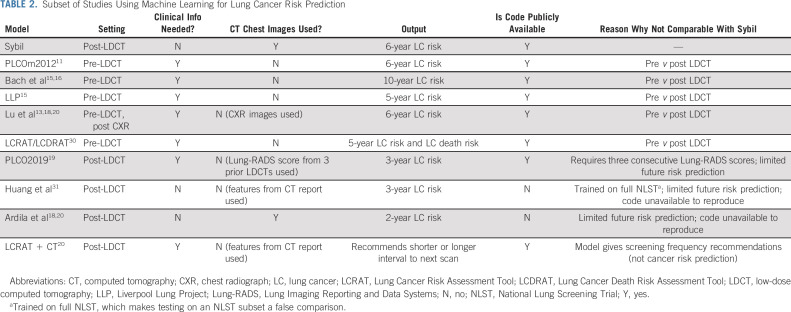
Subset of Studies Using Machine Learning for Lung Cancer Risk Prediction
Additional Analyses
Although Sybil does not require a radiologist to identify nodules, we wished to understand when the risk score likely relies on the presence of a nodule and when it does not. To estimate the influence of radiographically visible cancerous nodules on Sybil's risk assessment, we analyzed the performance on the NLST test set after excluding cases annotated by our radiologists as having visible nodules in the exact location of subsequently proven cancers (Data Supplement). In this exploratory analysis, Sybil's performance was hampered by removing visible nodules, obtaining a 2-year AUC of 0.81 (95% CI, 0.74 to 0.86) and a 6-year AUC of 0.69 (95% CI, 0.63 to 0.74; Table A4, online only).
We next estimated if Sybil's analysis considering the entire volumetric LDCT could improve specificity of interpreting scans with visible lung nodules compared with Lung-RADS, the clinical standard of care. Our NLST test set included 4,201 LDCTs that were known to either be truly negative for lung cancer after six complete years of follow-up or truly positive, with visible nodules that were biopsy-proven to be cancer (n = 93; Data Supplement). Among this cohort, Lung-RADS obtained a FPR of 0.10 (95% CI, 0.09 to 0.11), while Sybil yielded a FPR of 0.08 (95% CI, 0.07 to 0.09) at the same sensitivity level using the 1-year risk scores (P < .001; Appendix Table A5, online only). When considering baseline LDCTs only, Lung-RADS yielded a FPR of 0.14 (95% CI, 0.13 to 0.16) compared with Sybil's FPR of 0.08 (95% CI, 0.07 to 0.09; P < .001).
Examples of Clinical Application
Visualizing how a computer algorithm could affect patient care is not always straightforward. To illustrate the type of information that Sybil could provide to potentially improve clinical outcomes, we searched for case examples in which the Lung-RADS clinical assessment was low risk (scores 1 or 2) but Sybil's risk score was high (> 60% risk percentile; Fig 3). To provide a more global estimate of Sybil's ability to predict missed interval cancers despite adherence to annual LCS, we examined cases from the NLST test set with Lung-RADS scores 1 or 2 (n = 5,611). Among these, Sybil obtained a 1-year AUC of 0.86 (95% CI, 0.76 to 1.0) and a 2-year AUC of 0.79 (95% CI, 0.73 to 0.85).
FIG 3.
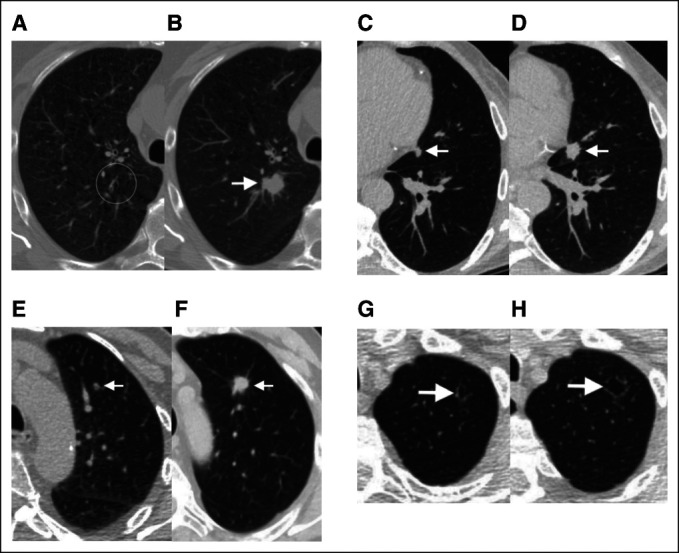
Examples of screening scans with negative clinical interpretations (Lung-RADS 1 or 2) and high Sybil risk scores, who subsequently developed lung cancer. Paired sets of images from four separate subjects from the National Lung Screening Trial and Massachusetts General Hospital cohorts illustrating Sybil's potential in predicting future lung cancer. Clinical (preoperative) or pathologic (postoperative) stages are provided using American Joint Committee on Cancer version 8.32 (A) A 69-year-old man with a 99 pack-year smoking history and LDCT without visible nodules in the right upper lobe (circle; Lung-RADS score 2, Sybil risk 75th percentile). (B) Two years later (after unchanged interval scan at 1 year), a new spiculated solid nodule appeared (arrow), and resection confirmed a 2.2-cm poorly differentiated squamous cancer (pT1cN0M0, stage IA3). (C) A 67-year-old man with a 30 pack-year smoking history and LDCT with a 7-mm solid nodule in the lingula next to the heart (arrow), which was missed because of human error (Lung-RADS score 2, Sybil risk 62nd percentile). (D) One year later, a 1.5-cm solid spiculated nodule was appreciated (arrow), and mediastinal sampling confirmed adenocarcinoma (cT1bN2M0, stage IIIA). (E) A 73-year-old man with an 80 pack-year smoking history and LDCT with a new solid nodule < 6 mm in the left upper lobe, that is, below the size threshold, which would have triggered a 6-month interval scan (Lung-RADS score 2, Sybil risk 65th percentile). (F) Two years later, after missing the recommended annual screen, a solid spiculated nodule was noted (arrow), and resection confirmed a 1.8-cm moderately differentiated squamous cell cancer (pT1bN0M0, stage IA2). (G) A 74-year-old man with 30 pack-year smoking history and LDCT showing an ill-defined cystic airspace in the left apex (arrow; Lung-RADS score 2, Sybil risk 69th percentile). Cyst-associated lung cancers are among the most difficult to recognize early.32,33 (H) Two years later, the lesion (arrow) had increased in size and resection confirmed a 2.1-cm moderately differentiated adenocarcinoma (invasive size 1.3 cm; pT1bN0M0, stage IA2). LDCT, low-dose computed tomography; Lung-RADS, Lung Imaging Reporting and Data Systems.
DISCUSSION
We developed Sybil, a deep learning algorithm that predicts future lung cancer risk out to 6 years from a single LDCT scan. Sybil can run in the background at a radiology reading station as soon as LDCT images are available, without inputting demographic or other clinical data and without requiring radiologists to annotate areas of interest. Trained on data from the NLST, Sybil was able to predict cancer within 1 year with AUCs of 0.92 (95% CI, 0.88 to 0.95) on a heldout NLST test set, and 0.86 (95% CI, 0.82 to 0.90) and 0.94 (95% CI, 0.91 to 1.00) on the MGH and CGMH independent external validation sets, respectively. The 6-year C-index was 0.75 (95% CI, 0.72 to 0.78), 0.81 (95% CI, 0.77 to 0.85), and 0.80 (95% CI, 0.75 to 0.86) for Sybil on the NLST, MGH, and CGMH sets, respectively.
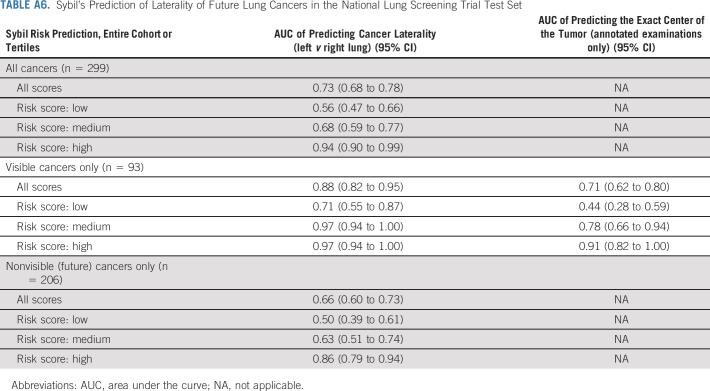
Sybil's assessment may not correspond to how a human radiologist would approach image analysis. We sought to gain insight into the visual characteristics that Sybil might consider in making predictions. We noted an association between Sybil's ability to correctly lateralize the location of future cancers and the likelihood that an LDCT receives a high-risk score (Appendix Table A6, online only), indicating that when Sybil predicts high future lung cancer risk, the signal it uses localizes to specific at-risk regions rather than being equally spread over the entire thorax. We also found that traditional clinical risk factors such as smoking duration can be predicted directly from the LDCT images (Appendix Fig A2, online only, Appendix Table A7, online only), suggesting that Sybil may also infer biologically relevant information from LDCT images. To distinguish between cancer detection and future cancer risk, we removed visible lung nodules that were known to be cancerous from the analysis set. We found that Sybil's performance was lower on this set but still possessed predictive power.
As is standard practice, we sought to compare Sybil with other models used for lung cancer risk prediction. However, although several models have been developed to improve LCS and detection, none are valid comparisons to Sybil as they differ in goal, scope, data input, and code availability (Table 2). Many models require either clinical data, manual identification and characterization of nodules, multiple LDCTs, or the Lung-RADS assessment of a radiologist. In general, the models can be divided into those that predict risk before a scan has been performed and can be used to steer high-risk patients toward screening, and those that predict risk after a scan has been performed and use data from the scan (either images or descriptions of images) as model input. The two most similar models to Sybil are likely the two that are post-LDCT and analyze the CT images themselves to predict risk, namely, the models published by Ardila and by Huang. However, they are limited in the number of years to cancer incidence that they predict. Additionally, we could not implement either of these models to test head-to-head against Sybil for short-term cancer risk prediction because their code bases were not made public.
On the basis of our initial results, one potential clinical application is to use Sybil to decrease follow-up scans or biopsies among patients with nodules that are low risk. Indeed, increasing the specificity of LDCT screening was a key advantage of the Lung-RADS system compared with the nodule assessment algorithm used in the NLST study, and underlies its adoption as the gold standard in the United States. In our assessment of the NLST test set, Sybil further reduced the FPR to 8% for baseline scans, compared with 14% for Lung-RADS 1.0, while maintaining equivalent sensitivity. In addition to false positives, false negatives or missed interval cancers among patients engaged in LCS programs are a major concern for both medical and legal reasons. NLST investigators examined the 44 missed interval lung cancers in the NLST and found, upon retrospective review, most missed cases could have potentially been avoided but for human error.34 Although anecdotal, the cases discussed in Figure 3 similarly spark contemplation about whether Sybil could be harnessed to decrease follow-up intervals or increase prioritization by the patient navigator and other tools to ensure those at highest risk are followed most closely. The benefit of such interventions will require confirmation in prospective clinical trials.
Before Sybil can be studied prospectively, the first step is to gain confidence that it is generalizable. Sybil was developed using scans from the NLST, which were obtained in 2002-2004 from US patients who were overwhelmingly White (92%). Changes in CT technology over time might adversely affect Sybil's translation, hence we chose more modern cohorts for independent validation. Differences in image slice thickness over time were noted, although we had already excluded scans with images thicker than 2.5 mm from the initial Sybil build. Despite technological changes, Sybil generalized well across these modern and diverse validation cohorts. Notably in CGMH, Sybil maintained its performance in a population that likely consists of a plurality of nonsmokers. However, none of the cohorts presented here include sufficient Black or Hispanic patients to have confidence in broad applicability yet.
There are several limitations to this study. In addition to the aforementioned lack of a true comparator model and suboptimal population diversity to date, the work presented here is solely retrospective. As the cohorts we studied consisted of subjects engaged in LCS, we cannot assess Sybil's ability to detect cancers presenting independently from a screening program. Importantly, we do not have access to detailed smoking data from CGMH subjects, so conclusions about Sybil's ability to predict lung cancer from images in nonsmokers remain speculative. Although the CGMH cohort likely consists mostly of nonsmokers, the lung cancer incidence in Taiwan among nonsmokers is also significantly higher than most countries.24 Top priorities for next steps are understanding whether Sybil might facilitate LCS research into populations outside the current US Preventive Services Task Force criteria and which strategies are optimal to incorporate Sybil's risk predictions into real-world LCS patient management and decision making.35 Like all artificial intelligence tools being developed for health care application, careful and transparent development of Sybil including critical assessment of shortcomings will be necessary.
To facilitate Sybil's use and promote further research into clinical applications of this model, the algorithm is publicly available along with the image annotations generated on the NLST dataset.
ACKNOWLEDGMENT
The authors thank the National Cancer Institute for access to NCI’s data collected by the National Lung Screening Trial (NLST) (NLST‐564 and NLST‐764), as well as patients who participated in the trial. The authors are also grateful to the Cancer Center of Linkou CGMH for assistance with data collection under Chang Gung Medical Foundation IRB No. 202100919B0, and R. Yang, J. Song, and their team (Quanta Computer Inc.) for providing technical and computing support for analyzing the CGMH data set. The statements contained herein are solely those of the authors and do not represent or imply concurrence or endorsement by the NCI. The authors dedicate this work to Sylvia McLaughlin Chambers, who kindled the collaboration between the MIT and MGB teams.
APPENDIX
FIG A1.
Architecture of Sybil. We first extract features from the input LDCT volume via a pretrained 3D Resnet-18 encoder. These features were used to compute a global feature vector for the volume through a Max Pooling layer and an attention-guided pooling layer. The resulting vectors were concatenated and passed through a hazard layer to produce a cumulative probability of developing lung cancer within 6 years. We trained the same algorithm architecture five times, and Sybil is the ensemble of these five algorithms whose risk predictions are averaged. Bounding box annotations of visible cancer nodules were used to guide the model's attention during training but are not used during testing. LDCT, low-dose computed tomography.
FIG A2.
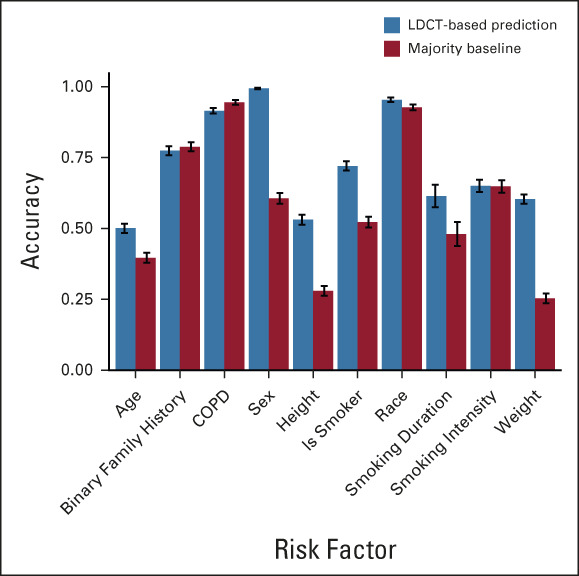
Sybil's accuracy in predicting clinical risk factors. Predictions on the basis of low-dose chest computed tomography images compared with the majority baseline. Error bars represent bootstrapped 95% CIs. COPD, chronic obstructive pulmonary disease; LDCT, low-dose computed tomography.
TABLE A1.
Demographics of the 14,185 National Lung Screening Trial Participants Used for Sybil Training, Development, and Test Sets, by Low-Dose Computed Tomography Examination
TABLE A2.
Sybil's Future Lung Cancer Predictions Per Year in the National Lung Screening Trial Test Set, by Clinical Subgroups
TABLE A3.
Demographics of Independent External Validation Data Sets From MGH (n = 4,954 patients) and CGMH (n = 10,567 patients)
TABLE A4.
Sybil's Future Lung Cancer Prediction in the National Lung Screening Trial Test Set When Excluding Scans With Visually Evident Cancers
TABLE A5.
Sybil's False-Positive Rate Compared With Lung-RADS Version 1.0 at the Same Sensitivity Rate Among the Subset of the National Lung Screening Trial Test Set With Visible Pulmonary Nodules
TABLE A6.
Sybil's Prediction of Laterality of Future Lung Cancers in the National Lung Screening Trial Test Set
TABLE A7.
Characteristics of Screen-Detected Nodules in the National Lung Screening Trial Sets Used
Peter G. Mikhael
Consulting or Advisory Role: Outcomes4Me
Adam Yala
Honoraria: Sanofi
Consulting or Advisory Role: Janssen Research & Development, Merck, HuroneAI
Angelo K. Takigami
Employment: MetroWest Medical Center
Cheng-Ta Yang
Consulting or Advisory Role: AstraZenica, Boehringer Ingelheim, Lilly, Merck, Ono, BMS
Speakers' Bureau: Novartis, AstraZenica, Boehringer Ingelheim, Lilly, MSD, Merck, Amgen, Johnson & Johnson, Roche, Ono, BMS, Chugai
Gigin Lin
Research Funding: Quanta Computer (Inst)
Lecia V. Sequist
Consulting or Advisory Role: AstraZeneca, Genentech/Roche, Janssen Oncology, Takeda, Pfizer
Research Funding: Boehringer Ingelheim (Inst), Novartis (Inst), AstraZeneca (Inst), Delfi Diagnostics (Inst)
Florian J. Fintelmann
Consulting or Advisory Role: Jounce Therapeutics, Pfizer (Inst)
Research Funding: BTG (Inst)
Patents, Royalties, Other Intellectual Property: Royalties from writing a book with Elsevier (publisher), Patent related to body composition analysis on CT scans
Regina Barzilay
Leadership: Dewpoint Therapeutics
Consulting or Advisory Role: J&J, Bayer, Moderna Therapeutics, Amgen, Outcomes4Me, Immunai
Travel, Accommodations, Expenses: J&J
No other potential conflicts of interest were reported.
See accompanying editorial on page 2141
SUPPORT
Supported by the Bridge Project, a partnership between the Koch Institute for Integrative Cancer Research at MIT and the Dana-Farber/Harvard Cancer Center, as well as the MIT Jameel-Clinic, Quanta Computing, Stand Up To Cancer, and the Massachusetts General Hospital Center for Innovation in Early Cancer Detection, including support from the Bralower and Landry Families, and Upstage Lung Cancer. Funding to support this research was also provided for by the Eric and Wendy Schmidt Center at the Broad Institute of MIT and Harvard.
P.G.M. and J.W. contributed equally to this work as co-first authors. L.V.S., F.J.F., and R.B. contributed equally to this work as joint senior authors.
DATA SHARING STATEMENT
The data used in this study are public and can be requested at: https://biometry.nci.nih.gov/cdas/learn/nlst/images/. We have made available our data splits, expert radiologist annotations, trained models, and code at https://github.com/reginabarzilaygroup/Sybil.git.
AUTHOR CONTRIBUTIONS
Conception and design: Peter G. Mikhael, Jeremy Wohlwend, Adam Yala, Lecia V. Sequist, Florian J. Fintelmann, Regina Barzilay
Financial support: Lecia V. Sequist, Florian J. Fintelmann, Regina Barzilay
Administrative support: PuiYee Chan, Gigin Lin, Lecia V. Sequist, Florian J. Fintelmann
Provision of study materials or patients: Angelo K. Takigami, Patrick P. Bourgouin, Sofiane Mrah, Wael Amayri, Cheng-Ta Yang, Yung-Liang Wan, Gigin Lin, Lecia V. Sequist, Florian J. Fintelmann
Collection and assembly of data: Peter G. Mikhael, Jeremy Wohlwend, Angelo K. Takigami, Patrick P. Bourgouin, PuiYee Chan, Sofiane Mrah, Wael Amayri, Yu-Hsiang Juan, Yung-Liang Wan, Gigin Lin, Florian J. Fintelmann
Data analysis and interpretation: Peter G. Mikhael, Jeremy Wohlwend, Adam Yala, Ludvig Karstens, Justin Xiang, Lecia V. Sequist, Florian J. Fintelmann, Regina Barzilay
Manuscript writing: All authors
Final approval of manuscript: All authors
Accountable for all aspects of the work: All authors
AUTHORS' DISCLOSURES OF POTENTIAL CONFLICTS OF INTEREST
Sybil: A Validated Deep Learning Model to Predict Future Lung Cancer Risk From a Single Low-Dose Chest Computed Tomography
The following represents disclosure information provided by authors of this manuscript. All relationships are considered compensated unless otherwise noted. Relationships are self-held unless noted. I = Immediate Family Member, Inst = My Institution. Relationships may not relate to the subject matter of this manuscript. For more information about ASCO's conflict of interest policy, please refer to www.asco.org/rwc or ascopubs.org/jco/authors/author-center.
Open Payments is a public database containing information reported by companies about payments made to US-licensed physicians (Open Payments).
Peter G. Mikhael
Consulting or Advisory Role: Outcomes4Me
Adam Yala
Honoraria: Sanofi
Consulting or Advisory Role: Janssen Research & Development, Merck, HuroneAI
Angelo K. Takigami
Employment: MetroWest Medical Center
Cheng-Ta Yang
Consulting or Advisory Role: AstraZenica, Boehringer Ingelheim, Lilly, Merck, Ono, BMS
Speakers' Bureau: Novartis, AstraZenica, Boehringer Ingelheim, Lilly, MSD, Merck, Amgen, Johnson & Johnson, Roche, Ono, BMS, Chugai
Gigin Lin
Research Funding: Quanta Computer (Inst)
Lecia V. Sequist
Consulting or Advisory Role: AstraZeneca, Genentech/Roche, Janssen Oncology, Takeda, Pfizer
Research Funding: Boehringer Ingelheim (Inst), Novartis (Inst), AstraZeneca (Inst), Delfi Diagnostics (Inst)
Florian J. Fintelmann
Consulting or Advisory Role: Jounce Therapeutics, Pfizer (Inst)
Research Funding: BTG (Inst)
Patents, Royalties, Other Intellectual Property: Royalties from writing a book with Elsevier (publisher), Patent related to body composition analysis on CT scans
Regina Barzilay
Leadership: Dewpoint Therapeutics
Consulting or Advisory Role: J&J, Bayer, Moderna Therapeutics, Amgen, Outcomes4Me, Immunai
Travel, Accommodations, Expenses: J&J
No other potential conflicts of interest were reported.
REFERENCES
- 1.The National Lung Screening Trial Research Team : Reduced lung-cancer mortality with low-dose computed tomographic screening. N Engl J Med 365:395-409, 2011 [DOI] [PMC free article] [PubMed] [Google Scholar]
- 2.US Preventive Services Task Force, Krist AH Davidson KW et al. : Screening for lung cancer: US Preventive Services Task Force recommendation statement. JAMA 325:962-970, 2021 [DOI] [PubMed] [Google Scholar]
- 3.Fedewa SA, Kazerooni EA, Studts JL, et al. : State variation in low-dose computed tomography scanning for lung cancer screening in the United States. J Natl Cancer Inst 113:1044-1052, 2021 [DOI] [PMC free article] [PubMed] [Google Scholar]
- 4.Haddad DN, Sandler KL, Henderson LM, et al. : Disparities in lung cancer screening: A review. Ann Am Thorac Soc 17:399-405, 2020 [DOI] [PMC free article] [PubMed] [Google Scholar]
- 5.Wang GX, Baggett TP, Pandharipande PV, et al. : Barriers to lung cancer screening engagement from the patient and provider perspective. Radiology 290:278-287, 2019 [DOI] [PubMed] [Google Scholar]
- 6.Triplette M, Wenger DS, Shahrir S, et al. : Patient identification of lung cancer screening follow-up recommendations and the association with adherence. Ann Am Thorac Soc 19:799-806, 2022 [DOI] [PubMed] [Google Scholar]
- 7.Lin Y, Fu M, Ding R, et al. : Patient adherence to lung CT screening reporting & data system–recommended screening intervals in the United States: A systematic review and meta-analysis. J Thorac Oncol 17:38-55, 2022 [DOI] [PMC free article] [PubMed] [Google Scholar]
- 8.Núñez ER, Caverly TJ, Zhang S, et al. : Adherence to follow-up testing recommendations in US veterans screened for lung cancer, 2015-2019. JAMA Netw Open 4:e2116233, 2021 [DOI] [PMC free article] [PubMed] [Google Scholar]
- 9.Tseng C-H, Tsuang BJ, Chiang CJ, et al. : The relationship between air pollution and lung cancer in nonsmokers in Taiwan. J Thorac Oncol 14:784-792, 2019 [DOI] [PubMed] [Google Scholar]
- 10.Rivera GA, Wakelee H: Lung cancer in never smokers. Adv Exp Med Biol 893:43-57, 2016 [DOI] [PubMed] [Google Scholar]
- 11.Tammemägi MC, Katki HA, Hocking WG, et al. : Selection criteria for lung-cancer screening. N Engl J Med 368:728-736, 2013 [DOI] [PMC free article] [PubMed] [Google Scholar]
- 12.ten Haaf K, Jeon J, Tammemagi MC, et al. : Risk prediction models for selection of lung cancer screening candidates: A retrospective validation study. PLoS Med 14:e1002277, 2017 [DOI] [PMC free article] [PubMed] [Google Scholar]
- 13.Lu MT, Raghu VK, Mayrhofer T, et al. : Deep learning using chest radiographs to identify high-risk smokers for lung cancer screening computed tomography: Development and validation of a prediction model. Ann Intern Med 173:704-713, 2020 [DOI] [PMC free article] [PubMed] [Google Scholar]
- 14.Lim KP, Marshall H, Tammemagi M, et al. : Protocol and rationale for the International Lung Screening Trial. Ann Am Thorac Soc 17:503-512, 2020 [DOI] [PMC free article] [PubMed] [Google Scholar]
- 15.Cassidy A, Myles JP, van Tongeren M, et al. : The LLP risk model: An individual risk prediction model for lung cancer. Br J Cancer 98:270-276, 2008 [DOI] [PMC free article] [PubMed] [Google Scholar]
- 16.Bach PB, Kattan MW, Thornquist MD, et al. : Variations in lung cancer risk among smokers. J Natl Cancer Inst 95:470-478, 2003 [DOI] [PubMed] [Google Scholar]
- 17.Chelala L, Hossain R, Kazerooni EA, et al. : Lung-RADS version 1.1: Challenges and a look ahead, from the AJR special series on radiology reporting and data systems. Am J Roentgenol 216:1411-1422, 2021 [DOI] [PubMed] [Google Scholar]
- 18.Ardila D, Kiraly AP, Bharadwaj S, et al. : End-to-end lung cancer screening with three-dimensional deep learning on low-dose chest computed tomography. Nat Med 25:954-961, 2019 [DOI] [PubMed] [Google Scholar]
- 19.Tammemägi MC, ten Haaf K, Toumazis I, et al. : Development and validation of a multivariable lung cancer risk prediction model that includes low-dose computed tomography screening results: A secondary analysis of data from the national lung screening trial. JAMA Netw Open 2:e190204, 2019 [DOI] [PMC free article] [PubMed] [Google Scholar]
- 20.Robbins HA, Cheung LC, Chaturvedi AK, et al. : Management of lung cancer screening results based on individual prediction of current and future lung cancer risks. J Thorac Oncol 17:252-263, 2022 [DOI] [PMC free article] [PubMed] [Google Scholar]
- 21.National Lung Screening Trial Research Team, Aberle DR Berg CD et al. : The national lung screening trial: Overview and study design. Radiology 258:243-253, 2011 [DOI] [PMC free article] [PubMed] [Google Scholar]
- 22.Goodfellow I, Bengio Y, Courville A: Deep Learning. Cambridge, MA, MIT Press, 2016 [Google Scholar]
- 23.Md.ai. https://www.md.ai/
- 24.Gao W, Wen CP, Wu A, et al. : Association of computed tomographic screening promotion with lung cancer overdiagnosis among asian women. JAMA Intern Med 182:283-290, 2022 [DOI] [PMC free article] [PubMed] [Google Scholar]
- 25.Bai C, Choi CM, Chu CM, et al. : Evaluation of pulmonary nodules: Clinical practice consensus guidelines for Asia. Chest 150:877-893, 2016 [DOI] [PubMed] [Google Scholar]
- 26.Yang S-C, Lai WW, Lin CC, et al. : Cost-effectiveness of implementing computed tomography screening for lung cancer in Taiwan. Lung Cancer 108:183-191, 2017 [DOI] [PubMed] [Google Scholar]
- 27.Uno H, Cai T, Pencina MJ, et al. : On the C-statistics for evaluating overall adequacy of risk prediction procedures with censored survival data. Stat Med 30:1105-1117, 2011 [DOI] [PMC free article] [PubMed] [Google Scholar]
- 28.Pinsky PF, Gierada DS, Black W, et al. : Performance of lung-RADS in the National Lung Screening Trial: A retrospective assessment. Ann Intern Med 162:485-491, 2015 [DOI] [PMC free article] [PubMed] [Google Scholar]
- 29.McNemar Q: Note on the sampling error of the difference between correlated proportions or percentages. Psychometrika 12:153-157, 1947 [DOI] [PubMed] [Google Scholar]
- 30.Katki HA, Kovalchik SA, Berg CD, et al. : Development and validation of risk models to select ever-smokers for CT lung cancer screening. JAMA 315:2300-2311, 2016 [DOI] [PMC free article] [PubMed] [Google Scholar]
- 31.Huang P, Lin CT, Li Y, et al. : Prediction of lung cancer risk at follow-up screening with low-dose CT: A training and validation study of a deep learning method. Lancet Digital Health 1:e353-e362, 2019 [DOI] [PMC free article] [PubMed] [Google Scholar]
- 32.Detterbeck FC, Boffa DJ, Kim AW, et al. : The eighth edition lung cancer stage classification. Chest 151:193-203, 2017 [DOI] [PubMed] [Google Scholar]
- 33.Scholten ET, Horeweg N, de Koning HJ, et al. : Computed tomographic characteristics of interval and post screen carcinomas in lung cancer screening. Eur Radiol 2525:81-88, 2015 [DOI] [PubMed] [Google Scholar]
- 34.Gierada DS, Pinsky PF, Duan F, et al. : Interval lung cancer after a negative CT screening examination: CT findings and outcomes in National Lung Screening Trial participants. Eur Radiol 27:3249-3256, 2017 [DOI] [PubMed] [Google Scholar]
- 35.Fisch A, Jaakkola T, Barzilay R: Calibrated selective classification. Trans Mach Learn Res 2022. https://openreview.net/pdf?id=zFhNBs8GaV [Google Scholar]
Associated Data
This section collects any data citations, data availability statements, or supplementary materials included in this article.
Data Availability Statement
The data used in this study are public and can be requested at: https://biometry.nci.nih.gov/cdas/learn/nlst/images/. We have made available our data splits, expert radiologist annotations, trained models, and code at https://github.com/reginabarzilaygroup/Sybil.git.


