

Summary
Fibro/adipogenic progenitors (FAPs) are skeletal muscle stromal cells that support regeneration of injured myofibers and their maintenance in healthy muscles. FAPs are related to mesenchymal stem cells (MSCs/MeSCs) found in other adult tissues, but there is poor understanding of the extent of similarity between these cells. Using single-cell RNA sequencing (scRNA-seq) datasets from multiple mouse tissues, we have performed comparative transcriptomic analysis. This identified remarkable transcriptional similarity between FAPs and MeSCs, confirmed the suitability of PDGFRα as a reporter for FAPs, and identified extracellular proteolysis as a new FAP function. Using PDGFRα as a cell surface marker, we isolated FAPs from healthy and dysferlinopathic mouse muscles and performed scRNA-seq analysis. This revealed decreased FAP-mediated Wnt signaling as a potential driver of FAP dysfunction in dysferlinopathic muscles. Analysis of FAPs in dysferlin- and dystrophin-deficient muscles identified a relationship between the nature of muscle pathology and alteration in FAP gene expression.
Subject areas: Stem cells research, Omics, Transcriptomics
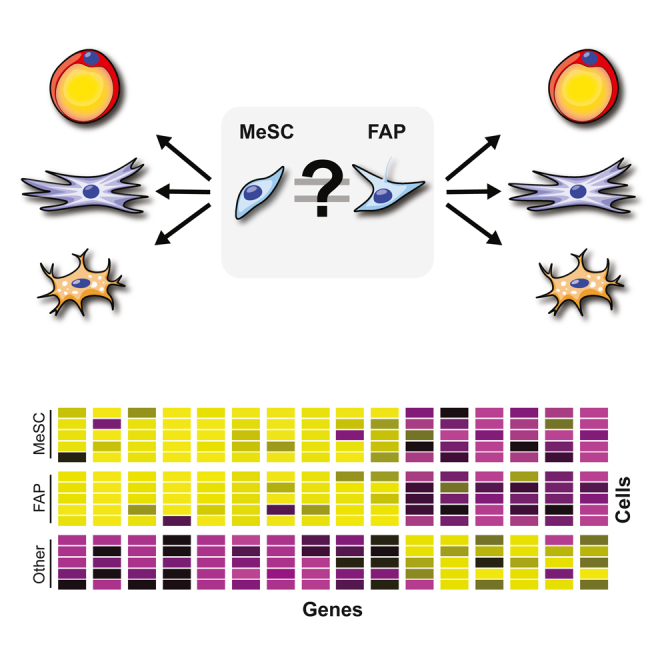
Graphical abstract
Highlights
-
•
Single-cell transcriptomics establish the identity of FAPs as mesenchymal stem cells
-
•
FAP-specific genes include ADAMTS5 and Complement C3 that regulate proteolysis
-
•
FAPs expressing adipogenic regulatory Wnts are enriched in dysferlin-deficient muscles
-
•
Proteolysis-regulatory FAPs accumulate in dysferlin- and dystrophin-deficient muscles
Stem cells research; Omics; Transcriptomics
Introduction
The skeletal muscle is a highly adaptable tissue that can fully regenerate from injury. The muscle regenerates through a complex process that requires muscle stem cells (satellite cells) and its coordinated interaction with other muscle-resident cell types.1,2 Chronic muscle injury in conditions such as muscular dystrophy causes muscles to undergo repeated cycles of regeneration or progressive degeneration leading to fibrofatty replacement of skeletal myofibers.3 Fibro/adipogenic progenitors (FAPs) are the cells responsible for fibrofatty replacement of myofibers in progressive muscle diseases. This is due to the ability of FAPs to undergo differentiation into cells of mesodermal lineage – adipocytes, fibroblasts, chondrocytes, and osteocytes.4,5 FAPs are essential for healthy muscle physiology and their loss impairs muscle homeostasis causing long-term atrophy and diminished regenerative capability of otherwise healthy muscle.6,7
FAPs are at times also referred to as fibroblasts, however, the term “Fibroblast” is often used as an umbrella term to describe a heterogeneous population of cell types that encompasses differentiated cells and adult progenitor cells.8 To avoid semantic confusion, here we use the term ‘myofibroblast’ to denote the differentiated cells generated from an adult progenitor (e.g., FAPs), that produces fibrogenic ECM.9 Differentiated nature of myofibroblasts, and expression of alpha smooth muscle actin (αSMA; Acta2), distinguishes these cells from the progenitors such as FAPs. FAPs share the mesodermal lineage potential of MeSCs present in the adult tissues and express MeSC-enriched markers such as platelet-derived growth factor receptor alpha (PDGFRα) and stem cell antigen 1 (SCA-1/Ly6a).10 However, a direct transcriptomic comparison of FAPs with tissue resident MeSCs or fibroblasts has not been carried out.
Single-cell RNA sequencing (scRNA-seq) is a massively parallel sequencing method that captures the transcriptome of individual cells in a population without the need for enrichment methods based on defined cell-type specific markers. scRNA-seq allows ab initio detection of all the cell subpopulations and heterogeneous cell states. To determine if FAPs are a heterogeneous population of cells requires a single-cell transcriptomic comparison, and examining purified FAPs to see how any of the sub-populations in there differ from each other. Such analyses can offer insights into identity and function of healthy FAPs, and if cell intrinsic or extrinsic changes in dystrophic muscle alter the function of diseased FAPs.
Building on the recent single-cell transcriptomic atlases generated through scRNA-seq analyses of multiple tissues, including skeletal muscle, here we carry out a systematic comparison of the single-cell transcriptome of FAPs and compare it to other MeSCs. Further, by scRNA-seq of FAPs isolated from healthy and diseased mouse muscles, we examine disease-specific differences in FAP gene expression. Through this analysis we assess the transcriptional similarity of FAPs and MeSCs from other tissues, identify FAP markers and functions, and how FAP functions may be dysregulated in muscular dystrophy.
Results
FAPs are distinct from all muscle-resident cells but similar to non-muscle MeSCs
To determine relative similarity of muscle-resident FAPs to other muscle-resident cells or to the MeSCs found in other tissues and organs, we compared two primary scRNA-seq datasets for uninjured healthy mouse muscles – the Tabula Muris dataset from multiple tissues11 and the skeletal muscle cell dataset.12 We carried out (1) a broad analysis of cells from multiple organ tissues and (2) focused analysis of cells from limb muscles (Figures 1A–1D). The multi-organ dataset included 10 tissues known to contain MeSCs/fibroblasts: aorta, bladder, brain, diaphragm, adipose, cardiac, limb muscle, mammary gland, pancreas, and trachea from the Tabula Muris FACS scRNA-seq data. Each of the 10 tissue datasets were first processed individually using the scripts provided in the Tabula Muris github repository using Seurat 213. Then the Seurat 2 objects were exported, individually processed, and integrated in Seurat 3 using the original parameters when permitted (Figure 1A). The limb muscle dataset was integrated in Seurat 313 using two scRNA-seq data published for limb muscle cells (Figures 1B and S1).11,12
Figure 1.

scRNA-seq analysis to identity similarity of FAPs to non-muscle MeSCs and to muscle-resident cells
(A) UMAP from 10 integrated tissue types from the Tabula Muris dataset (FACS scRNA-seq).
(B) UMAP of limb muscle datasets from Tabula Muris (droplet scRNA-seq) and Giordani et al.
(C and D) (C) UMAP of Tabula Muris multi-tissue dataset and D) integrated limb muscle dataset based on known cell-type markers.
(E) Heatmap of top MeSC expressing genes in the multi-tissue Tabula Muris dataset prior to reclustering. The original cluster names with tissue source prefixed are displayed. Abbreviations: lm = limb muscle, art = artery, dia = diaphragm, fat = adipose tissue, mg = mammary gland, panc = pancreas, brain = brain non-myeloid, trach = trachea, and OPC = oligodendrocyte precursor.
(F) Heatmap of top genes expressed in MeSCs/FAPs in the integrated limb muscle dataset.
Employing markers used by the skeletal muscle dataset,12 we defined cell clusters in both the integrated datasets (Figures 1C, 1D, S1, and S2). These included markers for MeSC, endothelial, B-cell, T cell, tenocyte, satellite, macrophage/neutrophil (mac_neut), smooth muscle mesenchymal cells (SMMCs), and glial cells. With our focus on MeSCs in the integrated multi-organ dataset, we chose to define only MeSCs, and while immune and endothelial cell clusters were maintained as independent clusters, all other cell-types were clustered together as “Mixed cell-type” (Figures 1C and S2). To compare the similarity of MeSCs across multiple tissues, we used UMAPs and heatmaps to assess the integrated multi-organ dataset before (Figures S3A and 1E) and after clustering (Figures 1C and S3B). By assessing the data prior to clustering, the original cluster names defined in the individual tissue datasets (as named in Tabula Muris) can be observed (Figures 1E and S3A). For the heatmaps, we obtained the top 50 conserved MeSC markers from the integrated limb muscle dataset and used them to compare the expression of these genes across all mononuclear cells from other tissues and within limb muscles (Figures 1E and 1F). These data show that MeSCs, from the 10 tissues analyzed, all cluster tightly and show a highly similar transcriptional profile that is distinct from all the other mononucleate cells in these datasets (Figures 1C, 1E, and S3). In limb muscles, FAPs formed a distinct group with some transcriptional similarities to the tenocytes and the SMMCs (Figure 1F). These observations identify FAP gene expression profiles that are shared to a greater extent with MeSCs from other tissues than with other potentially related mononuclear cells (including the tenocytes and the SMMCs) present within the skeletal muscle.
Pdgfrα and SCA-1/Ly6a mark overlapping population of FAPs
PDGFRα and SCA-1 are cell surface proteins used to enrich for MeSCs in cellular studies.14 These markers have been used since the initial studies that led to the isolation of FAPs and are still in use interchangeably.4,5 As SCA-1/Ly6a is expressed on multiple cell types,15 FAP enrichment by this marker employs a panel of a negative (TER119/Ly76), CD45/Ptprc, CD31/Pecam1, ITGA7/Itga7) and positive markers (CD34/Cd34 and SCA-1/Ly6a).14 However, it remains unclear if FAP enrichment using the above approaches captures the same group of cells from the muscle and, if so, what is the extent of the similarity in gene expression profiles of these cells. To address this, we devised an in-silico cell sorting strategy using the integrated limb muscle dataset and applying positive or negative expression cut-offs for the various markers. For the SCA-1/Ly6a sort, the cut-off used was the average expression of that gene across all cells in the dataset, as used in Seurat 3 analytical pipeline for the feature plots (Figures 2A and 2B). Of the 2,755 cells in the MeSC cluster, sorting based on SCA-1/Ly6a expression yielded 1,890 cells, and the Pdgfrα sort yielded 1,913 cells, with half (956) of the cells co-expressing both markers (Figures 2A–2C). The results suggest that while transcripts for both markers capture muscle resident MeSCs, they do not mark the same subpopulation of cells in the MeSC cluster. Analysis of these markers at protein level would aid further in establishing this FAP heterogeneity.
Figure 2.

Use of Pdgfra expression to identify FAP-specific gene expression
(A–C) UMAP of in silico sorted FAPs using A) SCA-1/Ly6a/SCA-1 FACS strategy, B) Pdgrfa in silico FACS strategy and C) a combination of both.
(D) Heatmap of the top FAP expressing genes comparing Pdgfra(+), Pdgfra(−) and other cell-types.
(E) Bubble plot of top 20 upregulated biological processes in Pdgfra expressing cells compared to all other mononuclear cell types (GSEA).
(F) Networks of related biological processes up- and downregulated in FAPs generated using Cytoscape/EnrichmentMap.
Pdgfrα is expressed in over 70% of the cells in the MeSC cluster and Pdgfrα is expressed in murine as well as human FAPs. In contrast SCA-1 is not reported in human cells, and is detected in multiple murine stem cells.15 Thus, use of multiple positive and negative labels is needed to isolate SCA-1 positive murine FAPs.16 We made use of Pdgfrα expression to isolate FAPs and examined the scRNA signature of Pdgfrα positive and Pdgfrα negative MeSCs. Using the above top 50 FAP markers, we find that, aside from the difference in Pdgfrα expression, these cells are indistinguishable from each other, but distinct from all the other muscle cells (Figure 2D).
Functional annotation of FAP-enriched genes identifies a novel function
To assess the potential biological functions of FAPs, we used gene set enrichment analysis17 (GSEA) to functionally annotate the conserved FAP-enriched genes.18 Of the top 20 upregulated biological processes enriched in FAPs, many including ECM organization, chondrocyte differentiation, bone morphogenesis, regulation of fat cell differentiation, are all linked to MeSC fates (Figure 2E), which confirms the robustness of our gene set analysis approach. Additionally, we detected four biological processes implicated in protein and peptide hydrolysis (proteolysis and peptidase activities), that have not yet been attributed to FAPs (Figure 2E). Using Cytoscape19 and EnrichmentMap,20 we generated networks for a global view of all the FAP biological processes and their relationships (Figure 2F). This map confirmed processes related to fibrogenesis, osteogenesis, adipogenesis, and to mesenchymal tissue development are enriched in FAPs and identified proteolysis regulation as the second most enriched network (Figure 2F). Of the top 20 biological processes downregulated in FAPs, most were linked to immune related processes (Figure S4). This indicates a seeming division of labor between FAPs, and immune cells that co-exist during muscle repair.
Proteolysis is widely used to regulate intracellular and extracellular signaling by modulating or limiting functions of target proteins. To further investigate its role in FAPs we examined the genes specifically enriched in the proteolysis pathway linked to FAP function. We extracted the leading-edge genes from all the processes in the proteolysis network and filtered them for FAP-specific expression (Figure 3A). We determined genes with the highest and widest expression (>50% of cells) in the MeSCs, but not in other clusters (<30% of cells). This procedure specifically identified Dipeptidase 1 (Dpep1), A disintegrin and metalloproteinase with thrombospondin motifs 5 (Adamts5) and Complement C3 (C3) amongst the FAP-enriched genes. Immunofluorescence analysis of these and a proteolysis unrelated, but FAP-specific gene (Il33),21 in C57BL/6 mouse muscle confirmed localization of C3, ADAMTS5, and IL-33 in FAPs (Figures 3B–3D). This validated our in-silico analysis confirming FAPs as the cells that produce proteases and protease substrates that can regulate inflammation and ECM during myogenesis.22,23
Figure 3.

Validation of FAP-specific markers in WT mouse muscle
(A) Dot plot of FAP-specific markers expressed across all mononuclear cells in limb muscle. The heatmap scale shows increasing expression from gray to blue and increasing percentage of cells expressing the said gene.
(B–D) Confocal images showing immunofluorescence staining of quadricep muscle cross section from 12-month-old WT mouse. Tissue sections were stained for B) IL-33, C) ADAMTS5 and D) C3 all labeled in green and each co-stained with PDGFRα (pink), DAPI (blue), and myofiber boundary was marked with wheat germ agglutinin (WGA) or Laminin (gray). Scale bar = 15 μm.
PDGFRα has been used as a marker to isolate fibroblasts in other tissues and have been analyzed in detail by recent scRNA-seq analyses.24,25 To compare FAPs and fibroblasts marked by Pdgfrα, we examined FAP and fibroblast scRNA-seq datasets. Pdgfrα expression marks distinct populations of fibroblasts termed – universal, specialized, and activated fibroblasts.24 Specialized and activated fibroblasts align with the definition of myofibroblast - a differentiated cell type that is involved in synthesis of the ECM, while “universal fibroblast” represents the multipotent stromal cells. At the molecular level, universal fibroblasts are marked by the genes Dpt, Pi16 and Col15a1. Our muscle scRNA-seq dataset analysis identified these markers to be enriched in the FAPs (Figure S5A). Next, we reversed the analysis and examined the published fibroblast scRNAseq data,24 for genes we found to be enriched in the FAPs - Dpep1, Adamts5, Ace, C3 and Il33. These FAP genes were enriched in the universal fibroblasts and not in the specialized and activated fibroblasts (Figures S5B and S6A). There were fewer myofibroblasts (Acta2 expressing cells) in uninjured wild-type muscle compared to injured and diseased muscle (Figures S6C and S6D). Based on this analysis of scRNA-seq transcriptional profiles, we find the MeSC nature of FAPs aligns with the multipotent nature of the universal fibroblasts, while the specialized nature of tissue specific fibroblasts aligns with the differentiated myofibroblast cells.
scRNA-seq of healthy and diseased FAPs show disease-specific changes
Previously, we described the involvement of FAPs in the dysferlin deficient muscles predisposes them to an adipogenic fate and result in adipogenic degeneration of LGMD2B muscles.26 To explore how FAPs in dysferlinopathic muscles are altered, we used PDGFRα immunolabeling to isolate FAPs from the WT and matched symptomatic dysferlinopathic (BLA/J) mouse muscle and performed scRNA-seq analysis of these FAPs (Figure 4A). We obtained 1913 WT and 1620 BLA/J Pdgfrα+ FAPs after filtering. Using the integrated limb muscle dataset discussed in Figure 1, we combined our WT FAP scRNA-seq data with the MeSC dataset in Figure 2 (Figure S6). This revealed that the transcriptional profile of PDGFRα-expressing WT mouse FAPs that were experimentally isolated matches the in-silico Pdgfrα expressing FAPs (Figure S7A).
Figure 4.

scRNA-seq analysis of FAP-specific changes in dysferlinopathic muscle
(A) Experimental design for isolation and scRNA-seq of FAPs from WT and BLA/J (dysferlin deficient) mice. Mononuclear cells isolated from whole limb muscles from WT and BLA/J mice and enriched for PDGFRα expressing cells by immunostaining and FACS isolation. The cells were barcoded using 10X Genomics Next GEM Single cell 3’ (v3.1) kit and used for next generation sequencing.
(B) UMAP showing the integration of the scRNA-seq for WT and BLA/J FAPs.
(C) UMAP of the integrated FAP data showing the different subcluster of cells: FAPs, endothelial-like, and unknown (NA) cell subcluster.
(D) UMAPs showing the expression pattern of genes representative of the four FAP clusters (Mfap4, Wnt10b, Klf5 and Shisa3). The heatmap scale shows increasing expression from gray to blue.
(E) Top table shows the percentage of total FAP cells in BLA/J and WT FAPs that are expressing FAP specific genes (1–5), FAP cell subcluster specific genes (6–11) and Wnt signaling related genes (12–16). Bottom pairs of UMAP plots show representative increase (Cdh11) and decrease (Wnt2) in percentages of FAPs from WT to BLA/J conditions.
Integrating the single-cell transcriptional profile of FAPs isolated from the WT and BLA/J muscles showed overlapping gene expression profiles (Figure 4B). Using Seurat, these FAPs were resolved into six clusters, of which the first 4 clusters (FAPs_1–4) contain over 93% of FAPs, while the remaining 7% of cells make up the endothelial-like and an undefined cell cluster (Figure 4C). FAP markers identified above (Dpep1, C3, Adamts5, and Il33), were shared by cells in FAPs_1–4 clusters (Figure S7B), with additional genes that are more specific to individual FAP subclusters (Figures 4D and S8A–S8D) and genes that are most enriched in individual subclusters (Figure S8E). We also performed differential gene expression of all WT vs. BLA/J FAPs to examine overall condition-wide expression changes, but found only minor differences (Table S1), FAPs_1 is the largest cell cluster containing ECM structural (e.g., the proteoglycan, Mfap4), and regulatory (e.g., ECM stabilizing enzyme, Lox) genes (Figures 4D and S7A). FAPs_2 is enriched in cells expressing Wnt10b, and Krt80 (Figures 4D and S8B) and FAPs_3 cluster is enriched for Klf5, Cdh11, and Hmcn1 (Figures 4D and S8C). FAPs_4 cluster specifically express Shisa3, Dlk1, and 6030408B16Rik (Figures 4D and S8D). Genes such as Wnt10b, Klf5, Cdh11, Shisa3 and Dlk1 are known to be involved in development and stem cell fate decisions.27,28,29,30,31,32 Since Wnt10b and Shisa3 are part of the Wnt signaling pathway, we looked for other Wnt related genes specific to FAPs and found Wnt2, Wnt5a, Wnt11, Sfrp1, and Sfrp2 in the dataset. Wnt2, Wnt5a and Sfrp1 were enriched in MeSC/FAP cluster in the integrated limb muscle dataset (Figures S9B and S10).
To determine if dysferlin deficient muscle show transcriptional alterations at the level of FAP subclusters, we analyzed the differences in average gene expression and the proportion of FAP cells between conditions (Figure S9A). Both factors would contribute to a net difference in protein expression that may contribute to disease pathogenesis. To this end, we observed little change in the level of expression per subcluster compared to differences in proportion of cells between conditions. Therefore, to analyze the proportion of cells in specific FAP subclusters, we determined the percentage of cells that express the identified FAP cluster-specific genes (raw count >0) (Figures 4E and S9B). There were minimal changes in in the percentage of WT and dysferlinopathic FAPs expressing global FAP markers (Figure 4E, gene# 1–5), confirming the universality of the above genes as markers of FAPs from healthy or diseased muscles. Unlike these genes, we observed that the proportion of FAPs expressing Dlk1, Mfap4, and Cdh11 was increased in dysferlin-deficient muscles, while the proportion of dysferlin deficient FAPs that express Wnt10b, Klf5, and Shisa3 was decreased (Figure 4E, gene# 6–11). As Wnt10b and Shisa3 are part of the Wnt signaling pathway, we analyzed other Wnt-related genes expressed in FAPs. While a decreased proportion of dysferlin-deficient FAPs express Wnt2 and Wnt11, the proportion of dysferlin-deficient FAPs expressing Wnt5a and Wnt antagonists Sfrp1, Sfrp2 was increased (Figure 4E, gene# 12–16). We found that Wnt2, Wnt5a, Wnt10b, and Shisa3 are selectively expressed in FAPs, when compared against all other mononuclear cells in WT limb muscle (Figure S10B). This analysis not only confirms previous reports of involvement of Wnt signaling in FAPs,33 but also suggests altered FAP-mediated Wnt signaling in Dysferlin deficient muscles.
FAP-specific genes show aberrant expression in dysferlin-deficient muscles
Expression of complement C3 is known to contribute to muscle pathology in limb girdle muscular dystrophy 2B mouse model and loss of C3 improves muscle function.22 In the mouse model of DMD (mdx), Il33 and Adamts5 gene expression is increased while their inhibition can ameliorate the disease phenotype in the mice.34,35 Using a combination of qRT-PCR, immunostaining, and RNA fluorescence in situ hybridization (FISH) analysis, we examined if disease severity in the dysferlin-deficient mouse corelates with the levels of FAP gene expression. In agreement with our previous report of disease stage-specific increase in FAP abundance in dysferlinopathic muscle,26 qRT-PCR analysis revealed that, compared to WT (C57BL/6) mice, BLA/J mice at an early symptomatic stage (3-month-old) show increased FAP marker genes namely Pdgfra, Ly6a (SCA-1), C3, Dpep1, and Il33, and this increased further in the advanced disease stage (12-month-old) (Figure 5A).
Figure 5.

Altered expression of FAP-specific genes in LGMD2B mouse model
(A) Quantitative PCR analysis of relative expression of FAP-specific genes in 12-month-old WT and 3-month or 12-month-old BLA/J mouse quadriceps muscles (∗ = p value <0.05). Error bars indicate standard deviation.
(B) Confocal microscope images showing in situ distribution of C3, IL-33, ADAMTS5 and PDGFRα proteins in WT and BLA/J quadricep muscle. Scale bar = 50 μm.
(C) Epifluorescence images showing broader tissue-wide distribution of FAP marker proteins immunostained as in panel B. Scale bar = 100 μm.
(D) Confocal images showing RNA-FISH to detect C3, Il33, Adamts5, Dpep1 and Pdgfra RNAs in WT and BLA/J muscle sections. Scale bar = 15 μm.
To establish a specific FAP origin for the increased abundance of above genes in the dysferlin-deficient muscles, we determined the in situ spatial distribution of the corresponding proteins in the 12-month-old BLA/J and age matched WT muscles. With the availability of validated antibodies for C3, IL-33 and ADAMTS5, we examined their FAP-specific localization using co-labeling with PDGFRα. In WT muscle, PDGFRα expressing cells in the endomysial spaces were co-stained for these markers with the greatest labeling in regions with thick extracellular matrix (ECM) (Figures 5B and 5C). In BLA/J mouse muscle sections, immunolabeling for these proteins was increased, which corresponded to the increased myofiber interstitial spaces occupied by the ECM in these muscle sections (Figures 5B and 5C). These results confirm co-localization of the above proteins with PDGFRα and presence of greater endomysial FAP accumulation in the dystrophic muscles.
While PDGFRα is a membrane-based receptor protein, C3, ADAMTS5, IL-33 and DPEP1 are secreted proteins, hence their localization extends well beyond the cellular boundaries when examined by immunostaining (Figure 5B). To confirm that FAPs are the cellular source for increased expression of these specific proteins, we probed for the cellular localization of their corresponding transcripts using RNA FISH. This identified that all four transcripts analyzed are co-expressed in the WT and BLA/J muscles in Pdgfra expressing FAPs (Figure 5D). These results show that C3, Il33, Dpep1 and Adamts5 transcripts are co-expressed with Pdgfra transcripts within the same cell, confirming that these genes are expressed by both healthy and dystrophic FAPs. Further, BLA/J muscles show increased staining for C3, IL-33 and ADAMTS5 which coupled with our previous report of increased PDGFRα, is strong evidence for aberrant expansion of the FAP population in dystrophic muscle. Overall, these results demonstrate that there is aberrant expression in dysferlin-deficient muscles by showing evidence for: (1) a severity-dependent increase in the expression of C3, IL33, Dpep1 and Adamts5 transcripts in diseased muscle that is attributable to FAPs and, (2) these transcripts co-localize with Pdgfra transcript expression (i.e., FAPs) in both healthy and diseased muscles and, (3) the increased expression of these transcripts is also reflected in increased expression of these proteins.
FAP-specific gene expression during regeneration and associated disease
The altered proportion of FAPs expressing various genes discussed above could be related to muscle damage and ongoing regeneration caused by the dysferlin deficiency. To examine this, we made use of a recent compendium of the various single cell and single nuclear RNA-seq studies of the resting and regenerating muscles.36 First, we recreated plots representing this dataset (Figure 6A). Next, we used this dataset to examine the expression of the FAP-enriched genes discussed above. Pdgfra, Dpep1, C3, Il33, and Adamts5 were all enriched or detected exclusively in the FAPs (Figure 6B). In the regenerating muscles, the proteolysis associated FAP genes including peptidase inhibitor (Pi16), carboxypeptidase (Angiotensin-converting enzyme; Ace), complement C3 (C3), ADAM metallopeptidase with thrombospondin type 1 motif 5 (Adamts5) were still predominant in FAPs, but some changes were seen in other cell types as well (Figures 6B and S11). With the large number of cells included in this compendium, the FAPs could be further divided into 3 subclusters – stem, adipogenic, and pro-remodeling36 (Figure 6A, 6B, S11, and S12). Examination of the Wnt and related genes in this dataset identified that Wnt10b and Wnt2 are present only in stem FAPs, FAP-specific expression of Wnt5a and Wnt11 is limited to pro-remodeling FAPs (Figures 6B, S12B, and S12C). Adipogenic FAPs express Shisa3 and Sfrp2, while Sfrp1, Mfap4, and Cdh11 are expressed in the pro-remodeling FAPs (Figure S12B–S12E).
Figure 6.

Analysis of FAP-specific genes in injured muscle and D2-mdx mouse model of DMD
(A) UMAP of single cell gene expression data from injured muscle obtained from McKellar (2021). The heatmap scale shows increasing expression from gray to blue and increasing percentage of cells expressing the said gene.
(B) Dot-plot of selected FAP specific genes expressed in different cell sub-clusters.
(C–E) Epifluorescence images showing immunostaining for C3, IL-33, ADAMTS5 and PDGFRα in 5-week-old WT (BL10) and DMD (D2-mdx) quadricep muscle cross-section. Tissue sections were each co-stained with PDGFRα (pink), DAPI (blue), and myofiber boundary was marked with wheat germ agglutinin (WGA) or Laminin (gray). Scale bar = 100 μm.
Use of the mdx mouse model of Duchenne muscular dystrophy (DMD) has identified therapeutic potential of targeting aberrant FAP expansion and activity to promote muscle regeneration.36,37 We have also reported aberrant FAP expansion in sites of failed regeneration in a severe mouse model of DMD (D2-mdx).38 We therefore examined the expression of the above FAP-specific genes in a severe mdx mouse model (D2-mdx). In contrast to the BLA/J model in which FAPs undergo an adipogenic differentiation and produce fibrofatty tissues by 6–12 months of age,26 the D2-mdx model shows fibrotic and calcified replacement by FAPs within the first month of their life.38 Immunostaining for C3, ADAMTS5 and IL-33 in 5-week-old WT and D2-mdx show co-localization of these proteins with PDGFRα (Figures 6C–6E). In the D2-mdx, there is robust expression of PDGFRα and increased level of all three proteins in the calcified and interstitial spaces. Together, above results show muscle injury alters FAPs with increased levels of proteolysis regulatory proteins. Impact of these effects are subject to FAP specific changes in the BLA/J and D2-mdx mouse model, which lead to greater fibro-adipogenesis and fibro-osteogenesis respectively (Figure S13).
Discussion
FAPs are increasingly recognized as important cellular components of skeletal muscle, however, their relationship to other mesenchymal pluripotent cells has been incompletely characterized. Our analysis of scRNA-seq data reveals that FAPs share greater transcriptional similarity to non-muscle MeSCs than to other skeletal muscle-resident cells. It also shows that the PDGFRα and SCA-1 markers used for isolation of murine FAPs label FAP sub-populations with slight heterogeneity between them at the transcriptional level. But in contrast to SCA-1, PDGFRα can be used as a single label that is also expressed in human FAPs, these feature makes PDGFRα a more simple and suitable general marker to isolate FAPs. However, existence and characterization of similar FAP sub-populations in human muscle remains to be fully explored. Of the various pathways associated with FAPs, our analysis identified proteolytic regulation as a newly recognized FAP feature. Finally, analysis of FAPs isolated from WT and dysferlinopathic muscle identified changes in the proportion of the FAP subpopulations. These FAPs cause altered expression of genes including Il33, C3, Adamts5, and Dpep1 that regulate ECM signaling and proteolysis.
Extracellular proteolysis plays important roles in muscle regeneration, cell differentiation, ECM remodeling, immune cell recruitment and inflammation.39 We find expression of several FAP-enriched proteolysis regulatory proteins, including ADAMTS5, C3, and DPEP1 are increased in two different muscular dystrophy mouse models - dysferlinopathy (BLA/J) and DMD (D2-mdx). ADAMTS5 is a secreted chondroitin sulfate proteoglycanase that is known to be elevated in mdx muscle,34 as well as in the serum of human DMD patient serum and in the serum of exercised mdx mice.40,41 Secreted ADAMTS5 cleaves proteoglycans such as versican, which in turn can regulate myogenesis in vitro and in vivo.42,43,44,45 Like ADAMTS5, an upregulated canonical complement pathway has also been linked to DMD and dysferlinopathy while various complement inhibition strategies show benefits in both preclinical models.22,46 Unlike mdx mice, where the target is the final complement C5a, the central component of the complement cascade, C3 is implicated in LGMD2B such that C3 knockout improves function of the dysferlinopathic muscle.22 We suggest that the membrane-bound glycoprotein dipeptidase 1 (DPEP1), which also facilitates neutrophil recruitment in lung and liver,47 may play a similar role in injured muscles by facilitating FAP-regulated recruiting of neutrophils in injured muscles. Il33 the other gene identified to be FAP-specific, recruits regulatory T-cells to enhance muscle repair.21 The FAP-specificity of Il33 was recently validated by another study that showed FAPs secrete IL-33 and regulate expansion of muscle ILC2s, which promote expression of fibrotic genes in muscles, shifting the balance between regenerative versus fibrotic fate of mdx muscles.35 Further, inhibition of ADAMTS5 activity in the DMD mouse model improves muscle function.34 These demonstrate disease relevance of the FAP-enriched genes identified by our analysis.
With the interchangeable use in the literature of PDGFRα and SCA-1 as markers to isolate FAPs from mouse muscle, we directly compared these approaches by in silico FACS strategy. Despite use of multiple markers for the SCA-1 sort strategy, use of PDGFRα positivity was a much simpler approach to execute, it enriched for cells with a similar population size, and there was minimal differences between FAPs enriched by these approaches. Due to the effective PDGFRα-based sort and the benefit of being a marker expressed in human FAPs, presence of PDGFRα is well-suited for FAP isolation.
Comparison of single-cell transcriptome of FAPs with MeSCs from 10 other tissues showed FAPs are distinct from all other muscle resident cell types but are highly similar to the MeSC populations across the body. The transcriptional differences that are found between FAPs and MeSCs likely reflect their tissue specific specialization. Indeed, within muscles, FAPs isolated even from healthy and dysferlinopathic muscle did not show substantial gene expression differences. Instead, we found shifts in the proportion of FAP subpopulations expressing the Notch and Wnt related genes between diseased and WT muscle. These pathways are cell-extrinsic regulators of adipogenesis and myogenesis and downregulation of Wnt signaling is known to favor adipogenic fate.28,29,33 Specifically, we find Wnt10b is expressed by fewer dysferlin deficient FAPs and in accord with FAP-mediated adipogenic degeneration of dysferlinopathic muscle, reduced Wnt10b expression is also correlated with increased adipogenesis during rotator cuff injury.48 Along the same lines, soluble frizzled-related protein (SFRP) acts by inhibiting the Wnt signaling pathway and thereby promoting adipogenesis, and we find proportion of Sfrp1 and Sfrp2 expressing FAPs is increased in dysferlinopathic mice, suggesting their contribution to increased adipogenesis in dysferlin deficient mice.
Preadipocyte factor 1 (PREF-1/Dlk1) also negatively regulates adipogenesis.31,49,50 Concomitantly, we find fewer dysferlinopathic FAPs express Dlk1 (Figures S8 and 4E). Kruppel like factor 5 (Klf5) is another gene that is unrelated to Wnt pathway, is enriched in FAPs and regulates lipid metabolism in skeletal muscle.51 Fewer dysferlinopathic FAPs express Klf5, implicating this in dysferlinopathic FAP adipogenesis. These results suggest that altered expression of multiple FAP genes that typically suppress adipogenic differentiation are downregulated in dysferlinopathy muscle to then promote adipogenic replacement of these muscles.
In summary, our study has generated a resource that characterizes the transcriptomic identity of FAPs and MeSCs. It establishes the similarity of the FAPs obtained by Pdgfra and SCA-1 sorted strategies, implicating FAPs in regulating muscle physiology by way of extracellular proteolytic signaling. It shows disease-specific regulation of FAP gene expression that predisposes these cells to cause fibro-adipogenic muscle degeneration. Future studies involving use of scATAC-seq and other such analysis of these progenitor population is needed to gain insights into the mutual interaction of the FAPs and the muscle tissue environment in FAP-mediated control of muscle health.
Limitations of the study
The skeletal muscle connective tissue cells are interchangeably referred to by multiple names, including fibroblasts, mesenchymal stem cells, and fibro-adipogenic progenitors. The use of these diverse terminologies is a source of confusion in the field as specific functional roles are attributed to each of these cell types. Comparing the single-cell transcriptional identity of the muscle connective tissue cells that our study offers will help reduce this confusion. However, no unique genes or proteins that distinguish these cell types were identified, suggesting that the confusion in the field may be a semantic and cannot be resolved by molecular analysis. Further efforts by the scientific community are needed to address this semantic issue in our collective pursuit to resolve this matter. Another limitation is that while this study found that fibro-adipogenic progenitors from different chronic muscular dystrophy models are distinct from one another, a lack of comparative single-cell transcriptomic analysis of cells from both models prevented a systematic transcriptomic comparison. Performing such analyses would be informative in understanding how these cells sense and function differently in various pathogenic muscle environments, ultimately leading to distinct muscle pathology.
STAR★Methods
Key resources table
| REAGENT or RESOURCE | SOURCE | IDENTIFIER |
|---|---|---|
| Experimental models: Organisms/strains | ||
| BLA/J | The Jackson Labs | RRID:IMSR_JAX:012767 |
| C57BL/6J | The Jackson Labs | RRID:IMSR_JAX:000664 |
| D2-mdx | The Jackson Labs | RRID:IMSR_JAX:013141 |
| C57BL/10J | The Jackson Labs | RRID:IMSR_JAX:000665 |
| Antibodies | ||
| PDGFRα - Rabbit anti-mouse (1:250) | Cell Signaling | RRID:AB_2162345; 3174S (D1E1E) |
| PDGFRα - Goat anti-mouse (1:50) | RND Systems | RRID:AB_2236897; AF1062 |
| PDGFRα-APC | BioLegend | RRID:AB_2043970; 135908 |
| ADAMTS5 - Rabbit anti-mouse (1:100) | Abcam | RRID:AB_2222327; AB41037 |
| DPEP1 - Rabbit anti-human/mouse (1:100) | Abcam | RRID:AB_11133237; AB121308 |
| C3 - Rat anti-mouse (1:250) | Novus Biologicals | NB200-540 |
| IL-33 – Rat anti-mouse (1:250) | RND Systems | MAB3626 |
| Alexa Fluor 488 - Chicken anti-rabbit (1:500) | Thermo Fisher | RRID:AB_2535859; A-21441 |
| Alexa Fluor 594 - Goat anti-rabbit (1:500) | Thermo Fisher | AB_2534079: A-11012 |
| Alexa Fluor 594 - Chicken anti-goat (1:500) | Thermo Fisher | AB_2535871; A-21468 |
| Alexa Fluor 647 - Chicken anti-rabbit (1:500) | Thermo Fisher | AB_2535861; A-21443 |
| Critical commercial assays | ||
| RNAscope Multiplex Fluorescent Reagent Kit V2 | Acdbio | 323100 |
| TaqMan Fast Advanced Master Mix | ThermoFisher | 4444557 |
| Chromium Next GEM Single Cell 3' GEM, Library & Gel Bead Kit v3.1, 4 rxns | 10X Genomics | 1000128 |
| Chromium Next GEM Chip G Single cell kit, 16 rxns | 10X Genomics | 1000127 |
| Single Index Kit T Set A, 96 rxns | 10X Genomics | 1000213 |
| Chemicals, peptides, and recombinant proteins | ||
| Pdgfra | Acdbio | 480661-C2 |
| Dpep1 | Acdbio | 480831-C3 |
| C3 | Acdbio | 417841-C3 |
| Il33 | Acdbio | 400591-C3 |
| Adamts5 | Acdbio | 427621 |
| Opal 690 (1:750) | Akoya Biosciences | FP1497001KT |
| Opal 570 (1:750) | Akoya Biosciences | FP1488001KT |
| Opal 520 (1:750) | Akoya Biosciences | FP1487001KT |
| SuperScript IV VILO Master Mix | Thermo Fisher | 11756050 |
| C3 - Mm01232779_m1 (FAM-MGB) | Thermo Fisher | 4331182 |
| Cd248 - Mm00547485_s1 (FAM-MGB) | Thermo Fisher | 4331182 |
| Dpep1 - Mm00514592_m1 (FAM-MGB) | Thermo Fisher | 4331182 |
| Hprt1 (control) - Mm00446968_m1 (VIC-MGB) | Thermo Fisher | 4448490 |
| Il33 - Mm00505403_m1 (FAM-MGB) | Thermo Fisher | 4331182 |
| Ly6a (SCA-1) - Mm04337234_m1 (FAM-MGB) | Thermo Fisher | 4331182 |
| Pdgfra - Mm00440701_m1 (FAM-MGB) | Thermo Fisher | 4331182 |
| Collagenase II (2.5U/mL) | Thermo Fisher | 17101015 |
| Collagenase D (1.5U/mL) | Sigma Aldrich | COLLD-RO |
| Dispase II (2.4U/mL) | Sigma Aldrich | D4693 |
| High Sensitivity DNA Kit (D5000) | Agilent | 5067-4626 |
| Qubit dsDNA HS Assay Kit | Thermo Fisher | Q328541 |
| TURBO DNAse | Thermo Fisher | AM2238 |
| ProLong™ Gold Antifade Mountant with DNA Stains DAPI | Thermo Fisher | P36935 |
| Wheatgerm Agglutinin (1:1000) | Thermo Fisher | W6748 |
| 7AAD (1:200) | BioLegend | 420404 |
| Deposited data | ||
| scRNA-seq data of WT and BLA/J FAPs generated for this manuscript (FASTQ & MTX files) | This manuscript | GEO: |
| Scripts and Seurat objects (“faps_mesc_analysis.zip”) | This manuscript | https://doi.org/10.5281/zenodo.8102775 |
| Tabula Muris single cell RNA-seq data set (20 tissues including limb muscle) | Tabula Muris consortium | tabula-muris.ds.czbiohub.org/ |
| Giordani et al mouse limb muscle scRNA-seq data set | Giordani et al.12 | GEO:GSE110878 |
| “scMuscle_mm10_slim_v1-1.RData” integrated mouse skeletal muscle sc/snRNA-seq data set | McKellar et al.36 | github.com/mckellardw/scMuscle |
| “Mouse_SS_Fibro.RDS”, steady state mouse fibroblast dataset | Buechler et al.24 | Fibroxplorer.com |
| Software and algorithms | ||
| CellSens Software (v3.1.1) | Olympus | olympus-lifescience.com/en/software/cellsens/ |
| FIJI/ImageJ (v2.1.0/1.53c) | FIJI Team | fiji.sc |
| Prism 9.3.1 | Graphpad | graphpad.com/scientific-software/prism |
| Cell Ranger 3.0.0 | 10X Genomics | support.10xgenomics.com/single-cell-gene-expression/software/overview/welcome |
| GSEA | Subramanian et al.17 | gsea-msigdb.org |
| Cytoscape | Shannon et al.19 | cytoscape.org |
| EnrichmentMap pipeline collection (EnrichmentMap, AutoAnnotate, WordCloud, clusterMaker2) | Reimand et al.18 | apps.cytoscape.org/apps/enrichmentmappipelinecollection |
| R Programming Language | The R Foundation | r-project.org |
| Seurat (version 2-4, see scripts) | Satija Lab52,53,54 | satijalab.org/seurat |
| data.table | Dowle and Srinivasan55 | github.com/Rdatatable/data.table |
| ggplot2 | Wickham H56 | ggplot2.tidyverse.org/ |
| reshape2 | Wickham H56 | github.com/hadley/reshape |
| Dplyr | Wickham et al.57 | dplyr.tidyverse.org |
| Tibble | Muller and Wickham58 | tibble.tidyverse.org |
| Plyr | Wickham H56 | plyr.had.co.nz/ |
| harmony | Korsunsky et al.59 | |
| RColorBrewer | Brewer, CA | ColorBrewer.org |
| patchwork | Pedersen, TL | github.com/thomasp85/patchwork/ |
| DropletUtils | Marioni Lab | github.com/MarioniLab/DropletUtils/ |
| sctransform | Hafemeister et al.60 | github.com/satijalab/sctransform |
| cluster | Maechler et al.61 | CRAN.R-project.org/package=cluster |
| Pheatmap | Kolde et al.62 | github.com/raivokolde/pheatmap |
| cowplot | Wilke Lab | wilkelab.org/cowplot/ |
Resource availability
Lead contact
Further information and requests for resources should be directed to the lead contact, Jyoti Jaiswal (jkjaiswal@cnmc.org).
Materials availability
This study did not produce any new unique reagents or mouse lines. All materials used can be obtained using the information in the key resources table. Further information and requests for resources and reagents should be directed to and will be fulfilled by the lead contact.
Experimental model and study participant details
Animals
BLA/J and C57BL/6J female mice aged 3, 8 and 12 months old were used in the study. Female mice were preferred for their earlier onset of disease and more severe lipid phenotype (BLA/J). Ages were used for pre-symptomatic (3 mo), mild (8 mo) and severe (12 mo) phenotype. C57BL/6J were used for WT age and gender matched controls of the same background. D2-mdx and C57BL/10J males aged, 38 days old were used primarily for IHC validation studies. The D2-mdx were to represent severe calcification of muscle during disease and C57BL/10J as WT controls. All animals were housed under a 12-hour light/dark cycle with food and water ad libitum. All procedures were approved by the Institutional Animal Care and Use Committee (IACUC) and the National Institutes of Health (NIH) Guide for the Care and Use of Laboratory Animals.
Method details
Processing public scRNA-seq datasets
Tabula muris FACs and droplet datasets
Followed instructions provided at the Tabula muris github repository to process the data. We reproduced their analysis using their original scripts in Seurat v2.3.413. Their scripts and supplementary data contain the gene markers and parameters used to define each cluster for each tissue. FACs data from aorta, bladder, brain, diaphragm, fat, heart, limb muscle, mammary gland, pancreas and trachea were processed for MeSC comparisons. Next, the Seurat 2 objects from the FACs and droplet data sets were exported and converted into Seurat v3.1.053 objects using `UpdateSeuratObject()` method for further analysis.
Limb muscle droplet dataset
The two filtered matrix files from Giordani et al was downloaded from GEO and processed using Seurat v3.1.0. We used the author’s gene markers and parameters from their supplementary data to reproduce their data in v3.1.0. Next, the limb muscle droplet data for the Tabula Muris dataset was processed and converted to Seurat 3 objects as described above and integrated with the Giordani et al dataset for limb muscle analyses.
Large-scale muscle injury dataset
The harmonized mouse single cell dataset (“scMuscle_mm10_slim_v1-1.RData”) from McKellar et al36 was downloaded and analyzed in Seurat 4.3.054. A FAP subset of the full dataset was produced based on the author’s cell type annotations. Only the most densely populated injury timepoints were subsetted (day 0, 2, 5, and 7) extracted for analysis.
Steady state fibroblast dataset. The fully processed mouse steady state fibroblast Seurat object (“Mouse_SS_Fibro.RDS”) from Buechler et al.24 was also downloaded an analyzed using Seurat 4.3.054. Please refer to the R scripts uploaded to the Zenodo repository for more analysis details.
Bioinformatic “FACS” enrichment strategy
For the Sca-1 sort, the cut-offs used were the average expression of each gene across all cells in the data set, which is similar to Seurat 3 calculates their feature plots (Figure 2A): RNA_Ptprc <= 0.3839, RNA_Pecam1 <= 0.6566, Itga7 <= 0.054875, Cd34 >= 0.55517 and Ly6a >= 1.2019. Ly76 was omitted because it was not uniformly detected in the dataset. For the PDGFRα sort strategy, we used the cut off for Pdgfra >= 0.11299. The combined strategy uses the SCA-1 sort in addition to Pdgfra. Please refer to the R script for more details.
Functional annotation of FAP enriched genes from limb muscle dataset
Functional annotation of FAP enriched genes
FAPs were compared to all other limb muscle mononuclear cells in the dataset to determine differentially expressed genes using the `FindConservedMarkers()` method and exported. Functional annotation was performed following Reimand et al.18 with some modifications due to software updates. Briefly, FAP conserved markers (gene symbol, log2 Fold change) were imported into GSEA as a `.rnk` file for functional annotation. Parameters used in the processing are described in the publication, except the gene set database (`h.all.v7.4.symbols.gmt`) and the chip platform used ( `Mouse_Gene_Symbol_Remapping_to_Human_Orthologs_MSigDB.v7.1.chip`. Enriched biological processes were visualized using Cytoscape and EnrichmentMap. Please see supplemental data for the cytoscape file and detailed workflow (“faps_vs_other_gsea_analysis.cys” and “FAP_pathway_analysis_workflow.pdf”). Leading edge gene lists from each biological process (node) in the proteolysis regulation network were exported from Cytoscape and imported into R.
Finding FAP enriched gene candidates
All leading-edge gene lists were combined into a unique set, then sorted for specificity and expression in FAPs. Filter criteria for FAP enriched genes include > 50% expression in MeSC and >=2.5 scaled average expression, < 30% expression in tenocytes, < 10% expression in endothelial cells, < 10% expression in satellite cells, and less than 15% expression in macrophages/neutrophils.
Quantitative RT-PCR
Total RNA was isolated from fifty 10um cryosections of snap frozen quadricep muscles of female 3- and 12-month-old BLA/J mice and 12-month-old WT C57BL/6 mice using TRIzol reagent (n=3 per group). RNA was treated with TURBO DNAse. First strand cDNA was generated using 500 ng of total RNA from each sample and SuperScript IV VILO Master Mix. The qPCR assay was performed on the QuantStudio 7 (Applied Biosystems) using the TaqMan Fast Advanced Master Mix and gene expression assays for C3, Ly6a (SCA-1), Il33, Cd248, Dpep1, Pdgfra and Hprt (see key resources table).
Immunohistochemistry and RNA FISH
Immunohistochemistry
Snap frozen quadricep muscles from 12-month-old BLA/J and WT C57BL/6 mice were cut into 10um sections and mounted on slides. Tissues were airdried at room temperature (RT) for 10 minutes, fixed with 4% PFA (in 1xPBS) for 2 minutes, and rinsed with 1x PBS-0.1% Tween (PBS-T) 3 times. Tissues were blocked using 5% BSA in PBS-T (blocking buffer) for 1 hour at RT. Antibodies were diluted according to concentrations listed in the key resources table in blocking buffer, added to slides and incubated in a humidified chamber at 4°C overnight. Next day, washed 3 times with PBS-T. Secondary antibodies were diluted according to the the key resources table in blocking buffer, added to the slides and incubated for 2 hours at RT. Afterwards, wheat germ agglutinin was added and incubated for 10 minutes (1:500) and washed off 3 times with PBS-T. Slides were mounted using Prolong Gold with DAPI for imaging. Multiple sections and >10 images of each quadricep muscle were analyzed for each protein or protein combinations studied. A negative control slide (no primary antibody) for each condition was used for determining thresholds for fluorescence background.
RNA FISH
Snap frozen muscles from 13-month-old BLA/J and WT C57BL/6 mice were cut into 8 um sections and mounted on slides. RNAscope was performed using the RNAscope Multiplex Fluorescent Reagent Kit V2 following the manufacturer’s protocol (323100-USM/Rev Date: 02272019) with specific optimizations: muscle sections were fixed using 4% PFA in 1xPBS; digested using Protease IV for 15 minutes at RT; and Opal dye concentrations were adjusted to 1:750 in TSA buffer. The probes used were mouse Pdgfra as the experimental control and C3, Adamts5, Dpep1, and IL-33 as targets (key resources table). Multiple sections and >10 images of each quadricep muscle were analyzed for each of the marker or marker combinations studied. A negative control slide (no probes, mix of opal dyes only) for each condition was used for determining thresholds for fluorescence background.
Microscopy and image processing. Microscopy images were taken using a 40X air objective on the on the Olympus VS-120 and/or the Leica SP8 confocal microscope at 63X oil objective with 8-10 z-stacks at 1 um steps. Eight images of different regions of each quadricep muscle were captured per antibody or probe combination used. Images taken on the VS-120 were processed using CellSens software. Images taken on the Leica confocal were processed in FIJI/ImageJ. Maximum projection and denoising were used to process the RNAscope images.
FACs enrichment of PDGFRα+ FAPs from limb muscle for scRNA-seq
FAPs were isolated from hindlimb muscles of 8Mo B6A/J and WT female mice in a modified protocol from our previous publication.26 Mice were euthanized and the tibialis anterior, extensor digitorum longus, gastrocnemius, soleus, quadriceps, and psoas were immediately dissected. Non-muscle tissue including tendon, nerve and overlying fascia were carefully removed, and muscles were minced finely in a sterile dish and incubated in Collagenase II (2.5U/mL) in PBS for 30 minutes at 37°C. The resulting slurry was washed with sterile PBS before further digest in Collagenase D (1.5U/mL) and Dispase II (2.4U/mL) in PBS for 60 minutes at 37°C. Resulting slurries were passed through 100 μm and 40 μm strainers and primary cells were resuspended in 1 mL PBS with 2% FBS and 2nM EDTA.
The suspensions were subsequently stained with anti-PDGFRα-APC (1.0 μg per 106 cells in 100 μL) for flow cytometry. Immediately prior to FACS, cells were stained with 7AAD viability staining solution (1:200 dilution). Cell suspensions were then sorted on a BD Influx cell sorter; live cells were enriched by gating based on forward and side scatter, and doublets were excluded using trigger pulse width gating. We gated out 7AAD+ cells to further increase sample viability, before purified PDGFRα+ FAPs were collected for single cell sequencing.
Single-cell library preparation and sequencing
Single-cell RNA-seq libraries were generated using the Chromium Next GEM Single Cell v 3.1 (10X Genomics, US). Single-cell suspensions were diluted to a density of 1000 cells/μL in 1x PBS with 0.04% BSA and added to the real-time polymerase chain reaction (RT-PCR) master mix to target ∼8000 cells. The mix was loaded together with Single Cell v3.1 gel beads and partitioning oil into a Next GEM Chip G according to the manufacturer’s instructions. The cDNA molecules were amplified, dual indexed and pooled, and followed by library construction according to the manufacturer’s (10x genomics, US) instructions. Sequencing libraries were quantified by Qubit dsDNA High sensitivity kit and the size profiles of the pre-amplified cDNA and libraries were determined using the Agilent High Sensitivity D5000 ScreenTape. All single-cell libraries were sequenced with a customized paired-end format with dual indexing (28/10/90-bp for v3.1libraries) as recommended by 10X Genomics. These libraries were sequenced on a Novaseq 6000 system using the S1 flow cell (Illumina, US).
Single cell RNA-seq data processing
The Illumina sequenced single cell libraries were processed using 10x Genomics Cell Ranger 3.0.047. Briefly, the raw base call files generated by the sequencer, were demultiplexed into fastq files by the cellranger mkfastq function. Next, the function cellranger count was used to align the fastq to the pre-built cell-ranger mouse reference (refdata-cellranger-mm10-3.0.0), filter the UMI barcodes and estimate the counts. The output for this step is the feature count matrix, which is provided as an input to Seurat, for further downstream processing.
Quantification and statistical analysis
The qRT-PCR analysis (Figure 5A) compared the expression of various genes in the quadriceps of 3- and 12-month-old BLA/J mice to 12-month-old WT C57BL/6 mice (n=3 per group). The expression data was analyzed using a two-way ANOVA statistical test followed by a posthoc Tukey multiple-test comparison. All error bars shown are of the calculated standard deviation and the significance was defined by p-value < 0.05. The statistical tests were performed using GraphPad PRISM v9.3.1.
Acknowledgments
P.U. acknowledges the T32 postdoctoral fellowship award (NIAMS grant T32AR056993). J.K.J. acknowledges research support by NIAMS (grant R01AR055686), Jain Foundation, and support by NICHD (grant P50HD105328) for microscopy and genomics cores; M.W.H. acknowledges research support by NIAMS (K01AR077686); C.G.B. and P.U. acknowledge support by NIH intramural program. This work utilized the computational resources of the NIH HPC Biowulf cluster (http://hpc.nih.gov). Authors acknowledge feedback by the lab members, especially by Fady Guirguis in preparing this manuscript.
Author contributions
M.H. and J.K.J. conceived the study and designed experiments together with P.U. P.U. conducted bioinformatic analysis with help from S.B., and conducted experiments with help from M.H. and K.P. for single cell data acquisition, and from M.H. and D.A.G. for data validation as well as studies in disease models. J.K.J. and C.G.B. acquired funding, provided supervision, and co-wrote the manuscript with P.U. and M.H. All authors read and approved the final manuscript.
Declaration of interests
No conflicts of interests to declare.
Published: July 23, 2023
Footnotes
Supplemental information can be found online at https://doi.org/10.1016/j.isci.2023.107479.
Contributor Information
Carsten G. Bönnemann, Email: carsten.bonnemann@nih.gov.
Jyoti K. Jaiswal, Email: jkjaiswal@cnmc.org.
Supplemental information
Data and code availability
Data: Raw FASTQ and processed matrix files for the FAP scRNA-seq data of BLA/J vs. WT mouse muscle generated in by this study have been deposited to NCBI databases. All accession numbers including publicly available data used in this study (Giordani et al.12; Tabula Muris,11 Buechler et al.,24 McKellar et al.36) can be found in the key resources table. All fully processed seurat (.rds) objects can be accessed at Zenodo (DOI is listed in the key resources table).
Code: All original code has been deposited to the same Zenodo repository and is publicly available as of the date of publication. The DOI is listed in the key resources table. R scripts were written using different versions of Seurat to keep up with new features and bug fixes. The versions of each individual R library associated with the Seurat version / environment can be found in the `sessionInfo()` output at the bottom of each script.
Any additional information related to the data in this paper is available from the lead contact upon request.
References
- 1.Lepper C., Partridge T.A., Fan C.-M. An absolute requirement for Pax7-positive satellite cells in acute injury-induced skeletal muscle regeneration. Development. 2011;138:3639–3646. doi: 10.1242/dev.067595. [DOI] [PMC free article] [PubMed] [Google Scholar]
- 2.Wosczyna M.N., Rando T.A. A Muscle Stem Cell Support Group: Coordinated Cellular Responses in Muscle Regeneration. Dev. Cell. 2018;46:135–143. doi: 10.1016/j.devcel.2018.06.018. [DOI] [PMC free article] [PubMed] [Google Scholar]
- 3.Morgan J., Partridge T. Skeletal muscle in health and disease. Dis. Model. Mech. 2020;13 doi: 10.1242/dmm.042192. [DOI] [PMC free article] [PubMed] [Google Scholar]
- 4.Joe A.W.B., Yi L., Natarajan A., Le Grand F., So L., Wang J., Rudnicki M.A., Rossi F.M.V. Muscle injury activates resident fibro/adipogenic progenitors that facilitate myogenesis. Nat. Cell Biol. 2010;12:153–163. doi: 10.1038/ncb2015. [DOI] [PMC free article] [PubMed] [Google Scholar]
- 5.Uezumi A., Fukada S.i., Yamamoto N., Takeda S., Tsuchida K. Mesenchymal progenitors distinct from satellite cells contribute to ectopic fat cell formation in skeletal muscle. Nat. Cell Biol. 2010;12:143–152. doi: 10.1038/ncb2014. [DOI] [PubMed] [Google Scholar]
- 6.Hogarth M.W., Uapinyoying P., Mázala D.A.G., Jaiswal J.K. Pathogenic role and therapeutic potential of fibro-adipogenic progenitors in muscle disease. Trends Mol. Med. 2022;28:8–11. doi: 10.1016/j.molmed.2021.10.003. [DOI] [PMC free article] [PubMed] [Google Scholar]
- 7.Wosczyna M.N., Konishi C.T., Perez Carbajal E.E., Wang T.T., Walsh R.A., Gan Q., Wagner M.W., Rando T.A. Mesenchymal Stromal Cells Are Required for Regeneration and Homeostatic Maintenance of Skeletal Muscle. Cell Rep. 2019;27:2029–2035.e5. doi: 10.1016/j.celrep.2019.04.074. [DOI] [PMC free article] [PubMed] [Google Scholar]
- 8.Plikus M.V., Wang X., Sinha S., Forte E., Thompson S.M., Herzog E.L., Driskell R.R., Rosenthal N., Biernaskie J., Horsley V. Fibroblasts: Origins, definitions, and functions in health and disease. Cell. 2021;184:3852–3872. doi: 10.1016/j.cell.2021.06.024. [DOI] [PMC free article] [PubMed] [Google Scholar]
- 9.Contreras O., Cruz-Soca M., Theret M., Soliman H., Tung L.W., Groppa E., Rossi F.M., Brandan E. The cross-talk between TGF-β and PDGFRα signaling pathways regulates stromal fibro/adipogenic progenitors’ fate. J. Cell Sci. 2019;132 doi: 10.1242/jcs.232157. [DOI] [PubMed] [Google Scholar]
- 10.Morikawa S., Mabuchi Y., Niibe K., Suzuki S., Nagoshi N., Sunabori T., Shimmura S., Nagai Y., Nakagawa T., Okano H., Matsuzaki Y. Development of mesenchymal stem cells partially originate from the neural crest. Biochem. Biophys. Res. Commun. 2009;379:1114–1119. doi: 10.1016/j.bbrc.2009.01.031. [DOI] [PubMed] [Google Scholar]
- 11.Tabula Muris Consortium. Overall coordination. Logistical coordination. Organ collection and processing. Library preparation and sequencing. Computational data analysis. Cell type annotation. Writing group. Supplemental text writing group. Principal investigators Single-cell transcriptomics of 20 mouse organs creates a Tabula Muris. Nature. 2018;562:367–372. doi: 10.1038/s41586-018-0590-4. [DOI] [PMC free article] [PubMed] [Google Scholar]
- 12.Giordani L., He G.J., Negroni E., Sakai H., Law J.Y.C., Siu M.M., Wan R., Corneau A., Tajbakhsh S., Cheung T.H., Le Grand F. High-Dimensional Single-Cell Cartography Reveals Novel Skeletal Muscle-Resident Cell Populations. Mol. Cell. 2019;74:609–621.e6. doi: 10.1016/j.molcel.2019.02.026. [DOI] [PubMed] [Google Scholar]
- 13.Stuart T., Butler A., Hoffman P., Hafemeister C., Papalexi E., Mauck W.M., Hao Y., Stoeckius M., Smibert P., Satija R. Comprehensive Integration of Single-Cell Data. Cell. 2019;177:1888–1902.e21. doi: 10.1016/j.cell.2019.05.031. [DOI] [PMC free article] [PubMed] [Google Scholar]
- 14.Houlihan D.D., Mabuchi Y., Morikawa S., Niibe K., Araki D., Suzuki S., Okano H., Matsuzaki Y. Isolation of mouse mesenchymal stem cells on the basis of expression of Sca-1 and PDGFR-α. Nat. Protoc. 2012;7:2103–2111. doi: 10.1038/nprot.2012.125. [DOI] [PubMed] [Google Scholar]
- 15.Holmes C., Stanford W.L. Concise Review: Stem Cell Antigen-1: Expression, Function, and Enigma. Stem Cell. 2007;25:1339–1347. doi: 10.1634/stemcells.2006-0644. [DOI] [PubMed] [Google Scholar]
- 16.Low M., Eisner C., Rossi F. Fibro/Adipogenic Progenitors (FAPs): Isolation by FACS and Culture. Methods Mol. Biol. 2017;1556:179–189. doi: 10.1007/978-1-4939-6771-1_9. [DOI] [PubMed] [Google Scholar]
- 17.Subramanian A., Tamayo P., Mootha V.K., Mukherjee S., Ebert B.L., Gillette M.A., Paulovich A., Pomeroy S.L., Golub T.R., Lander E.S., Mesirov J.P. Gene set enrichment analysis: a knowledge-based approach for interpreting genome-wide expression profiles. Proc. Natl. Acad. Sci. USA. 2005;102:15545–15550. doi: 10.1073/pnas.0506580102. [DOI] [PMC free article] [PubMed] [Google Scholar]
- 18.Reimand J., Isserlin R., Voisin V., Kucera M., Tannus-Lopes C., Rostamianfar A., Wadi L., Meyer M., Wong J., Xu C., et al. Pathway enrichment analysis and visualization of omics data using g:Profiler, GSEA, Cytoscape and EnrichmentMap. Nat. Protoc. 2019;14:482–517. doi: 10.1038/s41596-018-0103-9. [DOI] [PMC free article] [PubMed] [Google Scholar]
- 19.Shannon P., Markiel A., Ozier O., Baliga N.S., Wang J.T., Ramage D., Amin N., Schwikowski B., Ideker T. Cytoscape: a software environment for integrated models of biomolecular interaction networks. Genome Res. 2003;13:2498–2504. doi: 10.1101/gr.1239303. [DOI] [PMC free article] [PubMed] [Google Scholar]
- 20.Merico D., Isserlin R., Stueker O., Emili A., Bader G.D. Enrichment map: A network-based method for gene-set enrichment visualization and interpretation. PLoS One. 2010;5:e13984. doi: 10.1371/journal.pone.0013984. [DOI] [PMC free article] [PubMed] [Google Scholar]
- 21.Kuswanto W., Burzyn D., Panduro M., Wang K.K., Jang Y.C., Wagers A.J., Benoist C., Mathis D. Poor Repair of Skeletal Muscle in Aging Mice Reflects a Defect in Local, Interleukin-33-Dependent Accumulation of Regulatory T Cells. Immunity. 2016;44:355–367. doi: 10.1016/j.immuni.2016.01.009. [DOI] [PMC free article] [PubMed] [Google Scholar]
- 22.Han R., Frett E.M., Levy J.R., Rader E.P., Lueck J.D., Bansal D., Moore S.A., Ng R., Beltrán-Valero de Bernabé D., Faulkner J.A., Campbell K.P. Genetic ablation of complement C3 attenuates muscle pathology in dysferlin-deficient mice. J. Clin. Invest. 2010;120:4366–4374. doi: 10.1172/JCI42390. [DOI] [PMC free article] [PubMed] [Google Scholar]
- 23.McMahon M., Ye S., Izzard L., Dlugolenski D., Tripp R.A., Bean A.G.D., McCulloch D.R., Stambas J. ADAMTS5 Is a Critical Regulator of Virus-Specific T Cell Immunity. PLoS Biol. 2016;14:e1002580. doi: 10.1371/journal.pbio.1002580. [DOI] [PMC free article] [PubMed] [Google Scholar]
- 24.Buechler M.B., Pradhan R.N., Krishnamurty A.T., Cox C., Calviello A.K., Wang A.W., Yang Y.A., Tam L., Caothien R., Roose-girma M., et al. 2021. Cross-tissue Organization of the Fibroblast Lineage. [DOI] [PubMed] [Google Scholar]
- 25.Muhl L., Genové G., Leptidis S., Liu J., He L., Mocci G., Sun Y., Gustafsson S., Buyandelger B., Chivukula I.V., et al. Single-cell analysis uncovers fibroblast heterogeneity and criteria for fibroblast and mural cell identification and discrimination. Nat. Commun. 2020:1–18. doi: 10.1038/s41467-020-17740-1. [DOI] [PMC free article] [PubMed] [Google Scholar]
- 26.Hogarth M.W., Defour A., Lazarski C., Gallardo E., Diaz Manera J., Partridge T.A., Nagaraju K., Jaiswal J.K. Fibroadipogenic progenitors are responsible for muscle loss in limb girdle muscular dystrophy 2B. Nat. Commun. 2019;10:2430. doi: 10.1038/s41467-019-10438-z. [DOI] [PMC free article] [PubMed] [Google Scholar]
- 27.Alimperti S., Andreadis S.T. CDH2 and CDH11 act as regulators of stem cell fate decisions. Stem Cell Res. 2015;14:270–282. doi: 10.1016/j.scr.2015.02.002. [DOI] [PMC free article] [PubMed] [Google Scholar]
- 28.Bennett C.N., Ross S.E., Longo K.A., Bajnok L., Hemati N., Johnson K.W., Harrison S.D., MacDougald O.A. Regulation of Wnt signaling during adipogenesis. J. Biol. Chem. 2002;277:30998–31004. doi: 10.1074/jbc.M204527200. [DOI] [PubMed] [Google Scholar]
- 29.Bennett C.N., Longo K.A., Wright W.S., Suva L.J., Lane T.F., Hankenson K.D., MacDougald O.A. Regulation of osteoblastogenesis and bone mass by Wnt10b. Proc. Natl. Acad. Sci. USA. 2005;102:3324–3329. doi: 10.1073/pnas.0408742102. [DOI] [PMC free article] [PubMed] [Google Scholar]
- 30.Hayashi S., Manabe I., Suzuki Y., Relaix F., Oishi Y. Klf5 regulates muscle differentiation by directly targeting muscle-specific genes in cooperation with MyoD in mice. Elife. 2016;5:e17462. doi: 10.7554/eLife.17462. [DOI] [PMC free article] [PubMed] [Google Scholar]
- 31.Smas C.M., Chen L., Sul H.S. Cleavage of membrane-associated pref-1 generates a soluble inhibitor of adipocyte differentiation. Mol. Cell Biol. 1997;17:977–988. doi: 10.1128/mcb.17.2.977. [DOI] [PMC free article] [PubMed] [Google Scholar]
- 32.Yamamoto A., Nagano T., Takehara S., Hibi M., Aizawa S. Shisa promotes head formation through the inhibition of receptor protein maturation for the caudalizing factors, Wnt and FGF. Cell. 2005;120:223–235. doi: 10.1016/j.cell.2004.11.051. [DOI] [PubMed] [Google Scholar]
- 33.Reggio A., Rosina M., Palma A., Cerquone Perpetuini A., Petrilli L.L., Gargioli C., Fuoco C., Micarelli E., Giuliani G., Cerretani M., et al. Adipogenesis of skeletal muscle fibro/adipogenic progenitors is affected by the WNT5a/GSK3/β-catenin axis. Cell Death Differ. 2020;27:2921–2941. doi: 10.1038/s41418-020-0551-y. [DOI] [PMC free article] [PubMed] [Google Scholar]
- 34.Addinsall A.B., Forgan L.G., McRae N.L., Kelly R.W., McDonald P.L., McNeill B., McCulloch D.R., Stupka N. Treatment of Dystrophic Mdx Mice with an ADAMTS-5 Specific Monoclonal Antibody Increases the Ex Vivo Strength of Isolated Fast Twitch Hindlimb Muscles. Biomolecules. 2020;10:1–2. doi: 10.3390/biom10071053. [DOI] [PMC free article] [PubMed] [Google Scholar]
- 35.Kastenschmidt J.M., Coulis G., Farahat P.K., Pham P., Rios R., Cristal T.T., Mannaa A.H., Ayer R.E., Yahia R., Deshpande A.A., et al. A stromal progenitor and ILC2 niche promotes muscle eosinophilia and fibrosis-associated gene expression. Cell Rep. 2021;35 doi: 10.1016/j.celrep.2021.108997. [DOI] [PMC free article] [PubMed] [Google Scholar]
- 36.McKellar D.W., Walter L.D., Song L.T., Mantri M., Wang M.F.Z., De Vlaminck I., Cosgrove B.D. Large-scale integration of single-cell transcriptomic data captures transitional progenitor states in mouse skeletal muscle regeneration. Commun. Biol. 2021;4:1280. doi: 10.1038/s42003-021-02810-x. [DOI] [PMC free article] [PubMed] [Google Scholar]
- 37.Reggio A., Rosina M., Krahmer N., Palma A., Petrilli L.L., Maiolatesi G., Massacci G., Salvatori I., Valle C., Testa S., et al. Metabolic reprogramming of fibro/adipogenic progenitors facilitates muscle regeneration. Life Sci. Alliance. 2020;3 doi: 10.26508/lsa.202000660. e202000646. [DOI] [PMC free article] [PubMed] [Google Scholar]
- 38.Mázala D.A., Novak J.S., Hogarth M.W., Nearing M., Adusumalli P., Tully C.B., Habib N.F., Gordish-Dressman H., Chen Y.W., Jaiswal J.K., Partridge T.A. TGF-β-driven muscle degeneration and failed regeneration underlie disease onset in a DMD mouse model. JCI Insight. 2020;5 doi: 10.1172/jci.insight.135703. [DOI] [PMC free article] [PubMed] [Google Scholar]
- 39.Bell R.A.V., Al-Khalaf M., Megeney L.A. The beneficial role of proteolysis in skeletal muscle growth and stress adaptation. Skelet. Muscle. 2016;6:16. doi: 10.1186/s13395-016-0086-6. [DOI] [PMC free article] [PubMed] [Google Scholar]
- 40.Coenen-Stass A.M.L., Mcclorey G., Manzano R., Betts C.A., Blain A., Saleh A.F., Gait M.J., Lochmüller H., Wood M.J.A., Roberts T.C. Identification of novel, therapy-responsive protein biomarkers in a mouse model of Duchenne muscular dystrophy by aptamer-based serum proteomics. Sci. Rep. 2015;5:17014–17111. doi: 10.1038/srep17014. [DOI] [PMC free article] [PubMed] [Google Scholar]
- 41.Coles C.A., Gordon L., Hunt L.C., Webster T., Piers A.T., Kintakas C., Woodman K., Touslon S.L., Smythe G.M., White J.D., Lamandé S.R. Expression profiling in exercised mdx suggests a role for extracellular proteins in the dystrophic muscle immune response. Hum. Mol. Genet. 2020;29:353–368. doi: 10.1093/hmg/ddz266. [DOI] [PubMed] [Google Scholar]
- 42.Kintakas C., McCulloch D.R. Emerging roles for ADAMTS5 during development and disease. Matrix Biol. 2011;30:311–317. doi: 10.1016/j.matbio.2011.05.004. [DOI] [PubMed] [Google Scholar]
- 43.McRae N., Forgan L., McNeill B., Addinsall A., McCulloch D., Van Der Poel C., Stupka N. Glucocorticoids improve myogenic differentiation in vitro by suppressing the synthesis of versican, a transitional matrix protein overexpressed in dystrophic skeletal muscles. Int. J. Mol. Sci. 2017;18 doi: 10.3390/ijms18122629. [DOI] [PMC free article] [PubMed] [Google Scholar]
- 44.Schaefer L., Schaefer R.M. Proteoglycans: From structural compounds to signaling molecules. Cell Tissue Res. 2010;339:237–246. doi: 10.1007/s00441-009-0821-y. [DOI] [PubMed] [Google Scholar]
- 45.Stupka N., Kintakas C., White J.D., Fraser F.W., Hanciu M., Aramaki-Hattori N., Martin S., Coles C., Collier F., Ward A.C., et al. Versican processing by a disintegrin-like and metalloproteinase domain with thrombospondin-1 repeats proteinases-5 and-15 facilitates myoblast fusion. J. Biol. Chem. 2013;288:1907–1917. doi: 10.1074/jbc.M112.429647. [DOI] [PMC free article] [PubMed] [Google Scholar]
- 46.Hyzewicz J., Tanihata J., Kuraoka M., Nitahara-Kasahara Y., Beylier T., Ruegg U.T., Vater A., Takeda S. Low-Intensity Training and the C5a Complement Antagonist NOX-D21 Rescue the mdx Phenotype through Modulation of Inflammation. Am. J. Pathol. 2017;187:1147–1161. doi: 10.1016/j.ajpath.2016.12.019. [DOI] [PubMed] [Google Scholar]
- 47.Choudhury S.R., Babes L., Rahn J.J., Ahn B.Y., Goring K.A.R., King J.C., Lau A., Petri B., Hao X., Chojnacki A.K., et al. Dipeptidase-1 Is an Adhesion Receptor for Neutrophil Recruitment in Lungs and Liver. Cell. 2019;178:1205–1221.e17. doi: 10.1016/j.cell.2019.07.017. [DOI] [PubMed] [Google Scholar]
- 48.Kuwahara Y., Kishimoto K.N., Itoigawa Y., Okuno H., Hatta T., Matsuzawa G., Itoi E. Fatty degeneration and wnt10b expression in the supraspinatus muscle after surgical repair of torn rotator cuff tendon. J. Orthop. Surg. 2019;27 doi: 10.1177/2309499019864817. [DOI] [PubMed] [Google Scholar]
- 49.Lee K., Villena J.A., Moon Y.S., Kim K.H., Lee S., Kang C., Sul H.S. Inhibition of adipogenesis and development of glucose intolerance by soluble preadipocyte factor-1 (Pref-1) J. Clin. Invest. 2003;111:453–461. doi: 10.1172/JCI15924. [DOI] [PMC free article] [PubMed] [Google Scholar]
- 50.Smas C.M., Sul H.S. Pref-1, a protein containing EGF-like repeats, inhibits adipocyte differentiation. Cell. 1993;73:725–734. doi: 10.1016/0092-8674(93)90252-L. [DOI] [PubMed] [Google Scholar]
- 51.Oishi Y., Manabe I., Tobe K., Ohsugi M., Kubota T., Fujiu K., Maemura K., Kubota N., Kadowaki T., Nagai R. SUMOylation of Krüppel-like transcription factor 5 acts as a molecular switch in transcriptional programs of lipid metabolism involving PPAR-δ. Nat. Med. 2008;14:656–666. doi: 10.1038/nm1756. [DOI] [PubMed] [Google Scholar]
- 52.Butler A., Hoffman P., Smibert P., Papalexi E., Satija R. Integrating single-cell transcriptomic data across different conditions, technologies, and species. Nat. Biotechnol. 2018;36:411–420. doi: 10.1038/nbt.4096. [DOI] [PMC free article] [PubMed] [Google Scholar]
- 53.Stuart T., Butler A., Hoffman P., Hafemeister C., Papalexi E., Mauck W.M., Hao Y., Stoeckius M., Smibert P., Satija R. Comprehensive Integration of Single-Cell Data. Cell. 2019;177:1888–1902.e21. doi: 10.1016/j.cell.2019.05.031. [DOI] [PMC free article] [PubMed] [Google Scholar]
- 54.Hao Y., Hao S., Andersen-Nissen E., Mauck W.M., Zheng S., Butler A., Lee M.J., Wilk A.J., Darby C., Zager M., et al. Integrated analysis of multimodal single-cell data. Cell. 2021;184:3573–3587.e29. doi: 10.1016/j.cell.2021.04.048. [DOI] [PMC free article] [PubMed] [Google Scholar]
- 55.Dowle M, Srinivasan A (2023). data.table: Extension of 'data.frame'. https://r-datatable.com.
- 56.Wickham, H. (2011). Journal of Statistical Software the Split-Apply-Combine Strategy for Data Analysis.
- 57.Wickham H., François R., Henry L., Müller K., Vaughan D. 2023. dplyr: A Grammar of Data Manipulation.https://dplyr.tidyverse.org [Google Scholar]
- 58.Müller K., Wickham H. 2023. tibble: Simple Data Frames.https://tibble.tidyverse.org/ [Google Scholar]
- 59.Korsunsky I., Millard N., Fan J., Slowikowski K., Zhang F., Wei K., Baglaenko Y., Brenner M., Loh P.R., Raychaudhuri S. Fast, sensitive and accurate integration of single-cell data with Harmony. Nat. Methods. 2019;16:1289–1296. doi: 10.1038/s41592-019-0619-0. [DOI] [PMC free article] [PubMed] [Google Scholar]
- 60.Hafemeister C., Satija R. Normalization and variance stabilization of single-cell RNA-seq data using regularized negative binomial regression. Genome Biol. 2019;20:296. doi: 10.1186/s13059-019-1874-1. [DOI] [PMC free article] [PubMed] [Google Scholar]
- 61.Maechler M., Rousseeuw P., Struyf A., Hubert M., Hornik K. (2022). cluster: Cluster Analysis Basics and Extensions. R package version 2.1.4 — For new features, see the 'Changelog' file (in the package source), https://CRAN.R-project.org/package=cluster.
- 62.Kolde, et al. https://cran.r-project.org/web/packages/pheatmap/index.html
Associated Data
This section collects any data citations, data availability statements, or supplementary materials included in this article.
Supplementary Materials
Data Availability Statement
Data: Raw FASTQ and processed matrix files for the FAP scRNA-seq data of BLA/J vs. WT mouse muscle generated in by this study have been deposited to NCBI databases. All accession numbers including publicly available data used in this study (Giordani et al.12; Tabula Muris,11 Buechler et al.,24 McKellar et al.36) can be found in the key resources table. All fully processed seurat (.rds) objects can be accessed at Zenodo (DOI is listed in the key resources table).
Code: All original code has been deposited to the same Zenodo repository and is publicly available as of the date of publication. The DOI is listed in the key resources table. R scripts were written using different versions of Seurat to keep up with new features and bug fixes. The versions of each individual R library associated with the Seurat version / environment can be found in the `sessionInfo()` output at the bottom of each script.
Any additional information related to the data in this paper is available from the lead contact upon request.